Back to Journals » Nature and Science of Sleep » Volume 14
Simulated Night-Shift Schedule Disrupts the Plasma Lipidome and Reveals Early Markers of Cardiovascular Disease Risk
Authors Kyle JE ![]() , Bramer LM, Claborne D, Stratton KG, Bloodsworth KJ, Teeguarden JG, Gaddameedhi S, Metz TO
, Bramer LM, Claborne D, Stratton KG, Bloodsworth KJ, Teeguarden JG, Gaddameedhi S, Metz TO ![]() , Van Dongen HPA
, Van Dongen HPA ![]()
Received 21 February 2022
Accepted for publication 28 April 2022
Published 21 May 2022 Volume 2022:14 Pages 981—994
DOI https://doi.org/10.2147/NSS.S363437
Checked for plagiarism Yes
Review by Single anonymous peer review
Peer reviewer comments 2
Editor who approved publication: Prof. Dr. Ahmed BaHammam
Jennifer E Kyle,1 Lisa M Bramer,1 Daniel Claborne,2 Kelly G Stratton,1 Kent J Bloodsworth,1 Justin G Teeguarden,1,3 Shobhan Gaddameedhi,4 Thomas O Metz,1 Hans PA Van Dongen5,6
1Biological Sciences Division, Earth and Biological Sciences Directorate, Pacific Northwest National Laboratory (PNNL), Richland, WA, 99352, USA; 2Computing and Analytics Division, National Security Directorate, PNNL, Richland, WA, 99352, USA; 3Department of Environmental and Molecular Toxicology, Oregon State University, Corvallis, OR, 97331, USA; 4Department of Biological Sciences and Center for Human Health and the Environment, North Carolina State University, Raleigh, NC, 27695, USA; 5Sleep and Performance Research Center, Washington State University, Spokane, WA, 99202, USA; 6Elson S. Floyd College of Medicine, Washington State University, Spokane, WA, 99202, USA
Correspondence: Jennifer E Kyle, Pacific Northwest National Laboratory, PO Box 999, MSIN: K8-98, Richland, WA, 99352, USA, Tel +1-509-375-3679, Fax +1-509-371-6564, Email [email protected]
Introduction: The circadian system coordinates daily rhythms in lipid metabolism, storage and utilization. Disruptions of internal circadian rhythms due to altered sleep/wake schedules, such as in night-shift work, have been implicated in increased risk of cardiovascular disease and metabolic disorders. To determine the impact of a night-shift schedule on the human blood plasma lipidome, an in-laboratory simulated shift work study was conducted.
Methods: Fourteen healthy young adults were assigned to 3 days of either a simulated day or night-shift schedule, followed by a 24-h constant routine protocol with fixed environmental conditions, hourly isocaloric snacks, and constant wakefulness to investigate endogenous circadian rhythms. Blood plasma samples collected at 3-h intervals were subjected to untargeted lipidomics analysis.
Results: More than 400 lipids were identified and quantified across 21 subclasses. Focusing on lipids with low between-subject variation per shift condition, alterations in the circulating plasma lipidome revealed generally increased mean triglyceride levels and decreased mean phospholipid levels after night-shift relative to day-shift. The circadian rhythms of triglycerides containing odd chain fatty acids peaked earlier during constant routine after night-shift. Regardless of shift condition, triglycerides tended to either peak or be depleted at 16:30 h, with chain-specific differences associated with the direction of change.
Discussion: The simulated night-shift schedule was associated with altered temporal patterns in the lipidome. This may be premorbid to the elevated cardiovascular risk that has been found epidemiologically in night-shift workers.
Keywords: lipidomics, mass spectrometry, circadian disruption, working time arrangements, cardiovascular health, triglycerides
Corrigendum for this paper has been published.
Introduction
Circadian control at the system level coordinates behavioral patterns such as sleep-wake and feeding-fasting cycles.1 The mammalian circadian clock originates from the central pacemaker in the hypothalamic suprachiasmatic nuclei (SCN), where it receives light signals from the environment synchronizing it to 24 h light/dark cycles.2 The SCN send signals via neural and hormonal cues to peripheral clocks throughout the body that regulate physiologic processes. These peripheral clocks are tightly linked to metabolism, enabling physiological adjustments of metabolic needs.3 Challenges to this interplay due to altered behavioral cycles, such as in night-shift work, can cause circadian disruption resulting in metabolic misalignment and increased risk of multiple metabolic diseases including cardiovascular disease (CVD).4,5 Research has shown that negative health impacts of circadian disruption can occur years after altered behavioral cycles.6 As such, long-term night-shift workers are at elevated risk of developing several of the most common chronic diseases.7
Lipids are important biomolecules implicated as contributing factors in many diseases, including those associated with circadian disruption. Studies have demonstrated that regardless of the type of external stressor to circadian rhythms (eg, light/dark, fed/fasted), triglyceride (TG) metabolism is commonly altered.8–12 Specific to studies examining shift work as inducer of altered circadian rhythms, lipidomics analyses have identified changes to various additional types of lipids, including phosphatidylcholine (PC) and ether-based phospholipids, as well as differences in the fatty acid compositions of TGs and phospholipids.9,10,13,14
In a recent simulated shift work study, Skene and colleagues used a limited, targeted panel of 184 molecules (including 145 lipids) to examine changes in the metabolome and lipidome induced by a 12-h shifted sleep/wake and feeding/fasting cycle in individuals subjected to 3 days of a simulated day- or night-shift schedule.14 During a subsequent 24-h constant routine protocol designed to investigate endogenous circadian rhythms in the absence of any externally imposed rhythms,15 many of the metabolites and lipids reversed (43%) or lost (14%) their rhythm after the night-shift schedule, or only showed rhythmicity after the night-shift schedule but not after the day-shift schedule (14%) – even though the timing of the central SCN pacemaker, as measured by dim light melatonin onset (DLMO), was not significantly different between the two conditions at baseline, remained stable after the 3 days of day-shift schedule, and was merely delayed by less than 2 h after the 3 days of night-shift schedule.14,16
Building on the observations by Skene and colleagues,14 we performed comprehensive lipidomics analyses of the same cohort to more broadly investigate the effects of simulated shift work on the lipidome and to also quantify detailed changes in the lipid acyl compositions, which have known roles in metabolic diseases.17–19 Here, we report an in-depth analysis of the plasma lipidome from individuals measured under constant routine – 24 h of constant environmental conditions, hourly isocaloric snacks, and sustained wakefulness, under strictly controlled circumstances – after undergoing a simulated night- or day-shift schedule. We show that just 3 days of the simulated night-shift schedule resulted in endogenous molecular profiles consistent with elevated CVD risk.
Materials and Methods
Subjects
N=14 healthy volunteers (ages 22–34 y, BMI 25.7 ± 3.2 kg/m2) participated in this study (see Table 1), as previously reported by Skene and colleagues.14
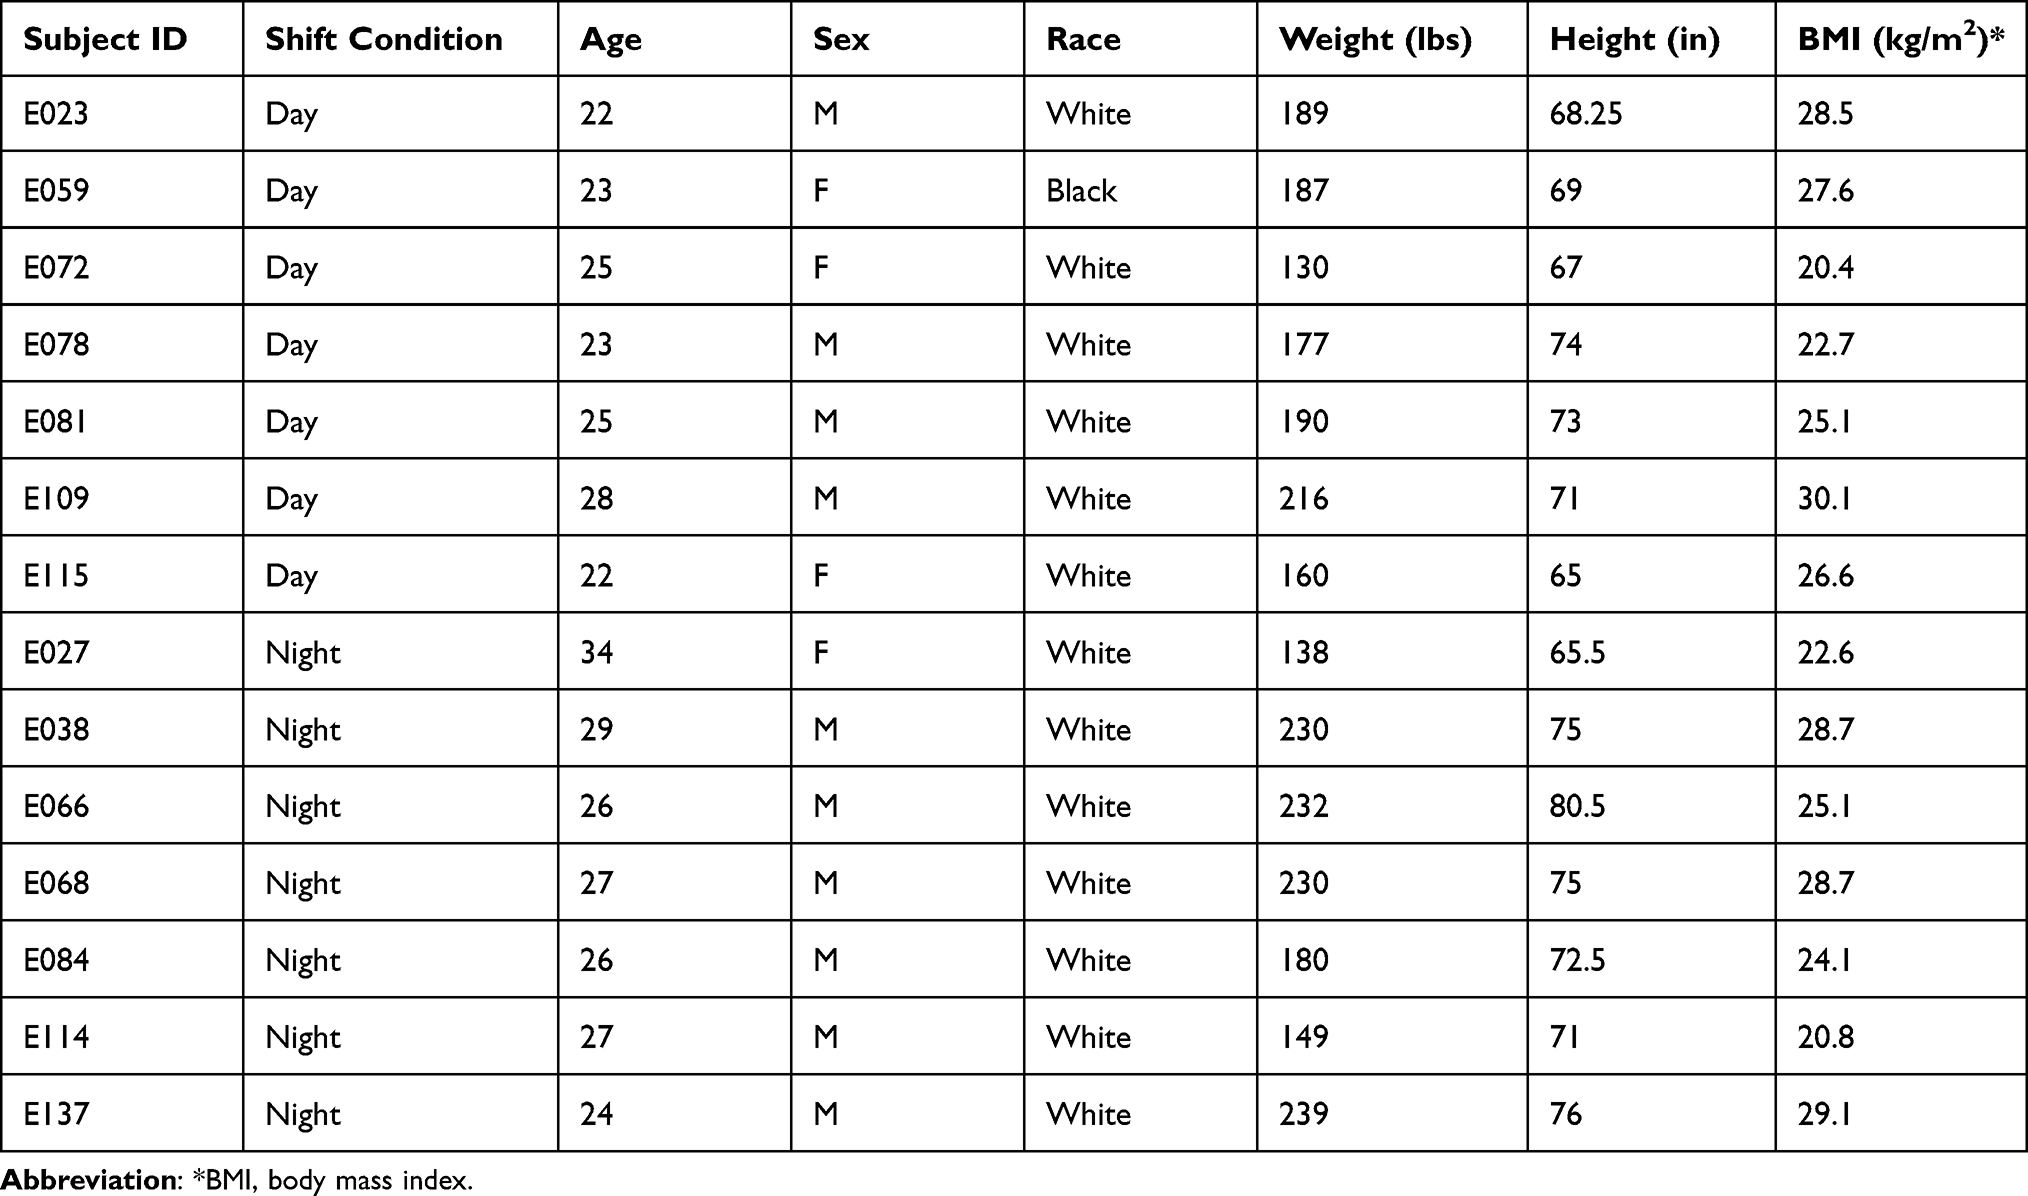 |
Table 1 Subject Demographics |
Subjects were screened to be physically and psychologically healthy with no medical or drug treatment, as verified by physical examination, blood chemistry, urinalysis, and questionnaires.14 They reported good habitual sleep, between 6 and 10 h in duration and habitually getting up between 06:00 h and 09:00 h, and were no extreme morning- or evening-types as assessed by questionnaire (Composite Scale of Morningness). They showed no evidence of any sleep or circadian disorders as assessed by nocturnal polysomnography and validated questionnaires. They had no history of drug or alcohol abuse, were free of traces of alcohol and drugs as assessed by drug screen and breathalyzer and did not smoke. They were not involved in shift work within three months of entering the study and did not travel across time zones within one month of entering the study. Women were not pregnant as assessed by blood-based assay.
Participants maintained a regular sleep/wake schedule in the week prior to the in-laboratory experiment, with bedtimes and wake times within 30 min from their self-reported habitual schedule.20 In the week prior to the study, participants were requested to abstain from alcohol and caffeine.
The study was conducted in compliance with the Declaration of Helsinki and approved by the Institutional Review Boards of Washington State University and Pacific Northwest National Laboratory. Participants gave written informed consent. They had to meet defined inclusion criteria to participate in the study.
In-Laboratory Experiment and Sample Collection
The 7-d in-laboratory experiment (Figure 1) was conducted under controlled conditions (constant ambient temperature of 21 ± 1 °C, constant light level of less than 50 lx during all scheduled wakefulness periods) in the Sleep and Performance Research Center at Washington State University Health Sciences Spokane. The study consisted of a baseline day and night followed by randomization to either a 3-d simulated day-shift schedule (sleep opportunity: 22:00–06:00 h) or, after a transition nap (sleep opportunity: 14:00–18:00 h), to a 3-d simulated night-shift schedule (sleep opportunity: 10:00–18:00 h). During the simulated shift days, breakfast, lunch, and dinner were provided at 1.5, 7.0, and 13.5 h of scheduled wakefulness, respectively.
 |
Figure 1 Study design. Participants were on a simulated day-shift (top) or night-shift (bottom) schedule for 3 days (yellow = scheduled wake, black = sleep opportunity), then underwent a 24-h period of wakefulness under constant routine conditions (red), during which blood plasma was collected every 3 h. Clock time is indicated above. Abbreviation: M, meal. |
Importantly, in both conditions, the 3-d simulated shift schedule was followed by a 24-h constant routine protocol involving controlled environmental conditions with fixed semi recumbent posture, hourly isocaloric snacks (Snack ingredients, option 1: peanuts, caramel [dried can syrup, tapioca syrup, water, fractionated palm kernel oil, nonfat milk, whey protein concentrate, glycerin, butter (cream, salt) natural flavor, sunflower lecithin, salt, sodium citrate, carrageenan], rolled oats, almonds, flaxseed, cashews, dates, tapioca syrup, natural flavor, chicory root fiber, sea salt, water, sunflower oil; option 2: peanuts, brown rice syrup, almonds, rolled oats, dried cranberries, pineapple juice syrup, raisins, tapioca syrup, dried cane syrup, dried blueberries, chicory root fiber, apple juice concentrate, coconut oil, hemp seeds, flaxseeds, salt, water, natural flavor, sunflower oil, pineapple juice concentrate), and sustained wakefulness to investigate rhythms free of exogenous factors. During the 24-h constant routine protocol, blood was drawn at 3-h intervals to measure plasma lipid profiles. The study concluded with a recovery day. The study design was previously published.14
Total Lipid Extraction
Total lipid extracts (TLEs) were generated from 50 μL of plasma from the blood samples collected during the 24-h constant routine protocol. Prior to extraction, 10 μL of internal standards (SPLASH™ Lipidomix®, Avanti Polar Lipids, Inc.) was added to each sample. Lipids were extracted using a modified Folch extraction MPLEx.21,22 Briefly, cold (−20°C) chloroform/methanol (2:1, v/v) was added in a 4-fold excess to the sample volume. Samples were vortexed for 10s, incubated on ice for 5 min, and then vortexed again for 10s. The samples were then centrifuged to facilitate separation of hydrophilic and hydrophobic layers and protein pellets, and the bottom hydrophobic layers containing lipids were transferred into glass autosampler vials, evaporated to dryness in vacuo, and stored at −20°C in 500 μL of chloroform/methanol (2:1, v/v) until analysis.
NIST SRM 1950 plasma was used as a quality control (QC) sample and processed along with the study participants’ samples.23 Randomization orders were created for both sample processing and mass spectrometry analysis (Dataset 1). Samples were randomized based on ethnicity, age, sex, shift condition, and sample collection time.
Mass Spectrometry Analysis
Stored plasma TLEs were again dried in vacuo and reconstituted in 10 μL chloroform and brought to 200 μL with methanol containing post-extraction internal standards (PE(17:0/14:1) and PI(17:0/14:1) at a final amount of 0.05 μg and 0.01 μg, respectively). TLEs were analyzed as previously described.24 Briefly, a Waters Acquity UPLC H class system interfaced with a Velos-ETD Orbitrap mass spectrometer was used for liquid chromatography tandem mass spectrometry (LC-MS/MS) analyses. 10 μL of reconstituted sample was injected onto a Waters CSH column (3.0 mm × 150 mm × 1.7 μm particle size) and separated over a 34-min gradient (mobile phase A: ACN/H2O (40:60) containing 10 mM ammonium acetate; mobile phase B: ACN/IPA (10:90) containing 10 mM ammonium acetate) at a flow rate of 250 μL/min. Samples were randomized prior to MS run analysis (Dataset 1). TLEs were analyzed in both positive and negative electrospray ionization modes, and lipids were fragmented using alternating higher-energy collision dissociation (HCD) and collision-induced dissociation (CID). Lipids were identified using LIQUID (Lipid Quantification and Identification), where each lipid was identified by matching experimental tandem mass (MS/MS) spectra to predicted values along with evaluating the precursor mass ppm error, isotopic profile, and retention time.24
Lipid Identification
Lipids were identified using LIQUID.24 Confident identifications were made by manually evaluating the MS/MS spectra for fragment ions characteristic of the classes and acyl chain compositions of the identified lipids. In addition, the precursor ion isotopic profile, extracted ion chromatogram, and mass measurement error along with the elution time were evaluated. A reference library of confident lipid identifications was generated using data from 7 individuals plus the QC sample. The 7 individuals selected varied per collection time (each time point represented), shift condition (3 night shift, 4 day shift), and sex (5 males, 2 females). All LC-MS/MS data were aligned and gap-filled to this target library for feature identification using MZmine 2,25 based on the identified lipid name, observed m/z, and retention time. Data from each ionization mode were aligned and gap-filled separately. Aligned features were manually verified and peak apex intensity values were exported for statistical analysis.
Data Preprocessing
LC-MS/MS-based lipidomics data were generated for the 14 participants at each of the 8 time points, for a total of 112 analyses. Negative and positive mode data were preprocessed separately as follows. All observed abundances were first transformed to log2 scale. A robust Mahalanobis distance analysis was then performed, based on lipid abundance vectors,26 in order to identify outliers. Two samples were then identified as outliers (p<0.0001) and removed from the dataset. Finally, median normalization was applied to the data.
Statistical Analysis
Cosinor analysis27 was applied to all samples collected during the 24-h constant routine protocol to investigate 24-h rhythmicity for each lipid. A mixed-effects regression model of normalized log2 lipid abundance was implemented in R.28 Shift condition, sinusoid time components with 24-h fundamental period, 12-h first harmonic, and 8-h second harmonic, and the interactions of shift condition with the sinusoid time components were included as fixed effects in the model; a random effect over individuals was placed on the intercept. For fitting purposes, the linear equivalent (exact transformation) of the model was used, as previously described.29
The 24-h rhythm was of primary concern for this study, and estimates for mesor (mean normalized log2 abundance), rhythm amplitude, and acrophase (peak timing) of the 24-h sinusoid were of particular interest. Statistical significance of rhythmicity was evaluated with one-sided t-test of the amplitude of the 24-h sinusoid with a Benjamini–Hochberg procedure applied for multiple test correction. To evaluate the consistency of abundance patterns across individuals, for each lipid the log of the signal-to-noise ratio, logSNR, was calculated based on the variance explained by the regression model and the error variance,30 for each study condition separately as well as across the two conditions combined.
A lipid with logSNR>0 was deemed to have a consistent temporal pattern across individuals (Figure 2).
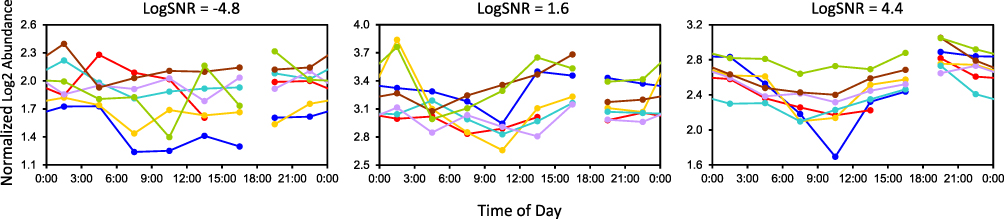 |
Figure 2 Illustration of logSNR values differentiating 3 example lipids in the simulated night-shift condition. Each curve corresponds to one individual’s data plotted over the 24 h of the sample collection period. Left: Cer(d18:1_24:0) has an inconsistent pattern between individuals, as reflected in logSNR<0. Middle and right: CE(18:2) and especially PC(0:0_18:1)_B have more consistent patterns between individuals, with higher logSNR>0. Break in curves indicates where the constant routine began/ended. Abbreviations: Cer, ceramide; CE, cholesterol ester; LPC, monoacylglycerophosphocholine. |
To detect any non-specific effect of time awake independent of study condition, the regression analysis was repeated with the addition of a fixed regression term linear in time awake. The regression coefficient for this linear component was tested against zero with two-sided t-test using Benjamini–Hochberg adjusted p-value.
To determine the enrichment of statistically significant lipids, an EASE score31 enrichment test was conducted using Lipid Mini-On.32 Lipid Mini-On performs enrichment analyses of lipidomics data using a text-mining process that bins individual lipid names into multiple lipid ontology groups based on the classification and other characteristics, such as chain length and number of double bonds. Enrichment analysis was conducted separately for lipids that increased and decreased per circadian metric (ie, mesor, amplitude). The “universe” for this analysis consisted of all lipids identified (see Dataset 2).
Results
In a between-groups, in-laboratory study, we characterized the circadian rhythms of lipids in human blood plasma after behaviorally induced rhythms were experimentally misaligned (night-shift condition) or aligned (day-shift condition) relative to the central pacemaker in the SCN. Subjects were assigned to a 3-day simulated night-shift schedule or day-shift (ie, control) schedule (Table 1). In each condition, this was followed by a 24-h constant routine protocol, during which blood was drawn at 3-h intervals to measure plasma lipid profiles (Figure 1). Using LC-MS/MS, a total of 405 lipids were identified and quantified over 374 LC-MS/MS features, covering 21 subclasses (Dataset 2).
Investigation of the circadian rhythm in each lipid by means of cosinor-based regression analysis (Figure 3A) revealed that many of the lipids showed high levels of between-subject variation. We focused on the subset of lipids that had relatively consistent patterns of abundance across individuals based on the log of the signal-to-noise ratio (logSNR), using the cut-off logSNR>0 (ie, at least as much signal as noise in the regression model) (Figure 2). Of the 374 lipids thus identified, 92 (24.5%) had logSNR>0 in the day-shift condition, 126 (33.7%) in the night-shift condition, and 79 (21.1%) in both conditions (Figure 3B).
 |
Figure 3 Overview of circadian rhythm metrics and analyses for the simulated shift work lipidome. (A) Illustration of 24-h rhythm in our cosinor-based regression analysis and the variables used to describe the circadian rhythm. (B) Overview of the number of lipids with a statistically significant difference (p<0.05) in mesor for the night-shift condition relative to the day-shift condition; and with significant circadian rhythmicity (amplitude greater than zero, p<0.05) in the day-shift only, night-shift only, and both day- and night-shift conditions. Only lipids with logSNR>0 were considered. |
The 79 lipids with logSNR>0 in both the day- and night-shift conditions comprised primarily TGs but also monoacylglycerophospholipids (LPLs), mostly LPCs with an 18 carbon chain, as well as lipids containing monounsaturated fatty acids (MUFAs), in particular 18:1 (likely oleic acid). Lipids that had logSNR>0 only in the day-shift condition were dominated by LPCs and TGs (13 lipids); whereas those with logSNR>0 only in the night-shift condition contained lipids with 18:2 (likely linoleic acid), mostly associated with PCs, TGs with 18:3 (likely linolenic acid), sphingomyelin (SM), and some ether linked phosphatidylcholines (PCO) (Dataset 3).
We report effects of the simulated night-shift schedule, as compared to the simulated day-shift schedule, in the context of three quantitative characteristics of circadian rhythmicity derived from the 24-h sinusoid in our regression analysis: mesor (midline of rhythm, or mean abundance across the 24-h cycle), acrophase (clock time of rhythm peak), and amplitude (difference between peak and mean abundance) (Figure 3A). Because the blood samples were taken during the 24-h constant routine protocol immediately after the 3 days on the simulated night- or day-shift schedule, the observed effects reflect night-shift schedule-induced changes in the endogenous circadian rhythmicity of the human lipidome. To account for effects of time awake independent of shift condition, we performed additional analysis with inclusion of a linear regression term for the time a participant was awake. A majority of lipid model fits (94.7%) were not improved by the inclusion of the time awake variable (Dataset 4); thus, time awake was not included in the final lipid models.
Alterations in Mean Abundance Induced by the Simulated Night-Shift Schedule
Of the 79 lipids with logSNR>0 in both the day- and night-shift conditions, 45 also had a statistically significant difference between the night-shift and the day-shift in mean abundance (mesor) across the circadian cycle. The mesor was significantly lower (adjusted p<0.05) after the night-shift condition, compared to the day-shift condition, for 32 (71%) out of 45 lipids, and significantly higher for 13 (29%) (Figures 3B and 4A).
 |
Figure 4 Changes in circadian rhythmicity in the plasma lipidome due to a simulated night-shift schedule. (A) Difference in mesor after night-shift compared to day-shift by lipid. Within each subclass, lipids are organized by increasing number of total chain carbons, then by double bonds. Lipids that have greater mean abundance after the night-shift compared to the day-shift are color coded pink, and lipids that have less mean abundance after the night-shift are color coded green. Asterisks indicate statistical significance (p<0.05). Diff = difference as night-shift minus night-shift day-shift. Scale bar, pink = +1, white = 0, green = −1, with values representing difference in log2 normalized abundances. (B) Statistically significant (p<0.05) difference in amplitude after night-shift compared to day-shift by lipid. Lipids that are more rhythmic have a higher value of the difference (Diff) value, where Diff = difference as night-shift minus day-shift. Color scale, pink = more rhythmic after night-shift, green = less rhythmic after night-shift, with values representing difference in log2 normalized abundances. (C) Lipids that were significantly phase advanced or delayed after simulated night-shift compared to simulated day-shift. TGs containing an odd chained fatty acid almost exclusively advanced. Abbreviations: CE, cholesterol ester; DG, diacylglyceride; PC, glycerophosphocholine (mono- and di-acyl; O-ether linked); PE, glycerophosphoethanolamine (mono- and di-acyl); PI, diacylglycerophosphoinositol; TG, triacylglyceride. |
To determine the enrichment of lipids with statistically significant mesor, an EASE score enrichment test31 was conducted using Lipid Mini-On.32 Lipid Mini-On performs enrichment analyses of lipidomics data using a text-mining process that bins individual lipid names into multiple lipid ontology groups based on the classification and other characteristics, such as chain length and number of double bonds. Lipids with decreased abundance after night-shift were enriched in phospholipids (27 out of 32, p=0.013), in particular LPC (19 total, p=0.007), as well as lipids containing the fatty acid 18:2 (likely linoleic acid; p=0.014) and 18:1 (likely oleic acid; p=0.001) (Dataset 5). Lipids containing fatty acid 18:1 were commonly associated with PE lipids (p=0.011). Lipids with increased abundance after the night-shift were all glycerolipids and enriched in TGs (11 out of 13; p<0.001), many of which contained odd chained fatty acids (Dataset 5). Although not statistically significantly enriched, TGs containing 22:6 fatty acids (likely docosahexaenoic acid; DHA) had increased abundance after the night-shift schedule (p=0.052).
Alterations in Circadian Amplitude Induced by the Simulated Night-Shift Schedule
Almost all lipids with consistent temporal patterns of abundance (logSNR>0 in both day- and night-shift conditions) were significantly rhythmic based on the amplitude of the 24-h rhythm in the regression model (adjusted p<0.05) (Figure 3B). Of the 79 lipids with consistent temporal patterns of abundance in both conditions (Dataset 3), 77 had significant circadian amplitude after both simulated shift schedules and 2 after the night-shift schedule only. An additional 13 lipids had consistent temporal patterns and significant circadian amplitude after the day-shift schedule only (Dataset 6), and an additional 49 after the night-shift schedule only (Dataset 7). Twenty-five lipids had significantly different amplitude between the two conditions (Dataset 8), with 19 showing increased amplitude and 6 showing decreased amplitude after the night-shift (Figure 4B).
Distinct changes were noted in the 24-h rhythm amplitude of lipid rhythmicity, with TGs strongly affected. Twenty-two TGs displayed significantly different amplitude after night-shift compared to day-shift (Figure 4B, Dataset 8). Lipids that had greater amplitude after the day-shift were saturated TGs, specifically TGs containing 16:0 fatty acids (ie, palmitic acid); whereas lipids that had greater amplitude after the night-shift were TGs that contained 22:0 fatty acids, as well as MUFAs, such as 18:1 (Datasets 6, 7, 9).
Examining all lipids (regardless of direction of change) that were significantly rhythmic after day-shift with the EASE score enrichment test, lipids containing long chain fatty acids (LCFAs; defined as chain length of 13–21 carbons) were enriched, in particular lipids with 14:0 and 16:0 fatty acids. Lipids that were significantly rhythmic after night-shift were enriched in 18:2 fatty acids and the glycerophospholipids PC and PE (both mono- and diacyl) containing 18:1 (Datasets 6, 9). Lipids that were significantly rhythmic only after the night-shift schedule were enriched in PCs with 18:2 fatty acids and TGs containing 18:3 fatty acids (Datasets 7, 9).
Alterations in Acrophase Induced by the Simulated Night-Shift Schedule
Twenty-five of the 77 lipids that were identified as significantly rhythmic in both day- and night-shift conditions had alterations in the acrophase (timing of peak abundance) of the 24-h rhythm after the simulated night schedule, as compared to after the simulated day schedule (Figure 4C, Dataset 10). All of 14 TGs peaked in the middle of the day in both conditions, but 13 showed a phase advance after the night-shift schedule (ie, peaked earlier in time compared to after the day-shift), with 8 out of these 13 containing an odd chained fatty acid (Figure 4C, Dataset 10). LPCs were also phase advanced after the night-shift schedule. One similar type of lipid, known as lyso-PAF (platelet activating factor), PC(O-18:1_0:0) was almost completely reversed.
Triglyceride Dynamics at 16:30 h Independent of Simulated Shift Schedule
TGs tended to peak or dip (ie, be depleted) at 16:30 h regardless of the preceding simulated shift schedule (Figure 5). Those that peaked were significantly enriched in saturated fatty acids (p=0.001), including 16:0 (p=0.001). Those that dipped were not significantly enriched in any lipid classifiers, but many of these lipids contained VLCFAs and 18:1 fatty acids.
 |
Figure 5 Example time series of TGs that peaked or dipped at 16:30 h regardless of shift condition. Plots on the left are from the day-shift, and plots on the right are from the night-shift. Each curve corresponds to an individual’s data plotted against clock time. TGs that were elevated at 16:30 h consisted of saturated fatty acids, 16:0 in particular (top). TGs that were depleted at 16:30 h tended to contain VLCFAs and 18:1 (bottom). Break in curve indicates where the constant routine began/ended. |
Discussion
Circadian disruption is linked to dysregulation of lipid metabolism and homeostasis.9–11,14 With our lipidome analysis, we gained insights into how the temporal dynamics of lipids are influenced by night-shift work. We also expanded upon the lipidomics/metabolomics analysis of the same samples and study population as in Skene et al (2018).14 While our results cannot be directly compared to those of Skene and colleagues because of the expanded coverage of the lipidome (ie, Skene et al used a targeted lipid panel consisting of choline-containing lipid and fatty acids), we found general agreement in the misalignment and disruptions of circadian rhythmicity of the LPC subclass due to the simulated night shift schedule.
In the current study, despite high inter-individual variability, which has also been observed in other studies,10,13 we identified lipid signatures consistent with increased CVD risk after just 3 days on a simulated night-shift schedule. Our study revealed profound disturbances in the circadian rhythmicity of the human lipidome that persisted after exposure to a simulated night-shift schedule, indicating that the observed effects were not mere responses to the altered timing of behavioral cycles but rather indicative of dysregulation of the endogenous rhythms of the biological processes in which these lipids are involved and the cells and organs that produce them. Our discovery of very early alterations in lipids known to be associated with long-term health effects of shift work that typically manifest clinically only months to years later6,33 creates opportunities for early diagnosis, development of biomarkers, and early intervention to reduce health impacts.
Our simulated shift work study was limited in that it had a between-subjects study design and a relatively small sample size for which the distribution of males and females was not balanced between groups. This may have constrained our ability to detect and interpret group differences in overall abundance levels of the lipidome. Owing to the use of powerful mixed-effects regression techniques, though, sample size was not a major limitation with regard to the detection of group differences in temporal dynamics. It is noteworthy that we found widespread group differences in the lipidome after just 3 days on a simulated night- versus day-shift schedule, indicating fast reactivity of lipid metabolism to circadian disturbance. However, our study was not designed to reveal any adaptive or maladaptive mechanisms that may cause further change in the lipidome after long-term exposure to a night-shift schedule. Furthermore, workers in actual night-shift operations, as compared to day-shift operations, are exposed to various other factors that may affect lipid metabolism, including changes in the environment (eg, light exposure) and behavior (eg, food intake). In our study, such factors were standardized, but they would be expected to play a noticeable role with regard to the impact of shift work schedules in real-world settings. This may also include differential effects of shift work on other aspects of metabolism and downstream consequences thereof, such as increased prevalence of obesity and diabetes and a variety of other medical conditions,34–40 which may interact with the lipidome and contribute further to CVD risk.
Our study did not measure CVD outcomes or evaluate long-term CVD risk. Nonetheless, there are specific connections of our observations with CVD and CVD risk (Figure 6). Saturated fatty acids, in particular 12:0 (lauric acid), 14:0 (myristic acid) and 16:0 (palmitic acid), are known to be associated with elevated CVD risk, as these fatty acids raise low-density lipoprotein cholesterol (LDL-C) levels.41 In our study, TGs containing saturated fatty acids, including 16:0 and 14:0, showed dampened circadian rhythms after the night-shift condition as compared to the day-shift condition. The rhythmic regulation of these fatty acids may be important for cardiovascular function, and a dampening of their rhythms due to night-shift work may ultimately have consequences for human health.
 |
Figure 6 Summary of changes in the endogenous circadian profiles of the lipidome induced by a simulated night-shift schedule. The arrows indicate direction of change for specific lipids, with additional specificity noted at the end of the arrow, if applicable. Asterisks (*) indicate lipid changes consistent with CVD and/or CVD risk. |
Further, blood plasma lipidomic profiles have recently been shown to be predictive of cardiovascular events. It has been reported that LPCs have a negative association with cardiovascular death, as do TGs containing 18:2.42 In our study, we found that in addition to TGs, 18:2 associated lipids decreased (ie, significantly lower mesor) in multiple lipid subclasses after the simulated night-shift condition (Figures 4A and 6), suggesting a connection with CVD risk. The decrease in abundance of 18:2 lipids could be due to several factors, one of which is related to diet – 18:2, as linoleic acid, is the most common PUFA in the human diet.43 However, given that food intake was standardized (hourly isocaloric snacks) during the 24-h constant routine protocol when the blood samples used for lipidomics were taken, and dietary options were limited during the preceding simulated shift days, we would expect no substantive difference in 18:2 consumption between the shift conditions. LPCs were also statistically decreased (Figures 4A and 6); however, these lipids have been shown to have mixed associations with CVD.44
It has also been reported that DG and TG lipids containing saturated fatty acids and MUFA have either no association or a positive association with cardiovascular death, except for DG(16:1/16:1) and TG(16:1/16:1/16:1), both of which have a negative association.42 The exception of DG(16:1/16:1) and TG(16:1/16:1/16:1) may be caused by downregulation of stearoyl-CoA desaturase 1 (SCD1), resulting in associated cardiovascular death, as palmitoleic acid (16:1n-7) is a major product of SCD1. Although we did not observe any significant differences in enrichment with 16:1 containing lipids in our comparisons between day- and night-shift schedules (Datasets S4-S9), 18:1 was significantly decreased in multiple lipid subclasses after the night-shift schedule (Datasets S6, S8). As SCD1 also converts 18:0 (stearic acid) to 18:1 (likely oleic acid), and 18:1 decreased in multiple lipid subclasses after night-shift in our study, this is consistent with downregulation of SCD1.
In addition to the roles of SCD1 in desaturating palmitic acid and stearic acid, SCD1 has recently been shown to desaturate odd chained fatty acids (OCFAs).45 In our study, OCFAs containing TGs (eg, 15:0 and 17:0) were phase advanced after simulated night-shift, with many also increasing in abundance. The OCFA-containing TGs (OCFA-TGs) identified in our study could be linear fatty acid chains (eg, 17:0) and/or branched chained fatty acids (BCFAs) (ie, a linear C16 chain with a methyl branch, eg, iso-17:0), as they have the same mass to charge fragments in the mass spectrometer. OCFAs have recently been found to be positively associated with the development of CVD,42 and have been reported to be a predictor of developing type 2 diabetes (T2D) when the OCFAs 19:1 and 17:0 were associated with PC lipids;46 T2D commonly coincides with CVD.47 Why the OCFAs would be almost exclusively advanced after simulated night-shift is unclear, and we do not know the source of the OCFAs in our study. They could be coming from diet (eg, milk products in the isocaloric snacks consumed hourly during the constant routine; see Supplementary Information), remnants from the previous days’ meals,48,49 generated de novo from BCAAs50,51 as identified previously,14 formed from the elongation or desaturation of other fatty acids,45,52 or possibly from the human microbiome.
Investigation of the fatty acid composition of TGs also revealed an unexpected finding: saturated TGs, including those with 16:0, increased in the 16:30 h sample in the blood plasma, regardless of the prior simulated shift condition and the number of hours awake during the constant routine. Likewise, TGs with VLCFAs and 18:1 decreased precipitously at that same time of day, regardless of experimental condition or time awake (Figure 5). The only reasonable explanation for this finding, given the many controls of the study, is that this effect may be mediated by the central pacemaker in the SCN, which was only delayed by about 1.5 h after the night-shift condition compared to the day-shift condition.
Previous research has shown that total TGs increase around 16:30 h53,54 and can be impacted by circadian regulation.55,56 However, the opposing change in abundance based on TG fatty acid composition has not been reported previously and the biological meaning is unclear. The literature does not readily reveal why, as many studies are based on free fatty acids or fatty acids that are shorter chained (eg, C14, C16, C18) or examine total TG abundance. Given TGs are packaged in lipoproteins, one possible explanation for these opposing TG abundances is that the TGs are from different lipoproteins. TGs transported in the blood are packed into chylomicrons (CM) produced from the intestine (and reflecting dietary lipid consumption) and very low-density lipoproteins (VLDL) produced from the liver. Most CM are released into the blood stream about 3–4 h postprandial and VLDLs are released 4–6 h postprandial.48 Given that participants were on a similar diet, but time-shifted by 12 h depending on study condition for 3 days, and blood was collected subsequently during constant routine with hourly, small isocaloric snacks, postprandial TGs cannot explain this difference. As such, we hypothesize that the increase in TGs at 16:30 h may be more reflective of TGs in VLDL from the liver. Previous work has found that TG and VLDL abundance is under circadian regulation56 and that TG and liver proteins show endogenous circadian rhythms that shift in response to combined light and food stimuli.57 Identifying the mechanism controlling the divergent pattern at 16:30 h is beyond the scope of this study, but circadian regulation of genes or proteins associated with lipid metabolism within the liver may be responsible.55,58,59
By expanding lipid profiling significantly beyond more common total TG abundance, we demonstrated that deep lipidome coverage can improve the identification of clinically predictive markers of CVD risk, in particular by accounting for the detailed fatty acid chemistries of individual TG lipids. For example, based on a clinical blood lipid panel, it has been reported53 that the temporal dynamics of total TGs within a 24-h cycle influence cardiovascular risk assessment. This finding is of particular importance due to single-point sample collection and measurement that is commonly conducted in clinical labs. Our study similarly highlights how circadian disruption within a 24-h altered sleep cycles can alter TG dynamics beyond that of total TG abundance, showing that individual TGs with different fatty acid compositions display distinct and contrasting circadian dynamics (Figures 4–6). Future studies that can combine and connect the information obtained from lipidomics analyses with clinical lipid-based lipoprotein panel results will accelerate our power to discover biomarkers and the mechanisms associated with the short- and long-term health impacts of shift work.60
Conclusion
The findings of this simulated shift work study suggest that blood plasma lipid signatures of CVD risk occur within just 3 days on a night-shift schedule. In addition, our findings provide evidence that TG metabolism is not solely determined by external environmental factors or behaviors. Our lipidomics approach included the examination of multiple metrics to evaluate rhythm characteristics, including mesor, amplitude, and acrophase, which revealed several connections with known lipid-based CVD risk signatures. Our findings highlight that as TGs with different fatty acid compositions (eg, containing 16:0 fatty acids or OCFAs) exhibit different circadian dynamics, a more comprehensive TG clinical profiling that can identify the cause of altered TG dynamics may improve CVD risk assessment.
Data Sharing Statement
All mass spectrometry datasets have been deposited in the Mass Spectrometry Interactive Virtual Environment (MassIVE; https://massive.ucsd.edu/ProteoSAFe/static/massive.jsp) under the ID code MSV000086152.
Acknowledgments
We thank the staff of the Sleep and Performance Research Center at Washington State University Health Sciences Spokane for their help conducting the clinical study. The in-laboratory study, blood sample collection, and data analyses were supported in part by start-up funds from the College of Pharmacy and Pharmaceutical Sciences at Washington State University; Congressionally Directed Medical Research Program grant W81XWH-16-1-0319 and US Army Medical Research and Development Command grant W81XWH-18-1-0100; and National Institutes of Health grants R00ES022640, R01ES030113 and R01MD014035. This work was supported by the Pacific Northwest National Laboratory (PNNL), Laboratory Directed Research and Development program, and is a contribution of the Biomedical Resilience & Readiness in Adverse Operating Environments (BRAVE) Agile project. Lipidomics analyses were performed in the Environmental Molecular Sciences Laboratory, a national scientific user facility sponsored by the Department of Energy (DOE) Office of Biological and Environmental Research located at PNNL. PNNL is a multiprogram national laboratory operated by Battelle for the DOE under Contract DE-AC05-76RLO 1830.
Disclosure
The authors report no conflicts of interest in this work.
References
1. Potter GD, Skene DJ, Arendt J, Cade JE, Grant PJ, Hardie LJ. Circadian Rhythm and Sleep Disruption: causes, Metabolic Consequences, and Countermeasures. Endocr Rev. 2016;37(6):584–608. doi:10.1210/er.2016-1083
2. Astiz M, Heyde I, Oster H. Mechanisms of Communication in the Mammalian Circadian Timing System. Int J Mol Sci. 2019;20(2):65. doi:10.3390/ijms20020343
3. Reinke H, Asher G. Crosstalk between metabolism and circadian clocks. Nat Rev Mol Cell Biol. 2019;20(4):227–241. doi:10.1038/s41580-018-0096-9
4. Crnko S, Du Pré BC, Sluijter JPG, Van Laake LW. Circadian rhythms and the molecular clock in cardiovascular biology and disease. Nat Rev Cardiol. 2019;16(7):437–447. doi:10.1038/s41569-019-0167-4
5. Hayter EA, Wehrens SMT, Van Dongen HPA, et al. Distinct circadian mechanisms govern cardiac rhythms and susceptibility to arrhythmia. Nat Commun. 2021;12(1):2472. doi:10.1038/s41467-021-22788-8
6. Costa G. Shift work and health: current problems and preventive actions. Saf Health Work. 2010;1(2):112–123. doi:10.5491/shaw.2010.1.2.112
7. James SM, Honn KA, Gaddameedhi S, Van Dongen HPA. Shift Work: disrupted Circadian Rhythms and Sleep-Implications for Health and Well-Being. Curr Sleep Med Rep. 2017;3(2):104–112. doi:10.1007/s40675-017-0071-6
8. Adamovich Y, Rousso-Noori L, Zwighaft Z, et al. Circadian clocks and feeding time regulate the oscillations and levels of hepatic triglycerides. Cell Metab. 2014;19(2):319–330. doi:10.1016/j.cmet.2013.12.016
9. Chua EC, Shui G, Cazenave-Gassiot A, Wenk MR, Gooley JJ. Changes in Plasma Lipids during Exposure to Total Sleep Deprivation. Sleep. 2015;38(11):1683–1691. doi:10.5665/sleep.5142
10. Chua EC, Shui G, Lee IT-G, et al. Extensive diversity in circadian regulation of plasma lipids and evidence for different circadian metabolic phenotypes in humans. Proce National Acad Sci. 2013;110(35):14468–14473. doi:10.1073/pnas.1222647110
11. Loizides-Mangold U, Perrin L, Vandereycken B, et al. Lipidomics reveals diurnal lipid oscillations in human skeletal muscle persisting in cellular myotubes cultured in vitro. Proc Natl Acad Sci U S A. 2017;114(41):E8565–e8574. doi:10.1073/pnas.1705821114
12. Wehrens SM, Hampton SM, Finn RE, Skene DJ. Effect of total sleep deprivation on postprandial metabolic and insulin responses in shift workers and non-shift workers. J Endocrinol. 2010;206(2):205–215. doi:10.1677/joe-10-0077
13. Kervezee L, Cermakian N, Boivin DB. Individual metabolomic signatures of circadian misalignment during simulated night shifts in humans. PLoS Biol. 2019;17(6):e3000303. doi:10.1371/journal.pbio.3000303
14. Skene DJ, Skornyakov E, Chowdhury NR, et al. Separation of circadian- and behavior-driven metabolite rhythms in humans provides a window on peripheral oscillators and metabolism. Proc Natl Acad Sci U S A. 2018;115(30):7825–7830. doi:10.1073/pnas.1801183115
15. Duffy JF, Dijk DJ. Getting through to circadian oscillators: why use constant routines? J Biol Rhythms. 2002;17(1):4–13. doi:10.1177/074873002129002294
16. Khalyfa A, Gaddameedhi S, Crooks E, et al. Circulating Exosomal miRNAs Signal Circadian Misalignment to Peripheral Metabolic Tissues. Int J Mol Sci. 2020;21(17):65. doi:10.3390/ijms21176396
17. Fretts AM, Jensen PN, Hoofnagle A, et al. Plasma Ceramide Species Are Associated with Diabetes Risk in Participants of the Strong Heart Study. J Nutr. 2019;150(5):1214–1222. doi:10.1093/jn/nxz259
18. Havulinna AS, Sysi-Aho M, Hilvo M, et al. Circulating Ceramides Predict Cardiovascular Outcomes in the Population-Based FINRISK 2002 Cohort. Arterioscler Thromb Vasc Biol. 2016;36(12):2424–2430. doi:10.1161/atvbaha.116.307497
19. Miller M, Stone NJ, Ballantyne C, et al. Triglycerides and cardiovascular disease: a scientific statement from the American Heart Association. Circulation. 2011;123(20):2292–2333. doi:10.1161/CIR.0b013e3182160726
20. McMahon WR, Ftouni S, Phillips AJK, et al. The impact of structured sleep schedules prior to an in-laboratory study: individual differences in sleep and circadian timing. PLoS One. 2020;15(8):e0236566. doi:10.1371/journal.pone.0236566
21. Folch J, Lees M, Sloane stanley GH. A simple method for the isolation and purification of total lipides from animal tissues. J Biol Chem. 1957;226(1):497–509.
22. Nakayasu ES, Nicora CD, Sims AC, et al. MPLEx: a Robust and Universal Protocol for Single-Sample Integrative Proteomic, Metabolomic, and Lipidomic Analyses. mSystems. 2016;1(3):315. doi:10.1128/mSystems.00043-16
23. Bowden JA, Heckert A, Ulmer CZ, et al. Harmonizing lipidomics: NIST interlaboratory comparison exercise for lipidomics using SRM 1950-Metabolites in Frozen Human Plasma. J Lipid Res. 2017;58(12):2275–2288. doi:10.1194/jlr.M079012
24. Kyle JE, Crowell KL, Casey CP, et al. LIQUID: an-open source software for identifying lipids in LC-MS/MS-based lipidomics data. Bioinformatics. 2017;33(11):1744–1746. doi:10.1093/bioinformatics/btx046
25. Pluskal T, Castillo S, Villar-Briones A, Oresic M. MZmine 2: modular framework for processing, visualizing, and analyzing mass spectrometry-based molecular profile data. BMC Bioinform. 2010;11:395. doi:10.1186/1471-2105-11-395
26. Matzke MM, Waters KM, Metz TO, et al. Improved quality control processing of peptide-centric LC-MS proteomics data. Bioinformatics. 2011;27(20):2866–2872. doi:10.1093/bioinformatics/btr479
27. Cornelissen G. Cosinor-based rhythmometry. Theor Biol Med Model. 2014;11:16. doi:10.1186/1742-4682-11-16
28. Team RDC. R: A Language and Environment for Statistical Computing. R Foundation for Statistical Computing; 2019.
29. Mikulich SK, Zerbe GO, Jones RH, Crowley TJ. Comparing linear and nonlinear mixed model approaches to cosinor analysis. Stat Med. 2003;22(20):3195–3211. doi:10.1002/sim.1560
30. Scargle JD. Studies in astronomical time series analysis. II. Statistical aspects of spectral analysis of unevenly spaced data. Astrophys J. 1982;263:835–853. doi:10.1086/160554
31. Hosack DA, Dennis G, Sherman BT, Lane HC, Lempicki RA. Identifying biological themes within lists of genes with EASE. Genome Biol. 2003;4(10):R70. doi:10.1186/gb-2003-4-10-r70
32. Clair G, Reehl S, Stratton KG, et al. Lipid Mini-On: mining and ontology tool for enrichment analysis of lipidomic data. Bioinformatics. 2019;35(21):4507–4508. doi:10.1093/bioinformatics/btz250
33. Figueiro MG, White RD. Health consequences of shift work and implications for structural design. J Perinatol. 2013;33(1):S17–S23. doi:10.1038/jp.2013.7
34. Antunes LC, Levandovski R, Dantas G, Caumo W, Hidalgo MP. Obesity and shift work: chronobiological aspects. Nutr Res Rev. 2010;23(1):155–168. doi:10.1017/s0954422410000016
35. De Bacquer D, Van Risseghem M, Clays E, Kittel F, De Backer G, Braeckman L. Rotating shift work and the metabolic syndrome: a prospective study. Int J Epidemiol. 2009;38(3):848–854. doi:10.1093/ije/dyn360
36. Knutsson A, Kempe A. Shift work and diabetes–a systematic review. Chronobiol Int. 2014;31(10):1146–1151. doi:10.3109/07420528.2014.957308
37. Nojkov B, Rubenstein JH, Chey WD, Hoogerwerf WA. The impact of rotating shift work on the prevalence of irritable bowel syndrome in nurses. Am J Gastroenterol. 2010;105(4):842–847. doi:10.1038/ajg.2010.48
38. Haupt CM, Alte D, Dörr M, et al. The relation of exposure to shift work with atherosclerosis and myocardial infarction in a general population. Atherosclerosis. 2008;201(1):205–211. doi:10.1016/j.atherosclerosis.2007.12.059
39. Rizza S, Neri A, Capanna A, et al. Night Shift Working Is Associated With an Increased Risk of Thyroid Nodules. J Occup Environ Med. 2020;62(1):1–3. doi:10.1097/jom.0000000000001711
40. Straif K, Baan R, Grosse Y, et al. Carcinogenicity of shift-work, painting, and fire-fighting. Lancet Oncol. 2007;8(12):1065–1066. doi:10.1016/s1470-2045(07
41. Jacobson TA, Ito MK, Maki KC, et al. National Lipid Association recommendations for patient-centered management of dyslipidemia: part 1 - executive summary. J Clin Lipidol. 2014;8(5):473–488. doi:10.1016/j.jacl.2014.07.007
42. Mundra PA, Barlow CK, Nestel PJ, et al. Large-scale plasma lipidomic profiling identifies lipids that predict cardiovascular events in secondary prevention. JCI Insight. 2018;3(17):555. doi:10.1172/jci.insight.121326
43. Calder PC. Functional Roles of Fatty Acids and Their Effects on Human Health. JPEN J Parenter Enteral Nutr. 2015;39(1Suppl):18s–32s. doi:10.1177/0148607115595980
44. Ding M, Rexrode KM. A Review of Lipidomics of Cardiovascular Disease Highlights the Importance of Isolating Lipoproteins. Metabolites. 2020;10(4):5149. doi:10.3390/metabo10040163
45. Wang Z, Park HG, Wang DH, Kitano R, Kothapalli KSD, Brenna JT. Fatty acid desaturase 2 (FADS2) but not FADS1 desaturates branched chain and odd chain saturated fatty acids. Biochim Biophys Acta Mol Cell Biol Lipids. 2020;1865(3):158572. doi:10.1016/j.bbalip.2019.158572
46. Shi L, Brunius C, Lehtonen M, et al. Plasma metabolites associated with type 2 diabetes in a Swedish population: a case-control study nested in a prospective cohort. Diabetologia. 2018;61(4):849–861. doi:10.1007/s00125-017-4521-y
47. Martín-Timón I, Sevillano-Collantes C, Segura-Galindo A, Del Cañizo-Gómez FJ. Type 2 diabetes and cardiovascular disease: have all risk factors the same strength? World J Diabetes. 2014;5(4):444–470. doi:10.4239/wjd.v5.i4.444
48. Lambert JE, Parks EJ. Postprandial metabolism of meal triglyceride in humans. Biochim Biophys Acta. 2012;1821(5):721–726. doi:10.1016/j.bbalip.2012.01.006
49. Jenkins B, West JA, Koulman A. A review of odd-chain fatty acid metabolism and the role of pentadecanoic Acid (c15:0) and heptadecanoic Acid (c17:0) in health and disease. Molecules. 2015;20(2):2425–2444. doi:10.3390/molecules20022425
50. Herman MA, She P, Peroni OD, Lynch CJ, Kahn BB. Adipose tissue branched chain amino acid (BCAA) metabolism modulates circulating BCAA levels. J Biol Chem. 2010;285(15):11348–11356. doi:10.1074/jbc.M109.075184
51. Suryawan A, Hawes JW, Harris RA, Shimomura Y, Jenkins AE, Hutson SM. A molecular model of human branched-chain amino acid metabolism. Am J Clin Nutr. 1998;68(1):72–81. doi:10.1093/ajcn/68.1.72
52. Wang Z, Wang DH, Goykhman Y, et al. The elongation of very long-chain fatty acid 6 gene product catalyses elongation of n-13: 0 and n-15: 0 odd-chain SFA in human cells. Br J Nutr. 2019;1:1–8. doi:10.1017/s0007114518003185
53. Grant AD, Wolf GI. Free-Living Humans Cross Cardiovascular Disease Risk Categories Due to Daily Rhythms in Cholesterol and Triglycerides. J Circadian Rhythms. 2019;17:3. doi:10.5334/jcr.178
54. Isherwood CM, Van der Veen DR, Johnston JD, Skene DJ. Twenty-four-hour rhythmicity of circulating metabolites: effect of body mass and type 2 diabetes. FASEB j. 2017;31(12):5557–5567. doi:10.1096/fj.201700323R
55. Grant LK, Czeisler CA, Lockley SW, Rahman SA. Time-of-day and Meal Size Effects on Clinical Lipid Markers. J Clin Endocrinol Metab. 2021;106(3):e1373–e1379. doi:10.1210/clinem/dgaa739
56. Grant LK, St Hilaire MA, Brainard GC, Czeisler CA, Lockley SW, Rahman SA. Endogenous circadian regulation and phase resetting of clinical metabolic biomarkers. J Pineal Res. 2021;1:e12752. doi:10.1111/jpi.12752
57. Kent BA, Rahman SA, St. Hilaire MA, et al. Circadian lipid and hepatic protein rhythms shift with a phase response curve different than melatonin. Nat Commun. 2022;13(1):681. doi:10.1038/s41467-022-28308-6
58. Kuang J, Chen L, Tang Q, Zhang J, Li Y, He J. The Role of Sirt6 in Obesity and Diabetes. Front Physiol. 2018;9:135. doi:10.3389/fphys.2018.00135
59. Masri S, Rigor P, Cervantes M, et al. Partitioning circadian transcription by SIRT6 leads to segregated control of cellular metabolism. Cell. 2014;158(3):659–672. doi:10.1016/j.cell.2014.06.050
60. Kyle JE. How lipidomics can transform our understanding of virus infections. Expert Rev Proteomics. 2021;18(5):329–332. doi:10.1080/14789450.2021.1929177
 © 2022 The Author(s). This work is published and licensed by Dove Medical Press Limited. The
full terms of this license are available at https://www.dovepress.com/terms
and incorporate the Creative Commons Attribution
- Non Commercial (unported, 3.0) License.
By accessing the work you hereby accept the Terms. Non-commercial uses of the work are permitted
without any further permission from Dove Medical Press Limited, provided the work is properly
attributed. For permission for commercial use of this work, please see paragraphs 4.2 and 5 of our Terms.
© 2022 The Author(s). This work is published and licensed by Dove Medical Press Limited. The
full terms of this license are available at https://www.dovepress.com/terms
and incorporate the Creative Commons Attribution
- Non Commercial (unported, 3.0) License.
By accessing the work you hereby accept the Terms. Non-commercial uses of the work are permitted
without any further permission from Dove Medical Press Limited, provided the work is properly
attributed. For permission for commercial use of this work, please see paragraphs 4.2 and 5 of our Terms.