Back to Journals » Journal of Inflammation Research » Volume 16
Silver Nanoparticles and Graphene Oxide Complex as an Anti-Inflammatory Biocompatible Liquid Nano-Dressing for Skin Infected with Staphylococcus aureus
Authors Zielińska-Górska M ![]() , Sosnowska-Ławnicka M
, Sosnowska-Ławnicka M ![]() , Jaworski S
, Jaworski S ![]() , Lange A, Daniluk K
, Lange A, Daniluk K ![]() , Nasiłowska B
, Nasiłowska B ![]() , Bartosewicz B
, Bartosewicz B ![]() , Chwalibog A
, Chwalibog A ![]() , Sawosz E
, Sawosz E
Received 20 July 2023
Accepted for publication 5 October 2023
Published 22 November 2023 Volume 2023:16 Pages 5477—5493
DOI https://doi.org/10.2147/JIR.S431565
Checked for plagiarism Yes
Review by Single anonymous peer review
Peer reviewer comments 2
Editor who approved publication: Dr Adam Bachstetter
Marlena Zielińska-Górska,1 Malwina Sosnowska-Ławnicka,1 Sławomir Jaworski,1 Agata Lange,1 Karolina Daniluk,1 Barbara Nasiłowska,2 Bartosz Bartosewicz,2 André Chwalibog,3 Ewa Sawosz1
1Department of Nanobiotechnology, Institute of Biology, Warsaw University of Life Sciences, Warsaw, 02-787, Poland; 2Institute of Optoelectronics, Military University of Technology, Warsaw, 00-908, Poland; 3Department of Veterinary and Animal Sciences, University of Copenhagen, Frederiksberg, 1870, Denmark
Correspondence: Marlena Zielińska-Górska, Department of Nanobiotechnology, Institute of Biology, Warsaw University of Life Sciences, Ciszewskiego 8 St., bldg. 23, room 110, Warsaw, 02-786, Poland, Tel +48225936665, Email [email protected]
Background: Bacterial skin infections, including Staphylococcus aureus, are a powerful and still not fully resolved problem. The aim of this research was to determine the possibility of using a complex of graphene oxide (GO) encrusted with silver nanoparticles as an effective antibacterial agent against S. aureus and to assess its pro-inflammatory properties.
Methods: The tests were carried out in vitro on EpiDerm™ Skin, an artificial skin model (MatTek in vitro Life Science Laboratories, Slovak Republic), and the fibroblast cell line (HFF-2 from ATCC, USA). Both models were infected with S. aureus bacteria (ATCC 25923) and then treated with antibiotics or our experimental factors: silver nanoparticles (AgNPs, Nano-koloid, Poland), graphene oxide (GO, NanoPoz, Poland), and complex AgNP-GO (hydrocolloid created by self-assembly).
Results: The antibacterial effectiveness of the AgNP-GO complex was equivalent to that of the antibiotic. In addition, an increase in the level of pro-inflammatory cytokines was observed under the influence of antibiotic administration, in contrast to the effect of AgNP-GO, which showed very limited pro-inflammatory activity.
Conclusion: Hydrocolloid of the AgNP-GO complex, administered in the form of a liquid dressing, may act as an antibacterial agent and also reduce inflammation induced by S. aureus infection.
Keywords: human skin, inflammation state, nanomaterials, antibacterial properties
Introduction
Staphylococcus aureus is one of the most difficult-to-treat hospital bacteria, and methicillin-resistant S. aureus (MRSA) has become a major challenge in the fight against staphylococci.1 Staphylococcal infections are the cause of various diseases, and the most common are infections of the skin, digestive tract, joints, and bacteremia. These conditions can range from mild pathology to sepsis and death.2 Staphylococcus aureus is the most frequently diagnosed cause of skin infection in the world, regardless of geo-climatic or human conditions.1 However, strains of S. aureus are constantly becoming resistant to further antibiotics,3 such as the emergence of community-acquired methicillin-resistant S. aureus (CA-MRSA), causing skin infections.4 Therefore, a search for an alternative treatment strategy to antibiotic therapy is still necessary.
Silver nanoparticles (AgNPs) exhibit antibacterial properties;5–11 however, their direct use on the skin as a biocide has certain limitations. The first is the lack of adhesion of AgNPs to the skin and the risk of their rapid removal from the skin’s surface (washing, wiping). As a result, the bactericidal effect of AgNPs is maintained for a very limited time, and AgNPs that have been washed off are quickly released into the environment, which is considered an adverse effect.12 In previous studies, we proposed the creation of an AgNP complex with graphene oxide (GO).13 The role of GO is to form a platform characterized by significant adhesion to the epidermis; at the same time, it is a carrier of AgNPs, which allows it to be maintained at the place of application. Moreover, the non-covalent binding of GO and AgNP allows for the gradual release of nanoparticles and a small amount of Ag+ ions into the area of the infected skin. Therefore, the design of the liquid/drying AgNP-GO dressing, applied by spraying at the site of skin infected with bacteria, can be a therapy with prolonged action and easy application, especially in the case of drug-resistant strains of bacteria that are easily transmitted by physical contact. The application of liquid and/or gel dressings is known, and new generation inventions include the copolymers PEG/Ag/CNT-M-E hydrogel and carbon nanomaterials (nanotubes, graphene oxide reduced nanosheets) decorated with Ag nanoparticles (Ag@rGO) as a material promoted the healing of skin lesions infected with Staphylococcus aureus are still being investigated.14–17 However, our observations show that the adhesion of GO to the skin is so strong that this gelling component of the copolymer may be unnecessary in some bacterial skin infections.
A certain problem with the use of AgNPs is their ability to penetrate skin cells and other tissues.18 Holding AgNPs in the GO platform limits their movement to the tissues.13 Therefore, the creation of the AgNP-GO platform is a procedure that reduces the potential harmfulness of AgNPs to the patient’s tissues.18 Moreover, as our previous research indicated,19 GO itself may not show sufficiently effective antibacterial properties against Pseudomonas aeruginosa and Staphylococcus aureus, while its composite with AgNPs has better biocidal activity than GO and AgNPs used separately. However, the antimicrobial potential of GO remains a controversial and not fully explained issue.20,21 The biocidal properties of GO depend on its physical characteristics (size, shape, lobe structure, amount of oxygen groups),22 which are different and depend on production methodology, among other factors.
Since it is extremely important to look for a therapy that supports the antibacterial effect while lacking the pro-inflammatory effect, the AgNP-GO complex may be used as a “liquid nanodressing”, which, when applied to the skin, allows for its effective protection and the creation of a barrier that inhibits S. aureus transmission. Therefore, we conducted experiments using an artificial epidermis model (EpiDerm™ Skin) infected with S. aureus and applied a thin layer of an aqueous colloid of the AgNP-GO complex (sprayed). These studies are the first attempt to use the AgNP-GO colloid as a so-called liquid nanodressing applied directly to the infected epidermis. Furthermore, we demonstrated the synergism of AgNPs and GO in terms of suppressing inflammation induced by S. aureus activity, as opposed to the action of the antibiotic that generates inflammation.
The aim of this study was to determine the biocidal effect of the AgNP-GO complex on S. aureus against the background of changes in epidermis inflammation related to the activity of AgNPs, GO, and antibiotics.
Materials and Methods
Experimental Factor Characterization
The GO flakes dispersed in ultra pure water at the 4 mg/mL concentration were bought from the NanoPoz Company (Poznan, Poland). It was produced by a modified Hummers method with a 36% oxygen concentration. Before it was used in the experiments and for material characterization, the GO solution was suspended in ultra pure water and a final concentration was 5 mg/L.
Hydrocolloidal AgNPs were purchased from the Nano-koloid Company (Warsaw, Poland). It was produced by a nonexplosive, high-voltage method, using a high-purity metal (99.9999%) and high-purity demineralized water (polish patent no. 3883399). The final concentration used in the experiments and for characterization was 25 mg/L.
In the experiments, we also used a combination of AgNP and GO, in the same concentrations as when used alone (AgNP 25mg/L and GO 5 mg/L). The AgNP-GO complex was obtained because of the self-organization process with the use of the sonication method (ultrasonic bath, Bandelin Electronic, Berlin, Germany) described previously.23
Nanomaterial Characterization
pH measurement: The pH stability of the ultra-pure water (solvent) and investigated nanomaterials was measured in triplicate, at 21°C, with a CP-411 pH meter (Elmetron, Zabrze, Poland). The analysis was repeated at the selected time points (0, 1, 3, 6, and 12 h).
ζ-Potential and size distribution were determined for AgNPs, GO, and the AgNP-GO complex using the laser dynamic scattering electrophoretic method and Smoluchowski approximation with a ZetaSizer Nano ZS model ZEN3500 (Malvern Instruments, Malvern, UK). All measurements were performed in triplicate after stabilization at 25°C and 30 min after the sonication process. The hydrodynamic diameter of the nanoparticles in water and their size distribution were measured with dynamic light scattering (DLS) using a Nano-ZS90 Zetasizer (Malvern Instruments, Malvern, UK).
Nanomaterials visualization: All nanomaterials were visualized using a scanning electron microscope (SEM) Quanta 250 FEG SEM (FEI, Hillsboro, OR, USA), with application of backscatter detector (ETD-BSE, FEI, Hillsboro, OR, USA) and scanning transmission electron microscopy detector (STEM, FEI, Hillsboro, OR, USA). Chemical purity analysis of AgNPs was also performed with Quanta 250 FEG FEI, while using a transmission detector STEM and Energy Dispersive X-ray (EDX) detector and copper square mesh TEM grids.
Raman measurements of GO and the AgNP-GO complex were carried out using a Renishaw InVia Raman microscope equipped with an EMCCD detector. The Raman signal was acquired using laser radiation with a wavelength of 532 nm (27 mW). The laser beam was directed to the sample through a 100 × objective lens. The wavelength of the instrument was calibrated using an internal silicon wafer, and the spectrum was centered at 520.5 cm−1.
The absorption spectra of AgNPs, GO and complex AgNPs-GO were measured at room temperature using a Lambda 650 UV-vis spectrophotometer (Perkin Elmer, Massachusetts, USA) in the 200–700 nm spectral range. Spectra were measured in a quartz cuvette (1 cm optical path) and water was use as a reference sample.
Bacterial Culture
Staphylococcus aureus (ATCC 25923) was obtained from LGC Standards (Teddington, GB) in the form of a spore suspension (20% (v/v) glycerol at −20°C). Before use in the experiments, bacteria were defrosted and washed with distilled water to remove glycerol. Then, the bacterial strains were cultured in tryptic soy agar (TSA) at 37°C overnight.
The bacteria with the tested nanomaterials were visualized using a transmission electron microscope TEM-1220 (JEOL, Tokyo, Japan), operated at a voltage of 80 KeV.
Model Description and Experimental Design
The biocidal and inflammatory effects of the nanostructures were investigated with two experiments with different models of human skin.
The EpiDerm™ Skin Model – First Experiment
EpiDerm™ Skin (EPI-200), which is a proven in vitro reconstructed human epidermal 3D model system for chemical, pharmaceutical, and skin care product testing, was obtained from MatTek In Vitro Life Science Laboratories (Bratislava, Slovak Republic; ISO 9001:2008 certified), part of MatTek Corporation (Ashland, USA). This patented model, without ethics issues related to animal and human testing, consists of normal human-derived epidermal keratinocytes, cultured on specially prepared tissue culture inserts, and exhibits human epidermal tissue structure and cellular morphology, as described previously.13 Ethics approval was not required for this in vitro study.
Pre-preparation of the received skin samples at day 0 was performed according to the rules indicated in the MatTek In Vitro Life Science Laboratories protocol. The next day, the EpiDerm™ Skin inserts were placed in the fresh antibiotic-free assay medium (Dulbecco’s Modified Eagle’s Medium—DMEM) supplemented with 10% fetal calf serum (Thermo Fisher Scientific, Waltham, MA, USA) and divided into 6 groups with 2 time periods (n=3; total N=36, due to two incubations with factors times). The following groups were created: negative control (NC), treated without antibiotic and bacteria; positive control (PC), treated with bacteria but without antibiotic; antibiotic (AB), treated with 10 mg/mL penicillin–streptomycin solution (Gibco, Thermo Fisher Scientific, Waltham, MA, USA) and with bacteria; and 3 experimental groups treated both with bacteria and with AgNP (concentration: 25 mg/L), with GO (concentration: 5 mg/L) and the complex with the same concentrations of AgNP-GO. After the division, 100 µL of the bacterial suspension (OD=0.5) was added to the surface of the skin in almost all groups, except for the negative control (NC), where 100 µL of pure Dulbecco’s phosphate-buffered saline (DPBS) was added instead of bacteria. Thereafter, 300 µL of appropriate solutions (DPBS for NC and PC, antibiotic to AB, or nanomaterial solutions to the AgNP, GO, and AgNP-GO groups) were added to the samples. The setup of this experiment is shown in Table 1.
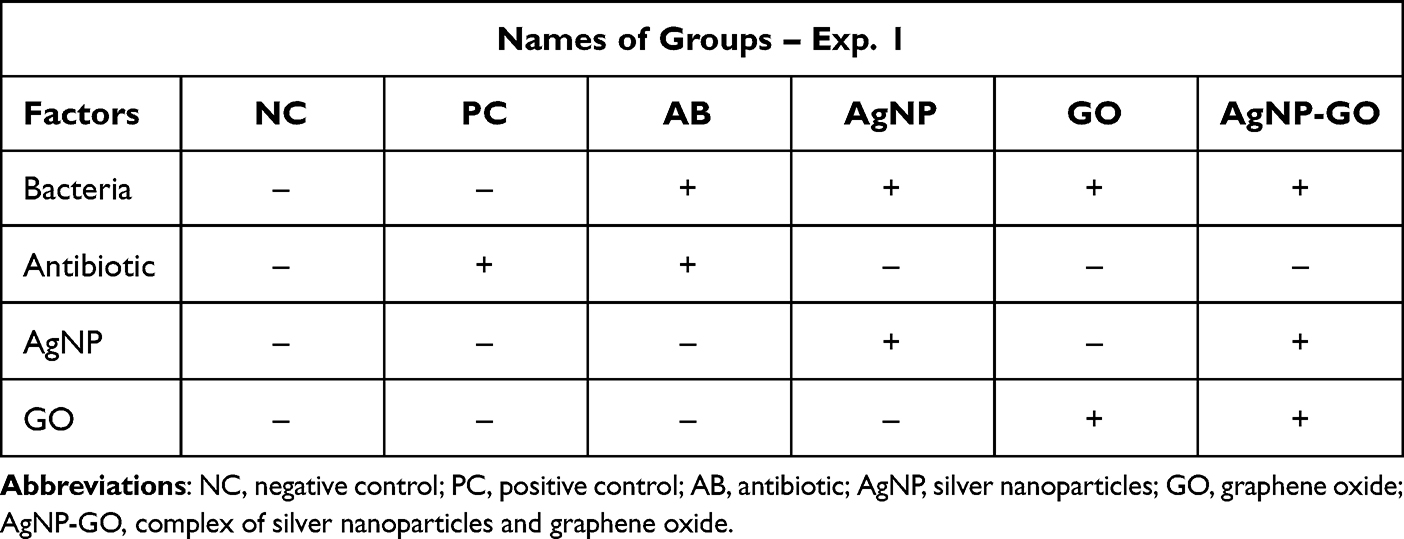 |
Table 1 The Setup of Experiment 1 with EpiDerm™ Skin and Experimental Factors: Bacteria (Staphylococcus Aureus), Antibiotic (10 mg/mL Penicillin–Streptomycin Solution), Silver Nanoparticles (AgNP, Concentration 25 mg/L), Graphene Oxide (GO, Concentration 5 mg/L), and their complex (AgNP-GO) |
Half of the samples were incubated for 3 h and the rest for 6 h at 37°C in a humidified atmosphere that contained 5% of CO2 using an incubator (BD 53 Binder, Binder GmbH, Tuttlingen, Germany). After a certain time period, the inserts were then transferred into 10 mL of sterile 0.9% NaCl to rinse bacteria from the inserts and incubated for 1 h under shaking conditions at 37°C. The EpiDerm™ Skin samples were deeply frozen at −80°C for further analysis of the inflammatory state cytokine activity. The samples for further microbiological analysis were collected both from the culture medium and from the physiological salt where the inserts were transferred.
HFF-2 Cell in vitro Model – Second Experiment
To confirm the influence of the tested factors and bacteria on inflammatory status, we utilized a second biological model, similar to human skin, which was human foreskin fibroblasts (HFF-2) (ATCC, Manassas, VA, USA). The cells before incubation with experimental factors were maintained in Dulbecco’s Modified Eagle’s medium (DMEM) (Life Technologies, USA) supplemented with 10% fetal bovine serum (Life Technologies, Houston, TX, USA) and 1% penicillin/streptomycin (Life Technologies, Houston, TX, USA) under standard conditions (at 37°C in a humidified atmosphere of 5% CO2/95% air in a Memmert ICO 150med incubator (Memmert, Germany) in a T75 culture flask (Thermo Scientific, Waltham, MA, USA). On day 0 of the experiment, the cells were transferred to new flasks with a concentration of 5×10⁶ per dish and maintained in the medium described previously but without antibiotic supplementation. On day 1, 0.5 mL of the bacterial (S. aureus (ATCC 25923)) suspension (OD=0.5) was incubated with 0.5 mL of analyzed factors for 10 minutes, resulting in the following groups: negative control (NC) (without bacteria, without antibiotics), first positive control (PC1) (without bacteria, with antibiotics), second positive control (PC2) (with bacteria, without antibiotics), antibiotic (AB) (with bacteria, with antibiotics), and three experimental groups: AgNP (treated both with bacteria and AgNP colloid – final concentration 25 mg/L), GO (treated both with bacteria and with GO solution – final concentration 5 mg/L), and AgNP-GO complex (with the complex of two described before, and with bacteria) (Table 2).
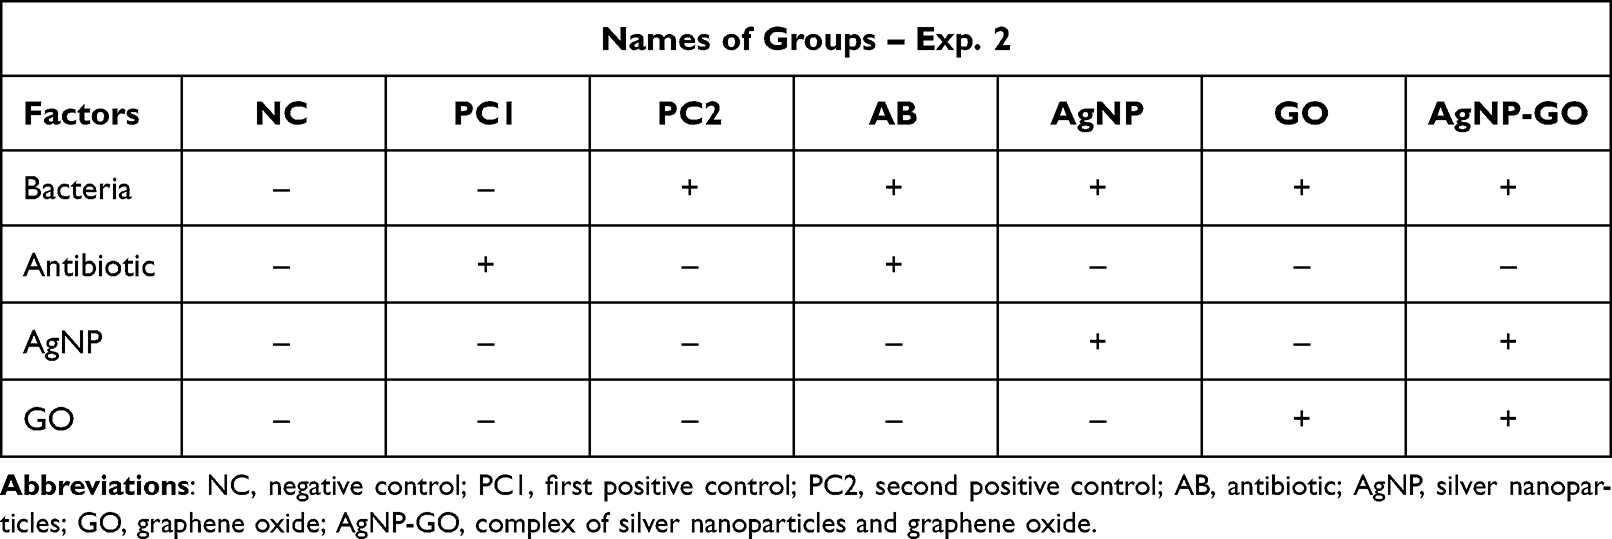 |
Table 2 The Setup of Experiment 2 with HFF-2 Cell Line and Experimental Factors: Bacteria (Staphylococcus Aureus), Antibiotic (10 mg/mL Penicillin–Streptomycin Solution), Silver Nanoparticles (AgNP, Concentration 25 mg/L), Graphene Oxide (GO, Concentration 5 mg/L), and and their complex (AgNP-GO) |
After incubation of the experimental factors with bacteria, 1 mL of prepared solutions were mixed with 9 mL of DMEM (supplemented with 10% fetal bovine serum but without antibiotic) and added to cell cultures. Incubation was then performed in standard conditions for 3 and 6 h. The final concentrations of the analyzed factors were diluted 10 times in cell cultures. Subsequently, the cells were detached with trypsin and centrifuged at 1200 rpm for 5 min. Whole-cell protein extracts were prepared, as described by Sosnowska et al, 2021,24 using an ice-cold radioimmunoprecipitation assay. The achieved total protein samples were deeply frozen at −80°C for further analysis of the inflammatory state cytokine activity.
Tests and Analyses
Microbiological Test
The microbiological test was performed using the surface spread plate method with serial dilutions. On the same day, 10-fold dilutions up to 10−8 were made and spread over the nutrient agar plates (Biomaxima, Lublin, Poland). The plates were incubated for 24 h at 37°C in a microbiological incubator (NUAire, Plymouth, MN, USA). Thereafter, colony forming units (CFU) per mL were determined as a mean of three repetitions of the number of visible colonies formed (in a countable range) multiplied by the appropriate dilution factor. The results were transformed to a logarithmic scale.
Activity of Inflammatory State Cytokines
To evaluate the impact of experimental factors on the protein expression of proinflammatory cytokines in EpiDerm™, a Human Inflammation Antibody Array—Membrane for 40 targets (Abcam ab134003, Cambrige, UK) was performed as described previously, directly following the manufacturer’s protocol.13 Briefly, after extraction and standardization of the obtained protein samples, 250 µg of total protein from each sample diluted in 1 mL of blocking buffer was added per array membrane. After washing, antibodies conjugated with biotin and incubation with streptavidin conjugated with horseradish peroxidase steps, the membranes were finally visualized using a ChemiDoc imaging system (Bio-Rad, Hercules, USA). Densitometric analysis of the signal was performed using the Protein Array Analyzer tool for ImageJ software (Research Services Branch, National Institute of Mental Health, Bethesda, USA).25 To normalize the array data, the calculations were performed following the manufacturer’s instructions. The heatmaps of the obtained results were prepared using Excel 365 Microsoft software.
Statistical Analysis
The data are presented as the mean ± standard deviation. The results were analyzed using GraphPad Prism 9 (version 9.2.0, San Diego, CA, USA) by one-way analysis of variance with a post-hoc Tukey’s test (HSD). Statistically significant differences were reported as: <0.01 (**), <0.001 (***), and <0.0001 (****).
Results
Characterization of Experimental Factors
To evaluate and characterize the morphometry of the tested nanomaterials and the possible interactions in the created AgNP-GO complex, several analyses were performed.
TEM visualizations of nanostructures with ETD and STEM detectors are presented in Figure 1. AgNPs (Figure 1a, d, g and j) showed regular and spherical shapes. In turn, the GO flakes had an irregular shape with sharp edges and a tendency to form folds (Figure 1b, e, h and k). Structural analysis of the AgNP-GO complex showed that AgNPs adhered very well to the GO flakes, which was also related to the interaction of intermolecular forces (van der Waals forces) (Figure 1c, f, i and l). AgNPs arranged themselves in the depressions and bends of the GO flakes, creating a network. We also observed shape differences (less regular) in the image visualization of AgNPs in the complex compared to pure AgNPs. This is an interesting phenomenon and is probably caused by AgNPs’ attachment in places of unevenness in the GO flakes, so that the visible transmission image includes not only the outline of nanoparticles but also a small GO fragment.
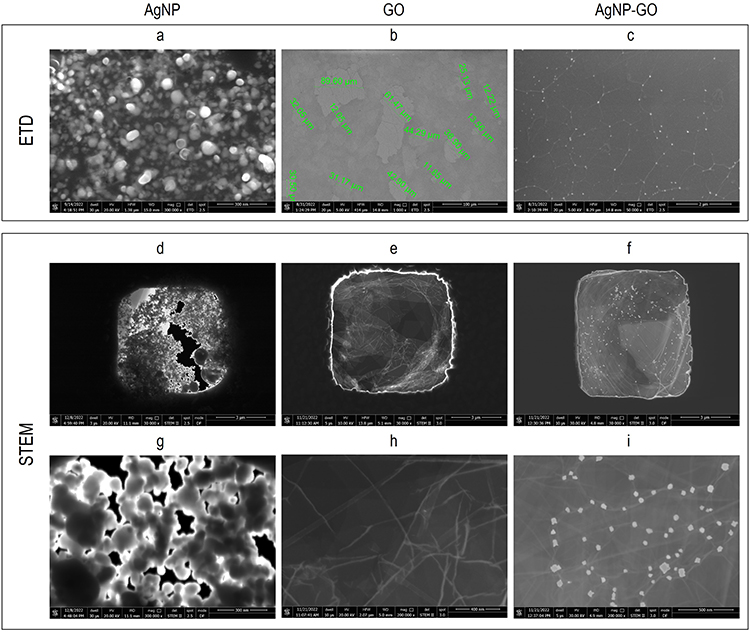 |
Figure 1 Transmission electron microscopy visualization of the nanostructures: silver nanoparticles (AgNP), graphene oxide (GO), and complex of both of them (AgNP-GO) with Everhart–Thornley backscatter detector (ETD) (a–c) and scanning transmission electron microscopy detector (STEM) (d–i). |
Moreover, to show the purity of the hydrocolloid AgNPs, elemental composition analysis was performed by the simultaneous use of STEM and EDX detectors (Quanta 250 FEG FEI, Hillsboro, OR, USA). In Figure 2, the presence of Ag in AgNPs (Figure 2b and e) and Cu in the TEM mesh (Figure 2c and f) (EDX detector) was observed. Figure 2a and d show the analyzed spots with STEM detector visualization.
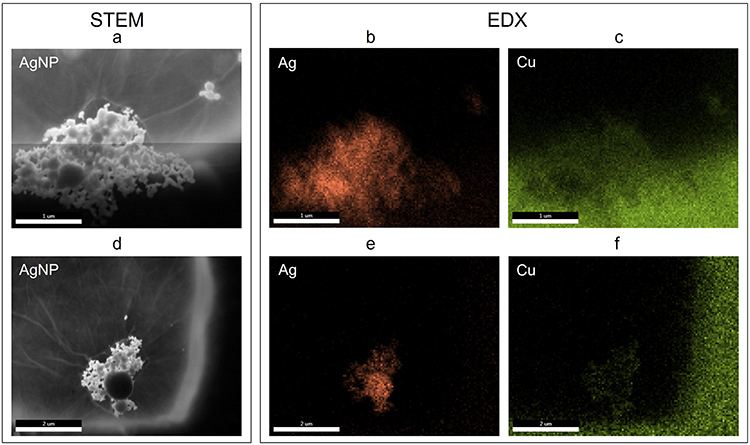 |
Figure 2 Silver nanoparticles (AgNP) hydrocolloid elemental composition analysis with scanning transmission electron microscopy (STEM) (a and d) and energy dispersive X-ray (b, c, e and f) detectors. Copper (Cu) visualization (c, f) is the mesh contour. |
We also confirmed the nanostructures size by the DLS size distribution (ZetaSizer Nano ZS model ZEN3500 (Malvern Instruments, Malvern, UK)) (Figure 3a). For AgNPs the size range was 67.05 ± 10.4 nm, and the size of the GO flakes was between 12 and 200 µm. The manufacturer’s declaration regarding the size of the GO flakes was >3 µm. The resulting discrepancies may result from the overlap of individual flakes as a result of physisorption, ie, physical adsorption. To confirm the nature of the bonds existing between AgNPs and GO in the formed complex, zeta potential analysis (Figure 3a) and RAMAN analysis were performed (Figure 3b) and UV-Vis absorbance spectra (Figure 3c) were performed. Analysis of the stability of aqueous colloids indicated that the AgNP-GO complex material was the most stable of all verified samples (−44.1±1.51 mV), while the reading values for AgNPs and GO were −35.97±1.79 mV and −15.4±2.59 mV, respectively. Furthermore, the Raman technique was used to identify the structure of the obtained material. In the Raman spectrum of GO, a typical spectral pattern was observed. The spectrum was characterized by the occurrence of the following bands: 1359 cm−1 (D band), 1602 cm−1 (G band), 2720 cm−1 (2D band), and 2950 cm−1. The tested GO was of good quality and purity, as the obtained spectrum was consistent with the reference literature.26 The analysis of the complex showed no changes in the spectral pattern (GO compared to AgNP-GO) (Figure 3b), indicating that AgNPs do not affect the chemical structure of the examined GO. The UV-vis spectra of GO, AgNPs, AgNPs-GO complex and for comparison sum of GO and AgNPs spectra (AgNPs+GO) are depicted in Figure 3c. In the GO sample, a prominent absorption peak is observed at 230 nm, attributed to the π → π* transitions within aromatic C-C bonds, while the n → π* transitions of C=O bonds contribute to the shoulder at 300 nm.27 The AgNPs sample exhibit broad absorption band in 320–600 nm spectral range, arising from the surface plasmon resonance, and at 210 nm corresponding to the inter-band transition of electrons in silver nanoparticles.28,29 However, when analyzing the shape of the spectra of the AgNPs-GO complex and the sum of the spectra AgNPs and GO, it can be noticed that the absorption corresponding to interband transitions in silver nanoparticles is still visible, which proves the presence of nanoparticles in the complex mixture, while the band corresponding to the plasmon resonance has disappeared, which most likely indicates the adsorption of nanoparticles on the graphene surface.
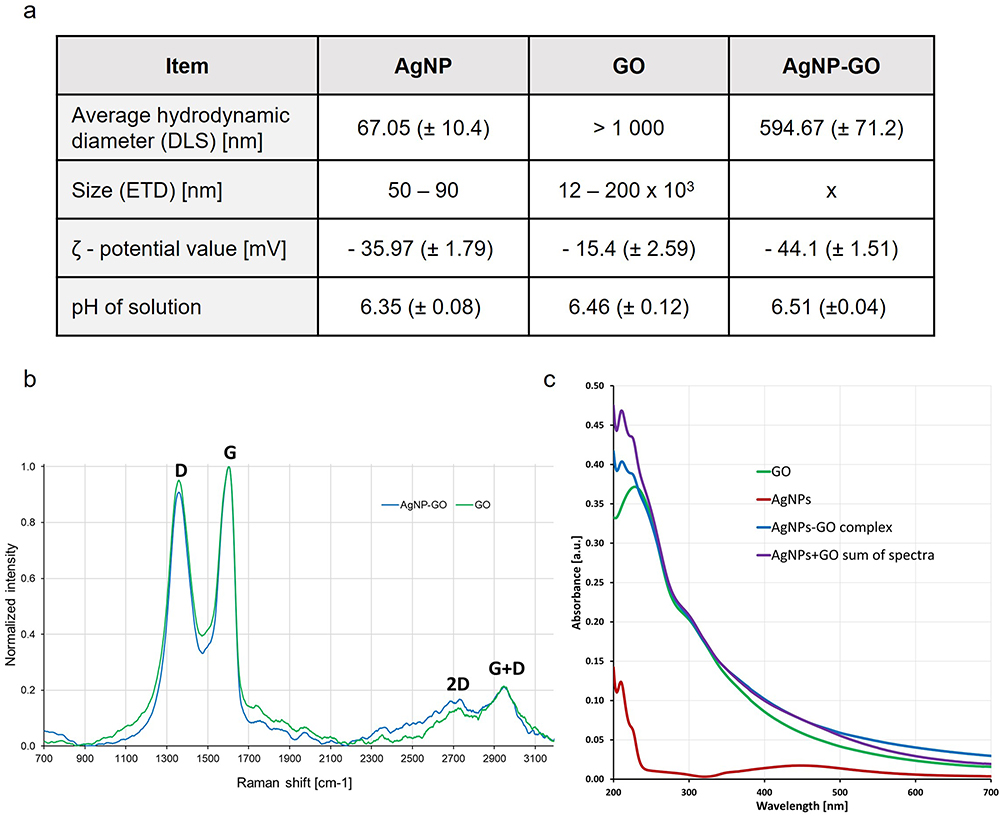 |
Figure 3 The physicochemical characterization of the experimental factors. (a) Size, Zeta potentials and pH measurements of the evaluated nanomaterials. (b) Raman spectrum of graphene oxide (GO) and AgNP-GO complex; the spectrum is characterized by the occurrence of the following bands: 1359 cm−1 (D band), 1602 cm−1 (G band), 2720 cm−1 (2D band), and 2950 cm−1. (c) UV-Vis absorption spectra of AgNP, GO and AgNP-GO complex in aqueous solution. |
pH measurement was also performed. At point 0, the pH (Figure 3a) values were 6.44 (±0.10) for UP water, 6.35 (±0.08) for AgNPs, 6.46 (±0.12) for GO, and 6.51 (±0.04) for AgNP-GO. Over time, the measurements did not change significantly and were in the pH range of 6.4–6.6 at the last point of measurement, which confirmed the stability of the tested solutions.
Visualization of S. Aureus Morphology After Co-Incubation with AgNPs, GO, and the AgNP-GO Complex
Visualization of the bacteria with the tested nanomaterials and antibiotic (positive control) showed the antibacterial effects of AgNPs and the AgNP-GO complex at the analyzed concentrations. As shown in Figure 4, the co-incubation of S. aureus and AgNPs damaged the bacterial cell membrane and caused leakage of the cytoplasm (marked by an orange arrow in Figure 4b). GO itself mainly affected the trapping of bacterial cells on its surface, causing some losses in the bacterial population (Figure 4c). In turn, after incubation of the bacteria with the tested complex, cells were trapped on their surface in various stages of degeneration (from cytoplasm leakage to complete cell lysis) (Figure 4d).
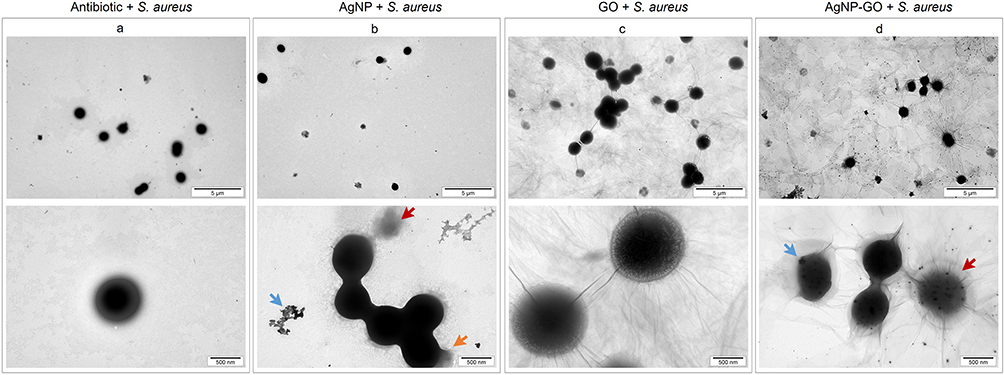 |
Figure 4 Transmission electron microscopy visualization of bacteria (Staphylococcus aureus) after incubation with (a) antibiotic (positive control), (b) silver nanoparticles (AgNP), (c) graphene oxide (GO), and (d) their complex (AgNP-GO). The blue arrow indicates AgNPs, and the red arrow indicates examples of dead bacterial cells. The orange arrow shows cytoplasm leakage from the bacterial cell. |
Antibacterial Effect of the Tested Nanostructures Using the EpiDerm™ Model
The potential bactericidal effect was investigated using the surface spread plate method with serial dilutions. Two types of samples from two time periods (3 and 6 h) were used for inoculation: culture fluid in which the EpiDerm™ inserts were kept (hereinafter referred to as “medium”) and sterile 0.9% NaCl into which the EpiDerm™ inserts were transferred after 3 and 6 h of culture (hereinafter referred to as “insert”). The results are presented on a logarithmic scale in Figure 5.
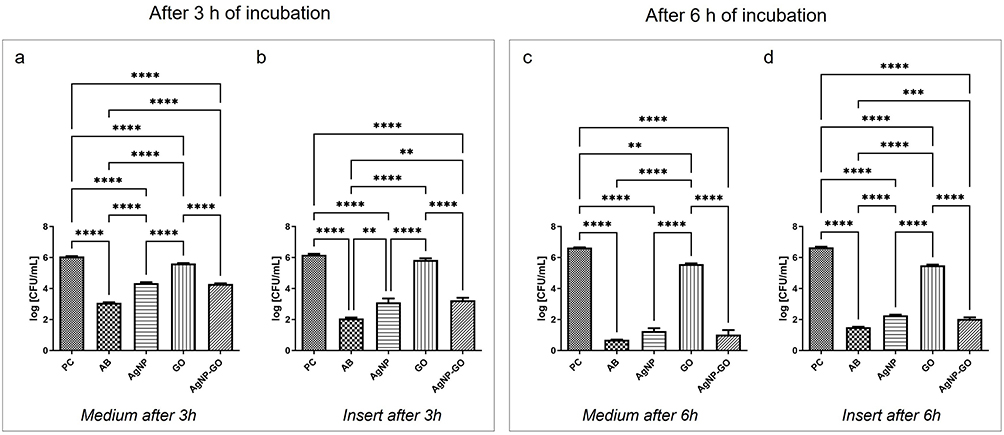 |
Figure 5 Mean CFU/mL (log) for Staphylococcus aureus after treatment with antibiotics (AB) and nanostructures (silver nanoparticles (AgNP), graphene oxide (GO), and their complex (AgNP-GO)). (a) the results after 3 h of medium incubation, (b) the results after 3 h of insert incubation, (c) the results after 6 h of medium incubation, (d) the results after 6 h of insert incubation. “Medium” – the samples from medium in which the experiments were performed; “Insert” – the samples from the artificial skin; PC is the positive control sample, and the results are the mean ± standard deviation. Statistically significant differences were reported as: <0.01 (**), <0.001 (***), and <0.0001 (****). |
After 3 h of incubation of the bacteria and nanostructure, no significant antibacterial effect was observed on the number of S. aureus colonies in the medium samples (Figure 5a). The logarithmic values of CFU/mL decreased 1.72, 0.45, and 1.78 times after AgNP, GO, and AgNP-GO treatment, respectively, compared to PC. However, the insert incubation results showed a trend to reduce the number of bacteria after the use of the tested AgNP and Ag-GO factors, and we noticed a 3.1 and 2.9 times decrease in relation to PC (Figure 5b).
After 6 h of incubation of the bacteria and tested factors, we observed a significant decrease in the number of bacterial colonies after AgNP and AgNP-GO treatment, both in the analyzed medium and in the insert samples, compared to PC (Figure 5c and d). In the medium, the levels were 5.39 and 5.62 times decreased, respectively. In the inserts group, they were 4.39 and 4.61 times decreased, respectively. No changes were observed in the GO-treated group.
Effect of S. Aureus and Nanomaterials on the Proinflammatory State
An analysis of the expression of 40 cytokines’ expression was performed using a protein array for both investigated models. In the first experiment (with the EpiDerm™ model), we considered all groups (NC, PC, AB, AgNPs, GO, and AgNP-GO complex). The results presented in Figure 6 show the changes in the protein expression level in relation to the NC and PC results after normalization with ImageJ software. In the heatmaps, we included only those cytokines from the 40 available at the membrane that were expressed. Both after 3 and 6 h of contact incubation of the skin with bacteria, we observed increased cytokine activity. After 3 h of incubation, the tissue with bacteria contacting itself (PC) induced the response of cytokines, such as IL-1α, IL-1β, IL-6, IL-6sR, IL-8, IL-15, EOTAXIN-1, EOTAXIN-2, ICAM-1, IP-10, MIP-1β, PDGF-BB, RANTES, TNFβ, sTNFR1, and TIMP2. Additionally, after other treatments (AB, AgNPs, AgNP-GO complex), we observed the release of the same cytokines, except for IL-10, which was expressed only after antibiotic treatment.
 |
Figure 6 Effect of Staphylococcus aureus bacteria, antibiotics (AB), and nanostructures (silver nanoparticles (AgNP), graphene oxide (GO), and their complex (AgNP-GO)) on the protein expression of proinflammatory cytokines in EpiDerm™ 3 and 6 h after treatment. The results were normalized to the negative control (NC) group. Images were created with ImageJ software. The expression of cytokines is also presented as heatmaps, where the 0 expression level is presented as dark green, and the highest observed expression (1.5 O.D.) is indicated in red. |
After 6 h of incubation, the observed reaction was largely silenced. In the groups treated with GO and the complex, the cytokine was usually zero or close to zero. However, after treatment with AgNPs, we observed a further cytokine response, which was especially evident in the expression of IL-1α, IL-8, IP-10, PDGF-BB, TNFβ, and TIMP-2.
The cellular response to the penicillin-streptomycin antibiotic (group AB) caused long-term inflammation with low or medium intensity, which was not observed in the group treated with the AgNP-GO complex.
Analysis of the induction of the pro-inflammatory state due to S. aureus and the tested antibacterial agents was also carried out using another biological model, HFF-2 cells.
After 3 h of treatment, increased expression occurred for IL-6, IL-8, IL-11, IL-12p70, ICAM-1, IP-10, MCP-1, MIP-1β, MIP-1δ, and TIMP-2 in the AgNP group, IL-1α, IL-3, IL-6, IL-6sR, IL-8 (the highest result compared to other groups), IL-10, IL-11, IL-12p70, ICAM-1, IP-10, MCP-1, MIP-1β, MIP-1δ, and TIMP-2 in the GO group; and Il-6, IL-6sR, IL-8, Il-11, ICAM-1, IP-10, MCP-1, MIP-1β, and TIMP-2 in the AgNP-GO group.
After 6 h of incubation, the observed response of cells to experimental factors was changed, and AgNPs decreased the expression of MIP-1δ and IL-12p70 and increased the expression of IL-1β, IL-3, IP-10, MCP-1, RANTES, TNF-β, sTNF RI, and TIMP-2. The expression was maintained for cytokines, such as IL-6, IL-8, IL-11, ICAM-1, and MIP-1β. In the GO-treated group, we observed decreased cytokine expression for IL-1α, IL-6 (almost 10-fold), IL-6sR, IL-10, IL-12p70, and ICAM-1. The expression of cytokines, such as IL-3, IL-11, and MIP-1β, did not change over time. Additionally, in this group, the expression of the following cytokines increased: IL-8, IP-10, MCP-1, and TIMP-2 (2 folds up). The following were expressed for the first time after GO treatment: IL-15, RANTES, TNF-β, sTNF RI, and sTNF RII.
In contrast, in the group treated with the complex, the expression of most cytokines decreased significantly or completely. A particularly pronounced response was seen in IL-6 expression (a decrease of almost 20-fold). Only in the case of TIMP-2 did the result remain but at a relatively low level (the lowest compared to all other groups). Cytokine expression in this experiment is presented in Figure 7.
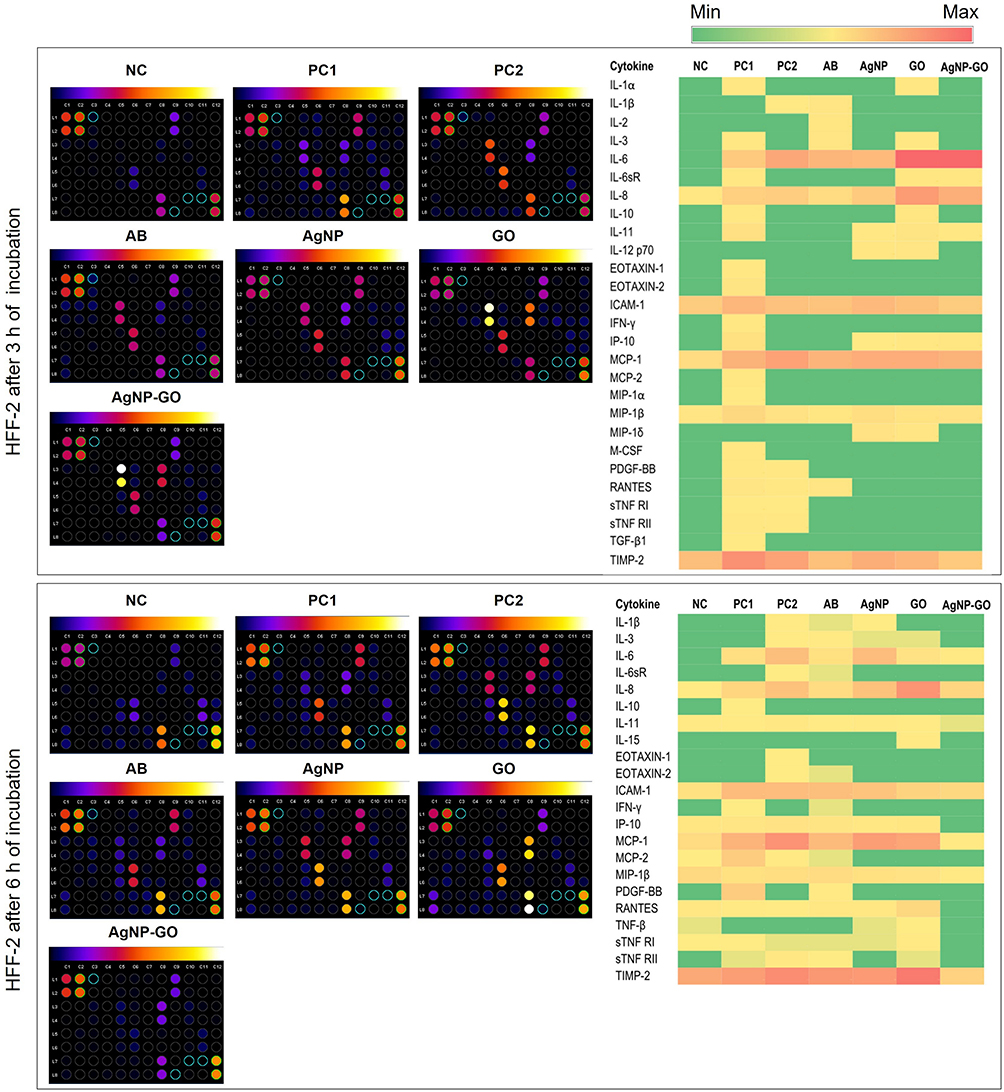 |
Figure 7 Effect of Staphylococcus aureus bacteria, antibiotics (AB), and nanostructures (silver nanoparticles (AgNP), graphene oxide (GO), and their complex (AgNP-GO)) on the protein expression of proinflammatory cytokines in HFF-2 culture cells, 3 and 6 h after treatment. The results were normalized to the negative control (NC) group. Images were created with ImageJ software. The expression of cytokines is also presented as heatmaps, where the 0 expression level is presented as dark green, and the highest observed expression (1.9 O.D.) is indicated in red. |
Discussion
Nanostructure Properties
GO is a structure of a single layer of carbon atoms containing oxygen functional groups, such as carboxyl, carbonyl, epoxyl, or hydroxyl,30 which was also confirmed by our analyses. These groups make GO hydrophilic, and they are also responsible for their adsorbent properties, especially toward metal ions, through electrostatic interaction and coordination.31 The strong sorption properties of GO toward positively charged particles are explained by electrostatic interactions, H-bonding, and π-π interaction.32 We used these features of GO to create the AgNP-GO complex as the so-called “liquid dressing”. The method of combining GO and AgNPs is crucial for the application of the AgNP-GO complex because strong covalent bonds between Ag and GO can limit the activity of AgNP and its ions, while the lack of AgNP-GO interaction can prevent the formation of the complex through a clean, fast, and cheap method of self-assembly. Thus, because of electrosonically forced self-assembly, we obtained a relatively stable (ζ-potential −44.1 mV) colloidal AgNP-GO solution.
The main advantage of the obtained complex was its purity, which was confirmed by EDS analysis. However, the greatest advantage of the method used is the incrustation of GO with AgNPs in a way that does not limit the activity of oxygen groups, which was confirmed by Raman analysis. The Raman spectra of GO and AgNP-GO were very similar. In this way, we obtained a “liquid dressing” that was a stable physicochemical solution, with active oxygen groups, AgNP exposure, biocompatibility, and the ability to form a stable layer (GO).13 The stability of the AgNP-GO layer on various materials and the antibacterial properties of such a layer applied to medical textiles were tested by our team against the bacteria P. aeruginosa and S. aureus.19 Therefore, in subsequent experiments, we checked the biological effects of the AgNP-GO dressing and, above all, its antibacterial effectiveness, as well as its potential anti-inflammatory properties.
Antibacterial Properties of Nanostructures
Exposure of artificial skin inserts to S. aureus (control group) resulted in infection, where both the EpiDerm™ samples and the medium in which they were incubated contained active bacteria capable of forming colonies, as observed after only 3 h of incubation (control group). The epidermis is a key protective barrier against bacterial infection, and this observation supports research by other authors on the high virulence of S. aureus, which is the cause of 80–90% of skin infections.33 Moreover, this bacterium, internalized in keratinocyte cells, is resistant to most antibiotics, and the key problem seems to be the search for a drug that can easily penetrate host cells.34 The administration of AgNPs to the medium resulted in a significant reduction in the number of bacterial colonies after 3 h and a very strong reduction in their number after 6 h. The antimicrobial activity of AgNPs is known and has been studied by many authors, including our team.6,35–37
The S. aureus bacterium, like most of these microorganisms, has a negative charge, which is mainly due to the presence of teichoic acid.38 GO has a negatively charged surface, which has been confirmed by many authors.39,40 In the research conducted by our team on the interaction of graphene materials, such as pristine graphene (pG), GO, and reduced GO (rGO), with bacteria (Salmonella enterica and Listeria monocytogenes), we observed that regardless of the type of bacteria, they adhered to pG and rGO near the edges, while they did not adhere to GO at the edges of the petals but were evenly located on its surface.20 The current study of S. aureus confirmed this observation. Nevertheless, the adhesion of bacteria to GO takes place despite the mutual repulsion of the two bodies with negative charges. An interesting study was conducted by Romero-Vargas Castrillón et al,41 who in studies using atomic force microscopy, confirmed that the physical interactions of GO with bacteria are repulsive, and other mechanisms should be investigated. Moreover, the authors pointed out that, in the case of GO, there is no mechanical damage, but rather oxidative stress, in bacterial membranes at the sharp edges of GO. Our visualization of the GO–S. aureus interaction also showed that the first step is probably the active movement of bacteria to the GO surface, which may be the result of chemotaxis toward -OH groups (similar to glucose), and the second step is their immobilization, probably related to oxidative stress.42 However, even after 6 h, we did not observe GO toxicity to S. aureus.
In contrast to GO, both AgNPs and AgNP-GO significantly reduced the number of S. aureus colonies both in the post-culture fluid and present on the 3D skin implants. A trend of higher killing activity was also observed for the AgNP-GO “liquid dressing” complex compared to AgNPs. The antimicrobial activity of AgNPs is known. Scientific research, including proteomic research, has proven that because of the destruction of the outer cell membrane, the function of the cytoplasmic membrane is disturbed by the accumulation of envelope proteins, loss of proton driving force and collapse of the membrane potential, and consequently a drastic reduction in the level of ATP.43,44 In this research, TEM visualization also allowed us to observe the degradation of the cell wall and membrane and the shrinkage of the cytoplasm until the complete destruction of the bacterial cell, from which only the so-called shading effect occurred.45 Interestingly, the mechanism is similar for Ag+ ions and Ag nanoparticles, and the difference concerns only the level of antibacterial effectiveness, which is lower for nanoparticles.46,47 Our visualization of the interaction between S. aureus and AgNP-GO showed that the AgNPs are visible as elements encrusting GO rather than being present inside the bacterial cell. It can therefore be assumed that Ag+ ions participate in killing bacteria.
Anti-Inflammatory Properties of Nanostructures
Despite its antibacterial function, “liquid dressing” should also be non-toxic to human skin and even shows anti-inflammatory activity and has a positive effect on the regeneration of the epidermis. Therefore, 40 proteins responsible for inflammation were analyzed in skin implants. In short contact with the skin (3 h), S. aureus increased the level of all markers of inflammation (IL-1α, IL1-1β, IL-6, IL-6sR, IL-8, IL-15, EOTAXIN-2, ICAM-1, IP-10, MIP-1β, PDGF-BB, RANTES, TNFβ, sTNFR-1, and TIMP2). This rapid and temporary cytokine burst, which occurred under the influence of S. aureus, was further increased in several cases using antibiotics (RANTES, IL-15, sTNFR-1). RANTES (CCL5) and IL-15 are among the key pro-inflammatory factors, with the former being responsible for the degradation of collagen in the epidermis via the activation of MMP-1 and MMP-13.48 Treatment with AgNPs, the AgNP-GO complex, and especially GO reduced the level of this interleukin.
However, the most important observation was made after 6 h, when only a few proteins were upregulated by the presence of S. aureus—IL-1α, IL-8, ICAM-1, IP-10 (CXCL-10), MIP-1β, and TIMP-2. CXCL-10 is a key chemokine in S. aureus infections, especially MRSA, because these bacteria can bind CXCL-9 and CXCL-10 and suppress the immune response through a simple capture mechanism, reducing the amount of chemokines and consequently reducing chemotaxis.49 Unfortunately, CXCL-10 was not reduced by AgNPs, GO, AgNP-GO, or antibiotic treatment. Similar trends were observed regarding the level of IL-1α; however, attention should be paid to its increased expression under the influence of antibiotics, in contrast to the AgNP-GO complex. This indicates that the antimicrobial activity of AgNP-GO generates less inflammation activation than that of antibiotics. IL-8, a strong marker of inflammation in the skin region,50 also under the influence of AgNP-GO administration, decreased to the level of the control group (without bacteria), confirming the beneficial antimicrobial effect of the complex compared to the antibiotic. ICAM-1 - intercellular adhesion molecule was also increased upon incubation with S. aureus. The interaction of the ICAM-1 protein with its specific ligands is the source of signals that stimulate T-cell proliferation.51 Increased expression of ICAM-1 in keratinocytes may occur as a result of atopic dermatitis52 as a manifestation of a local inflammatory response. ICAM-1 was not silenced by the antibiotics or AgNPs but was decreased by GO and AgNP-GO. A decrease in ICAM-1 levels in contact with GO was also observed by Domenech et al53 in research on Caco-2/HT29 cells, defining GO as a mildly anti-inflammatory material. Moreover, in studies on macrophage immune cells (RAW 264.7), the activation of ICAM-1 production was not observed under the influence of GO.54 Therefore, it can be concluded that GO, as well as AgNP-GO, in terms of observing the level of inflammatory proteins, such as IP-10 and IL-1α, show effectiveness similar to that of an antibiotic. However, considering the marker of inflammation, ICAM-1, the anti-inflammatory effect of AgNP-GO is stronger than that of antibiotics.
Interestingly, 6 h of skin incubation with S. aureus did not affect the activation of the protein secretion of inflammation markers (RANTES, TGFβ, TNFα, TNFβ, EOTAXIN1, and 2, MCP-1), while the presence of these proteins increased with antibiotics. The antimicrobial activity of antibiotics occurs not only by killing them but also by causing the release of various bacterial compounds that increase inflammation.55 In our study, S. aureus-infected skin was treated with a penicillin–streptomycin mixture, which, while effective in killing bacteria, caused an inflammatory response. In addition, other authors have observed that streptomycin increases the inflammatory tone of the intestinal mucosa.56 Antibiotic therapy against S. aureus, associated with the disruption of thymidine synthesis and elevated levels of cyclic diAMP, induces inflammation in the host as a side effect.57 An important result of our research is the fact that these 7 proteins were not activated using GO or AgNP-GO. This result indicates that the toxicity of AgNPs, in terms of inflammation induction, is suppressed by forming a complex with the GO flake, what is documented in Figure 3. Reducing the toxicity of Ag by creating a AgNP-GO complex was found in previous studies.13 It can be assumed that the adhesion of AgNP to GO by limiting the mobility of AgNPs reduces their toxic/pro-inflammatory effect.
Considering that after 6 h, the AgNP-GO complex showed biocidal effectiveness against S. aureus similar to that of the antibiotic, and at the same time did not affect the activation of inflammation in terms of the assessment of most inflammation proteins, it can be concluded that the AgNP-GO colloid as a “liquid dressing” showed biocidal properties against S. aureus but also counteracted the inflammatory reaction that occurred when an antibiotic was used. When analyzing the ICAM-1 protein concentration, the AgNP-GO complex showed anti-inflammatory activity. These studies showed, for the first time, the antimicrobial effectiveness of the AgNP-GO complex and its anti-inflammatory nature in experiments on a 3D epidermal model. Moreover, the AgNP-GO complex, used as a type of “liquid dressing”, had a more beneficial effect than the antibiotic, in this case, streptomycin. The AgNP-GO complex can effectively kill S. aureus, mainly due to Ag activity, but additionally inhibit inflammation through the adhesion of the remains of killed bacteria on the GO surface, which could be a source of a pro-inflammatory signal, although these assumptions require experimental confirmation.
To confirm the obtained results, in terms of both the antibacterial and anti-inflammatory effects of the AgNP-GO complex, we conducted tests on a fibroblast cell line, HFF-2. A group was also introduced in which the antibiotic was used alone, without bacteria, to demonstrate the potential pro-inflammatory effect of the antibiotic.
Analyzing the results of the tests carried out on the cell line, different sensitivities were observed in the cells grown in vitro compared to the organized tissue (EpiDerm™ Skin). After 3 h, a large number of pro-inflammatory cytokines in the tissue were differentiated under the influence of the agents used, while after 6 h, their levels returned to normal, and in general, regardless of the agent used, inflammation was suppressed. Observing the reaction of the unorganized population of fibroblast cells, the opposite tendency was observed, with greater activation of pro-inflammatory proteins after 6 h compared to 3 h. In addition, the cytokine concentration in the EpiDerm™ tissue was generally lower, especially after 6 h (no red color on the heatmap), compared to the response of the cells after both 3 and 6 h. This observation confirms the thesis of a different response to experimental factors depending on the research model.58 Moreover, it indicates greater resistance of the organized tissue structure to various stress factors. It can also be seen that the mechanism of response to the applied stimulation also differed; for the tissue, after early cytokine activation, the cytokines were silenced over time. The cells increased their inflammatory response over time.
Interesting results were obtained after antibiotic administration. The use of the antibiotic alone (PC1) increased the level of 18 proteins after 3 h and 9 proteins after 6 h, compared to the non-treated control group. The antibiotic most significantly increased the levels of IL-6, IL-8, ICAM-1, MCP-1, and TIMP-2 after 3 and 6 h of incubation.
IL-6 is a multi-target pleiotropic cytokine, but its primary role is to activate the acute inflammatory response.59 Moreover, the level of this cytokine actively changes depending on the severity of inflammation, which allows it to be used as a marker in sepsis therapy.60 In addition, human studies have shown that some antibiotics stimulate the immune system, affecting the synthesis of IL-6 produced by monocytes.61 In our study, however, IL-6 production was observed in fibroblasts, indicating the pro-inflammatory nature of streptomycin in the skin. This observation was confirmed by the level of IL-8. This chemokine, produced by many cells, is the strongest chemotactic factor in humans; it stimulates the migration of immune cells, neutrophil adhesion, histamine release, and angiogenesis. Another cytokine whose level increased under the influence of the antibiotic compared to the control group was MCP-1. This chemokine is produced, among others, in human fibroblasts62 and is one of the key chemokines regulating the migration and infiltration of monocytes/macrophages responsible for immunological processes, as well as for the formation of inflammation.63 Additionally, TIMP-2 is a protein whose increased expression is associated with inflammation; moreover, it is observed during psoriasis and associated skin lesions.64 The antibiotic also significantly increased the level of ICAM-1 compared to the control group after 3 and 6 h. ICAM-1 is associated with severe inflammation,65 and some authors suggest a pro-cancer function of ICAM-1.66 However, ICAM-1 has been shown to promote skin wound healing, and its absence inhibits keratinocyte migration and impairs wound healing.67 Nevertheless, in our studies, high levels of ICAM-1 were observed in healthy cells treated only with antibiotics and AgNPs, but not in the AgNP-GO complex group.
Comparing the effect of the antibiotic and the equivalent AgNP-GO complex due to its antibacterial properties, the complex increased only 8 inflammatory proteins after 3 h and 5 inflammatory proteins after 6 h, compared to the control group. Comparing the effect of the antibiotic and the AgNP-GO complex, after 3 h, only IL-6 and IL-8 showed an increased concentration compared to the cells treated with the antibiotic, although after 6 h, their levels decreased and were close to the control group. The increased levels of IL-6 and IL-8 were probably the effect of GO, which may be related to the pro-angiogenic nature of this nanostructure. IL-8 is associated with angiogenesis,68 while the pro-angiogenic features of GO have been demonstrated in our previous studies.69
Conclusions
Although dermatological antibiotic therapy is a necessary action in many diseases, including bacterial skin infections, it is accompanied by strong activation of inflammation in skin cells, which may be associated with permanent pathological activation of inflammation, leading to cancer. In the conducted research, we obtained a complex of GO encrusted with AgNPs, characterized by high purity and biocompatibility, as well as exposure of oxygen groups on the GO surface. The AgNP-GO complex, applied to a 3D skin model, showed antibacterial efficacy against S. aureus, comparable to that of an antibiotic. Comparing, however, the pro-inflammatory activity of the antibiotic and AgNP-GO, the level of pro-inflammatory cytokines (IL-6, MCP-1, TIMP-2, and ICAM-1) was significantly higher in the epidermis treated with the antibiotic than in the complex. Thus, comparing the antibacterial effect of the antibiotic and AgNP-GO, the mechanism of activity differs, and the action of the AgNP-GO complex is less involved in the activation of the host’s immune system / inflammation.
Acknowledgments
The work is a part of Marlena Zielińska-Górska’s habilitation thesis.
Funding
This research was funded by the National Centre for Research and Development, “Hospitals of the same name” grant number 23/2020.
Disclosure
Dr Marlena Zielińska-Górska, Dr Malwina Sosnowska, MA Agata Lange, Prof Sławomir Jaworski and Prof Tit Ewa Sawosz report a pending patent “A virucidal and biocidal agent”. It’s used especially against SARS-CoV-2, a method of producing a preparation and a protective layer with bactericidal properties’ (application number: P.437795). The authors report no other conflicts of interest in this work.
References
1. Solberg CO. Spread of Staphylococcus aureus in hospitals: causes and prevention. Scand J Infect Dis. 2000;32(6):587–595. doi:10.1080/003655400459478
2. Gordon RJ, Lowy FD. Pathogenesis of methicillin-resistant Staphylococcus aureus infection. Clin Infect Dis. 2008;46(SUPPL. 5):350–359. doi:10.1086/533591
3. Kim JJ, Kristie J, Phd J, et al. Burden of perianal Staphylococcus aureus colonization in nursing home residents increases transmission to healthcare worker gowns and gloves. Cambridge.org. 2020;41:1396–1401. doi:10.1017/ice.2020.336
4. Bukharie H. A review of community-acquired methicillin-resistant Staphylococcus aureus for primary care physicians. J Fam Community Med. 2010;17(3):117–120. doi:10.4103/1319-1683.74320
5. Durán N, Nakazato G, Seabra AB. Antimicrobial activity of biogenic silver nanoparticles, and silver chloride nanoparticles: an overview and comments. Appl Microbiol Biotechnol. 2016;100(15):6555–6570. doi:10.1007/S00253-016-7657-7
6. Liao C, Li Y, Tjong SC. Bactericidal and cytotoxic properties of silver nanoparticles. Int J Mol Sci. 2019;20(2). doi:10.3390/ijms20020449
7. Pugazhendhi A, Prabakar D, Jacob JM, Karuppusamy I, Saratale RG. Synthesis and characterization of silver nanoparticles using Gelidium amansii and its antimicrobial property against various pathogenic bacteria. Microb Pathog. 2018;114:41–45. doi:10.1016/j.micpath.2017.11.013
8. Silver S. Bacterial silver resistance: molecular biology and uses and misuses of silver compounds. FEMS Microbiol Rev. 2003;27(2–3):341–353. doi:10.1016/S0168-6445(03)00047-0
9. Yin IX, J Z, Mei ML, Li Q, Chu CH. The antibacterial mechanism of silver nanoparticles and its application in dentistry. Int J Nanomedicine. 2020;15:2555–2562. doi:10.2147/IJN.S246764
10. You C, Han C, Wang X, et al. The progress of silver nanoparticles in the antibacterial mechanism, clinical application and cytotoxicity. Mol Biol Rep. 2012;39(9):9193–9201. doi:10.1007/S11033-012-1792-8
11. Mohamad EA, Ramadan MA, Mostafa MM, Elneklawi MS. Enhancing the antibacterial effect of iron oxide and silver nanoparticles by extremely low frequency electric fields (ELF-EF) against S. aureus. Electromagn Biol Med. 2023. doi:10.1080/15368378.2023.2208610
12. León-Silva S, Fernández-Luqueño F, López-Valdez F. Silver Nanoparticles (AgNP) in the Environment: a Review of Potential Risks on Human and Environmental Health. Water Air Soil Pollut. 2016;227(9). doi:10.1007/s11270-016-3022-9
13. Zielińska-Górska M, Sawosz E, Sosnowska M, et al. Molecular Biocompatibility of a Silver Nanoparticle Complex with Graphene Oxide to Human Skin in a 3D Epidermis In Vitro Model. Pharmaceutics. 2022;14(7):1398. doi:10.3390/pharmaceutics14071398
14. Yan X, Fang WW, Xue J, et al. Thermoresponsive in Situ Forming Hydrogel with Sol-Gel Irreversibility for Effective Methicillin-Resistant Staphylococcus aureus Infected Wound Healing. ACS Nano. 2019;13(9):10074–10084. doi:10.1021/acsnano.9b02845
15. Zhang Y, Li M, Wang Y, et al. Exosome/metformin-loaded self-healing conductive hydrogel rescues microvascular dysfunction and promotes chronic diabetic wound healing by inhibiting mitochondrial fission. Bioact Mater. 2023;26:323–336. doi:10.1016/j.bioactmat.2023.01.020
16. Huang Y, Mu L, Zhao X, Han Y, Guo B. Bacterial Growth-Induced Tobramycin Smart Release Self-Healing Hydrogel for Pseudomonas aeruginosa-Infected Burn Wound Healing. ACS Nano. 2022;16(8):13022–13036. doi:10.1021/ACSNANO.2C05557
17. Liang Y, Qiao L, Qiao B, Guo B. Conductive hydrogels for tissue repair. Chem Sci. 2023;14(12):3091–3116. doi:10.1039/d3sc00145h
18. Cameron SJ, Hosseinian F, Willmore WG. A current overview of the biological and cellular effects of nanosilver. Int J Mol Sci. 2018;19(7). doi:10.3390/ijms19072030
19. Lange A, Sawosz E, Wierzbicki M, et al. Nanocomposites of Graphene Oxide—Silver Nanoparticles for Enhanced Antibacterial Activity: mechanism of Action and Medical Textiles Coating. Materials. 2022;15(9):3122. doi:10.3390/ma15093122
20. Kurantowicz N, Strojny B, Sawosz E, et al. Biodistribution of a High Dose of Diamond, Graphite, and Graphene Oxide Nanoparticles After Multiple Intraperitoneal Injections in Rats. Nanoscale Res Lett. 2015;10(1). doi:10.1186/S11671-015-1107-9
21. Zou X, Zhang L, Wang Z, Luo Y. Mechanisms of the Antimicrobial Activities of Graphene Materials. J Am Chem Soc. 2016;138(7):2064–2077. doi:10.1021/JACS.5B11411
22. Hegab HM, Elmekawy A, Zou L, Mulcahy D, Saint CP, Ginic-Markovic M. The controversial antibacterial activity of graphene-based materials. Carbon N Y. 2016;105:362–376. doi:10.1016/j.carbon.2016.04.046
23. Wierzbicki M, Jaworski S, Sawosz E, et al. Graphene Oxide in a Composite with Silver Nanoparticles Reduces the Fibroblast and Endothelial Cell Cytotoxicity of an Antibacterial Nanoplatform. Nanoscale Res Lett. 2019;14(1). doi:10.1186/S11671-019-3166-9
24. Sosnowska M, Kutwin M, Strojny B, et al. Graphene oxide nanofilm and chicken embryo extract decrease the invasiveness of HepG2 liver cancer cells. Cancer Nanotechnol. 2021;12(1):1–33. doi:10.1186/s12645-020-00073-5
25. Carpentier G, Henault E Protein Array Analyzer for ImageJ. In: centre de Recherche Public Henri Tudor,
26. Jaworski S, Wierzbicki M, Sawosz E, et al. Graphene oxide-based nanocomposites decorated with silver nanoparticles as an antibacterial agent. Nanoscale Res Lett. 2018;13(1). doi:10.1186/S11671-018-2533-2
27. Li J, Liu C-Y. Ag/graphene heterostructures: synthesis, characterization and optical properties. Eur J Inorg Chem. 2010;(8):1244–1248. doi:10.1002/ejic.200901048
28. Kolwas K, Derkachova A. Impact of the interband transitions in gold and silver on the dynamics of propagating and localized surface plasmons. Nanomaterials. 2020;10(7):1–27. doi:10.3390/nano10071411
29. Bartosewicz B, Michalska-Domanska M, Liszewska M, Zasada D, Jankiewicz BJ. Synthesis and characterization of noble metal-titania core-shell nanostructures with tunable shell thickness. Beilstein J Nanotechnol. 2017;8(1):2083–2093. doi:10.3762/bjnano.8.208
30. Mmaduka Obodo R, Ahmad I, Ifeanyichukwu Ezema F. Introductory Chapter: graphene and Its Applications. Graphene and Its Derivatives. 2019. doi:10.5772/intechopen.86023
31. Ali I, Basheer AA, Mbianda XY, et al. Graphene based adsorbents for remediation of noxious pollutants from wastewater. Environ Int. 2019;127:160–180. doi:10.1016/j.envint.2019.03.029
32. Arias FA, Guevara M, Tene T, et al. The adsorption of methylene blue on eco-friendly reduced graphene oxide. Nanomaterials. 2020;10(4). doi:10.3390/nano10040681
33. Peterson LR, Schora DM. Methicillin-Resistant Staphylococcus aureus Control in the 21st Century: laboratory Involvement Affecting Disease Impact and Economic Benefit from Large Population Studies. J Clin Microbiol. 2016;54(11):2647–2654. doi:10.1128/JCM.00698-16
34. Al Kindi A, Alkahtani AM, Nalubega M, et al. Staphylococcus aureus internalized by skin keratinocytes evade antibiotic killing. Front Microbiol. 2019;10(SEP). doi:10.3389/fmicb.2019.02242
35. Chwalibog A, Sawosz E, Hotowy A, et al. Visualization of interaction between inorganic nanoparticles and bacteria or fungi. Int J Nanomedicine. 2010;5(1):1085–1094. doi:10.2147/IJN.S13532
36. Nicolae-Maranciuc A, Chicea D, Chicea LM. Ag Nanoparticles for Biomedical Applications—Synthesis and Characterization—A Review. Int J Mol Sci. 2022;23(10). doi:10.3390/ijms23105778
37. Saravanan M, Arokiyaraj S, Lakshmi T, Pugazhendhi A. Synthesis of silver nanoparticles from Phenerochaete chrysosporium (MTCC-787) and their antibacterial activity against human pathogenic bacteria. Microb Pathog. 2018;117:68–72. doi:10.1016/j.micpath.2018.02.008
38. Brignoli T, Douglas E, Duggan S, et al. Wall Teichoic Acids Facilitate the Release of Toxins from the Surface of Staphylococcus aureus. Microbiol Spectr. 2022;10(4). doi:10.1128/spectrum.01011-22
39. Li MJ, Liu CM, Cao HB, Zhang Y. Surface Charge Research of Graphene Oxide, Chemically Reduced Graphene Oxide and Thermally Exfoliated Graphene Oxide. Adv Mater Res. 2013;716:127–131. doi:10.4028/www.scientific.net/AMR.716.127
40. Tu Q, Pang L, Chen Y, et al. Effects of surface charges of graphene oxide on neuronal outgrowth and branching. Analyst. 2014;139(1):105–115. doi:10.1039/c3an01796f
41. Romero-Vargas CS, Perreault F, De Faria AF, Elimelech M. Interaction of graphene oxide with bacterial cell membranes: insights from force spectroscopy. Environ Sci Technol Lett. 2015;2(4):112–117. doi:10.1021/acs.estlett.5b00066
42. Jaworski S, Wierzbicki M, Sawosz E, et al. Graphene oxide-based nanocomposites decorated with silver nanoparticles as an antibacterial agent. Nanoscale Res Lett. 2018;13(1):1–17. doi:10.1186/s11671-018-2533-2
43. Kang SJ, Cho S, Kim KH, Cho ES. Proteomic Analysis to Elucidate the Antibacterial Action of Silver Ions Against Bovine Mastitis Pathogens. Biol Trace Elem Res. 2016;171(1):101–106. doi:10.1007/s12011-015-0510-5
44. Khalandi B, Asadi N, Milani M, et al. A Review on Potential Role of Silver Nanoparticles and Possible Mechanisms of their Actions on Bacteria. Drug Res. 2016;67(02):70–76. doi:10.1055/s-0042-113383
45. Anand A, Unnikrishnan B, Wei SC, Chou CP, Zhang LZ, Huang CC. Graphene oxide and carbon dots as broad-spectrum antimicrobial agents-a minireview. Nanoscale Horizons. 2019;4(1):117–137. doi:10.1039/c8nh00174j
46. Marambio-Jones C, Hoek EMV. A review of the antibacterial effects of silver nanomaterials and potential implications for human health and the environment. J Nanoparticle Res. 2010;12(5):1531–1551. doi:10.1007/s11051-010-9900-y
47. Yaqoob AA, Umar K, Ibrahim MNM. Silver nanoparticles: various methods of synthesis, size affecting factors and their potential applications–a review. Appl Nanosci. 2020;10(5):1369–1378. doi:10.1007/s13204-020-01318-w
48. Agere SA, Akhtar N, Watson JM, Ahmed S. RANTES/CCL5 induces collagen degradation by activating MMP-1 and MMP-13 expression in human rheumatoid arthritis synovial fibroblasts. Front Immunol. 2017;8(OCT). doi:10.3389/fimmu.2017.01341
49. Kim YS, Song MY, Park JD, et al. Subchronic oral toxicity of silver nanoparticles. Part Fibre Toxicol. 2010;7. doi:10.1186/1743-8977-7-20
50. Murata S, Kaneko S, Morita E. Interleukin-8 Levels in the Stratum Corneum as a Biomarker for Monitoring Therapeutic Effect in Atopic Dermatitis Patients. Int Arch Allergy Immunol. 2021;182(7):592–606. doi:10.1159/000512965
51. Gonzalo JA, Martinez AC, Springer TA, Gutierrez-Ramos JC. ICAM-1 is required for T cell proliferation but not for anergy or apoptosis induced by Staphylococcus aureus enterotoxin B in vivo. Int Immunol. 1995;7(10):1691–1698. doi:10.1093/intimm/7.10.1691
52. Matsunaga T, Katayama I, Yokozeki H, Nishioka K. ICAM-1 expression on keratinocytes in mechanically-injured skin of a patient with atopic dermatitis. J Dermatol Sci. 1996;12(3):219–226. doi:10.1016/0923-1811(95)00476-9
53. Domenech J, Hernández A, Demir E, Marcos R, Cortés C. Interactions of graphene oxide and graphene nanoplatelets with the in vitro Caco-2/HT29 model of intestinal barrier. Sci Rep. 2020;10(1). doi:10.1038/s41598-020-59755-0
54. Lategan K, Alghadi H, Bayati M, de Cortalezzi MF, Pool E. Effects of graphene oxide nanoparticles on the immune system biomarkers produced by RAW 264.7 and human whole blood cell cultures. Nanomaterials. 2018;8(2). doi:10.3390/nano8020125
55. VanHook AM. Antibiotic-induced inflammation. Sci Signal. 2022;15(745):eade1683. doi:10.1126/scisignal.ade1683
56. Spees AM, Wangdi T, Lopez CA, et al. Streptomycin-induced inflammation enhances Escherichia coli gut colonization through nitrate respiration. MBio. 2013;4(4):430–443. doi:10.1128/mBio.00430-13
57. Tang Q, Precit MR, Thomason MK, et al. Thymidine starvation promotes c-di-AMP-dependent inflammation during pathogenic bacterial infection. Cell Host Microbe. 2022;30(7):961–974.e6. doi:10.1016/j.chom.2022.03.028
58. Anton D, Burckel H, Josset E, Noel G. Three-dimensional cell culture: a breakthrough in vivo. Int J Mol Sci. 2015;16(3):5517–5527. doi:10.3390/ijms16035517
59. Nishimoto N, Kishimoto T. Interleukin 6: from bench to bedside. Nat Clin Pract Rheumatol. 2006;2(11):619–626. doi:10.1038/ncprheum0338
60. Weidhase L, Wellhöfer D, Schulze G, et al. Is Interleukin-6 a better predictor of successful antibiotic therapy than procalcitonin and C-reactive protein? A single center study in critically ill adults. BMC Infect Dis. 2019;19(1). doi:10.1186/s12879-019-3800-2
61. Bailly S, Fay M, Gougerot-Pocidalo MA. Effects of antibiotics on production of cytokines by human monocytes. Pathol Biol. 1993;41(8):64.
62. Li J, Farthing PM, Thornhill MH. Oral and skin keratinocytes are stimulated to secrete monocyte chemoattractant protein-1 by tumour necrosis factor-α and interferon-γ. J Oral Pathol Med. 2000;29(9):438–444. doi:10.1034/j.1600-0714.2000.290904.x
63. Deshmane SL, Kremlev S, Amini S, Sawaya BE. Monocyte chemoattractant protein-1 (MCP-1): an overview. J Interf Cytokine Res. 2009;29(6):313–325. doi:10.1089/jir.2008.0027
64. Fleischmajer R, Kuroda K, Hazan R, et al. Basement membrane alterations in psoriasis are accompanied by epidermal overexpression of MMP-2 and its inhibitor TIMP-2. J Invest Dermatol. 2000;115(5):771–777. doi:10.1046/j.1523-1747.2000.00138.x
65. Bui TM, Wiesolek HL, Sumagin R. ICAM-1: a master regulator of cellular responses in inflammation, injury resolution, and tumorigenesis. J Leukoc Biol. 2020;108(3):787–799. doi:10.1002/JLB.2MR0220-549R
66. Usami Y, Ishida K, Sato S, et al. Intercellular adhesion molecule-1 (ICAM-1) expression correlates with oral cancer progression and induces macrophage/cancer cell adhesion. Int J Cancer. 2013;133(3):568–578. doi:10.1002/ijc.28066
67. Sumagin R, Brazil JC, Nava P, et al. Neutrophil interactions with epithelial-expressed ICAM-1 enhances intestinal mucosal wound healing. Mucosal Immunol. 2016;9(5):1151–1162. doi:10.1038/mi.2015.135
68. Li A, Dubey S, Varney ML, Dave BJ, Singh RK. IL-8 Directly Enhanced Endothelial Cell Survival, Proliferation, and Matrix Metalloproteinases Production and Regulated Angiogenesis. J Immunol. 2003;170(6):3369–3376. doi:10.4049/jimmunol.170.6.3369
69. Wierzbicki M, Hotowy A, Kutwin M, et al. Graphene oxide scaffold stimulates differentiation and proangiogenic activities of myogenic progenitor cells. Int J Mol Sci. 2020;21(11):1–16. doi:10.3390/ijms21114173
 © 2023 The Author(s). This work is published and licensed by Dove Medical Press Limited. The
full terms of this license are available at https://www.dovepress.com/terms
and incorporate the Creative Commons Attribution
- Non Commercial (unported, 3.0) License.
By accessing the work you hereby accept the Terms. Non-commercial uses of the work are permitted
without any further permission from Dove Medical Press Limited, provided the work is properly
attributed. For permission for commercial use of this work, please see paragraphs 4.2 and 5 of our Terms.
© 2023 The Author(s). This work is published and licensed by Dove Medical Press Limited. The
full terms of this license are available at https://www.dovepress.com/terms
and incorporate the Creative Commons Attribution
- Non Commercial (unported, 3.0) License.
By accessing the work you hereby accept the Terms. Non-commercial uses of the work are permitted
without any further permission from Dove Medical Press Limited, provided the work is properly
attributed. For permission for commercial use of this work, please see paragraphs 4.2 and 5 of our Terms.