Back to Journals » Diabetes, Metabolic Syndrome and Obesity » Volume 19
Sex-Specific Basal Metabolic Rate and NAFLD Risk: The Multi-Population Observational and Mendelian Randomization Study
Authors Hu C ![]() , Tao Y, Zhang L, Cheng Z, Sun L, Chen Z
, Tao Y, Zhang L, Cheng Z, Sun L, Chen Z ![]()
Received 28 November 2025
Accepted for publication 5 February 2026
Published 18 February 2026 Volume 2026:19 583771
DOI https://doi.org/10.2147/DMSO.S583771
Checked for plagiarism Yes
Review by Single anonymous peer review
Peer reviewer comments 3
Editor who approved publication: Dr Hillary Keenan
Chunyu Hu, Yuanling Tao, Laixi Zhang, Zhen Cheng, Li Sun, Zongtao Chen
Department of Health Management, The First Affiliated Hospital of Army Medical University (Southwest Hospital), Chongqing, 400038, People’s Republic of China
Correspondence: Zongtao Chen, Department of Health Management, The First Affiliated Hospital of Army Medical University (Southwest Hospital), 30 Gaotanyan Street, Shapingba District, Chongqing, 400038, People’s Republic of China, Tel/Fax +86 023-68765227, Email [email protected]
Background: The impact of basal metabolic rate (BMR) on non-alcoholic fatty liver disease (NAFLD) is still not fully understood, particularly regarding potential sex differences. We aimed to explore population-specific associations using data from health examinations, NHANES 2017– 2020, and genome-wide association studies (GWASs).
Methods: 30,845 Chinese from health examinations and 5019 US adults from NHANES were analyzed. BMR was estimated using the Mifflin-St Jeor equation. Multivariable-adjusted logistic regression and restricted cubic splines (RCS) were applied. To determine the causality, a two-sample MR study was conducted among Europeans using GWASs data for BMR (IEU OpenGWAS) and NAFLD (FinnGen). Odds ratios (ORs) with 95% confidence intervals (CIs) were reported.
Results: In Chinese, ORs (95% CIs) for NAFLD across ascending quartile groups of BMR were 1 (reference), 1.17 (1.03– 1.33), 1.83 (1.60– 2.09), and 5.98 (4.92– 7.28). The corresponding ORs (95% CIs) were 2.00 (1.67– 2.39), 2.71 (2.24– 3.29), and 4.91 (3.97– 6.10) for males, and 1.64 (1.41– 1.92), 1.93 (1.64– 2.27), and 4.04 (3.41– 4.81) for females. In the NHANES, weighted ORs (95% CIs) for NAFLD across quartile groups were 1 (reference), 1.84 (0.95– 3.54), 4.98 (2.28– 10.89), and 16.10 (6.69– 38.72), with similar associations across sexes. Significant sex differences in BMR-NAFLD associations (P for interaction < 0.05) were observed in the Chinese, but not in the US population. RCS revealed nonlinear dose-response relationships in both sexes within the Chinese population. Two-sample MR confirmed a causal effect with OR (95% CI) of 1.59 (1.24– 2.03).
Conclusion: A higher BMR is an independent and causally relevant risk factor for NAFLD. The observed sex effect modification in the Chinese population suggests that population-specific management strategies may be warranted.
Keywords: basal metabolic rate, non-alcoholic fatty liver disease, sex-specific, Mendelian randomization
Introduction
As one of the most common causes of chronic liver disease, non-alcoholic fatty liver disease (NAFLD) has affected about 30% of the population worldwide.1 The characteristic of NAFLD is excessive lipid accumulation in liver cells, accompanied by insulin resistance (IR), and it occurs without excessive alcohol consumption.2 NAFLD is influenced by energy metabolism and closely associated with metabolic diseases such as obesity, type 2 diabetes (T2DM), and dyslipidemia.3 Notably, the magnitude of the role of these factors in NAFLD development varies by sex.4 NAFLD can progress from isolated hepatic steatosis to hepatocellular carcinoma and is an independent risk factor for cardiovascular disease (CVD).5,6 Early identification and effective control of NAFLD risk factors are beneficial for reducing its global burden and promoting population health.7
Abnormal energy metabolism is detrimental to the liver system and critical in human health and physiology throughout the life course.8 Basal metabolic rate (BMR) is the daily energy expenditure needed to maintain essential bodily functions while at rest and awake.9 In humans, BMR typically accounts for about 60% to 70% of total daily energy expenditure and plays a crucial role in maintaining energy balance.10 Energy expenditure is directly linked to T2DM, with a noticeable increase in BMR accompanying the progression of IR,11,12 even in relatively healthy (non-T2DM) obese US adults.13 Hypertension is also associated with elevated BMR.14 Additionally, BMR is regarded as a predictor of mortality15 and has garnered attention in the context of metabolic diseases, CVDs, and cancers.16,17 Given the complex interplay between metabolic syndrome and NAFLD, further clarification of the association between BMR and NAFLD is crucial. Elevated BMR may correlate with systemic inflammation, IR, and metabolic stress. Pro-inflammatory cytokines such as TNF-α, IL-6, and IL-1β induce adaptive thermogenesis to elevate basal energy expenditure.18 Observational studies showed that IR impairs glucose disposal, disrupts adipose lipolysis, perturbs energy balance, and further modulates BMR.19 Metabolic stress from IR and inflammation may upregulate BMR as a compensatory mechanism, potentially exacerbating metabolic dysregulation in NAFLD.20,21
Current clinical research on the BMR-NAFLD relationship is limited, with its causal nature remaining unclear. This paucity of studies hinders the development of metabolism-driven risk stratification and targeted preventive strategies for NAFLD. Moreover, the impact of BMR on NAFLD risk may exhibit sexual dimorphism owing to differences in body composition and lifestyle. In terms of body composition, the Chinese population exhibits a higher prevalence of abdominal obesity at lower body mass index (BMI) compared to Western cohorts, a trait linked to altered energy metabolism and heightened NAFLD susceptibility.22 Additionally, higher muscle mass tends to elevate BMR while potentially reducing NAFLD risk, whereas increased adiposity may exacerbate NAFLD.23,24 Regarding lifestyle factors, disparities in dietary fat intake patterns and physical activity levels further modulate basal energy expenditure and hepatic lipid accumulation, with sedentary habits worsening NAFLD risk via the mediation of inflammatory markers.25 Collectively, these factors shape the potential interplay between BMR and NAFLD, underscoring the value of our multi-population analysis and the role of lifestyle interventions in NAFLD management.
Mendelian randomization (MR) analyses, as a complementary approach to randomized controlled trials (RCTs), have been widely implemented to evaluate the causal nature using genetic variables as instrumental variables (IVs). Due to the random assignment of genetic variation during gametogenesis, the MR approach minimizes biases from confounding and reverse causality that often affect observational studies.26 Leveraging large-scale genome-wide association study (GWAS) summary statistics, MR design provides a time- and resource-efficient alternative to RCTs.
In the present analysis, we conducted an observational study to assess the population-specific relationship between BMR and NAFLD and verify the cross-ethnic generalizability using data from the Chinese health examinations and the National Health and Nutrition Examination Survey (NHANES) 2017–2020. Subsequently, we performed a two-sample MR analysis to investigate its causal association.
Materials and Methods
Study Population
A total of 58,040 Chinese participants who underwent health check-ups and completed abdominal ultrasonography via online appointments between 2015 and 2023 were initially accessed through the electronic health record database from the Department of Health Management. The study was approved by the Ethics Committees of the First Affiliated Hospital of Army Medical University (No. [A]KY202227). All participants provided written informed consent. Exclusion criteria were as follows: (1) age <18 years (n = 48); (2) pregnancy (n=1563); (3) multiple records (retaining only the first, n=3205); (4) presence of serious diseases (chronic hepatitis, cirrhosis, cancer, or cardiovascular diseases) (n=3354); (5) daily alcohol consumption (n = 16,852); (6) missing BMR information (n = 2173).
NHANES, organized by the National Center for Health Statistics (NCHS), employs a stratified, multistage probability cluster design to evaluate the health status of individuals living in communities across the United States. The program includes cross-sectional surveys that gather data on socio-demographics, anthropometric measurements, health and nutrition questionnaires, and laboratory tests. A total of 15,560 individuals from the 2017–March 2020 cycle were initially considered. NHANES protocols were approved by the NCHS Research Ethics Review Board, with informed consent obtained from all participants. The study included participants who were enrolled in the NHANES Mobile Examination Center (n = 14,300) and authorized for elastography measurements using FibroScan 502 Touch (Echosens, Paris, France).27 Exclusion criteria were as follows: (1) age <20 years (n = 5756); (2) pregnancy (n = 87); (3) hepatitis B (hepatitis B surface antigen positive) or hepatitis C (positive for hepatitis C antibodies or RNA) (n = 229); (4) serious diseases (cancer or cardiovascular diseases) (n = 1685); (5) high-risk alcohol use (≥3 drinks/day for females, ≥4 drinks/day for males)28 (n = 1164); (6) missing BMR information (n = 82); (7) ineligible or partial elastography results (n = 232); and (8) cryptogenic cirrhosis (n = 46).
Finally, 30,845 Chinese participants (9856 males and 20,989 females) from health examination data (Figure 1A) and 5019 US participants (2350 males and 2669 females) from NHANES (Figure 1B) were included for subsequent analysis.
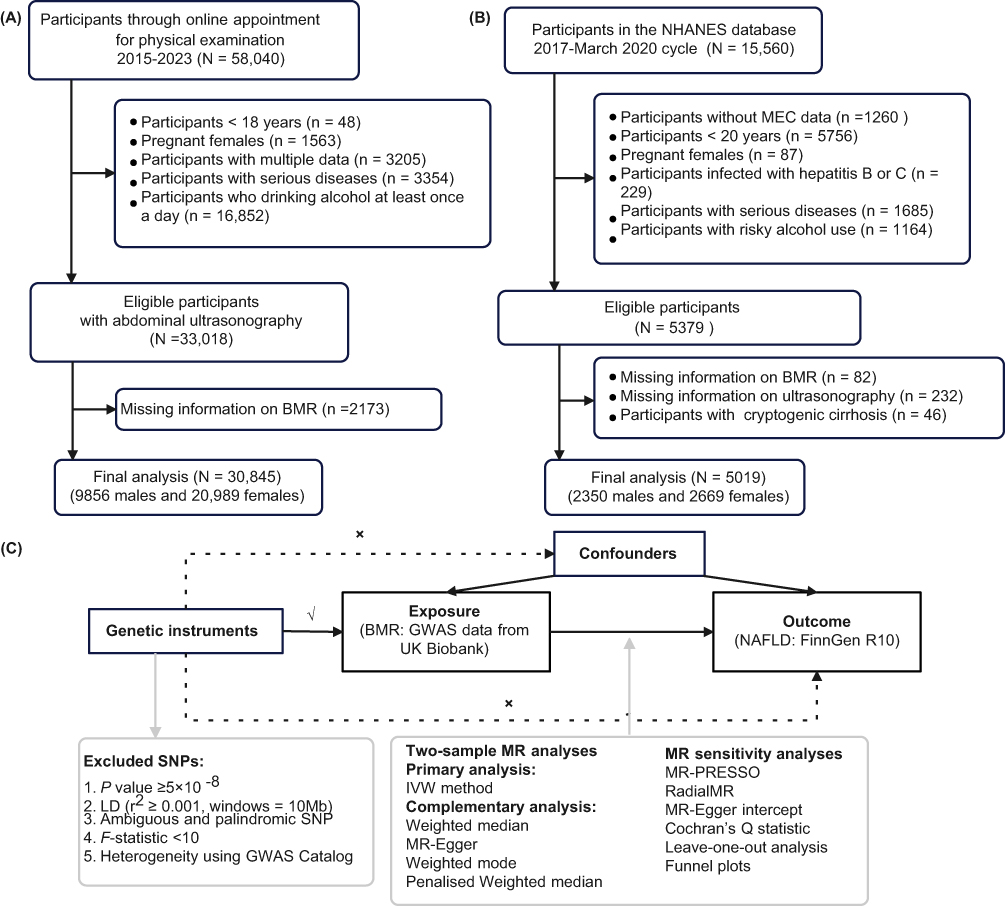 |
Figure 1 Study flow diagram. (A) Participant selection from health examination datasets; (B) Inclusion and exclusion criteria for NHANES 2017–2020 participants; (C) Schematic overview of the Mendelian randomization (MR) study design. |
BMR Assessment
BMR refers to the amount of energy expended by the body at rest, both physically and psychologically, after a night’s sleep, measured in an awake state without prior physical activity, 10 hours after the last meal, and in a neutral environment.13,29 Measurement via indirect calorimetry requires strict control of pre- and intra-test factors (eg, medication, food intake, temperature, time of day), limiting its practical use.30 Consequently, predictive equations based on individual characteristics (height, weight, sex) have been developed, with the Mifflin-St Jeor equation31 demonstrating high accuracy and widespread use in clinical and research settings. Body weight (kg) and height (cm) of physical examination participants were measured using an automatic weighing scale (SK-X80). Weight was measured with participants in light clothing and barefoot, and recorded to the nearest 0.1 kg; height was measured with participants standing upright, heels together, and recorded to the nearest 0.1 cm. BMR in this study was subsequently calculated using the equation, with separate formulas for males and females.


BMR was then stratified into quartile groups, with the lowest quartile as the reference.
NALFD Ascertainment
For the Chinese health examination population, NAFLD was diagnosed by experienced sonographers via abdominal ultrasonography, excluding individuals with excessive alcohol consumption. Diagnosis followed 2002 criteria from the Fatty Liver and Alcoholic Liver Disease Group of the Chinese Medical Association’s Hepatology Branch:32 (1) punctate hyperechogenicity of liver parenchyma; (2) echo attenuation in deep liver tissue; (3) indistinct intrahepatic blood vessels. A confirmed diagnosis required criterion (1) plus either (2) or (3). For the NHANES population, NAFLD was evaluated using vibration-controlled transient elastography (VCTE), which measures ultrasound attenuation and records the controlled attenuation parameter (CAP) as an indicator of hepatic fat content. NAFLD was defined according to the criteria reported in recent epidemiological studies.33,34 Briefly, NAFLD was defined as CAP scores of ≥ 302 dB/m.33,34 Participants with CAP between 274 and 302 dB/m were considered non-NAFLD, unless their liver stiffness measurement (LSM) exceeded 8.2 kPa (borderline steatosis). Individuals with cryptogenic cirrhosis (LSM >13.6 kPa but CAP <302 dB/m) were excluded.35
Covariates Definition
Covariates considered varied slightly between the two populations owing to differences in data availability and population-specific attributes. For the Chinese health examination data, current smokers are described as those who have smoked at least one cigarette daily for ≥12 months. Work-related physical activity was categorized into sedentary (prolonged sitting/typing/reading), light (standing/walking without strenuous exertion), or moderate-to-vigorous (regular heavy labor, eg, lifting/carrying) levels based on self-report questionnaires. Overweight/obesity was defined as BMI ≥24 kg/m2. Individuals with systolic/diastolic blood pressure (SBP/DBP) ≥140/90 mmHg or those who use antihypertensive medication are divided as patients with hypertension. Diabetes is diagnosed with a fasting blood glucose level ≥126 mg/dL, or if the patient is currently undergoing antidiabetic treatment. Dyslipidemia is established by one or more of the following criteria: total cholesterol (TC) ≥240 mg/dL, triglycerides (TG) ≥ 200 mg/dL, low-density lipoprotein cholesterol (LDL-C) ≥160 mg/dL, high-density lipoprotein cholesterol (HDL-C) <40 mg/dL, or the use of lipid-lowering medication.
For NHANES, participants who had smoked ≥100 cigarettes in their lifetime were classified as current smokers if they reported smoking “some days” or “every day,” as former smokers if they reported smoking “not at all,” and as never smokers otherwise. Physical activity levels were calculated by summing the weekly duration of each work and recreational activity multiplied by each metabolic equivalent (MET), then categorized into <600, 600–1200, and ≥1200 MET-min/week.36 Overweight/obesity was defined as BMI ≥25 kg/m2. Diabetes was diagnosed as fasting plasma glucose ≥126 mg/dL or HbA1c ≥6.5%. SBP and DBP were calculated as the mean of all available measurements, with hypertension and dyslipidemia defined using the same criteria as in the health examination data.
GWAS Sources and IVs Selection
To explore the causality between BMR and NAFLD, we obtained summary statistics from public databases (Figure 1C). All original studies were approved by the respective institutional review boards with informed consent of all participants. No additional ethical approval was required. The study was reported following the STROBE-MR.37
GWAS data of BMR (534,045 European participants) were accessed via the IEU OpenGWAS project (ebi-a-GCST90029025),38 with BMR measured on a standard deviation (SD) scale. GWAS summary statistics for NAFLD were from the FinnGen Biobank (Release 10), including 412,181 participants (2568 cases and 409,613 controls). BMR and NAFLD datasets had no overlapping samples to avoid bias and ensure a low type 1 error rate.
In two-sample MR, genetic variants must fulfill three core assumptions: (1) robust association with exposure (relevance); (2) independence from confounders (independence); (3) no effect on outcome except via exposure pathway (exclusion restriction).26 We selected single-nucleotide polymorphisms (SNPs) strongly associated with BMR (P < 5×10⁻8), ensured their independence through clumping (r2 < 0.001, window = 10 Mb), and excluded weak instruments (F-statistic < 10). F-statistics were calculated as F = R2 × (N − 2)/(1 − R2), where  represents the proportion of the variability of the exposure explained by IVs.39 MAF means minor allele frequency, and N represents the sample size of the GWAS for BMR. β and SE represent the effect size and standard error of the SNP-BMR association, respectively. Additionally, the GWAS Catalog40 was screened to exclude SNPs (P <5×10⁻⁸) significantly related to potential confounders (drinking, smoking, coronary artery disease, stroke) and other NAFLD-related traits. Ambiguous and palindromic SNPs were removed during harmonization. For the outcome dataset lacking specific SNPs, proxies in strong LD (r2 = 0.8) were used.
Statistical Analysis
The basic characteristics of the overall population were outlined separately by sex. For health examination data, continuous variables were analyzed using ANOVA or t-tests, while categorical variables were examined with Chi-squared tests or Fisher’s exact tests. In the NHANES data, weighted generalized linear regression and weighted Chi-squared tests were utilized to compare subjects with non-NAFLD and those with NAFLD. Mean BMR (with standard error) across age groups was calculated and plotted for the overall population and sex subgroups to illustrate distribution and trends.
Logistic regression models adjusted for multiple variables were employed to calculate sex-specific odds ratios (ORs) with 95% confidence intervals (CIs) for the relationship between BMR and NAFLD in both populations. To explore potential nonlinearity, trend P-values were calculated using group medians as a continuous variable. Three models were used in this study. For the health examination data, Model 1 adjusted for age, sex, and year of physical examination, as appropriate. Model 2 added race/ethnicity (Han Chinese or others), marital status (married/cohabiting or divorced/single), smoking status (never, former, or current smoking), and work-related physical activity (sedentary, light, or moderate-to-vigorous categories). Model 3 further adjusted for cardiometabolic factors, including overweight/obesity, hypertension, diabetes, and dyslipidemia. In the NHANES analysis, appropriate weights were applied. Model 1 was adjusted for age and sex; Model 2 further considered race (Hispanic, Non-Hispanic White, Non-Hispanic Black, Non-Hispanic Asian, or others), marital status, education level (high school or above, others), smoking status, physical activity level, and poverty income ratio; Model 3 additionally added the above-mentioned cardiometabolic factors. To further investigate the nonlinear and dose-response relationships, we employed restricted cubic spline (RCS) logistic regression. Subgroup analyses were conducted, utilizing likelihood ratio tests to compare models with and without multiplicative interaction terms.
Sensitivity analyses were conducted to bolster the robustness of the results. The analyses included: (1) regrouping BMR by tertiles; (2) calculating BMR using the Harris-Benedict equation. For male,  for female,
  and (3) defining NAFLD with a CAP cutoff of 285 dB/m, which has 80% sensitivity and 77% specificity, and was validated to detect hepatic steatosis in the US population.41
In two-sample MR analysis, we applied inverse variance weighted (IVW) as the principal method to assess the causal association of genetically predicted BMR and NAFLD risk. Four complementary MR analysis methods were used, including weighted median, MR Egger, weighted mode, and penalised weighted median, to validate the results. If heterogeneity exists, IVW with the outliers correction was used as the primary result. MR-PRESSO,42 RadialMR method,43 MR-Egger intercept, Cochran’s Q statistic, and leave-one-out analysis were used for sensitivity analyses. We obtained estimates without evidence of horizontal pleiotropy bias (MR-PRESSO global P > 0.05, also MR-Egger intercept P >0.05). We utilized Cochran’s Q test to assess IV heterogeneity, with a P-value >0.05 indicating no heterogeneity. Scatter, forest, and funnel plots were depicted to determine whether the results were driven by individual variants. The statistical power of the MR estimates was calculated using the online tool (https://sb452.shinyapps.io/power/).44
All analyses were accomplished using R software, version 4.2.1 (R Foundation for Statistical Computing). A 2-tailed P < 0.05 was regarded as statistically significant.
Results
Basic Characteristics
Basic characteristics of participants from different populations were presented separately. Among the 30,845 Chinese participants included in the study, 9856 (32.0%) were male, with a mean age of 40.1 years. The overall prevalence of NAFLD was 17.1%, with rates of 31.4% in males and 10.4% in females. Those with NAFLD were older, predominantly male, had higher smoking rates (males only), and poorer cardiometabolic health (higher rates of overweight/obesity, hypertension, diabetes, dyslipidemia) (Table S1).
In NHANES, 1,431 participants had NAFLD (using a CAP cutoff of 302 dB/m), and 3,588 did not. NAFLD individuals were older, mostly male (weighted 57.30%), with lower high-intensity physical activity, higher BMI, SBP, fasting glucose, TG, and elevated liver markers (GGT, AST, ALT, ALP, median stiffness, median CAP) (Table S2). NAFLD prevalence was higher in males, and those with NAFLD had higher BMR across both populations.
BMR trends across 10-year age groups (stratified by sex and NAFLD status) showed that NAFLD individuals had higher BMR (especially males) in both populations (Figure 2A and B). BMR decreased with age; the Chinese population had lower BMR overall, with an earlier age of decline.
 |
Figure 2 Trends of mean BMR values by gender and NAFLD status among Chinese (A) and US adults (B) across different age groups. |
Sex-Specific Association Between BMR and NAFLD
BMR was evaluated as both a continuous and categorical variable to assess its association with NAFLD risk (Figure 3). In Chinese health examination data, BMR was positively linked to NAFLD in the total population and by sex. Multivariable-adjusted ORs (95% CIs) for ascending BMR quartiles (vs lowest) were 1.17 (1.03–1.33), 1.83 (1.60–2.09), and 5.98 (4.92–7.28) (P for trend <0.05). Each 1-SD increase in BMR correlated with a 217% higher NAFLD risk, with the OR (95% CI) of 3.17 (2.93–3.43). In males, the corresponding ORs (95% CIs) were 2.00 (1.67–2.39), 2.71 (2.24–3.29), and 4.91 (3.97–6.10). In females, the corresponding ORs (95% CIs) were 1.64 (1.41–1.92), 1.93 (1.64–2.27), and 4.04 (3.41–4.81). Sensitivity analyses had no substantial influence on the original results (Table S3). Notably, the magnitude of association between BMR and NAFLD showed significant sex differences (P for interaction <0.05) when BMR was divided into tertile groups but not quartile groups, indicating a modification effect of sex. The RCS analysis revealed nonlinear dose-response relationships in both sexes (P for nonlinear <0.05, Figure 4A and B).
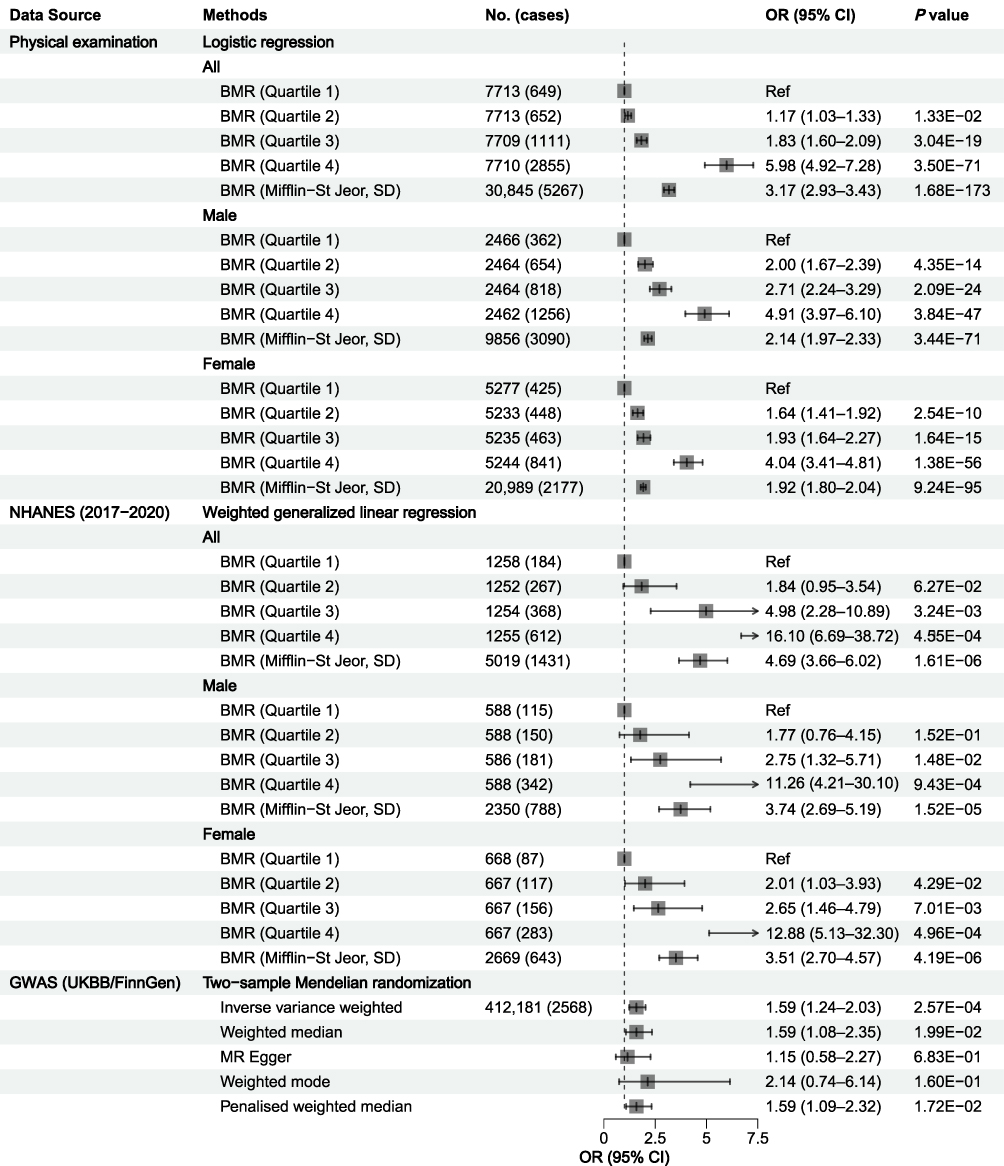 |
Figure 3 Association between BMR and NAFLD using the observational study and two-sample MR analysis. Effect sizes are on the OR per 1-SD unit increase in BMR for MR analysis. |
 |
Figure 4 Sex-specific association between BMR and NAFLD in a restricted cubic spline analysis. (A) Male participants, Chinese health examination data; (B) Female participants, Chinese health examination data; (C) Male participants, NHANES 2017–2020 data; (D) Female participants, NHANES 2017–2020 data. |
In NHANES 2017–2020, the results mirrored those of the health examination data. Weighted ORs (95% CIs) for BMR quartiles (vs lowest) were 1.84 (0.95–3.54), 4.98 (2.28–10.89), and 16.10 (6.69–38.72) (P for trend <0.05). Per 1-SD BMR increase, the OR (95% CI) was 4.69 (3.66–6.02). Sensitivity analyses, including the use of an alternative CAP cutoff of 285 dB/m to define NAFLD, did not significantly alter these results (Table S4). In the top quartile group of BMR, the risk of NAFLD was the highest, with OR (95% CI) of 11.26 (4.21–30.10) in males and 12.88 (5.13–32.30) in females, with no significant sex discrepancies (P for interaction >0.05). No evidence of nonlinear dose-response relationships was found between BMR and NAFLD in either sex (P for nonlinear >0.05, Figure 4C and D).
In the sex-specific subgroup, BMR-NAFLD associations were consistent across hypertension, diabetes, and dyslipidemia subgroups for the Chinese health examination population. A notable interaction effect was observed between BMR and overweight/obesity (P for interaction <0.05). In females but not males, a significant interaction effect between BMR and age was noted (Table S5). In US participants, associations were consistent across age, diabetes, and dyslipidemia subgroups. There was also a marked interaction effect between BMR and overweight/obesity (P for interaction <0.05). In females but not males, a significant interaction effect between BMR and hypertension was observed (Table S6).
Causal Association Between BMR and NAFLD
Given the significant positive correlation between BMR and NAFLD risk observed in multivariable regression analyses, we further conducted MR analysis to infer causal effects (Figure 3). After excluding ambiguous, palindromic, unavailable SNPs, and those with potential confounding, as well as F-statistics <10, 466 SNPs for BMR were retained for causality analysis (Table S7).
Genetically predicted BMR showed a positive relationship with the NAFLD risk, with the OR (95% CI) of 1.51 (1.17–1.96), corresponding to a 51% increase in NAFLD risk per 1-SD increment in BMR. Little evidence of pleiotropy was found (P = 3.11E-01), but some heterogeneity among the individual SNP effects was observed (P = 9.32E-04). We therefore used causal effects after correcting outliers as final estimates. After removing 33 outliers identified by RadialMR (Table S7 and Figure S1), genetically predicted BMR remained positively associated with NAFLD risk, with the OR (95% CI) of 1.59 (1.24–2.03). These results aligned with other complementary MR methods in both direction and magnitude of causal estimates (Figure S2). Notably, no significant evidence of horizontal pleiotropy (MR-Egger test, MR-PRESSO global test) or heterogeneity was detected in individual instrument effects after outlier corrections (all P >0.05). Funnel plot symmetry supported this finding (Figure S3). Leave-one-out analysis further confirmed that no single SNP drove the causal relationship between BMR and NAFLD (not depicted). The statistical power of MR estimates for BMR and NAFLD based on the IVW methods was 96%. These results thus affirm the robustness and trustworthiness of our findings.
Discussion
We integrated observational data from health examinations and NHANES 2017–2020 with two-sample MR analysis to explore the BMR-NAFLD relationship. Our findings revealed higher BMR in NAFLD patients than in non-NAFLD individuals in both the Chinese and US populations. Moreover, NAFLD risk increased with BMR, with distinct sex differences observed in China but not the US. Among Chinese participants, nonlinear dose-response relationships were depicted in both sexes. Besides, the two-sample MR method further confirmed the causal effect of BMR on NAFLD, suggesting BMR as a candidate modifiable factor for NAFLD.
BMR exhibits distinct population-specific patterns, with lower values observed in the Chinese population compared to the US population (males: 1540.5 vs 1746.25 kcal/day; females: 1169.9 vs 1336.75 kcal/day), likely driven by differences in body composition and metabolic status. In Bangladeshi adult students, males had a higher BMR (1543 kcal/day) than females (1234 kcal/day), due to greater fat-free mass in males.45 Similarly, Singaporean adults showed a strong correlation between lean body mass and BMR (r = 0.87), linking lean mass energy demand to BMR.46 Pathological conditions also alter BMR levels. In patients with T2DM and peripheral neuropathy, BMR showed a positive correlation with insulin resistance (HOMA-IR: r=0.913) and visceral fat (r=0.332), reflecting metabolic adaptations to hyperglycemia and adipose tissue dysfunction.47 In obesity-related NAFLD, BMR was predicted by spleen length and interleukin-16 (both linked to hepatic growth factor), which links immune-metabolic crosstalk to BMR regulation.48 Taken together, BMR is not merely affected by body size but is a marker of underlying metabolic perturbations.
Subgroup analyses revealed that the associations between BMR and NAFLD were modified by age, overweight/obesity, and hypertension, with population- and sex-specific patterns, underscoring the need for stratified assessment. Specifically, a significant modification effect of overweight/obesity was observed among the Chinese and US populations in both sexes. In Chinese but not US adults, the positive association was more pronounced in elderly females (≥60 years) but not males, suggesting a sex-specific effect pattern with advancing age. Similar sex-specific patterns exist for other health outcomes. In Korean adults, a higher energy intake-to-BMR ratio reduced sarcopenia risk across ages, but strength exercise protected only males under 50 years.49 In Southern Chinese adults, the inverse association of BMR with all-cause mortality was restricted to elderly males (≥60 years).50 The observed sex- and population-specific BMR-NAFLD associations are driven by sex-based and population-level metabolic and epidemiological disparities. Sex differences in the Chinese likely stem from distinct body composition, hormonal regulation of energy metabolism, and age-related NAFLD susceptibility. Population variations derive from basal BMR differences, divergent NAFLD phenotypes, and metabolic risk profiles. Obesity-dominated dysregulation in the US may mask sex-specific patterns, which are more pronounced in the Chinese with distinct anthropometric and epidemiological features. These findings confirm that BMR’s clinical relevance is context-dependent, requiring targeted analyses for robust inference.
As research on metabolic diseases advances, our understanding of the BMR-NAFLD risk relationship continues to deepen. An MR analysis revealed a causal link between BMR and cardiometabolic factors.51 Specifically, genetically determined higher BMR was associated with an increased BMI, lower HDL-C, higher TG, waist circumference, and elevated glycated hemoglobin. Our findings from health examinations and NHANES 2017–2020 complemented the evidence, showing significantly higher BMR in NAFLD patients. Beyond observational data, two-sample MR clarified the causal relationship, broadening our understanding of BMR’s positive causal effect on NAFLD based on European population data. The reliability of this association was confirmed by consistent outcomes from complementary MR and sensitivity analyses.
Several mechanisms could explain this association. First, elevated BMR is associated with a pro-inflammatory state,52 and chronic inflammation is a key driver of NAFLD progression.48,53 Second, a higher BMR necessitates greater energy intake, and dietary patterns that support a high metabolic rate may contribute to liver fat accumulation.54–56 Third, at the cellular level, increased energy expenditure can lead to mitochondrial dysfunction and oxidative stress, contributing to the pathogenesis of NAFLD by promoting lipid accumulation and liver cell damage.57–59
The key strength of this study lies in integrating observational studies from the health examination and NHANES 2017–2020 data with the MR approach. Both methods yielded nearly consistent results in this study, which enhances the reliability of our findings. However, several limitations should be noted. First, despite controlling for relevant covariates, residual or unmeasured confounding (eg, energy intake) may persist, though adjustment for proxies (physical activity, BMI) mitigated bias. Second, findings only address the impact of higher BMR on NAFLD, not the potential effect of short-term BMR reduction in clinical practice, requiring further validation via laboratory and clinical research. Third, due to the limited NAFLD-associated significant variants, reverse MR between BMR and NAFLD was not feasible. Finally, potential misclassification and cross-population result comparability issues should be acknowledged. NAFLD diagnosis in the Chinese dataset relies on ultrasound, a qualitative assessment, which may lead to underestimation of mild hepatic steatosis. In contrast, NHANES employs the CAP, a quantitative measure that can be confounded by BMI, thereby introducing population-specific measurement biases. Importantly, the consistent positive BMR-NAFLD association observed across both populations, despite these differential misclassification risks and divergent assessment modalities, further underscores the robustness of our core findings.
Conclusions
This study identifies higher BMR as an independent risk factor for NAFLD in general populations. In Chinese but not US adults, the positive BMR-NAFLD association was more pronounced in elderly females (≥60 years) versus males, highlighting the need for stratified management. We further confirm that overweight/obesity is a key modifier of the BMR-NAFLD association, with consistent effects across Chinese and US populations of both sexes. Further research is warranted to elucidate the underlying pathogenic mechanisms.
Abbreviations
BMR, basal metabolic rate; NAFLD, non-alcoholic fatty liver disease; NHANES, National Health and Nutrition Examination Survey; GWAS, genome-wide association studies; MR, Mendelian randomization; IVs, instrumental variables; OR, odds ratio; CI, confidence interval; IR, insulin resistance; T2D, type 2 diabetes; RCTs, randomized controlled trials; VCTE, vibration-controlled transient elastography; CAP, controlled attenuation parameter; CVD, cardiovascular disease; LSM, liver stiffness measurements; BMI, body mass index; SBP, systolic blood pressure; DBP, diastolic blood pressure; TC, total cholesterol; TG, triglyceride; LDL-C, low-density lipoprotein cholesterol; HDL-C, high-density lipoprotein cholesterol; MET, metabolic equivalent.
Data Sharing Statement
Datasets from the health examinations during the present study are not publicly available but are available from the corresponding author on reasonable request. NHANES datasets (https://wwwn.cdc.gov/nchs/nhanes/default.aspx) and the GWAS files (https://gwas.mrcieu.ac.uk/datasets/; https://risteys.finngen.fi/) are publicly available for download.
Ethics Approval and Consent to Participate
The study was approved by the Ethics Committees of the First Affiliated Hospital of Army Medical University (No. [A]KY202227). The protocols of the NHANES study were authorized by the Research Ethics Review Board of NCHS. Informed consent was obtained from all participants. All MR analyses were based on publicly available summary statistics, which do not require ethical approval and consent.
Acknowledgments
We sincerely thank all participants and projects (NHANES, UK Biobank, and FinnGen) for their contributions.
Author Contributions
Chunyu Hu: Software, Methodology, Formal analysis, Visualization, Writing – original draft, Writing – review & editing, Funding acquisition. Yuanling Tao: Methodology, Writing – review & editing. Laixi Zhang: Investigation, Writing – review & editing. Zhen Cheng: Resources, Data curation, Writing – review & editing. Li Sun: Resources, Data curation, Writing – review & editing. Zongtao Chen: Conceptualization, Writing – review & editing, Project administration. All authors gave final approval of the version to be published; have agreed on the journal to which the article has been submitted; and agree to be accountable for all aspects of the work.
Funding
This work was supported by the Medical Research Project of Chongqing Health Commission (Grant No. 2025WSJK100).
Disclosure
The authors declare no conflict of interest.
References
1. Feng G, Valenti L, Wong VW. et al. Recompensation in cirrhosis: unravelling the evolving natural history of nonalcoholic fatty liver disease. Nat Rev Gastroenterol Hepatol. 2024;21(1):46–13. doi:10.1038/s41575-023-00846-4
2. Lee KC, Wu PS, Lin HC. Pathogenesis and treatment of non-alcoholic steatohepatitis and its fibrosis. Clin Mol Hepatol. 2023;29(1):77–98. doi:10.3350/cmh.2022.0237
3. Dewidar B, Mastrototaro L, Englisch C, et al. Alterations of hepatic energy metabolism in murine models of obesity, diabetes and fatty liver diseases. EBioMedicine. 2023;94:104714. doi:10.1016/j.ebiom.2023.104714
4. Lonardo A, Nascimbeni F, Ballestri S, et al. Sex Differences in Nonalcoholic Fatty Liver Disease: state of the Art and Identification of Research Gaps. Hepatology. 2019;70(4):1457–1469. doi:10.1002/hep.30626
5. Mantovani A, Csermely A, Petracca G, et al. Non-alcoholic fatty liver disease and risk of fatal and non-fatal cardiovascular events: an updated systematic review and meta-analysis. Lancet Gastroenterol Hepatol. 2021;6(11):903–913. doi:10.1016/S2468-1253(21)00308-3
6. Powell EE, Wong VW, Rinella M. Non-alcoholic fatty liver disease. Lancet. 2021;397(10290):2212–2224. doi:10.1016/S0140-6736(20)32511-3
7. Huang DQ, El-Serag HB, Loomba R. Global epidemiology of NAFLD-related HCC: trends, predictions, risk factors and prevention. Nat Rev Gastroenterol Hepatol. 2021;18(4):223–238. doi:10.1038/s41575-020-00381-6
8. Pontzer H, Yamada Y, Sagayama H, et al. Daily energy expenditure through the human life course. Science. 2021;373(6556):808–812. doi:10.1126/science.abe5017
9. Henry CJ. Basal metabolic rate studies in humans: measurement and development of new equations. Public Health Nutr. 2005;8(7a):1133–1152. doi:10.1079/PHN2005801
10. Shetty P. Energy requirements of adults. Public Health Nutr. 2005;8(7a):994–1009. doi:10.1079/PHN2005792
11. Alawad AO, Merghani TH, Ballal MA. Resting metabolic rate in obese diabetic and obese non-diabetic subjects and its relation to glycaemic control. BMC Res Notes. 2013;6(1):382. doi:10.1186/1756-0500-6-382
12. Weyer C, Bogardus C, Pratley RE. Metabolic factors contributing to increased resting metabolic rate and decreased insulin-induced thermogenesis during the development of type 2 diabetes. Diabetes. 1999;48(8):1607–1614. doi:10.2337/diabetes.48.8.1607
13. Guo H, Duolikun D, Yao Q. Associations between basal metabolic rate and insulin resistance in non-diabetic obese adults: evidence from NHANES 2011–2018. Int J Diabetes Dev Countries. 2023;43(6):946–954. doi:10.1007/s13410-023-01190-8
14. Pedrianes-Martin PB, Perez-Valera M, Morales-Alamo D, et al. Resting metabolic rate is increased in hypertensive patients with overweight or obesity: potential mechanisms. Scand J Med Sci Sports. 2021;31(7):1461–1470. doi:10.1111/sms.13955
15. Nestor MS, Ablon G, Gade A, Han H, Fischer DL. Treatment options for androgenetic alopecia: efficacy, side effects, compliance, financial considerations, and ethics. J Cosmet Dermatol. 2021;20(12):3759–3781. doi:10.1111/jocd.14537
16. Zhao P, Han F, Liang X, et al. Causal Effects of Basal Metabolic Rate on Cardiovascular Disease: a Bidirectional Mendelian Randomization Study. J Am Heart Assoc. 2024;13:e031447. doi:10.1161/JAHA.123.031447
17. Kliemann N, Murphy N, Viallon V, et al. Predicted basal metabolic rate and cancer risk in the European Prospective Investigation into Cancer and Nutrition. Int J Cancer. 2020;147(3):648–661. doi:10.1002/ijc.32753
18. Yildiz R, Ganbold K, Sparman NZR, Rajbhandari P. Immune Regulatory Crosstalk in Adipose Tissue Thermogenesis. Compr Physiol. 2025;15:e70001. doi:10.1002/cph4.70001
19. Wang L, Lu T, Wu P, Chen K, Mu Y. Association of predicted basal metabolic rate and insulin resistance in a Chinese general population. BMC Endocr Disord. 2025;25(1):156. doi:10.1186/s12902-025-01976-3
20. Ziolkowska S, Binienda A, Jabłkowski M, Szemraj J, Czarny P. The Interplay between Insulin Resistance, Inflammation, Oxidative Stress, Base Excision Repair and Metabolic Syndrome in Nonalcoholic Fatty Liver Disease. Int J Mol Sci. 2021;23(1):22. doi:10.3390/ijms23010022
21. Wang H, Ye J. Regulation of energy balance by inflammation: common theme in physiology and pathology. Rev Endocr Metab Disord. 2015;16(1):47–54. doi:10.1007/s11154-014-9306-8
22. Williams R, Periasamy M. Genetic and Environmental Factors Contributing to Visceral Adiposity in Asian Populations. Endocrinol Metab. 2020;35(4):681–695. doi:10.3803/EnM.2020.772
23. Kuang M, Yang R, Xie Q, et al. The role of predicted lean body mass and fat mass in non-alcoholic fatty liver disease in both sexes: results from a secondary analysis of the NAGALA study. Front Nutr. 2023;10:1103665. doi:10.3389/fnut.2023.1103665
24. Zurlo F, Larson K, Bogardus C, Ravussin E. Skeletal muscle metabolism is a major determinant of resting energy expenditure. J Clin Invest. 1990;86(5):1423–1427. doi:10.1172/JCI114857
25. Zhou Z, Li L, Wang C, et al. The association between sedentary behavior and MASLD in overweight and obese adults: investigating the role of inflammatory markers using NHANES data. Front Nutr. 2025;12:1579453. doi:10.3389/fnut.2025.1579453
26. Richmond RC, Davey Smith G. Mendelian Randomization: concepts and Scope. Cold Spring Harb Perspect Med. 2022;12:a040501. doi:10.1101/cshperspect.a040501
27. Dennis A. Quantitative imaging tests for non-alcoholic fatty liver disease: which, when and why. Transl Gastroenterol Hepatol. 2023;8:1. doi:10.21037/tgh-22-85
28. Patel AK, Balasanova AA. Unhealthy Alcohol Use. JAMA. 2021;326(2):196. doi:10.1001/jama.2020.2015
29. Doros R, Delcea A, Mardare L, Petcu L. Basal Metabolic Rate In Metabolic Disorders. Medicine. 2015;17(2):137–143.
30. Compher C, Frankenfield D, Keim N, Roth-Yousey L. Best practice methods to apply to measurement of resting metabolic rate in adults: a systematic review. J Am Diet Assoc. 2006;106(6):881–903. doi:10.1016/j.jada.2006.02.009
31. Flack KD, Siders WA, Johnson L, Roemmich JN. Cross-Validation of Resting Metabolic Rate Prediction Equations. J Acad Nutr Diet. 2016;116(9):1413–1422. doi:10.1016/j.jand.2016.03.018
32. Fatty Liver and Alcoholic Liver Disease Group, Chinese Medical Association’s Hepatology Branch. Diagnostic criteria for non-alcoholic fatty liver disease. Chin Hepatol. 2002;7:290.
33. Heredia NI, Zhang X, Balakrishnan M, et al. Physical activity and diet quality in relation to non-alcoholic fatty liver disease: a cross-sectional study in a representative sample of U.S. adults using NHANES 2017–2018. Prev Med. 2022;154:106903. doi:10.1016/j.ypmed.2021.106903
34. Noureddin M, Ntanios F, Malhotra D, et al. Predicting NAFLD prevalence in the United States using National Health and Nutrition Examination Survey 2017–2018 transient elastography data and application of machine learning. Hepatol Commun. 2022;6(7):1537–1548. doi:10.1002/hep4.1935
35. Liao Y, Chen Q, Liu L, et al. Amino acid is a major carbon source for hepatic lipogenesis. Cell Metab. 2024;36(11):2437–2448.e2438. doi:10.1016/j.cmet.2024.10.001
36. Guo X, Le Y. The triangular relationship of physical activity, depression, and inflammatory markers: a large cross-sectional analysis with NHANES data. J Affect Disord. 2024;367:589–597. doi:10.1016/j.jad.2024.09.008
37. Skrivankova VW, Richmond RC, Woolf BAR, et al. Strengthening the Reporting of Observational Studies in Epidemiology Using Mendelian Randomization: the STROBE-MR Statement. JAMA. 2021;326(16):1614–1621. doi:10.1001/jama.2021.18236
38. Loh PR, Kichaev G, Gazal S, Schoech AP, Price AL. Mixed-model association for biobank-scale datasets. Nat Genet. 2018;50(7):906–908. doi:10.1038/s41588-018-0144-6
39. Burgess S, Thompson SG. Bias in causal estimates from Mendelian randomization studies with weak instruments. Stat Med. 2011;30(11):1312–1323. doi:10.1002/sim.4197
40. Sollis E, Mosaku A, Abid A, et al. The NHGRI-EBI GWAS Catalog: knowledgebase and deposition resource. Nucleic Acids Res. 2023;51:D977–D985. doi:10.1093/nar/gkac1010
41. Siddiqui MS, Vuppalanchi R, Van Natta ML, et al. Vibration-Controlled Transient Elastography to Assess Fibrosis and Steatosis in Patients With Nonalcoholic Fatty Liver Disease. Clin Gastroenterol Hepatol. 2019;17(1):156–163.e152. doi:10.1016/j.cgh.2018.04.043
42. Verbanck M, Chen CY, Neale B, Do R. Detection of widespread horizontal pleiotropy in causal relationships inferred from Mendelian randomization between complex traits and diseases. Nat Genet. 2018;50(5):693–698. doi:10.1038/s41588-018-0099-7
43. Bowden J, Spiller W, Del Greco MF, et al. Improving the visualization, interpretation and analysis of two-sample summary data Mendelian randomization via the Radial plot and Radial regression. Int J Epidemiol. 2018;47(6):2100. doi:10.1093/ije/dyy265
44. Brion MJ, Shakhbazov K, Visscher PM. Calculating statistical power in Mendelian randomization studies. Int J Epidemiol. 2013;42(5):1497–1501. doi:10.1093/ije/dyt179
45. Ali N, Mahmood S, Manirujjaman M, et al. Hypertension prevalence and influence of basal metabolic rate on blood pressure among adult students in Bangladesh. BMC Public Health. 2017;18(1):58. doi:10.1186/s12889-017-4617-9
46. Bi X, Forde CG, Goh AT, Henry CJ. Basal Metabolic Rate and Body Composition Predict Habitual Food and Macronutrient Intakes: gender Differences. Nutrients. 2019;12(1):11. doi:10.3390/nu12010011
47. Sampath Kumar A, Arun Maiya G, Shastry BA, Vaishali K, Maiya S, Umakanth S. Correlation between basal metabolic rate, visceral fat and insulin resistance among type 2 diabetes mellitus with peripheral neuropathy. Diabetes Metab Syndr. 2019;13(1):344–348. doi:10.1016/j.dsx.2018.10.005
48. Tarantino G, Citro V, Conforti P, Balsano C, Capone D. Is There a Link between Basal Metabolic Rate, Spleen Volume and Hepatic Growth Factor Levels in Patients with Obesity-Related NAFLD? J Clin Med. 2019;9(1):8. doi:10.3390/jcm9010008
49. Cho YJ, Cho MH, Han B, Park M, Bak S, Park M. The Association between the Ratio of Energy Intake to Basal Metabolic Rate and Physical Activity to Sarcopenia: using the Korea National Health and Nutrition Examination Surveys. Korean J Fam Med. 2020;41(3):167–174. doi:10.4082/kjfm.18.0127
50. Han F, Hu F, Wang T, et al. Association Between Basal Metabolic Rate and All-Cause Mortality in a Prospective Cohort of Southern Chinese Adults. Front Physiol. 2021;12:790347. doi:10.3389/fphys.2021.790347
51. Ning L, He C, Lu C, Huang W, Zeng T, Su Q. Association between basal metabolic rate and cardio-metabolic risk factors: evidence from a Mendelian Randomization study. Heliyon. 2024;10:e28154. doi:10.1016/j.heliyon.2024.e28154
52. Ruggiero C, Metter EJ, Melenovsky V, et al. High basal metabolic rate is a risk factor for mortality: the Baltimore Longitudinal Study of Aging. J Gerontol a Biol Sci Med Sci. 2008;63(7):698–706. doi:10.1093/gerona/63.7.698
53. He Y, Ye M, Xia Y, Zhong Z, Wang W, Li Q. The role of cytokines as predictors for NAFLD-related diseases: a bidirectional Mendelian randomization study. Clin Res Hepatol Gastroenterol. 2025;49(3):102545. doi:10.1016/j.clinre.2025.102545
54. Sadeghian M, Hosseini SA, Zare Javid A, Ahmadi Angali K, Mashkournia A. Effect of Fasting-Mimicking Diet or Continuous Energy Restriction on Weight Loss, Body Composition, and Appetite-Regulating Hormones Among Metabolically Healthy Women with Obesity: a Randomized Controlled, Parallel Trial. Obes Surg. 2021;31(5):2030–2039. doi:10.1007/s11695-020-05202-y
55. Henry CJ, Ponnalagu S, Bi X, Forde C. Does basal metabolic rate drive eating rate? Physiol Behav. 2018;189:74–77. doi:10.1016/j.physbeh.2018.03.013
56. Liu D, Huang Y, Huang C, et al. Calorie Restriction with or without Time-Restricted Eating in Weight Loss. N Engl J Med. 2022;386(16):1495–1504. doi:10.1056/NEJMoa2114833
57. Zong Y, Li H, Liao P, et al. Mitochondrial dysfunction: mechanisms and advances in therapy. Signal Transduct Target Ther. 2024;9(1):124. doi:10.1038/s41392-024-01839-8
58. Liemburg-Apers DC, Willems PH, Koopman WJ, Grefte S. Interactions between mitochondrial reactive oxygen species and cellular glucose metabolism. Arch Toxicol. 2015;89(8):1209–1226. doi:10.1007/s00204-015-1520-y
59. Chen Z, Tian R, She Z, Cai J, Li H. Role of oxidative stress in the pathogenesis of nonalcoholic fatty liver disease. Free Radic Biol Med. 2020;152:116–141. doi:10.1016/j.freeradbiomed.2020.02.025
 © 2026 The Author(s). This work is published and licensed by Dove Medical Press Limited. The
full terms of this license are available at https://www.dovepress.com/terms
and incorporate the Creative Commons Attribution
- Non Commercial (unported, 4.0) License.
By accessing the work you hereby accept the Terms. Non-commercial uses of the work are permitted
without any further permission from Dove Medical Press Limited, provided the work is properly
attributed. For permission for commercial use of this work, please see paragraphs 4.2 and 5 of our Terms.
© 2026 The Author(s). This work is published and licensed by Dove Medical Press Limited. The
full terms of this license are available at https://www.dovepress.com/terms
and incorporate the Creative Commons Attribution
- Non Commercial (unported, 4.0) License.
By accessing the work you hereby accept the Terms. Non-commercial uses of the work are permitted
without any further permission from Dove Medical Press Limited, provided the work is properly
attributed. For permission for commercial use of this work, please see paragraphs 4.2 and 5 of our Terms.
Recommended articles
Association Between Psoriasis and Non-Alcoholic Fatty Liver Disease: A Two-Sample Mendelian Randomization Study
Li H, Su J, Zhu M, Zhu Y, Zhu S
Clinical, Cosmetic and Investigational Dermatology 2023, 16:3291-3294
Published Date: 14 November 2023
Multi-Omics Analysis and Validation of Cell Senescence-Related Genes Associated with Non-Alcoholic Fatty Liver Disease
Gong J, Qin Z, Xiao Y, Li J, Wang Q, Lei L, Li J
Journal of Inflammation Research 2025, 18:8821-8833
Published Date: 5 July 2025