Back to Journals » Diabetes, Metabolic Syndrome and Obesity » Volume 16
Serum Uric Acid to High‑density Lipoprotein Cholesterol Ratio is Associated with Visceral Fat in Patients with Type 2 Diabetes
Authors Sun H, Su H, Zheng R, Liu C, Wang Y, Fang C
Received 6 January 2023
Accepted for publication 29 March 2023
Published 4 April 2023 Volume 2023:16 Pages 959—967
DOI https://doi.org/10.2147/DMSO.S403895
Checked for plagiarism Yes
Review by Single anonymous peer review
Peer reviewer comments 2
Editor who approved publication: Dr Konstantinos Tziomalos
Hongping Sun,1,* Hong Su,1,* Rendong Zheng,1 Chao Liu,1 Yu Wang,2 Changqian Fang2
1Endocrine and Diabetes Center, Affiliated Hospital of Integrated Traditional Chinese and Western Medicine, Nanjing University of Chinese Medicine, Jiangsu Province Academy of Traditional Chinese Medicine, Nanjing, 210028, People’s Republic of China; 2Department of Endocrinology, Nanjing Lishui District Hospital of Traditional Chinese Medicine, Nanjing, 211200, People’s Republic of China
*These authors contributed equally to this work
Correspondence: Rendong Zheng; Chao Liu, Endocrine and Diabetes Center, Affiliated Hospital of Integrated Traditional Chinese and Western Medicine, Nanjing University of Chinese Medicine, Jiangsu Province Academy of Traditional Chinese Medicine, No. 100, Shizi Street, Hongshan Road, Nanjing, 210028, People’s Republic of China, Tel +86 159 9623 8035 ; +86 133 3780 6688, Fax +86-025-85608778, Email [email protected]; [email protected]
Objective: To determine whether the uric acid/high‑density lipoprotein cholesterol ratio (UHR) is associated with visceral fat area (VFA) in patients with type 2 diabetes mellitus (T2DM).
Methods: Participants aged 18– 70 years with a diagnosis of T2DM were recruited from the National Metabolic Management Center from January 2020 to July 2022. Medical data collected for all participants included medical history, general measures, carotid intima-media thickness, abdominal VFA, and subcutaneous fat area (SFA). The participants were divided into groups according to VFA ≥ 100 cm2 (n=109) and VFA < 100 cm2 (n=100).
Results: Compared with the VFA < 100 cm2 group, the VFA ≥ 100 cm2 group had higher height, weight, body mass index (BMI), waist circumference (WC), hip circumference (HC), SFA, fasting plasma glucose, fasting insulin, C peptide, homeostatic model assessment of insulin resistance (HOMA-IR), alanine transaminase (ALT), aspartate transaminase, γ-glutamine acyltransferase (γ-GGT), uric acid (UA), triglyceride (TG), and UHR measurements and lower high-density lipoprotein cholesterol (HDL-C) (P< 0.05). No significant difference was observed between the groups for age, duration of T2DM, diastolic blood pressure, systolic blood pressure, IMT, glycosylated hemoglobin, total cholesterol, and low-density lipoprotein cholesterol. Positive correlations were found between the UHR and height, weight, BMI, WC, HC, C peptide, ALT, γ-GGT, TG, and UA, as well as between VFA and these variables (P< 0.05). Both the UHR and VFA were negatively correlated with HDL-C (P< 0.05). Positive correlations were observed between VFA and the UHR as well as UA (P< 0.05), and a negative correlation was found between VFA and HDL-C (P< 0.05). Multivariate linear stepwise regression identified BMI, WC, UHR, SFA, and HC as influencing factors for VFA (P< 0.05).
Conclusion: UHR was positively associated with VFA in T2DM patients and may be a useful and convenient additional tool for metabolic risks in these patients.
Keywords: hyperglycemia, dyslipidemia, insulin resistance, visceral adiposity
Introduction
Globally, diabetes and obesity are epidemics. In 2021, estimated 537 million people had diabetes, and by 2045, this number is expected to reach 783 million, with more than 90% having type 2 diabetes mellitus (T2DM).1 With the development of the economy and improvement of living conditions in China, the diabetes prevalence has skyrocketed to 12.8%.2 It is common for obesity to coexist with diabetes, especially visceral obesity, which aggravates insulin resistance (IR) and provokes metabolic diseases.3 The abdominal visceral fat area (VFA) is associated with metabolic disorder and IR and is usually measured by bioelectrical impedance analysis.4 However, in places with limited medical resources, a simple and easy index is needed for early evaluation of VFA and to identify T2DM associated with visceral obesity.
Elevation of the serum uric acid (UA) level is associated with cardiometabolic problems such as IR and visceral adiposity.5 The VFA determined by abdominal computed tomography shows a positive correlation with the serum UA level, and VFA is a significant independent predictor (OR 2.33) of hyperuricemia in patients with T2DM based on logistic regression analysis.6 The high‑density lipoprotein cholesterol (HDL-C) level is associated with concurrent IR, and lower HDL-C predicts long-term progression of glycemia in established T2DM.7 A lower level of HDL-C is also associated with carotid plaque in patients with metabolic syndrome.8 Overall, prior research has established that both UA and HDL-C can reflect metabolic disorder and even cardiovascular disease risk.
Despite the findings outlined above, little research has been done to evaluate the usefulness of VFA measurement in patients with T2DM and visceral obesity, especially in relation to the serum UA to HDL-C ratio (UHR). The present investigation of the correlation between VFA and UHR in diabetic patients provides key insight for assessing the risks associated with visceral fat in diabetes patients, as well as guidance for the prevention and treatment of diabetic complications.
Materials and Methods
Participants
This study enrolled 209 patients diagnosed with T2DM according to 1999 World Health Organization (WHO) diagnostic criteria and aged between 17 and 70 years. The patients with T2DM included those currently treated with insulin or oral hypoglycemic agents; whose fasting blood glucose was >7.0 mmol/L; or whose randomized blood glucose was >11.1 mmol/L associated with polyuria, thirst, or unexplained weight loss, and oral glucose tolerance test 2-h blood glucose was >11.1 mmol/L. The patients were all treated at the National Metabolic Management Center (MMC) of the Affiliated Hospital of Integrated Traditional Chinese and Western Medicine, Nanjing University of Chinese Medicine between January 2020 and July 2022. The participants were divided into two groups according to VFA, with 109 patients in the group VFA ≥100 cm2 (high VFA) and 100 patients in the group with VFA <100 cm2 (low VFA).
We excluded patients with a history of certain diseases, including congenital heart disease, severe liver and kidney disease, hyperthyroidism or hypothyroidism, and cancer. Pregnant women were also not included.
Clinical Parameters
Medical data were collected for all participants, including age, gender, duration of T2DM, height, weight, waist circumference (WC), hip circumference (HC), and blood pressure (BP). Body mass index (BMI) was calculated as: BMI = weight (kg)/height (m)2.
Laboratory Measurements and Fat Area Measurements
A venous blood sample was collected from each participant after overnight fasting for >8 h for measurement of fasting plasma glucose (FPG), fasting insulin (FINS) and C peptide as well as biochemical indicators and lipids including serum total cholesterol (TC), triglyceride (TG), low-density lipoprotein cholesterol (LDL-C), and high-density lipoprotein cholesterol (HDL-C). Glycosylated hemoglobin (HbA1c) was also measured. Blood samples were collected in vacuum sampling tubes, centrifuged, and stored at –80°C within 2 h. The homeostatic model assessment of insulin resistance (HOMA-IR) index was calculated as: HOMA-IR = FPG (mmol/L) * FINS (mU/L)/22.5. The UHR was calculated as: UHR = serum UA (mmol/L)/HDL-C (mmol/L).
The thickness of intima-media was measured with GE Vivid E9 color Doppler ultrasound (GE Company, USA) at a frequency of 3–8 MHz. VFA and subcutaneous fat area (SFA) were measured by bioelectrical impedance technology (HDS-2000, Japan Omron Company).
Statistical Analysis
SPSS 25.0 statistical software was used for data analysis. Data were tested for normal distribution, and normally distributed data are presented as mean ± standard deviation. Differences between two groups were assessed by independent-two samples t-test. Data that did not fit a normal distribution are presented as median and 25th and 75th percentiles (P25, P75), and nonparametric tests were used for comparison. Pearson correlation coefficients were calculated for correlation analysis, and the relationship between each factor and VFA was analyzed by multiple linear regression analysis. Statistical significance between two groups was defined by a two-sided P<0.05.
Results
Clinical Characteristics of Patients According to VFA Category
The basic and clinical characteristics of patients were compared between the groups with VFA ≥100 cm2 (high VFA group) and <100 cm2 (low VFA group). As shown in Table 1, the high VFA group had significantly higher mean or median values for height, weight, BMI, WC, HC, and SFA compared with the low VFA group (all P<0.05), while no significant differences in age, duration of T2DM, SBP, DBP, or IMT were observed between the groups.
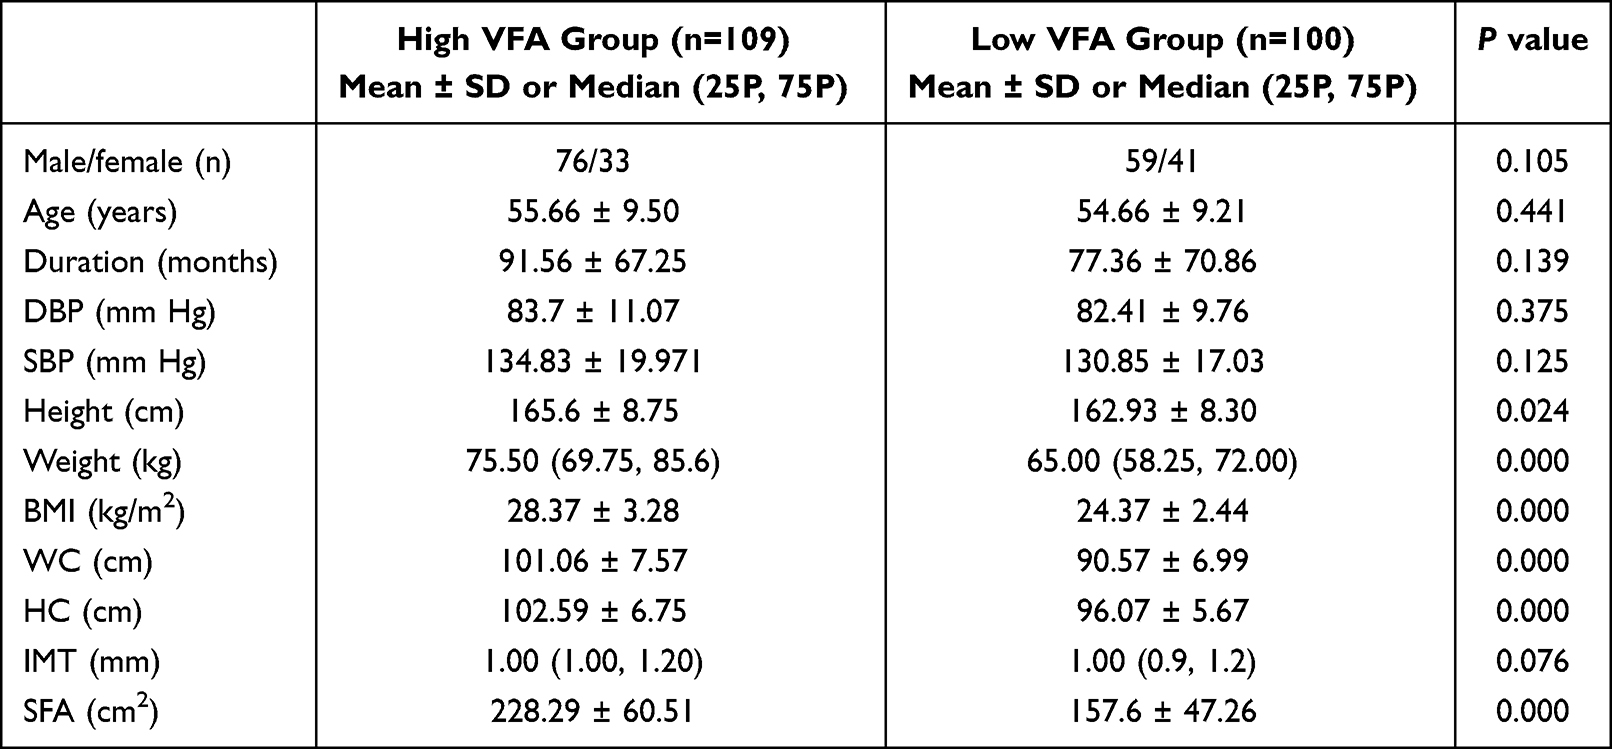 |
Table 1 General Characteristics of Patients in the High VFA Group (VFA ≥100 cm2) and Low VFA Group (VFA <100 cm2) |
Diabetes-related parameters were compared between the groups in Table 2. The high VFA group had significantly higher FPG, FINS, C peptide, and HOMA-IR levels than did the low VFA group (P<0.05), while no significant difference was observed in the HbA1c level (Table 2).
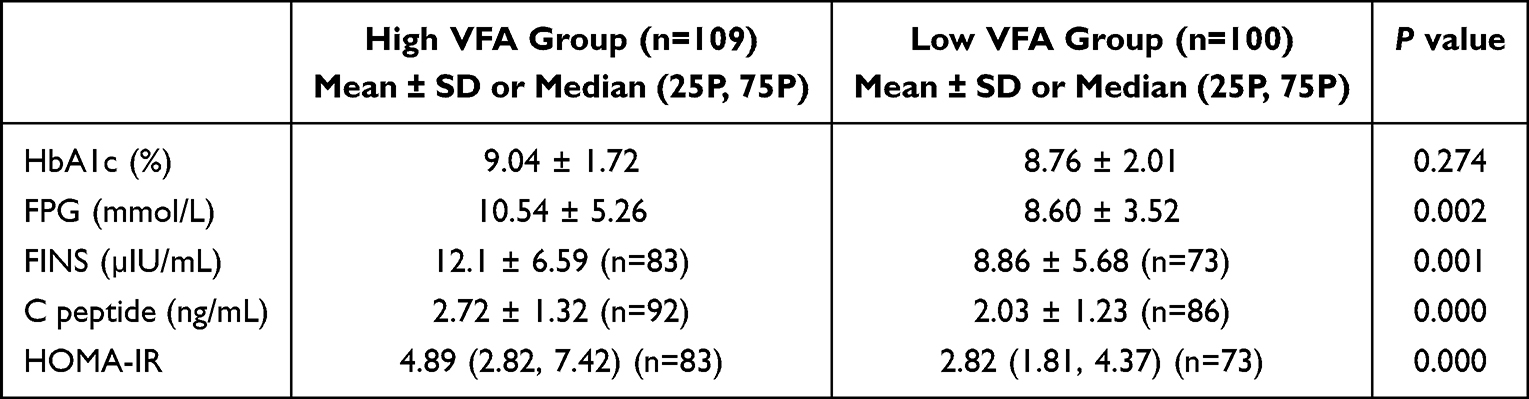 |
Table 2 Diabetes-Related Indexes Among Patients in the High VFA Group (VFA ≥100 cm2) and Low VFA Group (VFA <100 cm2) |
Biochemical indexes and blood lipid profiles were compared between the groups in Table 3. The high VFA group had higher levels of alanine transaminase (ALT), aspartate transaminase (AST), γ-GGT, UA, and TG, as well as a higher UHR compared with the low VFA group (all P<0.05), whereas the HDL-C level in the high VFA group was lower than that in the low VFA group (P<0.05). However, no significant differences in TC and LDL-C were observed between the two groups.
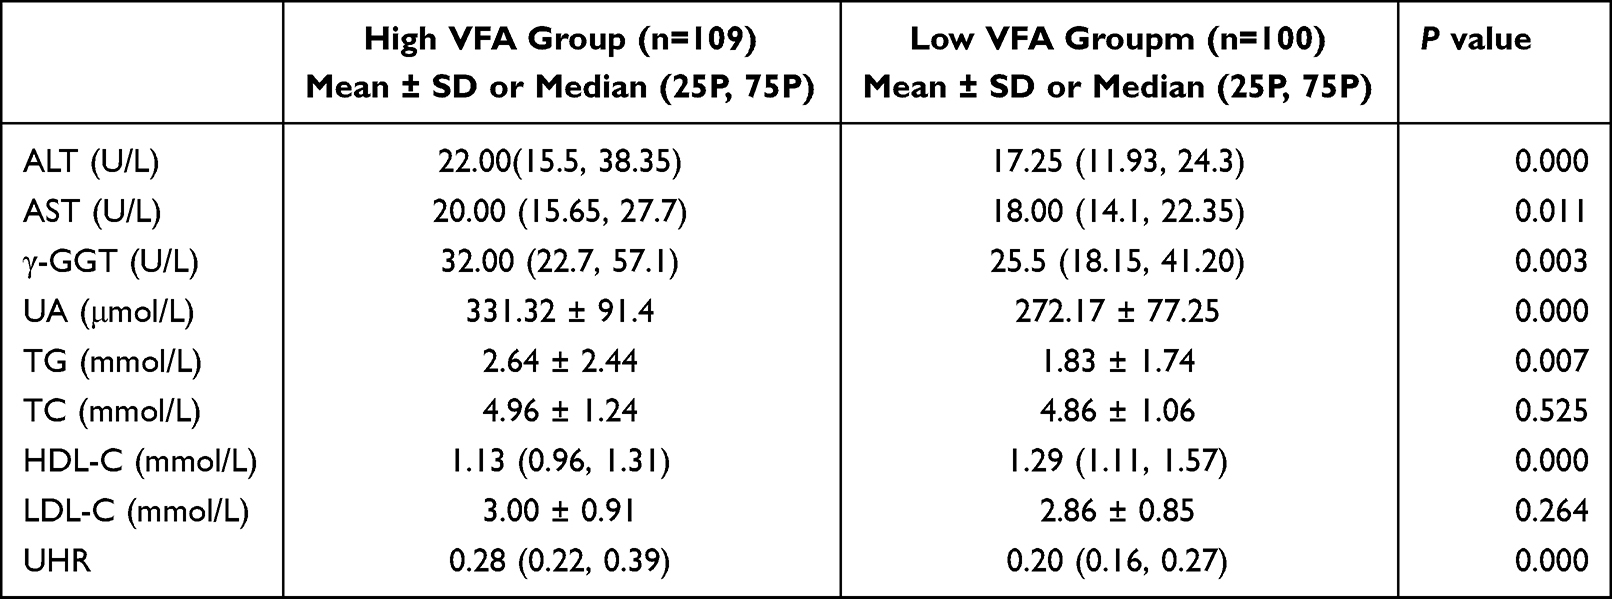 |
Table 3 Biochemical Indicators and Lipid Profiles for Patients in the High VFA Group (VFA ≥100 cm2) and Low VFA Group (VFA <100 cm2) |
Correlations Among the UHR, VFA, and Other Clinical Variables
Positive correlations were observed between the UHR and height, weight, BMI, WC, HC, C peptide level, ALT level, γ-GGT level, UA level, and TG level (all P<0.05: Table 4), and similar results were observed between VFA and the same variables. Negative correlations were observed between the UHR and HDL-C and between the UHR and VFA, as shown by the data in Table 4 (P<0.05).
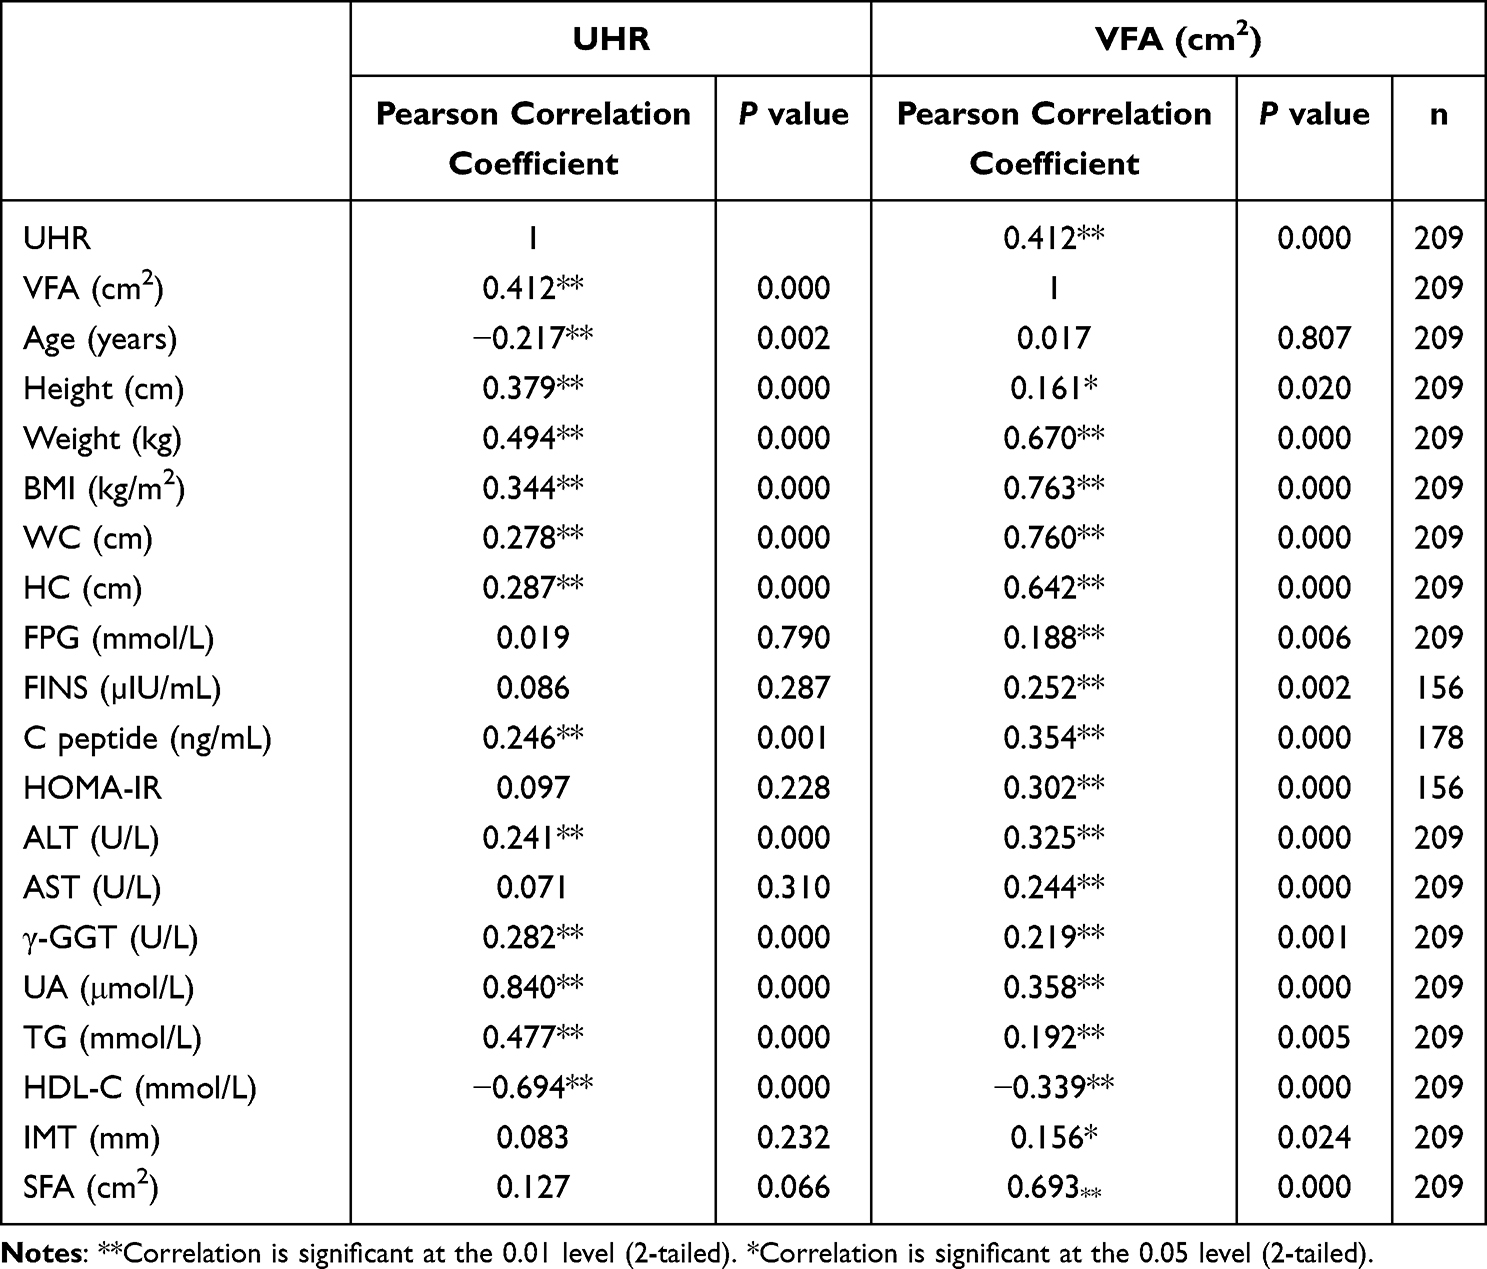 |
Table 4 Correlation Analysis Among the UHR, VFA, and Other Clinical Variables |
Figure 1–3 respectively show the positive correlations observed between VFA and UHR and UA (P<0.05) as well as the negative correlation observed between VFA and HDL-C (P<0.05).
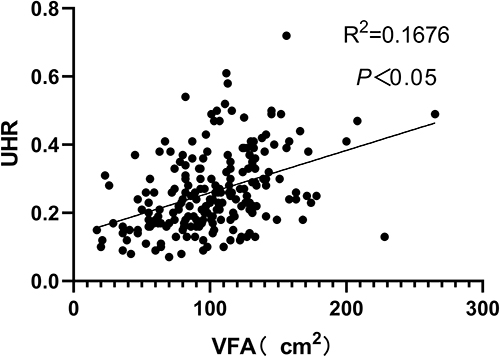 |
Figure 1 A positive correlation was observed between VFA and UHR. |
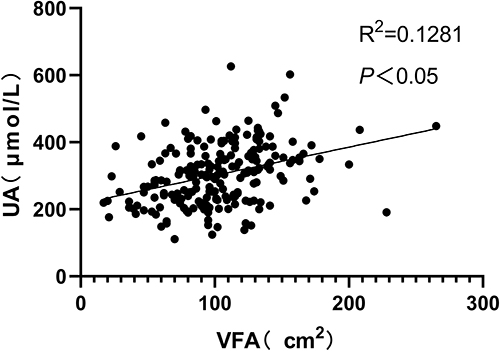 |
Figure 2 A positive correlation was observed between VFA and UA. |
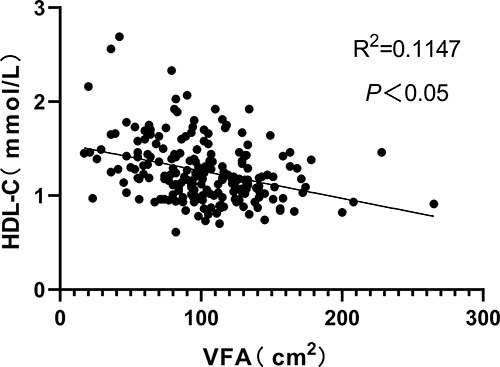 |
Figure 3 A negative correlation was observed between VFA and HDL-C. |
Factors Influencing VFA
Multivariate linear stepwise regression was applied to analyze the above-mentioned relevant indicators as independent variables and VFA as the dependent variable. The standardized regression coefficients β were 0.344, 0.435, 0.230, 0.218, and –0.197 for BMI, WC, UHR, SFA, and HC, respectively, and thus, these parameters were identified as influencing factors for VFA (P<0.05; Table 5).
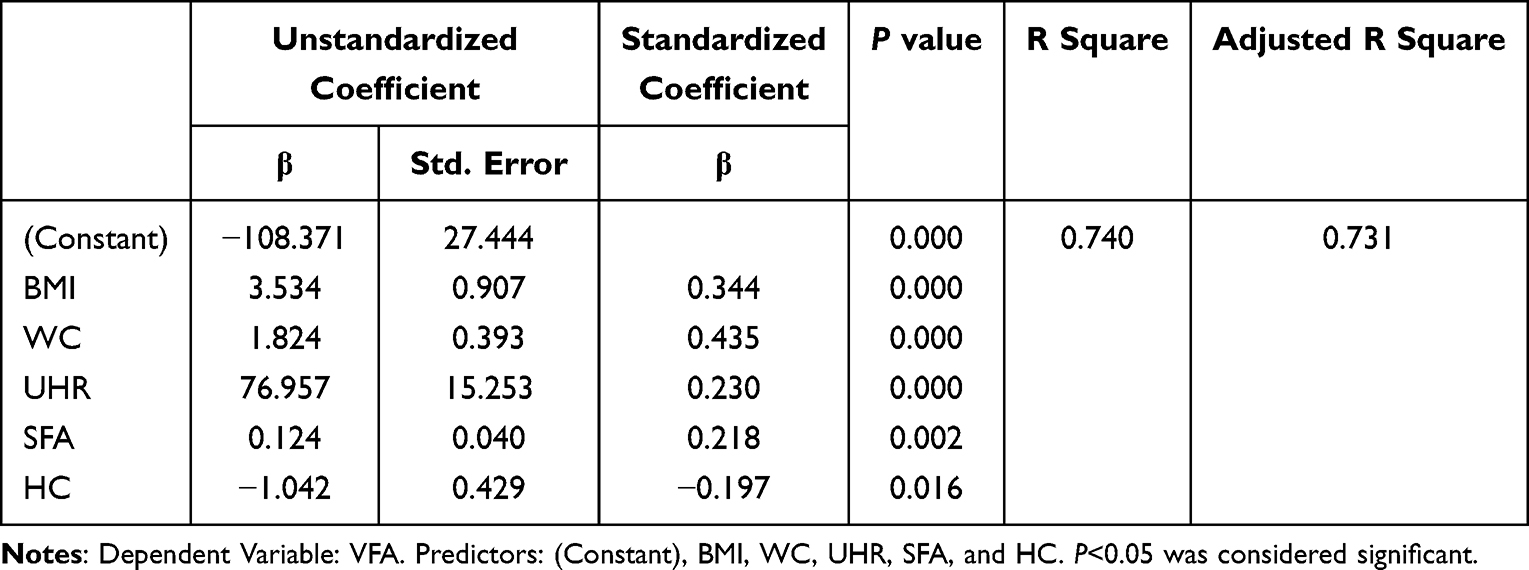 |
Table 5 Multiple Linear Regression Analysis of Relevant Indicators for VFA |
Discussion
Our retrospective study on T2DM patients found that a higher UHR value was positively associated with a higher VFA and that the UHR was an influencing factor for VFA. Therefore, a higher UHR value may serve as a useful tool for predicting higher metabolic risk as an indicator of higher VFA that is easier and more convenient to measure.
In the present study, we observed that levels of general measures such as height, weight, BMI, WC, HC, and SFA were higher in the high VFA group compared with the low VFA group, and both VFA and UHR were positively correlated with these variables. Katahira et al9 reported that central obesity can be well represented by VFA as an indicator of increased risk of heart disease in a cross-sectional study. One Chinese study of very elderly adults reported that VFA is the best measure for mobility associated with obesity.10 Another study demonstrated that VFA is positively correlated with BMI and may be a useful parameter for predicting the risk of metabolic syndrome.11 All of these previous studies produced similar results to those of our study, indicating that VFA can reflect the obesity-related markers and is correlated with patients’ risk of heart disease or metabolic syndrome.
Our study also found that glucose-related markers, such as FPG, FINS, C peptide, and HOMA-IR levels, were significantly higher in the high VFA group compared with the low VFA group. A previous study found that visceral adiposity correlates well with IR, metabolic syndrome, and cardiovascular diseases and that like VFA, the VFA/HC ratio is also positively associated with IR.12 A cross-sectional study in India reported that visceral fat measurement can be used for predicting prediabetes.13 Additionally, the prognostic risk of diabetic kidney disease progression in T2DM patients was shown to be positively correlated with VFA.14 Another study in T1DM patients found that VFA is associated with coronary artery calcification and cardiac dysfunction.15 Therefore, a high VFA is a risk factor for IR and diabetes, and as such, can reflect the risk of diabetes complications.
Patients with higher VFA levels also had higher levels of liver markers and lipids, including ALT, AST, γ-GGT, UA, and TG, as well as higher UHR values and a lower HDL-C level compared with patients with lower VFA levels. Additionally, our analyses demonstrated that both VFA and UHR were positively correlated with ALT, γ-GGT, UA, and TG levels and negatively correlated with the HDL-C level. Jeon et al11 found that VFA is positively correlated with lipid levels such as TC, LDL-C, and TG and indicators of liver function such as GGT, AST, and ALT levels, but negatively correlated with the HDL-C level. Another retrospective study observed that high VFA is an independent risk factor for nonalcoholic fatty liver disease in overweight or obese individuals.16 Visceral fat accumulation, as an early indicator of non-alcoholic fatty liver disease even in lean individuals, increases with fibrosis stage and is associated with IR in liver.17 Thus, VFA is a useful tool for predicting non-alcoholic fatty liver disease and dyslipidemia.
Pearson correlation analysis and multiple linear regression analysis in the present study showed that VFA was positively correlated with the UHR and UA level and negatively correlated with HDL-C level. Also, our study demonstrated that the UHR was a predictor of VFA among adult T2DM patients, and thus, may reflect arterial stiffness and left ventricular remodeling like VFA. Previous studies have reported that UHR is useful for predicting cardiovascular risk and metabolic diseases. A higher UHR value was positively associated with incident cardiac ischemia and chronic inflammation in a large-scale cohort study of Korean individuals without diabetes.18 Another retrospective study in a Chinese population reported that the UHR as a novel marker is significantly increased in patients with coronary lesions.19 A study in Turkey reported that UHR is a strong predictor of metabolic syndrome in patients with diabetes.20 Additional research has shown that UHR is significantly associated with nonalcoholic fatty liver disease and may serve as a novel and reliable marker for nonalcoholic fatty liver disease in lean Chinese adults.21 Kosekli et al22 reported that the UHR value is significantly and positively correlated with metabolic markers such as transaminase levels and BMI in patients with non-alcoholic fatty liver. A recent epidemiological study observed that the inflammatory burden is increased in patients with higher UHR values.23 Overall, these findings suggest that the UHR is a valuable tool indicating risks of heart disease, liver disease, and metabolic disorders, while the relationship between the UHR and VFA has been less well investigated. The results of the present study now demonstrate that UHR can be a useful and convenient tool for predicting the risk of metabolic disorders such as obesity and non-alcoholic fatty liver disease as an indicator of VFA.
A previous Chinese study reported that a high level of visceral adipose tissue mass exacerbates the risk of hyperuricemia in patients with polycystic ovary syndrome.24 In addition to metabolic disorders, UA also indicates increased risk of cardiovascular diseases. The Uric Acid Right for Heart Health (URRAH) study reported that serum UA is an independent marker for increased risk of fatal and non-fatal cerebrovascular events, and UA >4.79 mg/dL is a valid cut-off value for prognosis in stroke patients.25 In healthy Singaporean adults, the serum HDL-C level was shown to be negatively correlated with preperitoneal fat thickness and subcutaneous fat thickness determined by ultrasound and thus useful for predicting cardiovascular risk.26 A previous cross-sectional study found that HDL-C is inversely associated with HbA1c and may be relevant to glycemic control in patients with diabetes.27
The carotid IMT, as a noninvasive marker of atherosclerosis, can predict the risk of cardiovascular disease, and increased IMT is linked to an increased risk of subsequent cardiovascular events.28,29 UHR as a biomarker for evaluating inflammatory status was found to be positively associated with incident heart ischemia incidence in Koreans without diabetes.18 A retrospective cross-sectional cohort study reported that an elevated UHR is an independent risk factor for poorly controlled BP and that the risk of poorer BP control was increased 7.3-fold with each unit increase in UHR.30 However, a correlation between the UHR and IMT was not observed in our study, which may be related to the relatively small sample size of the present study. Correlations between the UHR and VFA, VFA and IMT were observed, respectively, and thus, whether the UHR may impact IMT via VFA should be further investigated.
The primary strength of our study is that UHR is more convenient to measure than VFA in T2DM patients. However, this study has some limitations that should also be acknowledged. Some inflammatory markers had not been initially evaluated in all patients, and the number of patients included in this retrospective study was relatively low. Thus, a large prospective clinical study is needed to confirm our findings.
Conclusion
The UHR can positively and significantly predict VFA in T2DM patients, as a reflection of IR combined with metabolic disorder. Accordingly, increased UHR may represent a convenient and useful additional measure for assessing metabolic risk in adults with T2DM.
Abbreviations
T2DM, Type 2 Diabetes; BP, Blood Pressure; DBP, Diastolic Blood Pressure; SBP, Systolic Blood Pressure; BMI, Body Mass Index; WC, Waist Circumference; HC, Hip Circumference; FPG, Fasting Plasma Glucose; FINS, Fasting Insulin; HbA1c, Glycosylated Hemoglobin; ALT, Alanine Transaminase; AST, Aspartate Transaminase; γ-GGT, γ-Glutamine Acyltransferase; UA, Uric Acid; TC, Total Cholesterol; TG, Triglyceride; LDL-C, Low-Density Lipoprotein Cholesterol; HDL-C, High-Density Lipoprotein Cholesterol; IMT, Intima-Media Thickness; VFA, Visceral Fat Area; SFA, Subcutaneous Fat Area; UHR, UA to HDL-C Ratio; HOMA-IR, Homeostatic Model Assessment of Insulin Resistance; IMT, thickness of intima-media; URRAH, Acid Right for Heart Health.
Ethics Approval and Consent to Participants
This retrospective study was performed in accordance with the Declaration of Helsinki and approved by the Clinical Ethics Committee of Affiliated Hospital of Integrated Traditional Chinese and Western Medicine, Nanjing University of Chinese Medicine (2022-LWKYZ-017). All patients signed an informed consent form with MMC, and their rights were protected.
Author Contributions
All authors made a significant contribution to the work reported, whether that is in the conception, study design, execution, acquisition of data, analysis and interpretation, or in all these areas; took part in drafting, revising, or critically reviewing the article; gave final approval of the version to be published; have agreed on the journal to which the article has been submitted; and agree to be accountable for all aspects of the work.
Disclosure
The authors report no conflicts of interest in this work.
References
1. International Diabetes Federation. IDF Diabetes Atlas.
2. Li Y, Teng D, Shi X, et al. Prevalence of diabetes recorded in mainland China using 2018 diagnostic criteria from the American Diabetes Association: national cross sectional study. BMJ. 2020;369:m997.
3. Li X, Li HY, Yu ZW, et al. Association Among Lipid Accumulation Product, Chinese Visceral Obesity Index and Diabetic Retinopathy in Patients with Type 2 Diabetes: a Cross-Sectional Study. Diabetes Metab Syndr Obes. 2021;14:4971–4979.
4. Abe Y, Tonouchi R, Hara M, et al. Visceral Fat Area Measured by Abdominal Bioelectrical Impedance Analysis in School-Aged Japanese Children. J Clin Med. 2022;11:4148.
5. Fernandez-Chirino L, Antonio-Villa NE, Fermin-Martinez CA, et al. Elevated serum uric acid is a facilitating mechanism for insulin resistance mediated accumulation of visceral adipose tissue. Clin Endocrinol. 2022;96:707–718.
6. Kim TH, Lee SS, Yoo JH, et al. The relationship between the regional abdominal adipose tissue distribution and the serum uric acid levels in people with type 2 diabetes mellitus. Diabetol Metab Syndr. 2012;4:3.
7. Waldman B, Jenkins AJ, Davis TM, et al. HDL-C and HDL-C/ApoA-I predict long-term progression of glycemia in established type 2 diabetes. Diabetes Care. 2014;37:2351–2358.
8. Abi-Ayad M, Abbou A, Abi-Ayad FZ, et al. HDL-C, ApoA1 and VLDL-TG as biomarkers for the carotid plaque presence in patients with metabolic syndrome. Diabetes Metab Syndr. 2018;12:175–179.
9. Katahira M, Moriura S, Ono S. Estimation of visceral fat area using criteria for metabolic syndrome: a cross-sectional study. Diabetes Metab Syndr. 2022;16:102584.
10. Chua KY, Lin X, Wang Y, et al. Visceral fat area is the measure of obesity best associated with mobility disability in community dwelling oldest-old Chinese adults. BMC Geriatr. 2021;21:282.
11. Jeon HH, Lee YK, Kim DH, et al. Risk for metabolic syndrome in the population with visceral fat area measured by bioelectrical impedance analysis. Korean J Intern Med. 2021;36:97–105.
12. Zhang S, Huang YP, Li J, et al. The Visceral-Fat-Area-to-Hip-Circumference Ratio as a Predictor for Insulin Resistance in a Chinese Population with Type 2 Diabetes. Obes Facts. 2022;15:621–628.
13. Jadhav RA, Maiya GA, Shivashankara KN, et al. Measurement of visceral fat for early prediction of prediabetes-Cross-sectional study from Southern India. J Taibah Univ Med Sci. 2022;17:983–990.
14. Lin X, Chen Z, Huang H, et al. Diabetic kidney disease progression is associated with decreased lower-limb muscle mass and increased visceral fat area in T2DM patients. Front Endocrinol (Lausanne). 2022;13:1002118.
15. De Block CEM, Shivalkar B, Goovaerts W, et al. Coronary artery calcifications and diastolic dysfunction versus visceral fat area in type 1 diabetes: VISCERA study. J Diabetes Complications. 2018;32:271–278.
16. Lee S, Kim KW, Lee J, et al. Visceral Fat Area Is an Independent Risk Factor for Overweight or Obese Nonalcoholic Fatty Liver Disease in Potential Living Liver Donors. Transplant Proc. 2022;54:702–705.
17. Saponaro C, Sabatini S, Gaggini M, et al. Adipose tissue dysfunction and visceral fat are associated with hepatic insulin resistance and severity of NASH even in lean individuals. Liver Int. 2022;42:2418–2427.
18. Park B, Jung DH, Lee YJ. Predictive Value of Serum Uric Acid to HDL Cholesterol Ratio for Incident Ischemic Heart Disease in Non-Diabetic Koreans. Biomedicines. 2022;10:1422.
19. Li F, Zhao D, Li Q, et al. Uric Acid to High-Density Lipoprotein Cholesterol Ratio is a Novel Marker to Predict Functionally Significant Coronary Artery Stenosis. J Interv Cardiol. 2022;2022:9057832.
20. Kocak MZ, Aktas G, Erkus E, et al. Serum uric acid to HDL-cholesterol ratio is a strong predictor of metabolic syndrome in type 2 diabetes mellitus. Rev Assoc Med Bras. 2019;65:9–15.
21. Zhang YN, Wang QQ, Chen YS, et al. Association between Serum Uric Acid to HDL-Cholesterol Ratio and Nonalcoholic Fatty Liver Disease in Lean Chinese Adults. Int J Endocrinol. 2020;2020:5953461.
22. Kosekli MA, Kurtkulagii O, Kahveci G, et al. The association between serum uric acid to high density lipoprotein-cholesterol ratio and non-alcoholic fatty liver disease: the abund study. Rev Assoc Med Bras. 2021;67:549–554.
23. Kurtkulagi O, Tel BMA, Kahveci G, et al. Hashimoto’s thyroiditis is associated with elevated serum uric acid to high density lipoprotein-cholesterol ratio. Rom J Intern Med. 2021;59:403–408.
24. Zhang Y, Cai M, Dilimulati D, et al. Correlation Between Serum Uric Acid and Body Fat Distribution in Patients With Polycystic Ovary Syndrome. Front Endocrinol (Lausanne). 2021;12:782808.
25. Tikhonoff V, Casiglia E, Spinella P, et al. Identification of a plausible serum uric acid cut-off value as prognostic marker of stroke: the Uric Acid Right for Heart Health (URRAH) study. J Hum Hypertens. 2022;36:976–982.
26. Bi X, Loo YT, Henry CJ. Ultrasound measurement of intraabdominal fat thickness as a predictor of insulin resistance and low HDL cholesterol in Asians. Nutrition. 2018;55-56:99–103.
27. Huang R, Yan L, Lei Y. The relationship between high-density lipoprotein cholesterol (HDL-C) and glycosylated hemoglobin in diabetic patients aged 20 or above: a cross-sectional study. BMC Endocr Disord. 2021;21:198.
28. Oygarden H. Carotid Intima-Media Thickness and Prediction of Cardiovascular Disease. J Am Heart Assoc. 2017;6:e005313.
29. Carpenter M, Sinclair H, Kunadian V. Carotid Intima Media Thickness and Its Utility as a Predictor of Cardiovascular Disease: a Review of Evidence. Cardiol Rev. 2016;24:70–75.
30. Aktas G, Khalid A, Kurtkulagi O, et al. Poorly controlled hypertension is associated with elevated serum uric acid to HDL-cholesterol ratio: a cross-sectional cohort study. Postgrad Med. 2022;134:297–302.
 © 2023 The Author(s). This work is published and licensed by Dove Medical Press Limited. The
full terms of this license are available at https://www.dovepress.com/terms
and incorporate the Creative Commons Attribution
- Non Commercial (unported, 3.0) License.
By accessing the work you hereby accept the Terms. Non-commercial uses of the work are permitted
without any further permission from Dove Medical Press Limited, provided the work is properly
attributed. For permission for commercial use of this work, please see paragraphs 4.2 and 5 of our Terms.
© 2023 The Author(s). This work is published and licensed by Dove Medical Press Limited. The
full terms of this license are available at https://www.dovepress.com/terms
and incorporate the Creative Commons Attribution
- Non Commercial (unported, 3.0) License.
By accessing the work you hereby accept the Terms. Non-commercial uses of the work are permitted
without any further permission from Dove Medical Press Limited, provided the work is properly
attributed. For permission for commercial use of this work, please see paragraphs 4.2 and 5 of our Terms.
Recommended articles
Exploring Interleukin-10 Levels in Diabetes Patients with and without Oral Diseases: A Systematic Review
Novianti Y, Nur’aeny N
Journal of Inflammation Research 2024, 17:541-552
Published Date: 31 January 2024
Clinical Outcomes and Complications of Basal, Bolus, and Combination Insulin Regimens in Type 2 Diabetes Mellitus: Evidence from Published Case Reports
Natsir RM, Halimah E, Diantini A, Levita J
Diabetes, Metabolic Syndrome and Obesity 2025, 18:3215-3236
Published Date: 3 September 2025
A Narrative Review of Remnant Cholesterol as an Independent Atherogenic Lipoprotein in Type 2 Diabetes: Pathophysiology and Clinical Implications
Natsir RM, Halimah E, Diantini A, Levita J
Therapeutics and Clinical Risk Management 2026, 22:593168
Published Date: 3 March 2026