")
Back to Journals » Diabetes, Metabolic Syndrome and Obesity » Volume 16
Serum Uric Acid is a Better Indicator of Kidney Impairment Than Serum Uric Acid-to-Creatinine Ratio and Serum Uric Acid-to-High-Density Lipoprotein Ratio: A Cross-Sectional Study of Type 2 Diabetes Mellitus Patients
Authors Han R , Duan L, Zhang Y, Jiang X
Received 14 June 2023
Accepted for publication 24 August 2023
Published 5 September 2023 Volume 2023:16 Pages 2695—2703
DOI https://doi.org/10.2147/DMSO.S425511
Checked for plagiarism Yes
Review by Single anonymous peer review
Peer reviewer comments 4
Editor who approved publication: Dr Konstantinos Tziomalos
Rongfeng Han, Lijun Duan, Yang Zhang, Xia Jiang
Department of Endocrinology, Tianjin First Center Hospital, Tianjin, 300192, People’s Republic of China
Correspondence: Rongfeng Han, Department of Endocrinology, Tianjin First Center Hospital, Tianjin, 300192, People’s Republic of China, Email [email protected]
Background: Type 2 diabetes mellitus (T2DM) patients are likely to develop kidney disease. Early diagnosis, finding predictors and controlling risk factors are of great significance for T2DM patients. This study investigated the ability of uric acid (UA), the uric acid to creatinine (CR) ratio (UA/CR) and the uric acid to high-density lipoprotein cholesterol ratio (UHR) to assess the kidney function of T2DM patients and determined the relationship between the three indicators and the estimated glomerular filtration rate (eGFR).
Methods: A total of 1326 adult T2DM patients were enrolled in the current study. Patients were stratified into three groups according to their eGFRs. Spearman correlation was used to analyze the correlation between three indicators and the clinical variables. Logistic regression analysis was used to assess the association between the three indicators and diabetic kidney disease (DKD) and kidney impairment (eGFR < 60 mL/min/1.73 m2). Receiver operating characteristic (ROC) analyses and the area under the ROC curve (AUC) were then used to assess the ability of UA, UA/CR, and UHR to discriminate kidney impairment in T2DM.
Results: UA and UHR demonstrated a positive association with DKD risk (P < 0.05). The odds ratios (ORs) were 1.005 (95% CI, 1.004– 1.007) and 1.057 (95% CI, 1.039– 1.076), respectively. UA/CR was negatively correlated with DKD risk (OR, 0.922 (95% CI, 0.876, 0.970), P < 0.05). Furthermore, UA and UHR demonstrated a strong positive association with kidney impairment risk, while UA/CR was negatively correlated with kidney impairment risk in T2DM patients (P < 0.05 for all) after adjusting for confounding factors. UA had the highest AUC (0.762) among the three indicators. UHR had a greater AUC (0.713) than UA/CR, which had an AUC value of 0.148 (p < 0.001).
Conclusion: UA is the best indicator of renal impairment (eGFR < 60 mL/min/1.73 m2) among the three indicators, and UHR is a better indicator than UA/CR.
Keywords: type 2 diabetes mellitus, T2DM, uric acid, UA, uric acid to creatinine ratio, UA/CR, uric acid to high-density lipoprotein cholesterol ratio, UHR, estimated glomerular filtration rate, eGFR
Introduction
DKD is one of the microvascular complications of diabetes; it has a hidden onset, is often asymptomatic, is difficult to detect, and causes serious renal damage in its later stage, which is the main cause of end-stage renal disease. Serious complications occur in 20–40% of all diabetic patients.1 DKD increases cardiovascular morbidity and mortality in patients with T2DM.2 Therefore, the early diagnosis, prevention and delay of the occurrence and development of DKD are of great significance to diabetic patients.
Serum UA is the metabolic end product of purine nucleotides; approximately two-thirds of the UA produced is excreted by the kidney, followed by the gastrointestinal tract.3 The accumulation of serum UA can lead to gout and chronic kidney disease (CKD). Recent studies also highlight the role of UA as an emerging, independent nontraditional risk factor that correlates with obesity, metabolic syndrome, hypertension, T2DM, cognitive decline, and cardiovascular disease (CVD).4–6 Serum CR is a commonly used indicator of kidney decline. Increased levels of circulating CR have been found to be associated with an increased risk of T2DM, CVD, obesity, and hypertension.7 Recently, the UA/CR has appeared as a new biomarker and is considered to reflect endogenous UA levels more accurately than UA levels.8 High-density lipoprotein cholesterol (HDL-C), as one of the indicators of blood lipids, has anti-inflammatory and antioxidant properties. The UHR is a novel metabolic indicator. Evidence has shown that UHR is a strong predictor of diabetes control9 and metabolic syndrome10,11 in diabetic patients. Both T2DM12 and DKD13 are associated with chronic, low-grade inflammation. On the other hand, serum UA,14 UHR15 and UA/CR16 are also linked with inflammatory conditions. Therefore, studying these parameters in diabetic subjects with renal impairment makes sense. This study aimed to explore the correlation between UA, UA/CR, UHR and DKD in patients with T2DM and to compare the diagnostic value of UA, UA/CR and UHR for kidney impairment.
Methods
Study Population
A total of 1326 adult T2DM patients who were hospitalized in the endocrinology department at Tianjin First Central Hospital from January 2020 to December 2021 were retrospectively selected as the research subjects. The inclusion criteria were (1) T2DM diagnosis according to the World Health Organization criteria17 and (2) age ≥18 years. The exclusion criteria were (1) type 1 diabetes or other special types of diabetes; (2) urinary tract infection, primary kidney disease, rapid decrease in eGFR, and rapid increase in urinary protein; (3) acute gout; (4) taking lipid-lowering drugs, diuretics, or drugs that affect the absorption or excretion of UA in the past 3 months; (5) serious cardiovascular and cerebrovascular disease, malignant tumor, rheumatic disease, or acute internal and surgical diseases, and patients who were pregnant or lactating; and (6) incomplete clinical data. This study was approved by the ethics review board of Tianjin First Center Hospital and complied with the Helsinki Declaration. Written consent was not required because of the retrospective observational study design. The participant information was anonymized prior to analysis.
Data Collection
Demographic information was collected by physicians. Height and weight were measured by electronic scales. Two seated blood pressure measurements were obtained by a well-trained nurse following a standard protocol using a mercury sphygmomanometer after the patients had rested quietly for at least 5 min, and the average of the two measurements was used for analysis. The patients fasted for at least 8 hours overnight, and blood and urine samples were collected the following morning. All blood and urine samples were tested immediately after collection. The tests included hemoglobin A1c (HbA1c) (Bio-Rad V ARIANTII TURBO, America), fasting blood glucose (FBG), serum UA, blood urea nitrogen (BUN), serum CR, triglyceride (TG), total cholesterol (TC), HDL-C, low-density lipoprotein cholesterol (LDL-C), and albumin excretion rate (AER) (Roche Cobas c 701, Germany).
Definitions
UA/CR = serum uric acid (mg/dl)/serum creatinine (mg/dl). UHR = serum uric acid (mg/dl)/HDL-C (mg/dl)*100%. The eGFR was calculated using the CKD-EPI formula, which is currently recommended by KDIGO.18 Remnant cholesterol (RC) was estimated as TC minus LDL-C minus HDL-C.19 Hypertension was defined as an average of two measurements of systolic blood pressure (SBP) ≥140 mmHg or diastolic blood pressure (DBP) ≥90 mmHg, or current use of antihypertensive agents. Hyperuricemia was defined as an SUA level > 420 μmol/L in males or > 360 μmol/L in females.20 The definition of DKD is based on eGFR <60 mL/min/1.73 m2 and/or AER >30 mg/24 h over 3 months in a patient with T2DM without other types of kidney disease.21 Kidney impairment was defined as eGFR <60 mL/min/1.73 m2.22 Body mass index (BMI) was calculated as weight divided by the square of height.
Statistical Analysis
Data were analyzed using SPSS 25.0 software (SPSS Inc., Chicago, IL, USA). Categorical variables are expressed as numbers (percentages) and were compared using the chi-squared test. Kolmogorov–Smirnov test was used to evaluate the normality of variables. Continuous variables with a normal distribution are expressed as means ± standard deviation, and those without a normal distribution are expressed as medians (25th and 75th percentiles). The clinical parameters were compared among the three groups by one-way ANOVA (normally distributed data) or the Kruskal‒Wallis H-test (nonnormally distributed data). The Spearman correlation was used to analyze the correlations between UA levels, UA/CR or UHR and other variables. Logistic regression analyses were performed to investigate the association between UA, UA/CR, and UHR and the risk of DKD and kidney impairment in patients with T2DM. ROC analyses and AUC were then used to assess the ability of UA, UA/CR and UHR to discriminate kidney impairment in T2DM patients. The significance level was set at P < 0.05.
Results
Characteristics of Study Subjects
In total, 1326 patients, namely, 765 males and 561 females, with a mean age of 58.35±12.95 years, were included in this study (Figure 1). According to the eGFR, the population was divided into three groups: 889 cases in Group A (eGFR ≥ 90 mL/min/1.73 m2), 325 cases in Group B (60 mL/min/1.73 m2 ≤ eGFR <90 mL/min/1.73 m2), and 112 cases in Group C (eGFR<60 mL/min/1.73 m2), as shown in Table 1. Of note, the ratio of males to females, weight, BMI, DBP, TG, TC and LDL-C levels did not differ significantly across the three groups. Participants with lower eGFR showed higher age, SBP, BUN, CR, RC, AER and prevalence of hypertension and hyperuricemia. Conversely, patients with lower eGFR were shorter and had lower HDL-C, FBG and HbA1c. As shown in Figure 2, UA and UHR were significantly increased, while UA/CR was significantly decreased in the group with lower eGFR.
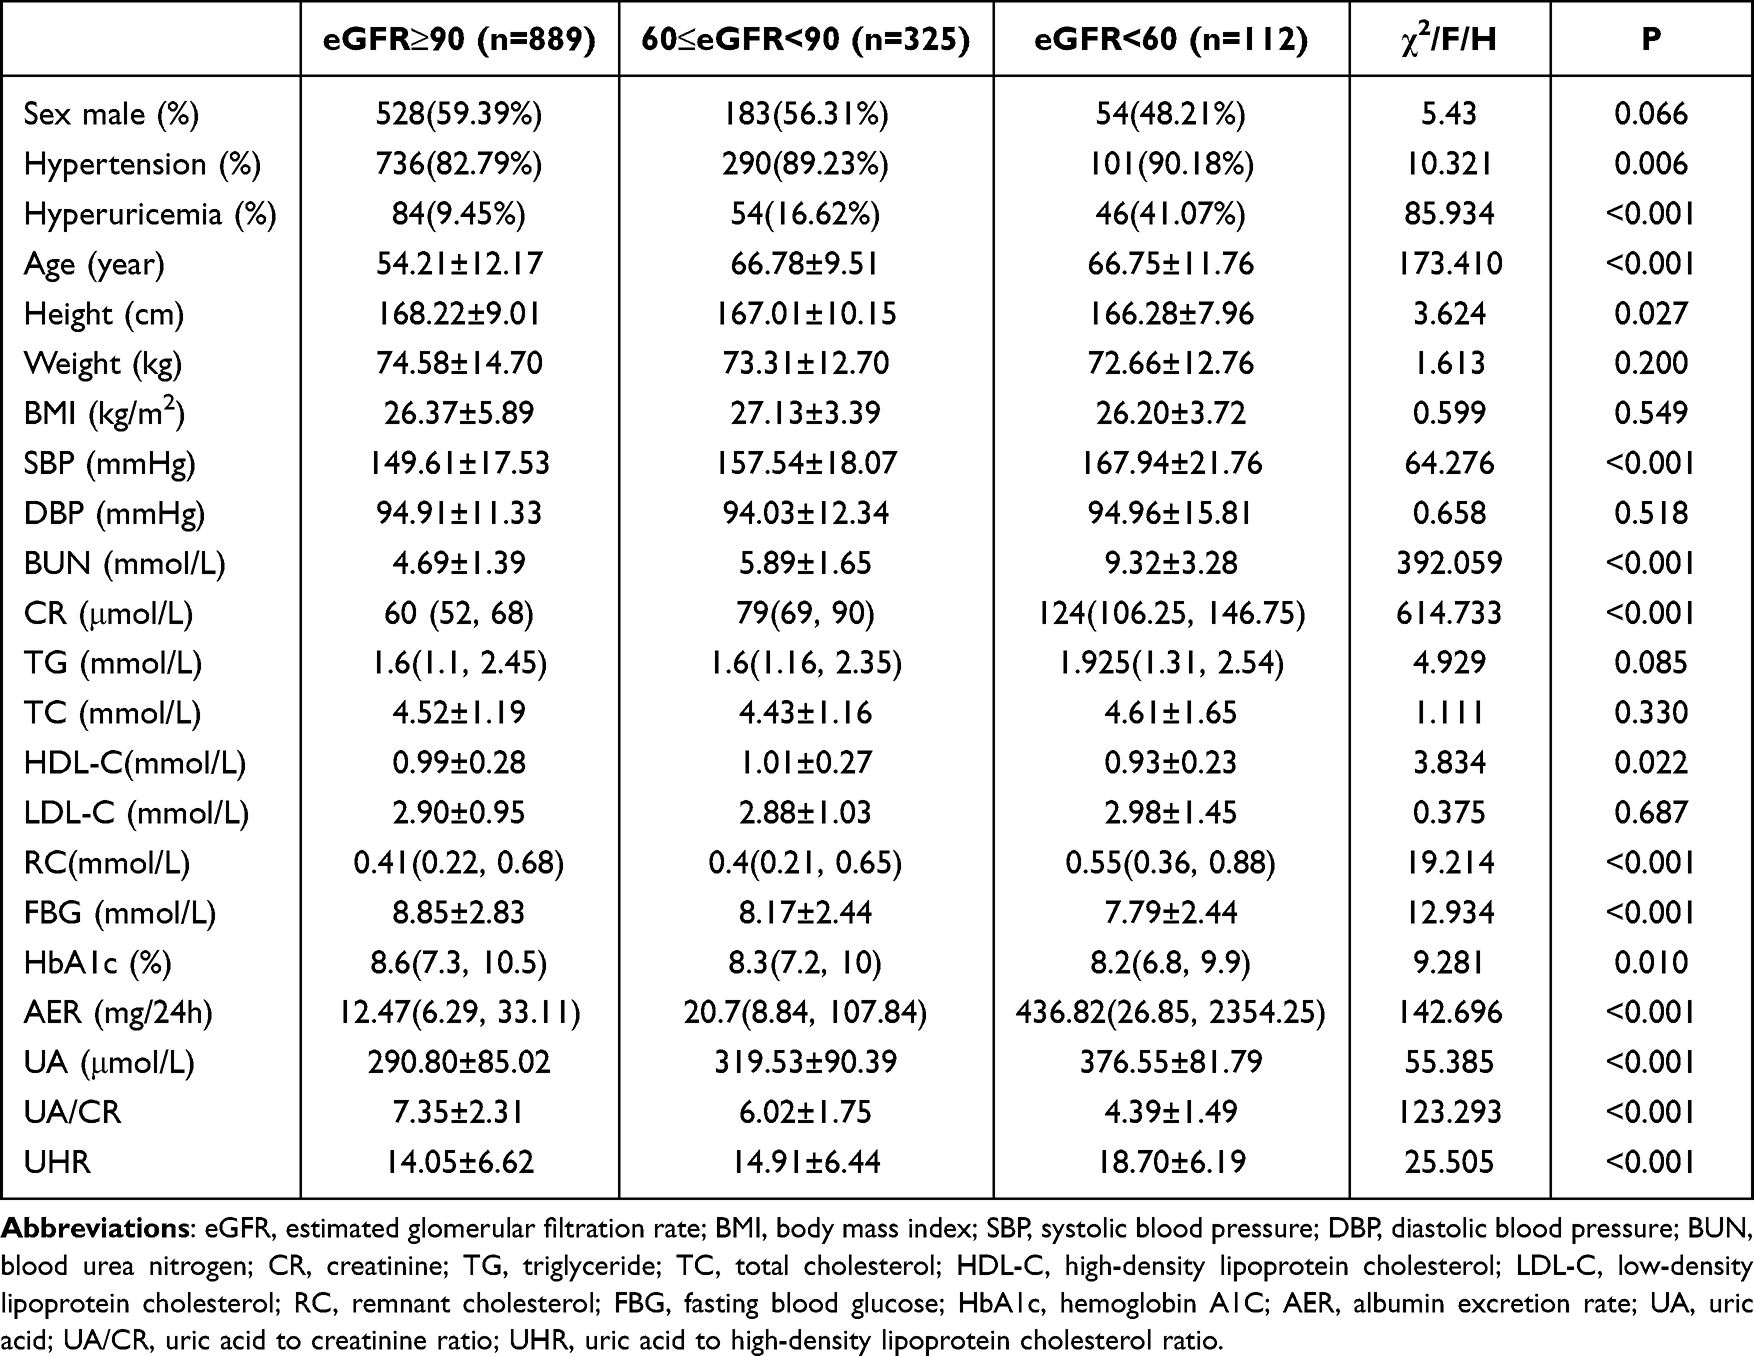 |
Table 1 Comparisons of Clinical Characteristics of T2DM Patients with Different eGFR (mL/min/1.73 m2) Levels |
 |
Figure 1 Flowchart of the patient selection process. |
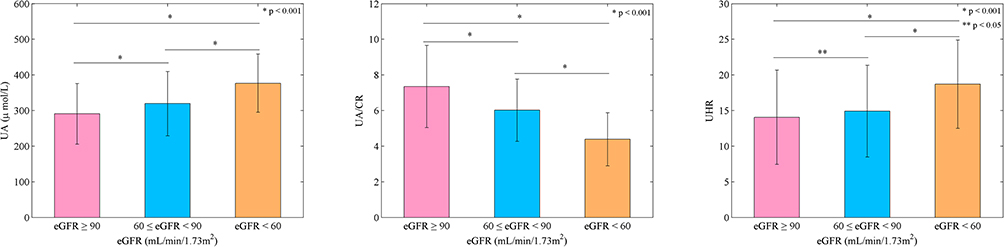 |
Figure 2 Comparisons of UA, UA/CR and UHR levels among different eGFR groups. Bars are shown as means ± SDs. * and ** denote significance at P value of <0.001 and <0.05, respectively. |
Spearman Correlation of UA, UA/CR and UHR with Clinical Variables
The Spearman correlation analysis results are shown in Table 2. UA was positively correlated with UA/CR, UHR, BMI, SBP, DBP, BUN, CR, TG, TC, RC and AER, and negatively correlated with age, HDL-C, HbA1c and eGFR (P < 0.05 for all). UA was not correlated with LDL-C or FBG (P > 0.05 for all). UA/CR was positively correlated with UA, UHR, BMI, DBP, TG, TC, RC and eGFR, and negatively correlated with age, SBP, BUN, CR, HDL-C and AER (P < 0.05 for all). UA/CR was not correlated with LDL-C, FBG or HbA1c (P > 0.05 for all). UHR was positively correlated with UA, UA/CR, BMI, DBP, BUN, CR, TG, RC and AER, and negatively correlated with age, TC, HDL-C, LDL-C and eGFR (P < 0.05 for all). UHR was not correlated with SBP, FBG or HbA1c (P > 0.05 for all).
 |
Table 2 Spearman Correlation of UA, UA/CR and UHR with Clinical Variables |
Logistic Regression Analysis of UA, UA/CR and UHR for DKD and Kidney Impairment in Patients with T2DM
As shown in Table 3, UA and UHR demonstrated a positive association with DKD risk (P < 0.05); their odds ratios (ORs) were 1.005 (95% CI, 1.004–1.007) and 1.057 (95% CI, 1.039–1.076), respectively. UA/CR was negatively correlated with DKD risk (OR, 0.922 (95% CI, 0.876, 0.970), P < 0.05).
 |
Table 3 Logistic Regression Analysis of UA, UA/CR and UHR for DKD |
Furthermore, to explore the role of UA, UA/CR and UHR in kidney impairment in patients with T2DM, a logistic regression model was used, as shown in Table 4. In the crude model, UA and UHR demonstrated a strong positive association with kidney impairment risk (OR, 1.009; 95% CI, 1.007–1.011; OR, 1.083; 95% CI, 1.056–1.110; P<0.001). In Model 2 (adjusted for sex, age, BMI, SBP and DBP), the positive correlation remained significant (OR, 1.012; 95% CI, 1.009–1.014; OR, 1.136; 95% CI, 1.102–1.171; P<0.001). In Model 3 (further adjusted for BUN, TG, TC, LDL-C, RC, FBG, HbA1C and AER), the correlation did not change significantly compared with the crude model (OR, 1.005; 95% CI, 1.002–1.009; P=0.002; OR, 1.077; 95% CI, 1.012–1.147; P=0.020). UA/CR was negatively correlated with kidney impairment risk in the unadjusted model (OR, 0.402; 95% CI, 0.341–0.473; P<0.001), and this association remained significant after adjustment for age, sex, BMI, SBP and DBP (OR, 0.393; 95% CI, 0.328–0.470; P<0.001). After further adjusting for BUN, TG, TC, LDL-C, RC, FBG, HbA1C and AER, a negative correlation still existed (OR, 0.406; 95% CI, 0.315–0.524; P =0.003).
 |
Table 4 Logistic Regression Analysis of UA, UA/CR and UHR for Kidney Impairment in Patients with T2DM |
ROC Curve Analyses of UA, UA/CR and UHR for the Prediction of Kidney Impairment in Type 2 Diabetic Participants
Figure 3 shows the ROC curve for UA, UA/CR and UHR as predictors of impaired renal function (eGFR <60 mL/min/1.73 m2). Higher AUC values indicate that a parameter can predict a disease better than the other parameter it is being compared with. UA had the highest AUC (0.762) among the three indicators. UHR had a greater AUC (0.713) than UA/CR, which had an AUC value of 0.148 (p < 0.001). Hence, based on the curve, UA can be said to be the best predictor of chronic kidney disease among the three indicators, and UHR is a better predictor than UA/CR.
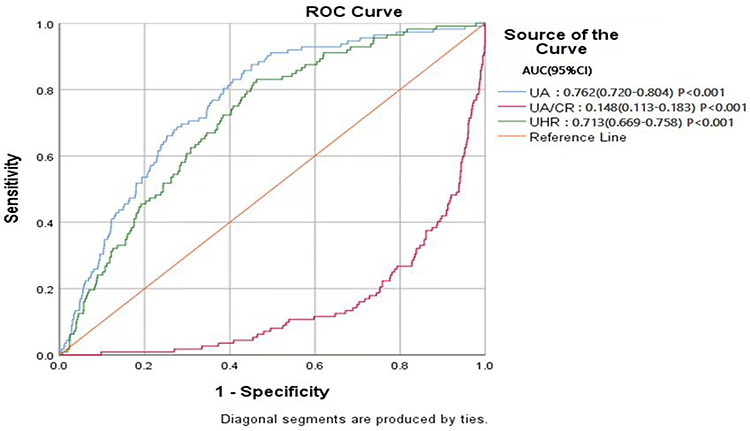 |
Figure 3 ROC for UA, UA/CR and UHR as predictors of impaired renal function (eGFR <60 mL/min/1.73 m2). |
Discussion
With the increasing prevalence of T2DM, the number of DKD patients is also increasing. DKD, which is defined as albuminuria, impaired glomerular filtration rate, or both,21 is the leading cause of end-stage renal disease in the world.23 Therefore, early diagnosis, finding predictors and controlling risk factors are of great significance for diabetes patients. This study is the first to evaluate the correlation between UA, UA/CR, UHR and DKD in patients with T2DM and the predictive value of the three indicators on kidney impairment. This study found that UA and UHR were positively correlated with DKD and renal impairment, while UA/CR was negatively correlated with DKD and renal impairment.
UA is the end product of purine metabolism, and many studies have found that UA is closely related to DKD. Yan reported that high UA was an independent risk factor for DKD in patients with T2DM.24 Another study was conducted on 3123 patients with T2DM. After 5 years of follow-up, 303 patients had a decreased glomerular filtration rate, and serum UA was independently and significantly associated with DKD risk.25 Hyperuricemia is a risk factor for diabetic nephropathy, and slightly elevated or elevated UA within the normal range is also associated with decreased renal function in diabetic patients. Zahid et al26 found that slightly elevated UA was associated with DKD in T2DM patients. Fukui et al27 reported that UA in the normal range was related to urinary microalbumin through a study of 343 patients with T2DM. Our study found that UA was positively correlated with AER and negatively correlated with eGFR. Consistent with previous studies, UA was a risk factor for DKD and kidney impairment. Therefore, we should pay attention to the detection and control of UA in patients with T2DM.
UHR, a comprehensive indicator of UA and blood lipids, has been proposed as a novel inflammatory and metabolic marker in recent research studies.28 Hyperuricemia may result in endocrine disorder by producing inflammatory reactions at low levels.29 HDL-C can exert antiatherosclerotic, anti-inflammatory and antioxidant effects by transporting lipids in peripheral blood and tissues to the liver, thereby inhibiting leukocyte adhesion molecules, proinflammatory factors, the activity of monocytes and their differentiation into macrophages.30–32 DKD was associated with chronic, low-grade inflammation.13 Hyperuricemia and low HDL-C levels were important and independent predictors of DKD.33 Our research indicates that UHR was positively correlated with AER and negatively correlated with eGFR and UHR was also an independent risk factor and predictive indicator of DKD. We found that the AUC value of UHR in detecting kidney impairment was 0.713. It was similar to the 0.69 AUC value reported in another study.34 In addition, Aktas et al9 found that UHR was significantly positively correlated with serum creatinine, fasting blood glucose and glycosylated hemoglobin and concluded that UHR could be used as a predictor of blood glucose control in male patients with T2DM. Other studies show that UHR was an important predictor of T2DM complicated with metabolic syndrome, and its predictive effect on metabolic syndrome was stronger than traditional indicators such as TG, HDL, etc.10,11 Another study in Chinese individuals with BMI<24 kg/m2 found that UHR was significantly associated with nonalcoholic fatty liver disease (NAFLD) and could be used as a novel and reliable marker for NAFLD in lean people.35 Jayashankar et al found that high serum UA and low HDL-C levels were independent predictors of coronary artery disease in Asian Indian patients with T2DM.36 Therefore, we suggest routine evaluation of UHR in patients with DKD.
UA/CR has emerged as a new biomarker and is considered to reflect endogenous UA levels more precisely than UA levels. Yao et al37 found that UA/CR was an independent risk factor for the progression of diabetic nephropathy in a retrospective cohort study of 3243 Chinese patients with T2DM. Kawamoto et al38 showed that the baseline UA/CR level was independently related to the risk of eGFR decline after 6 months in a prospective study of 344 rural elderly diabetes patients. However, the results of our cross-sectional study did not support their findings. We found that UA/CR was positively correlated with eGFR and negatively correlated with DKD and kidney impairment risk. UA/CR was also not a good indicator of renal impairment. Our study is consistent with a cross-sectional study by Ephraim et al.17 This may be because UA can be excreted through the gastrointestinal tract and kidneys, while CR is mainly excreted through the kidneys. Therefore, as CKD progresses due to the impaired excretion of CR, more CR tends to accumulate in the blood, and part of UA is excreted through the extrarenal route. Therefore, the increase in CR levels is often more than the increase in UA levels, thus reducing the UA/CR, which changes with the progression of CKD.
The present study has some limitations. First, this was a cross-sectional observational study. A causal relationship cannot be established directly based on the results of this study. Second, we continuously collected data from all participants at a particular location over a period of time; thus, our participants are representative of hospitalized patients with T2DM but not the general population with T2DM. Third, the lack of similar research makes it impossible to fully compare the results.
Conclusions
In conclusion, we showed that UA and UHR were positively associated with DKD and kidney impairment (eGFR < 60 mL/min/1.73 m2) risk, whereas UA/CR was negatively correlated with DKD and renal impairment in T2DM patients. UA is the best indicator of renal impairment among the three indicators, and UHR was a better indicator than UA/CR. Therefore, we suggest routine evaluation of UA and UHR in patients with DKD along with other markers such as CR, GFR, and AER.
Data Sharing Statement
All data are included in the manuscript.
Disclosure
The authors declare no conflicts of interest in this work.
References
1. Gheith O, Farouk N, Nampoory N, et al. Diabetic kidney disease: world wide difference of prevalence and risk factors. J Nephrol. 2016;5(1):49–56.
2. Collins AJ, Foley RN, Herzog C, et al. US renal data system 2010 annual data report. Am J Kidney Dis. 2011;57:1–526. doi:10.1053/j.ajkd.2010.10.007
3. Murea M, Tucker BM. The physiology of uric acid and the impact of end-stage kidney disease and dialysis. Semin Dialysis. 2019;32(1):47–57. doi:10.1111/sdi.12735
4. Bjelakovic B, Stefanutti C, Bonic D, et al. Serum uric acid and left ventricular geometry pattern in obese children. Atherosclerosis Supp. 2019;40:88–93. doi:10.1016/j.atherosclerosissup.2019.08.035
5. Taniguchi Y, Hayashi T, Tsumura K, et al. Serum uric acid and the risk for hypertension and Type 2 diabetes in Japanese men: the Osaka health survey. J Hypertension. 2001;19(7):1209–1215. doi:10.1097/00004872-200107000-00005
6. Caliceti C, Calabria D, Roda A, et al. Fructose intake, serum uric acid, and cardiometabolic disorders: a critical review. Nutrients. 2017;9(4):395. doi:10.3390/nu9040395
7. Fried LF, Shlipak MG, Crump C, et al. Renal insufficiency as a predictor of cardiovascular outcomes and mortality in elderly individuals. J Am Coll Cardiol. 2003;41(8):1364–1372. doi:10.1016/S0735-1097(03)00163-3
8. Tao J, Shen X, Li J, et al. Serum uric acid to creatinine ratio and metabolic syndrome in postmenopausal Chinese women. Medicine. 2020;99(17):19959. doi:10.1097/MD.0000000000019959
9. Aktas G, Kocak MZ, Bilgin S, et al. Uric acid to HDL cholesterol ratio is a strong predictor of diabetic control in men with type 2 diabetes mellitus. Aging Male. 2020;23(5):1098–1102. doi:10.1080/13685538.2019.1678126
10. Kocak MZ, Aktas G, Erkus E, et al. Serum uric acid to HDL-cholesterol ratio is a strong predictor of metabolic syndrome in type 2 diabetes mellitus. Rev Assoc Med Bras. 2019;65(1):9–15. doi:10.1590/1806-9282.65.1.9
11. Sun HP, Su H, Zheng RD, et al. Serum uric acid to high‑density lipoprotein cholesterol ratio is associated with visceral fat in patients with type 2 diabetes. Diabetes Metab Syndr Obes. 2023;16:959–967. doi:10.2147/DMSO.S403895
12. Kocak MZ, Aktas G, Erkus E, et al. Neuregulin-4 is associated with plasma glucose and increased risk of type 2 diabetes mellitus. Swiss Med Wkly. 2019;149:w20139. doi:10.4414/smw.2019.20139
13. Duman TT, Ozkul FN, Balci B. Could systemic inflammatory index predict diabetic kidney injury in type 2 diabetes mellitus? Diagnostics. 2023;13(12):2063. doi:10.3390/diagnostics13122063
14. Atak BM, Duman TT, Kocak MZ, et al. Serum uric acid level is associated with type 2 diabetes mellitus and diabetic regulation. Exp Biomed Res. 2018;1(4):135–139. doi:10.30714/j-ebr.2018443416
15. Aktas G, Khalid A, Kurtkulagi O, et al. Poorly controlled hypertension is associated with elevated serum uric acid to HDL-cholesterol ratio: a cross-sectional cohort study. Postgrad Med. 2022;134(3):297–302. doi:10.1080/00325481.2022.2039007
16. Wang A, Tian X, Wu S, et al. Metabolic factors mediate the association between serum uric acid to serum creatinine ratio and cardiovascular disease. J Am Heart Assoc. 2021;10(23):e023054. doi:10.1161/JAHA.121.023054
17. Alberti KGMM, Zimmet PZ. Definition, diagnosis and classification of diabetes mellitus and its complications. Part 1: diagnosis and classification of diabetes mellitus. Provisional report of a WHO Consultation. Diabetic Med. 1998;15(7):539–553. doi:10.1002/(SICI)1096-9136(199807)15:7<539::AID-DIA668>3.0.CO;2-S
18. Kidney disease: improving global outcomes (KDIGO) CKD work. KDIGO 2012 clinical practice guideline for the evaluation and management of chronic kidney disease. Kidney Int Suppl. 2013;3:1–150.
19. Yan P, Xu Y, Miao Y, et al. Association of remnant cholesterol with chronic kidney disease in middle-aged and elderly Chinese: a population-based study. Acta Diabetol. 2021;58:1615–1625. doi:10.1007/s00592-021-01765-z
20. Zhou JG. Chinese multi-disciplinary consensus on the diagnosis and treatment of hyperuricemia and its related diseases. Chinese Med J-Peking. 2017;56(3):235–248.
21. American Diabetes Association. Microvascular complications and foot care: standards of medical care in diabetes-2020. Diabetes Care. 2020;43:135–151.
22. Ephraim RKD, Awuku YA, Numekevor P, et al. Serum Uric acid is a better indicator of kidney impairment than serum uric acid to creatine ratio; a cross sectional study of type 2 diabetes mellitus patients. J Diabetes Metab Dis. 2021;20:313–320. doi:10.1007/s40200-021-00746-x
23. Thomas MC, Brownlee M, Susztak K, et al. Diabetic kidney disease. Nat Rev Dis Primers. 2015;1:15018. doi:10.1038/nrdp.2015.18
24. Yan D, Tu Y, Jiang F, et al. Uric acid is independently associated with diabetic kidney disease: a cross-sectional study in a Chinese population. PLoS One. 2015;10(6):0129797.
25. Wang J, Yu Y, Li X, et al. Serum uric acid levels and decreased estimated glomerular Filtration rate in patients with type 2 diabetes: a cohort study and meta-analysis. Diabetes-Metab Res. 2018;34(7):3046. doi:10.1002/dmrr.3046
26. Zahid KM, Gulali A, Tuba TD, et al. Is Uric Acid elevation a random finding or a causative Agent of diabetic nephropathy? Rev Assoc Med Bras. 1992;65(9):1155–1160.
27. Fukui M, Tanaka M, Shiraishi E, et al. Serum uric acid is associated with microalbuminuria and subclinical atherosclerosis in men with type 2 diabetes mellitus. Metabolism. 2008;57(5):625–629. doi:10.1016/j.metabol.2007.12.005
28. Kosekli MA, Kurtkulagii O, Kahveci G, et al. The association between serum uric acid to high density lipoprotein-cholesterol ratio and non-alcoholic fatty liver disease: the abund study. Rev Assoc Med Bras. 2021;67(4):549–554. doi:10.1590/1806-9282.20201005
29. Yuan HJ, Yang XG, Shi XY, et al. Association of serum uric acid with different levels of glucose and related factors. Chin Med J. 2011;124:1443–1448.
30. Li XP, Zhao SP, Zhang XY, et al. Protective effect of high density lipoprotein on endothelium-dependent vasodilatation. Int J Cardiol. 2000;73(3):231–236. doi:10.1016/S0167-5273(00)00221-7
31. Parthasarathy S, Barnett J, Fong LG. High-density lipoprotein inhibits the oxidative modification of low-density lipoprotein. BBA-Biomembranes. 1990;1044(2):275–283. doi:10.1016/0005-2760(90)90314-n
32. Barter PJ, Baker PW, Rye KA. Effect of high-density lipoproteins on the expression of adhesion molecules in endothelial cells. Curr Opin Lipidol. 2002;13(3):285–288. doi:10.1097/00041433-200206000-00008
33. Sacks FM, Hermans MP, Fioretto P, et al. Association between plasma triglycerides and high-density lipoprotein cholesterol and microvascular kidney disease and retinopathy in type 2 diabetes mellitus: a global case-control study in 13 countries. Circulation. 2014;129:999–1008. doi:10.1161/CIRCULATIONAHA.113.002529
34. Aktas G, Yilmaz S, Kantarci DB, et al. Is serum uric acid-to-HDL cholesterol ratio elevation associated with diabetic kidney injury? Postgrad Med. 2023;135(5):519–523. doi:10.1080/00325481.2023.2214058
35. Zhang YN, Wang QQ, Chen YS, et al. Association between serum uric acid to HDL-Cholesterol ratio and nonalcoholic fatty liver disease in lean Chinese adults. Int J Endocrinol. 2020;2020:5953461. doi:10.1155/2020/5953461
36. Jayashankar C, Andrews H, Pinnelli VB, et al. Serum uric acid and low-density lipoprotein cholesterol levels are independent predictors of coronary artery disease in Asian Indian patients with type 2 diabetes mellitus. J Nat Sci Biol Med. 2016;7(2):161–165. doi:10.4103/0976-9668.184703
37. Yao C, Gu L, Wang T, et al. The association between serum uric acid to creatinine ratio and renal disease progression in type 2 diabetic patients in Chinese communities. J Diabetes Complicat. 2019;33(7):473–476. doi:10.1016/j.jdiacomp.2018.10.013
38. Kawamoto R, Ninomiya D, Kikuchi A, et al. Serum uric acid to creatinine ratio is a useful predictor of renal dysfunction among diabetic persons. Diabetes Metab Synd. 2019;13(3):1851–1856. doi:10.1016/j.dsx.2019.04.023
 © 2023 The Author(s). This work is published and licensed by Dove Medical Press Limited. The full terms of this license are available at https://www.dovepress.com/terms.php and incorporate the Creative Commons Attribution - Non Commercial (unported, v3.0) License.
By accessing the work you hereby accept the Terms. Non-commercial uses of the work are permitted without any further permission from Dove Medical Press Limited, provided the work is properly attributed. For permission for commercial use of this work, please see paragraphs 4.2 and 5 of our Terms.
© 2023 The Author(s). This work is published and licensed by Dove Medical Press Limited. The full terms of this license are available at https://www.dovepress.com/terms.php and incorporate the Creative Commons Attribution - Non Commercial (unported, v3.0) License.
By accessing the work you hereby accept the Terms. Non-commercial uses of the work are permitted without any further permission from Dove Medical Press Limited, provided the work is properly attributed. For permission for commercial use of this work, please see paragraphs 4.2 and 5 of our Terms.