")
Back to Journals » Infection and Drug Resistance » Volume 16
Serum Cytokine Biomarkers for Use in Diagnosing Pulmonary Tuberculosis versus Chronic Pulmonary Aspergillosis
Authors Ren W, Li H, Guo C, Shang Y , Wang W, Zhang X, Li S , Pang Y
Received 13 January 2023
Accepted for publication 4 April 2023
Published 14 April 2023 Volume 2023:16 Pages 2217—2226
DOI https://doi.org/10.2147/IDR.S403401
Checked for plagiarism Yes
Review by Single anonymous peer review
Peer reviewer comments 3
Editor who approved publication: Prof. Dr. Héctor Mora-Montes
Weicong Ren,1,* Haoran Li,1,* Can Guo,1,2 Yuanyuan Shang,1 Wei Wang,1 Xuxia Zhang,1 Shanshan Li,1 Yu Pang1
1Department of Bacteriology and Immunology, Beijing Chest Hospital, Capital Medical University/Beijing Tuberculosis and Thoracic Tumor Research Institute, Beijing, People’s Republic of China; 2Department of Tuberculosis, Beijing Chest Hospital, Capital Medical University/Beijing Tuberculosis & Thoracic Tumor Research Institute, Beijing, People’s Republic of China
*These authors contributed equally to this work
Correspondence: Yu Pang; Shanshan Li, Email [email protected]; [email protected]
Background: Aspergillus fumigatus-induced chronic pulmonary aspergillosis (CPA), the most common pulmonary tuberculosis (TB) sequela, tends to occur after pulmonary infection with the intracellular pathogen Mycobacterium tuberculosis (Mtb). Timely and accurate detection of A. fumigatus infection of pulmonary TB patients would undoubtedly greatly improve patient prognosis. Currently, the galactomannan (GM) antigen test is commonly used to detect A. fumigatus infection but has poor sensitivity that renders this assay inadequate for use in clinical practice.
Design or Methods: Given the fact CPA and TB induce different host immune responses, we evaluated serum cytokine level profiles of CPA, TB patients and patients with both diseases (CPA-TB) for multiple cytokines and cytokine combinations.
Results: The results revealed significantly higher serum levels of numerous proinflammatory cytokines, including IL-1β, IL-6, IL-8, IL-12p70, IFN-α, IFN-γ and TNF-α, in peripheral blood of CPA-TB patients versus that of TB patients. IL-8 levels alone provided the best discriminatory performance for distinguishing between TB and either CPA-TB patients (AUC = 0.949) or CPA patients (AUC = 0.964). Moreover, both IL-8 and TNF-α (AUC = 0.996) levels could be used to distinguish between TB and CPA-TB patients. Likewise, IL-8, TNF-α and IL-6 levels together could be used to distinguish between CPA-TB and TB patients.
Conclusion: In this study, multiple cytokines were identified that may serve as potential biomarkers for use in detecting TB patients with CPA. Furthermore, our results should enhance understanding of how immune system dysfunctions influence susceptibility to Mtb and/or A. fumigatus infections.
Keywords: Aspergillus fumigatus, Mycobacterium tuberculosis, cytokine profiles, IL-8, galactomannan
Introduction
In 2020, tuberculosis (TB), an infectious disease caused by Mycobacterium tuberculosis (Mtb) complex, afflicted an estimated 9.9 million people and caused 1.5 million deaths worldwide.1 Only 59% of reported pulmonary TB (PTB) cases were bacteriologically confirmed, highlighting the urgent need for improved access to accurate TB diagnostics in TB-endemic areas.1,2 China’s TB burden is second only to that of India, with approximately 0.85 million incident Chinese TB cases reported in 2020.1 Despite great achievements in TB control in China, a recent nationwide survey there revealed an active TB prevalence rate of 442 cases per 100,000 population that is preventing realization of global World Health Organization END TB Strategy goals.3 Therefore, intensive research efforts are urgently needed to accelerate development of more effective TB diagnostics, drugs and vaccines.
Aspergillus fumigatus (A. fumigatus) is the major causative agent of aspergillosis, a disease that induces various pulmonary disease manifestations in patients afflicted with predisposing immune system and pulmonary conditions.4 Importantly, chronic pulmonary aspergillosis (CPA), which shares signs and symptoms with pulmonary TB (PTB), is the most frequently reported PTB sequela and incurs an estimated global CPA burden of approximately 1.2 million cases that is second only to that of TB.5,6 Although CPA incidence and progression signs and symptoms can be very mild, CPA was found to be associated with high 5-year mortality rates, which approached 80% in one retrospective study.7,8 Notably, early initiation of oral azole drug administration can effectively prevent CPA clinical progression and significantly reduce mortality.9,10 Therefore, timely detection and accurate identification of the causative agent of CPA, A. fumigatus, is of great importance for proper management of the disease. Unfortunately, it is currently not possible to quickly differentiate pulmonary aspergillosis from pulmonary TB based on clinical signs and symptoms. However, the galactomannan (GM) antigen test has aided clinical CPA diagnosis despite its limited sensitivity,11 thus highlighting the urgent need for new diagnostic methods. In recent years, researchers have developed new methods, with results of several studies confirming that assays based on detection of serum Aspergillus-specific IgG may be effective alternatives to the GM antigen test for use in CPA case detection.12,13 Nevertheless, Aspergillus-specific IgG assay results are dramatically influenced by factors related to regional geographic location and gender,13,14 thus prompting researchers to continue their efforts to develop more reliable sensitive and specific CPA diagnostic tests.
The major host mechanism for eliminating Mtb, a facultative intracellular pathogenic organism, is the Th1 immune response, which acts by inducing host production of Th1 cytokines (eg, IFN-γ). The Th1 response is also a major host response to A. fumigatus infection and release of Th1 cytokines, although A. fumigatus infection also induces differentiation of host T cells into Th2 cells that antagonize Th1 cell functions.15–17 Nonetheless, interactions between TB and A. fumigatus infection-based processes are unclear and controversial, thus prompting us to hypothesize that serum cytokine profiles of PTB patients co-infected with Mtb and A. fumigatus (CPA-TB patients) may differ from profiles of PTB patients without CPA (TB patients) or CPA patients without TB (CPA patients). In this study, we characterized peripheral blood serum cytokine profiles for CPA-TB, CPA and TB patient groups then identified potential diagnostic cytokine-based biomarkers alone or in combination for use in diagnostically discriminating among the three types of patient groups (CPA, TB, CPA-TB) and healthy controls.
Patients and Methods
Subjects and Ethics Statement
A total of 152 study participants, including 31 subjects in the healthy control (HC) group and 35 PTB and 86 CPA patients, were recruited at the Beijing Chest Hospital from December 2020 to November 2021. All patients included in this study were hospitalized for the first time and had not previously received drug treatments for TB or CPA. PTB patients were diagnosed based on clinical symptoms suggestive of active TB and additional evidence of active TB based on positive sputum smear test-based detection of acid-fast bacilli (AFB) and/or positive results of GeneXpert MTB/RIF and/or mycobacterial culture testing. CPA patients were diagnosed based on positive galactomannan (GM) antigen assay results indicating detection of A. fumigatus infection. All patients were admitted to the hospital before receiving treatment. Meanwhile, 31 healthy volunteers were also recruited after they were confirmed to be healthy and free of active TB and CPA diseases based on results of physical examinations, bacteriological testing and IFN-γ release assays (Table 1). All blood samples were collected from fasting patients at around 8 a.m. then were stored in a refrigerator. This study was approved by the Ethics Committee of Beijing Chest Hospital, Capital Medical University. Due to the fact that the samples used in this study were stored, tested and analyzed retroactively, use of patient samples posed at most a minimal risk of harm to study subjects. Consequently, the university’s institutional review board approved a waiver of patient informed consent.
 |
Table 1 Demographic Characteristics of Participants Included in the Cohort |
Serum GM Antigen Testing
Peripheral blood samples were collected using heparin anticoagulant blood collection tubes (Becton, Dickinson and Company, USA) then sera were isolated by centrifugation at 4000 rpm for 10 min. Serum GM antigen levels were measured using a commercial sandwich enzyme-linked immunosorbent assay (ELISA) kit (Platelia™ Aspergillus; Bio-Rad, CA). An optical density (OD) index value of ≥0.5 was interpreted as a positive result.
Multiplex Cytokine Assays
Serum samples were stored frozen at −80°C prior to Luminex Technologies xMAP system-based testing in singlicate (Luminex Austin, TX). Serum cytokine concentrations were measured using twelve cytokine test kits (AtomLife, Nanjing, China) as per the manufacturer’s instructions. Briefly, antibody-conjugated magnetic beads, assay buffer, standards and samples were added to 96-well plates followed by addition of cytokine-specific antibodies and streptavidin-PE. Mean fluorescence intensity readings for each cytokine were taken using a Luminex Technologies xMAP system (Luminex Austin, TX). The twelve cytokines and corresponding detection limits were as follows: IL-1β (3–7500 pg/mL), IL-2 (4–5000 pg/mL), IL-4 (3–7500 pg/mL), IL-5 (3–7500 pg/mL), IL-6 (2–5000 pg/mL), IL-8 (3–7500 pg/mL), IL-10 (3–5000 pg/mL), IL-12p70 (4–5000 pg/mL), IL-17 (5–5000 pg/mL), IFN-γ (5–5000 pg/mL), IFN-α (5–5000 pg/mL) and TNF-α (4–5000 pg/mL).
Statistical Analysis
All statistical analyses were performed using SPSS version 20.0 software (IBM Corp., Armonk, NY) in combination with GraphPad Prism 5.0 software (GraphPad). Continuous variables were expressed as median (range) values and categorical variables were expressed as percentages (%). Univariable logistic regression models were generated for use in estimating risk factors associated with a dual diagnosis of active PTB with CPA. Mann–Whitney U-tests were used to compare differences in cytokine responses between two groups. The diagnostic performance of each cytokine or cytokine combination was evaluated based on receiving operating characteristic (ROC) curves. Optimal sensitivity and specificity were estimated using Youden’s index and optimal cut-off values that were used to interpret positive versus negative results were estimated based on the maximum Youden’s index value. The proportion of correctly diagnosed patients was calculated based on its proportionality to the area under the curve (AUC). Differences between groups were declared significant for results with two-sided P values of <0.05.
Results
Characteristics of Enrolled Patients
In this retrospective study, hospitalized patients with pulmonary infections receiving treatment at Beijing Chest Hospital from December 2020 to November 2021 were enrolled. Laboratory test results revealed 35 patients that were afflicted with PTB, 40 patients with PTB and CPA and 46 patients with CPA alone (Table 1). Statistical analysis of clinical data revealed elevated blood levels of leukocytes (TB vs CPA-TB: 5.34 × 10⁶/mL vs 6.96 × 10⁶/mL, P = 0.048) and neutrophils (TB vs CPA-TB: 3.20 × 10⁶/mL vs 5.04 × 10⁶/mL, P = 0.007) in CPA-TB group patients.
Cytokine Spectrum Differences Between PTB and CPA Patients
In order to diagnose PTB patients with concomitant CPA as early as possible to thereby administer maximally effective treatments, serum cytokine profiles were analyzed for the three groups of patients and the HC group. As shown in Figure 1, as compared with HC group results, a large number of serum cytokines (IL-1β, IL-6, IL-8, IL-12p70, TNF-α and IFN-γ) were detected at significantly increased levels in some or all patient groups. Among them, IL-1β and IL-12p70 levels were significantly increased in CPA patient group sera (CPA/CPA-TB vs HC/TB, P < 0.01 or < 0.001), but not in sera of patients with TB alone (TB vs HC, P > 0.05). Meanwhile, levels of IL-6, IL-8 and TNF-α in CPA and CPA-TB patient groups were also higher than corresponding levels in patients with TB alone (CPA/CPA-TB vs TB, P < 0.01 or < 0.001), although levels of these three cytokines were also significantly increased in the TB patient group as compared to the HC group (TB vs HC, P < 0.01 or < 0.001). IFN-γ levels were significantly elevated in all three patient groups (CPA/CPA-TB/TB vs HC, P < 0.01 or < 0.001), with no differences observed between the TB patient group levels versus levels of CPA or CPA-TB groups (CPA/CPA-TB vs TB, P > 0.05). By contrast, significantly decreased IL-4 and IL-5 levels were observed in all three patient groups as compared to the HC group (CPA/CPA-TB/TB vs HC, P < 0.05 or < 0.01), with no differences observed between CPA or CPA-TB group levels of these cytokines and corresponding TB group levels (CPA/CPA-TB vs TB, P > 0.05). Moreover, significantly decreased serum IFN-α levels (as compared to that of the HC group) were only observed for the TB group (TB vs HC, P < 0.05), while differences in serum IL-10 levels were noted among the four groups. Notably, intergroup analyses of all cytokine profiles revealed significant serum cytokine level differences between CPA-TB and CPA groups for multiple cytokines. However, IL-2 and IL-17 levels could not be accurately measured since levels of these cytokines mainly fell below the minimum detection limit of the cytokine assays used in this study (Supplementary Table 1).
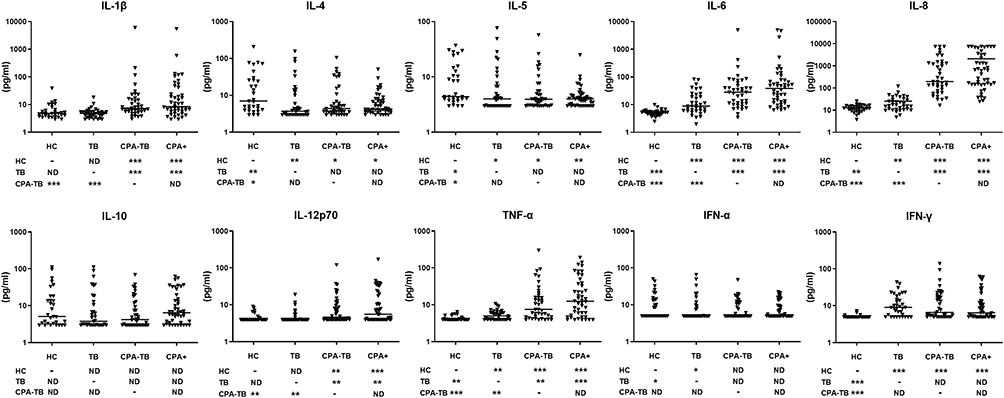 |
Figure 1 Difference in cytokine spectrum between tuberculosis (TB) and chronic pulmonary aspergillosis (CPA). HC, healthy control; CPA-TB, tuberculosis infection and GM positive; CPA+, GM positive and suffering from tumor and or pneumonia; Data denoting means ± SDs. *P < 0.05, **P < 0.01 and ***P < 0.001. Abbreviation: ND, no difference. |
ROC Analyses
Due to the fact that most cytokine levels in sera of CPA patients were significantly different between TB and HC groups, we proposed a stepwise algorithm for use in diagnosing suspected CPA patients. We next performed ROC analysis of cytokine level results obtained for all three patient groups (without the HC group) then compared ROC results based on serum cytokine results obtained for the TB group to results obtained for the CPA-TB group (Figure 2, Supplementary Table 2). The results showed that differences in serum IL-8, IL-1β and IL-6 levels could be used to accurately distinguishing between the two groups, as reflected by AUC values of 0.949, 0.777 and 0.728 obtained for the three cytokines, respectively (Figure 2). Due to the excellent discriminatory accuracy of IL-8, IL-8 levels in combination with IL-1β and IL-6 levels for CPA-TB and TB groups were analyzed together (Figure 2). The results of this analysis demonstrated that greatest discriminatory accuracy could be obtained by combining IL-6 and IL-8 level profiles, as reflected by an AUC value of 0.958. Results of a similar analysis of TB group and CPA group cytokine profiles (Figure 3, Supplementary Table 3) revealed that IL-8 profiles alone most accurately discriminated between these groups, as reflected by the highest AUC value of 0.964, followed by AUC values for IL-1β (0.818) and TNF-α (0.788) (Figure 3). Similarly, we analyzed combinations of the three cytokines (Figure 3), which produced a highest AUC value of 0.996 for IL-8 and TNF-α analyzed together and a slightly lower AUC value for IL-8 and IL-1β analyzed together (0.974). We next investigated whether the abovementioned results were specifically related to CPA by analyzing individual and combined cytokine profiles obtained for CPA-TB and TB groups using ROC analysis (Figure 4, Supplementary Table 4). AUC values obtained for individual cytokines revealed a highest AUC value for IL-8 (0.957), followed in descending order by AUC values obtained for IL-1β (0.798), IL-6 (0.760) and TNF-α (0.750). Notably, ROC analysis of levels of IL-8 in combination with TNF-α and IL-6 levels produced the highest AUC value overall (0.984). As expected, no potential cytokine marker profile could be used to diagnostically differentiate between CPA and CPA-TB patients (Supplementary Figure 1), although this combination of markers may be useful for detecting A. fumigatus infections in patients with other pulmonary infections.
 |
Figure 2 Receiving operating characteristic (ROC) curve analysis between tuberculosis (TB) and CPA-TB groups. CPA-TB, tuberculosis infection and GM positive. Abbreviation: AUC, area under the curve. |
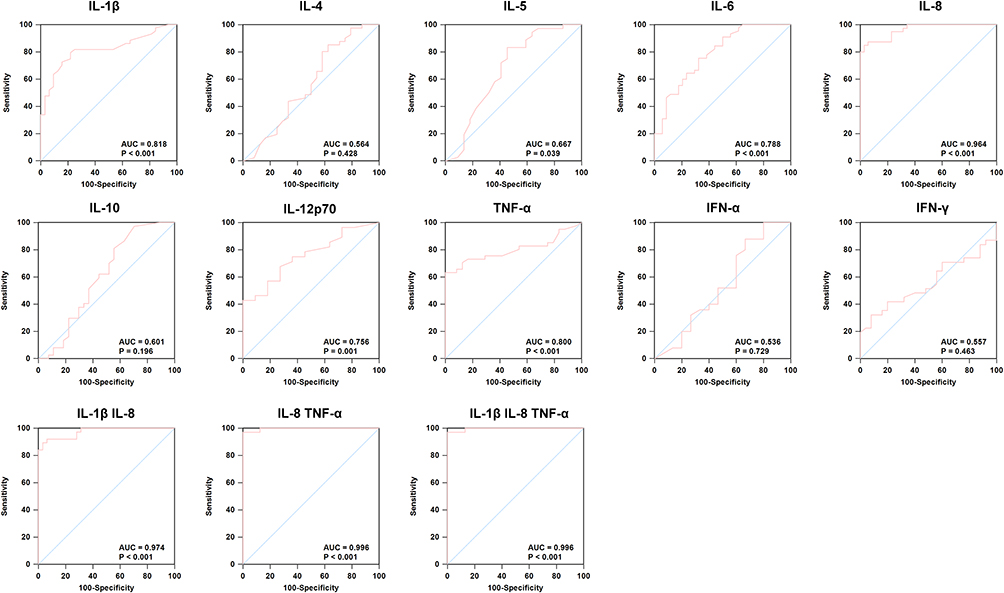 |
Figure 3 Receiving operating characteristic (ROC) curve analysis between tuberculosis (TB) and CPA+ groups. CPA+, GM positive and Tumors/Pneumonia. Abbreviation: AUC, area under the curve. |
 |
Figure 4 Receiving operating characteristic (ROC) curve analysis between tuberculosis (TB) and CPA+ plus CPA-TB groups. CPA-TB, tuberculosis infection and GM positive; CPA+, GM positive and Tumors/Pneumonia. Abbreviation: AUC, area under the curve. |
Discussion
A. fumigatus-induced CPA is caused by inhalation of airborne conidia, which are common in indoor and outdoor environments,18 as reflected by detection of A. fumigatus DNA in 37% of healthy adult lung biopsies.19 CPA pathogenesis usually involves A. fumigatus colonization of the lung cavity followed by proliferation of the organisms within the lungs. This disease most frequently occurs in those afflicted with PTB, whereby 20% of cavernous TB patients develop CPA within 3 years after successful completion of anti-TB treatment, while each year more than 350,000 PTB patients develop CPA after completing 12 months of anti-TB treatment.20,21 At present, CPA diagnosis is based on clinical symptoms, imaging-based findings and results of GM antigen detection-based tests.22 However, due to the lack of a gold standard test for use in diagnosing CPA, it has been difficult to evaluate the performance of GM antigen detection assays and compare results across different studies.20,21,23
The phenomenon of co-infection with Mtb and A. fumigatus is clinically common and difficult to diagnose, due to shared pulmonary symptoms associated with both types of infection. Consequently, misdiagnoses of co-infected patients can occur that can prevent these patients from receiving early and accurate treatments.24,25 In turn, such circumstances undoubtedly increase patient disease burden and can greatly impact patient prognosis. Therefore, targeted and accurate diagnosis of CPA patients performed as early as possible would greatly minimize patient harm caused by missed diagnoses and misdiagnosis.
In recent years, accumulating evidence has confirmed that assays that measure serum Aspergillus antigen-specific IgG levels can serve as effective CPA detection methods, including a study conducted in China showing that such assays were more sensitive and specific than assays designed to detect serum Aspergillus antigen-specific IgA and IgM.12 However, regional geographic differences have been reported to greatly impact Aspergillus antigen-detection ability of the IgG-based assay.14 In turn, this issue has greatly hindered the promotion and unified application of this assay worldwide, especially in countries with regional geographic and climate diversity and population mobility. In addition, concomitant Mtb infection can increase overall IgG levels in serum,26–28 which can greatly reduce CPA diagnostic accuracy. Therefore, more diverse tests and methods are urgently needed to enable rapid diagnosis of the disease. In this study, we retrospectively tested 152 subjects who were assigned to 4 groups based on results of GM antigen testing and results of AFB sputum smear testing, GeneXpert MTB/RIF testing and/or Mtb culture testing. Our results revealed that cytokine levels hold promise as biomarkers for use in distinguishing among TB, CPA and CPA-TB patients and healthy controls that may reflect host immune response differences to Mtb and A. fumigatus infections. In fact, our results align with results of previous studies that demonstrated that A. fumigatus infection can lead to elevated patient blood leukocyte and neutrophil counts,29 while also inducing pulmonary epithelial cells to release inflammatory cytokines that, in turn, promote lymphocyte recruitment and trigger other inflammatory responses.30–32 Meanwhile, other studies have shown that immune responses of CPA and PTB patients differ, since pathogens associated with both PTB and CPA trigger a Th1 response, while the CPA pathogen also triggers a Th2 response.33,34 Here, we analyzed differences in serum cytokine profiles among four groups of study subjects. Interestingly, IL-4 and IL-5 levels exhibited downward trends after Mtb and/or A. fumigatus infection, with no cytokine level differences observed among TB, CPA-TB and CPA groups. In contrast, in all three patient groups, serum levels of various pro-inflammatory cytokines were found to be significantly elevated (relative to the HC group), including IL-1β, IL-6, IL-8, IL-12p70, IFN-α, IFN-γ and TNF-α. Of note, for all of these cytokines except IFN-α and IFN-γ, levels were significantly higher in CPA-TB group sera than in TB group sera, a result that aligns with results of a recent study on cytokine levels in bronchoalveolar lavage fluid samples obtained from patients with or without CPA.35
In view of the specificity of our results, we further compared ROC analysis results among the three groups of patients and found that IL-8 provided the best diagnostic performance among the abovementioned eight cytokines, as expected. Due to its role as the earliest cytokine released in response to infection that possesses chemotactic and neutrophil-activation properties, high-level expression of IL-8 in hosts infected with A. fumigatus has been widely reported,30,31 with a central role of IL-8 also reported in the host defense against Mtb.36 Collectively, the results of this study revealed that serum IL-8 levels of CPA patients exceeded levels in TB patient sera that highlight the potential importance of IL-8 in the host immune response to A. fumigatus infection.
The highest AUC value overall was obtained for IL-8 combined with TNF-α, thus suggesting that this marker combination may be useful for discriminating between patients with TB and CPA. In addition, a slightly lower AUC value was obtained for the combination of IL-8, TNF-α and IL-6 for discriminating among CPA, TB and CPA-TB patient groups. Taken together, our results revealed that multiple cytokines that were detected in sera of CPA-TB and CPA patients at high levels were also detected in TB group sera, thus suggesting that production of these cytokines is also triggered by the host immune response to Mtb infection. Furthermore, the results obtained here emphasize that use of a diagnostic assay based on a combination of serum cytokine-based markers can provide rapid, highly sensitive and specific results that can be used to screen PTB patients for CPA. Moreover, use of such a rapid assay would enable earlier CPA diagnosis by avoiding microbiological culture testing delays due to long microbial doubling times to thereby assist clinicians in decision making to ultimately improve patient treatment outcomes.
We also acknowledge several obvious limitations of this study. First, we only included active TB cases with positive IGRA test results, rather than latent TB infection (LTBI) cases, and GM antigen test is not sensitive to be used for immunocompetent patients. Therefore, our method may be an effective means to eliminate the influence of MTB in LTBI on the diagnosis of CPA, warranting further study. Second, considering levels of cytokines of interest overlapped markedly between TB and CPA-TB groups and between TB and CPA groups, single cytokines may have limited utility as biomarkers of A. fumigatus infection. Third, since this study is a retrospective study, and only a very small number of patients have the results of microscopy or culture from biopsy to further prove A. fumigatus infection, so we used GM test to diagnose CPA patients. Consequently, missed CPA diagnoses of patients in our very small study cohort may have occurred that may have limited our results. Regardless, although the sensitivity of the GM antigen test is limited, it is widely used to diagnose CPA patients in clinical settings, due to the assay advantages of simplicity and rapid turnaround time. Therefore, in future studies, the number of samples included should be further expanded in order to confirm and further clarify the results obtained here. At the same time, we are also actively establishing larger clinical cohorts to further verify the accuracy of our method.
In conclusion, our results demonstrate that elevated numbers of leukocytes and neutrophils are found in peripheral blood of PTB patients with CPA. Furthermore, significantly higher serum levels of proinflammatory cytokines, such as IL-1β, IL-6, IL-8, IL-12p70 and TNF-α, were found in CPA-TB and CPA patient groups than in TB group sera. Ultimately, IL-8 levels alone provided the best diagnostic performance when used to discriminate between TB and either CPA-TB or CPA patient groups, while excellent diagnostic performance was also provided by the combination of IL-8, TNF-α and IL-6 cytokine markers. Taken together, the results of this study indicate that multiple cytokines may serve as potential markers for use in achieving accurate diagnosis of TB and CPA cases, while also providing insights to enhance our understanding of the roles of immune response mechanisms in controlling Mtb and/or A. fumigatus infections.
Data Sharing Statement
All data contained in this study can be obtained from the corresponding author under reasonable request.
Ethics Approval and Consent to Participate
This study was approved by the Ethics committee of Beijing Chest Hospital, Capital Medical University (approval number: YJS-2019-016). The guidelines outlined in the Declaration of Helsinki were followed.
Consent for Publication
Written informed consent was obtained from the patient.
Acknowledgments
We would like to thank all the staffs participating this study from Beijing Chest Hospital.
Author Contributions
All authors made a significant contribution to the work reported, whether that is in the conception, study design, execution, acquisition of data, analysis and interpretation, or in all these areas; took part in drafting, revising or critically reviewing the article; gave final approval of the version to be published; have agreed on the journal to which the article has been submitted; and agree to be accountable for all aspects of the work.
Funding
This work was supported by the Beijing Hospitals Authority Ascent Plan (DFL20191601), the Beijing Hospitals Authority Clinical Medicine Development of Special Funding (ZYLX202122), The funders had no role in study design, data collection, analysis, interpretation or writing of the report.
Disclosure
The authors declare no conflicts of interest in this work.
References
1. World Health Organization. Global Tuberculosis Report 2022. World Health Organization; 2022.
2. MacLean E, Kohli M, Weber SF, et al. Advances in molecular diagnosis of tuberculosis. J Clin Microbiol. 2020;58(10). doi:10.1128/JCM.01582-19
3. Wang L, Zhang H, Ruan Y, et al. Tuberculosis prevalence in China, 1990–2010; a longitudinal analysis of national survey data. Lancet. 2014;383(9934):2057–2064. doi:10.1016/S0140-6736(13)62639-2
4. Kosmidis C, Denning DW. The clinical spectrum of pulmonary aspergillosis. Thorax. 2015;70(3):270–277. doi:10.1136/thoraxjnl-2014-206291
5. Page ID, Byanyima R, Hosmane S, et al. Chronic pulmonary aspergillosis commonly complicates treated pulmonary tuberculosis with residual cavitation. Eur Respir J. 2019;53(3). doi:10.1183/13993003.01184-2018
6. Denning DW, Pleuvry A, Cole DC. Global burden of chronic pulmonary aspergillosis as a sequel to pulmonary tuberculosis. Bull World Health Organ. 2011;89(12):864–872. doi:10.2471/BLT.11.089441
7. Ohba H, Miwa S, Shirai M, et al. Clinical characteristics and prognosis of chronic pulmonary aspergillosis. Respir Med. 2012;106(5):724–729. doi:10.1016/j.rmed.2012.01.014
8. Lowes D, Al-Shair K, Newton PJ, et al. Predictors of mortality in chronic pulmonary aspergillosis. Eur Respir J. 2017;49(2). doi:10.1183/13993003.01062-2016
9. Al-Shair K, Atherton GT, Harris C, Ratcliffe L, Newton PJ, Denning DW. Long-term antifungal treatment improves health status in patients with chronic pulmonary aspergillosis: a longitudinal analysis. Clin Infect Dis. 2013;57(6):828–835. doi:10.1093/cid/cit411
10. Camuset J, Nunes H, Dombret MC, et al. Treatment of chronic pulmonary aspergillosis by voriconazole in nonimmunocompromised patients. Chest. 2007;131(5):1435–1441. doi:10.1378/chest.06-2441
11. Zou M, Tang L, Zhao S, et al. Systematic review and meta-analysis of detecting galactomannan in bronchoalveolar lavage fluid for diagnosing invasive aspergillosis. PLoS One. 2012;7(8):e43347. doi:10.1371/journal.pone.0043347
12. Ma X, Wang K, Zhao X, et al. Prospective study of the serum Aspergillus-specific IgG, IgA and IgM assays for chronic pulmonary aspergillosis diagnosis. BMC Infect Dis. 2019;19(1):694. doi:10.1186/s12879-019-4303-x
13. Salzer HJF, Massango I, Bhatt N, et al. Seroprevalence of Aspergillus-specific IgG antibody among Mozambican tuberculosis patients. J Fungi. 2021;7(8):595. doi:10.3390/jof7080595
14. Lee MR, Huang HL, Chen LC, et al. Seroprevalence of Aspergillus IgG and disease prevalence of chronic pulmonary aspergillosis in a country with intermediate burden of tuberculosis: a prospective observational study. Clin Microbiol Infect. 2020;26(8):
15. Allard JB, Poynter ME, Marr KA, Cohn L, Rincon M, Whittaker LA. Aspergillus fumigatus generates an enhanced Th2-biased immune response in mice with defective cystic fibrosis transmembrane conductance regulator. J Immunol. 2006;177(8):5186–5194. doi:10.4049/jimmunol.177.8.5186
16. Cramer RA, Rivera A, Hohl TM. Immune responses against Aspergillus fumigatus: what have we learned? Curr Opin Infect Dis. 2011;24(4):315–322. doi:10.1097/QCO.0b013e328348b159
17. Bozza S, Clavaud C, Giovannini G, et al. Immune sensing of Aspergillus fumigatus proteins, glycolipids, and polysaccharides and the impact on Th immunity and vaccination. J Immunol. 2009;183(4):2407–2414. doi:10.4049/jimmunol.0900961
18. Wéry N. Bioaerosols from composting facilities--a review. Front Cell Infect Microbiol. 2014;4:42. doi:10.3389/fcimb.2014.00042
19. Denning DW, Park S, Lass-Florl C, et al. High-frequency triazole resistance found In nonculturable Aspergillus fumigatus from lungs of patients with chronic fungal disease. Clin Infect Dis. 2011;52(9):1123–1129. doi:10.1093/cid/cir179
20. Patterson TF, Thompson GR
21. Denning DW, Cadranel J, Beigelman-Aubry C, et al. Chronic pulmonary aspergillosis: rationale and clinical guidelines for diagnosis and management. Eur Respir J. 2016;47(1):45–68. doi:10.1183/13993003.00583-2015
22. Rhodes JC. Aspergillus fumigatus: growth and virulence. Med Mycol. 2006;44(Suppl 1):S77–S81. doi:10.1080/13693780600779419
23. Hayes GE, Novak-Frazer L. Chronic pulmonary Aspergillosis-where are we? And where are we going? J Fungi. 2016;2(2):18. doi:10.3390/jof2020018
24. Asner SA, Science ME, Tran D, Smieja M, Merglen A, Mertz D. Clinical disease severity of respiratory viral co-infection versus single viral infection: a systematic review and meta-analysis. PLoS One. 2014;9(6):e99392. doi:10.1371/journal.pone.0099392
25. Nongrum S, Singh VA, Paul R, Karnik S, Mehta S, Bera SS. A study about co-infection of fungal pathogens in active tuberculosis patients. Mymensingh Med J. 2019;28(4):920–924.
26. Yan ZH, Yi L, Wei PJ, et al. Evaluation of panels of Mycobacterium tuberculosis antigens for serodiagnosis of tuberculosis. Int J Tuberc Lung Dis. 2018;22(8):959–965. doi:10.5588/ijtld.18.0060
27. Baumann R, Kaempfer S, Chegou NN, et al. Serologic diagnosis of tuberculosis by combining Ig classes against selected mycobacterial targets. J Infect. 2014;69(6):581–589. doi:10.1016/j.jinf.2014.05.014
28. Bai XJ, Yang YR, Liang JQ, et al. Diagnostic performance and problem analysis of commercial tuberculosis antibody detection kits in China. Mil Med Res. 2018;5(1):10. doi:10.1186/s40779-018-0157-6
29. Patel G, Greenberger PA. Allergic bronchopulmonary aspergillosis. Allergy Asthma Proc. 2019;40(6):421–424. doi:10.2500/aap.2019.40.4262
30. Liu Y, Li Z, Wang S, et al. Aspergillus fumigatus induces the release of IL-8 and MCP-1 by activating nuclear transcription through dectin-1 and CR3 receptors in alveolar epithelial cells. Curr Microbiol. 2021;78(9):3474–3482. doi:10.1007/s00284-021-02534-5
31. Croft CA, Culibrk L, Moore MM, Tebbutt SJ. Interactions of Aspergillus fumigatus conidia with airway epithelial cells: a critical review. Front Microbiol. 2016;7:472. doi:10.3389/fmicb.2016.00472
32. Øya E, Solhaug A, Bølling AK, et al. Pro-inflammatory responses induced by A. fumigatus and A. versicolor in various human macrophage models. J Toxicol Environ Health A. 2019;82(8):483–501. doi:10.1080/15287394.2019.1619114
33. Sales-Campos H, Tonani L, Cardoso CR, Kress MR. The immune interplay between the host and the pathogen in Aspergillus fumigatus lung infection. Biomed Res Int. 2013;2013:693023. doi:10.1155/2013/693023
34. Abebe F. Synergy between Th1 and Th2 responses during Mycobacterium tuberculosis infection: a review of current understanding. Int Rev Immunol. 2019;38(4):172–179. doi:10.1080/08830185.2019.1632842
35. Salzer HJF, Prattes J, Flick H, et al. Evaluation of galactomannan testing, the Aspergillus-specific lateral-flow device test and levels of cytokines in bronchoalveolar lavage fluid for diagnosis of chronic pulmonary Aspergillosis. Front Microbiol. 2018;9:2223. doi:10.3389/fmicb.2018.02223
36. Krupa A, Fol M, Dziadek BR, et al. Binding of CXCL8/IL-8 to Mycobacterium tuberculosis modulates the innate immune response. Mediators Inflamm. 2015;2015:124762. doi:10.1155/2015/124762
 © 2023 The Author(s). This work is published and licensed by Dove Medical Press Limited. The full terms of this license are available at https://www.dovepress.com/terms.php and incorporate the Creative Commons Attribution - Non Commercial (unported, v3.0) License.
By accessing the work you hereby accept the Terms. Non-commercial uses of the work are permitted without any further permission from Dove Medical Press Limited, provided the work is properly attributed. For permission for commercial use of this work, please see paragraphs 4.2 and 5 of our Terms.
© 2023 The Author(s). This work is published and licensed by Dove Medical Press Limited. The full terms of this license are available at https://www.dovepress.com/terms.php and incorporate the Creative Commons Attribution - Non Commercial (unported, v3.0) License.
By accessing the work you hereby accept the Terms. Non-commercial uses of the work are permitted without any further permission from Dove Medical Press Limited, provided the work is properly attributed. For permission for commercial use of this work, please see paragraphs 4.2 and 5 of our Terms.