Back to Journals » Infection and Drug Resistance » Volume 16
Second-Line Antiretroviral Treatment Outcomes and Predictors in Tigray Region, Ethiopia
Authors Gidey K ![]() , Mache A, Hailu BY, Asgedom SW, Tassew SG
, Mache A, Hailu BY, Asgedom SW, Tassew SG ![]() , Nirayo YL
, Nirayo YL ![]()
Received 29 April 2023
Accepted for publication 21 July 2023
Published 27 July 2023 Volume 2023:16 Pages 4903—4912
DOI https://doi.org/10.2147/IDR.S419348
Checked for plagiarism Yes
Review by Single anonymous peer review
Peer reviewer comments 2
Editor who approved publication: Prof. Dr. Héctor Mora-Montes
Kidu Gidey, Abadi Mache, Berhane Yohannes Hailu, Solomon Weldegebreal Asgedom, Segen Gebremeskel Tassew, Yirga Legesse Nirayo
Department of Clinical Pharmacy, School of Pharmacy, College of Health Sciences, Mekelle University, Mekelle, Ethiopia
Correspondence: Kidu Gidey, Email [email protected]
Introduction: Ethiopia has one of the highest HIV burdens in sub-Saharan Africa. Despite the fact that second-line antiretroviral therapy (ART) has been available for more than ten years, studies on its effectiveness are scarce.
Objective: To assess treatment outcomes and predictors of unfavorable outcomes in HIV patients receiving second-line ART at Ayder Comprehensive Specialized Hospital and Mekelle Hospital.
Materials and Methods: An institution-based retrospective cohort study was conducted in two hospitals in Tigray Region, Ethiopia. We evaluated 192 patients aged ≥ 15 years who were switched to second-line from November 2009 to May 2020 after failure of first-line ART. The primary outcome was the time from the initiation of second-line ART to the occurrence of unfavorable treatment outcomes (treatment failure, death, and loss to follow-up). We performed Kaplan–Meier survival estimates to calculate the cumulative incidence rates of unfavorable outcomes.
Results: The mean age (SD) at the initiation of second-line ART was 39 (10.03) years, and the median CD4 cell count was 121 cells/microL. During a median follow-up of 4.6 years, 24 (12.5%) patients had died, 11 (5.7%) patients were lost to follow up, and 47 (24,4%) patients were experienced treatment failure. The incidence rates for unfavorable outcomes were 7.8 per 100 patients/years. Predictors for unfavorable outcomes were body mass index (BMI) < 18.5 (adjusted hazard ratio [aHR] = 2.51, 95% confidence interval (CI): 1.27– 4.95) and CD4 counts ≤ 100 cells/microL (aHR = 1.74, 95% CI: 1.09– 2.79). Despite the failure of second-line ART, none of the patients received third-line ART.
Conclusion: The incidence rate of unfavorable treatment outcomes for second-line ART was found to be high. A low BMI and a low baseline CD4 count were significant predictors of unfavourable outcomes and should be given special consideration in HIV care. A third-line ART regimen should also be considered for people who have failed second-line ART.
Keywords: human immunodeficiency virus, second-line ART, outcomes
Introduction
The human immunodeficiency virus (HIV) remains a major public health problem around the world. In Ethiopia, 613,000 people were living with HIV in 2018.1 The treatment of HIV has been revolutionized with the introduction of ART.2 Access to ART in resource-limited settings has increased dramatically over the past decade, leading to substantial reductions in morbidity and mortality.3 However, as more patients spend long periods on ART, the number of patients failing first-line ART has increased.4,5 As a result, the number of patients needing second-line ART is increasing in sub-Saharan Africa.6
For patients who fail second-line treatment, treatment options are limited, which is a serious concern in resource-limited settings.7 Different treatment outcome rates with second-line ART have been reported. Studies in Africa and Asia have reported that 6% to 40% of adults develop treatment failure on second-line ART.8,9 Some studies have also described predictors of second-line ART failure such as baseline WHO clinical stage IV,10 CD4 counts below 100 cells/mm,11 suboptimal adherence,12 high viral load,13 young age,14 lower body mass index,15 and delayed initiation of second-line therapy.13
Ethiopia is one of the highest HIV burden countries in sub-Saharan Africa with limited availability of HIV viral load tests and HIV drug resistance tests to monitor patients receiving first and second-line ART.16 Although second-line ART has been available in the country for more than ten years, there are, however, limited data on the treatment outcome of patients on second-line ART. Thus, with the limited ART drug options in the country, outcome data and predictors with unfavorable second-line ART outcomes are required to inform policy. Therefore, this study aimed to determine the incidence rate of second-line ART outcomes and its contributing factors in Tigray region, Ethiopia.
Materials and Methods
Study Setting and Period
The study was conducted at Ayder comprehensive specialized hospital (ACSH) and Mekelle hospital (MH), Tigray region, northern Ethiopia. ACSH is a major public hospital in the region and serves over 10 million people in the catchment area. It provides both outpatient and in-patient services. The hospital was also used as a teaching hospital and research center for the College of Health Sciences, Mekelle University. Mekelle hospital is one of the oldest health institutions administered under Tigray Regional Health Bureau, providing both a referral and non-referral healthcare services in the region and its catchment areas. The study included HIV-infected adult patients who failed treatment and switched to second-line antiretroviral therapy from November 2009 to May 2020.
Study Design and Population
We conducted an institutional-based retrospective cohort study. HIV patients aged ≥15 years who were on second-line ART regimen for at least six months were included. Patients transferred from different health facilities and patients with incomplete data were excluded.
Sample Size Estimation and Sampling Technique
The sample size was calculated using a single proportion sample size estimating formula
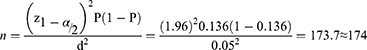
where n = sample size, Z = confidence interval (1.96), p = the probability of treatment failure (p = 0.136), by considering a study conducted in southwest Ethiopia,11 and d = Margin of error to be tolerated (0.05). By adding 10% contingency to the total sample (174X0.01=17.4), the total sample size required was 192. Subjects were recruited using a consecutive sampling technique up to the full sample size.
Data Collection
Demographic, clinical, laboratory, and treatment-related factors were recorded on a standardized form (S1 Appendix) using routinely available data. These variables were recorded from the patients’ medical charts by trained health professionals. The standardized form consists of socio-demographic variables (age, sex, residence, marital status, educational level, and occupation), antiretroviral drug timeline, serial BMI measurements, WHO staging, tuberculosis status, serial CD4 count, serial HIV viral load, opportunistic infections, and death. We trained four data collectors on the purpose of the study and the retrieval of data from the patient records. The data collectors then reviewed the records of the eligible patients under the supervision of the research coordinator.
Treatment and Follow-Up
The treatment provided in the present study was performed as part of routine care. Upon diagnosis, an appropriate first-line ART was chosen. For first-line treatment, a combination of two reverse transcriptase inhibitors (NRTIs) with one NNRTI nonnucleoside reverse transcriptase inhibitor (NNRTI) was used. If a patient developed treatment failure on first-line therapy, a switch to second-line ART was made. For second-line treatment, two NRTIs with one protease inhibitor (PI) were used.
During the first six months after starting treatment, patients were followed up at the ART clinic every 1 month. Thereafter, patients underwent follow-up visits at least every 3 months. At each visit, patients’ clinical condition was assessed by the healthcare providers. The CD4 count was measured at baseline and every six months or when indicated. Viral load was measured infrequently for few selected patients if treatment failures were suspected.
Outcome Measures and Definition of Terms
The primary outcome was time from second-line ART initiation to the occurrence of unfavorable treatment outcomes. We considered unfavorable treatment outcomes when a patient died, lost to follow up, or the occurrence of virological, immunological, or a clinical failure event after a six-month of effective treatment with second-line ART.
Clinical failure was defined as the occurrence of a new or recurrent clinical event indicating severe immunodeficiency (WHO stage 4 condition and stage 3 condition (PTB, severe bacterial infection)) after six months of treatment.
Immunologic failure was defined as a CD4 count of ≤250 cell/mm3 following clinical failure or persistent CD4 levels below 100 cells/mm3 after six months of effective treatment.
Virologic failure was defined as a plasma viral load above 1000 copies/mL on two consecutive measurements after at least 3 months of continued ART.
Death was defined as a record of death in a patient who was on second-line ART for at least six months.
Loss to follow-up (LTFU) was defined as loss of a patient from ART follow-up for 3 months or longer after the last appointment and was not yet classified as “dead” or “drop-out”.
Statistical Methods
Data were entered into EPI-Data version 4.2.0.0 and exported to STATA version 14.1 (STATA Corp, TX, USA) for analysis. We presented the data using the mean (SD) and median (IQR) for continuous variables or frequency (%) for categorical variables. The cumulative incidence of unfavorable outcome rates at 12, 24, 48, and 84 months was calculated using the Kaplan–Meier method. Follow-up time was calculated from second-line ART start until the occurrence of unfavorable outcome or censoring. The risk factors associated with unfavorable outcomes (failure, dead, and LTFU) were determined using the Cox proportional hazards model. Variables with a p-value <0.25 in the univariable analysis were included in the multivariable Cox proportional hazards model to identify independent predictors of unfavorable outcomes.
Results
Socio-Demographic Characteristics of HIV Patients on Second-Line ART
A total of 192 HIV infected patients who initiated second-line therapy after failing first-line therapy were included in this study. Of these, 57.8% of the patients were male. The mean age (SD) at the start of second-line ART was 39 (10.03) years. More than one-thirds had completed secondary school, and 45.3% of the patients were merchants (Table 1).
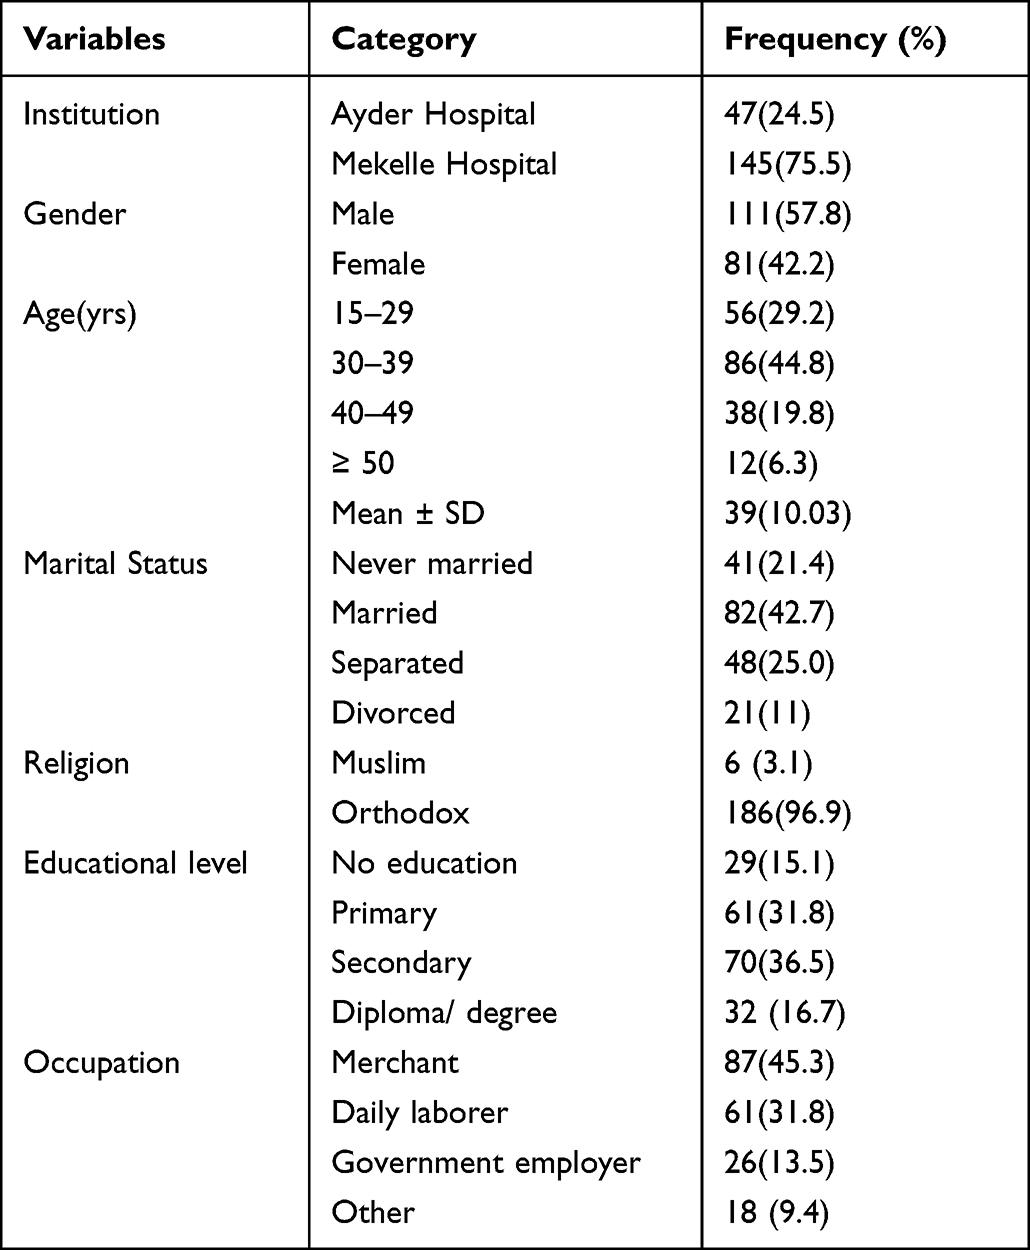 |
Table 1 Socio-Demographic Characteristics of Patients on Second-Line ART in ACSH and MH, Ethiopia Between 2009 and 2020 |
Clinical Characteristics of HIV Patients at Switch to Second-Line ART
The median duration on ART prior to initiation of second-line treatment was 5 years (interquartile range [IQR], 3 to 6). At the start of second-line ART, most patients (75.5%) had a BMI <18.5 and the median CD4 count was 111 cells/microL (IQR, 81.3 to 145.8). Viral load was not measured in the majority (71.9%) of the patients at the time of switch. The majority of the patients (80.2%) were in WHO T stage III/IV. In total, 62.5% of the patients received LPV/r in combination with 2 NRTIs and 37.5% of the patients received ATV/r with 2 NRTIs (Table 2).
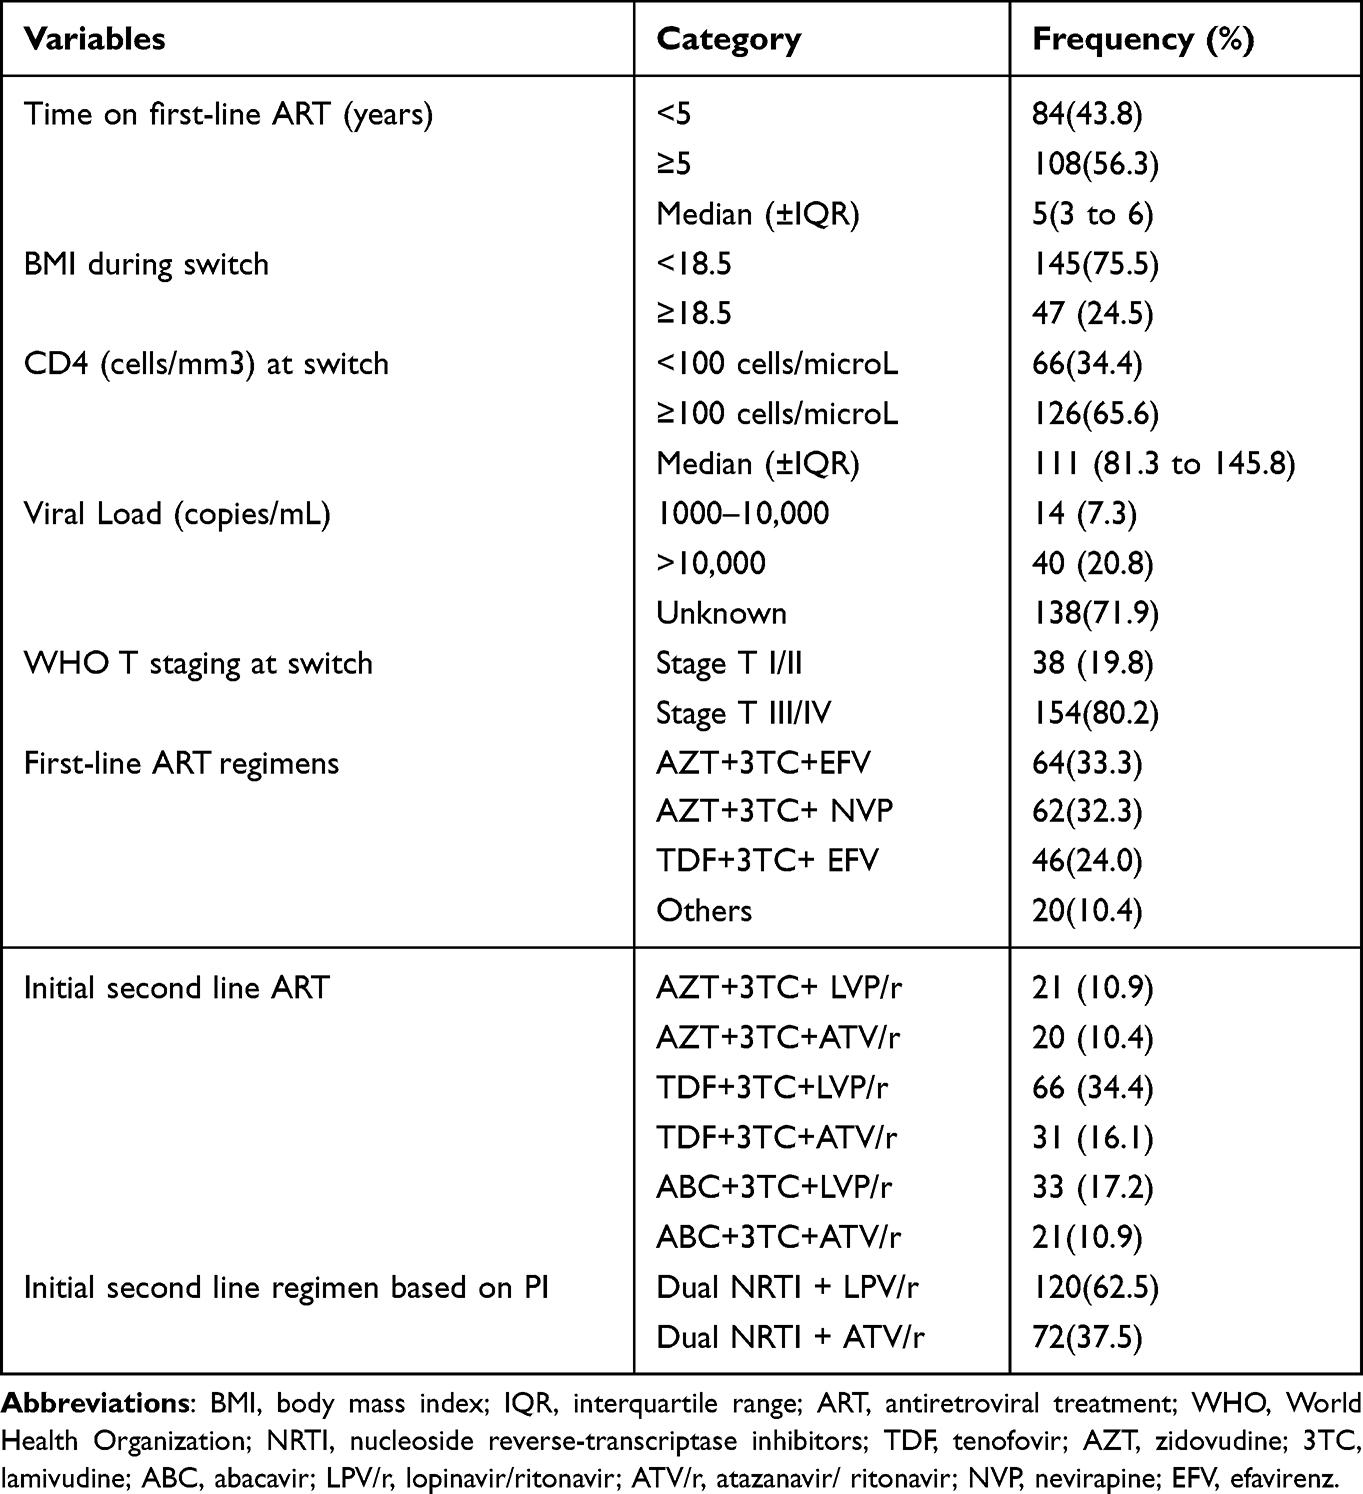 |
Table 2 Clinical, CD4+, and Viral Load Characteristics of HIV Patients at Switch to Second-Line ART in ACSH and MH, Ethiopia Between 2009 and 2020 |
Treatment Outcomes of Second-Line ART
The patients were followed for a median of 4.6 years (IQR, 2.0–6.7 years) after switching to second-line ART, with a total observation period of 872 person-years. During this follow-up period, unfavorable outcomes were observed in 82 (42.7%) of the patients. In total, 24 (12.5%) patients had died, 11 (5.7%) patients were LTFU, and 47 (24,4%) patients experienced treatment failure (either clinical, immunological, and virologic failure or a combination of them). None of the patients received third-line ART despite failure to second-line.
The incidence rate of unfavorable treatment outcome of second-line treatment was 7.84 (95% CI 6.32 to 9.74) per 100 person-years of follow-up. Considering the composite outcome, the cumulative probability of unfavorable outcomes (failure, death, and LTFU) at 12 months was 7.5% (95% CI 4.5% to 12.3%), at 24 months was 18.9% (95% CI 14.0% to 25.4%), at 48 months was 27.6% (95% CI 21.7% to 34.8%), and at 84 months was 46.5% (95% CI 38.5% to 53.3%) (Figure 1).
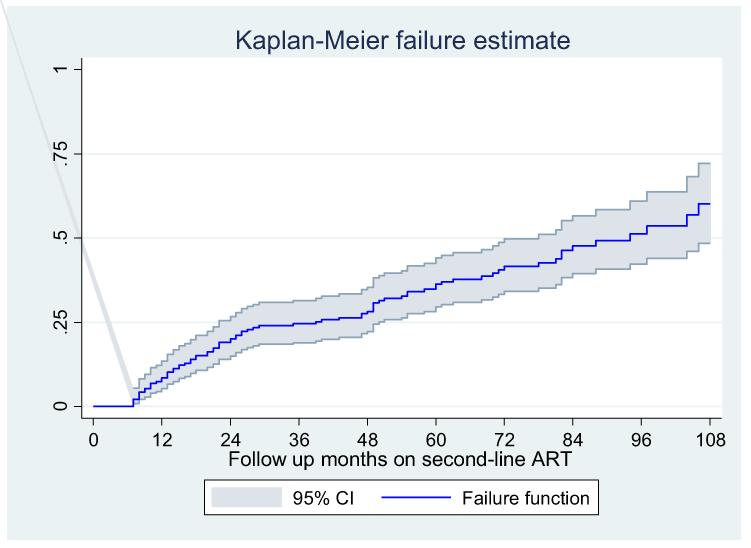 |
Figure 1 Kaplan–Meier failure estimate of second-line antiretroviral therapy second line ART in ACSH and MH, Ethiopia between 2009 and 2020. |
Predictors of Unfavorable Treatment Outcome
The individual risk factors associated with unfavorable outcomes (failure, death, and LTFU) were determined using the univariable Cox proportional hazards model (Table S1). Age at second-line initiation, BMI <18.5, and CD4 counts were the associated factors in the univariable analysis. Variables with a p-value <0.25 in the univariable analysis were included in the multivariable Cox proportional hazards model to identify independent predictors of unfavorable outcomes. The results of the Cox proportional hazards model indicated that patients who had a BMI <18.5 were more likely to have unfavorable outcome (adjusted hazard ratio (aHR): 2.51, 95% confidence interval (CI): 1.27–4.95). Similarly, patients having CD4 counts ≤100 cells/microL were more likely to have unfavorable outcome (aHR = 1.74, 95% CI: 1.09–2.79) (Table 3) than patients with higher CD4 counts (Table 3).
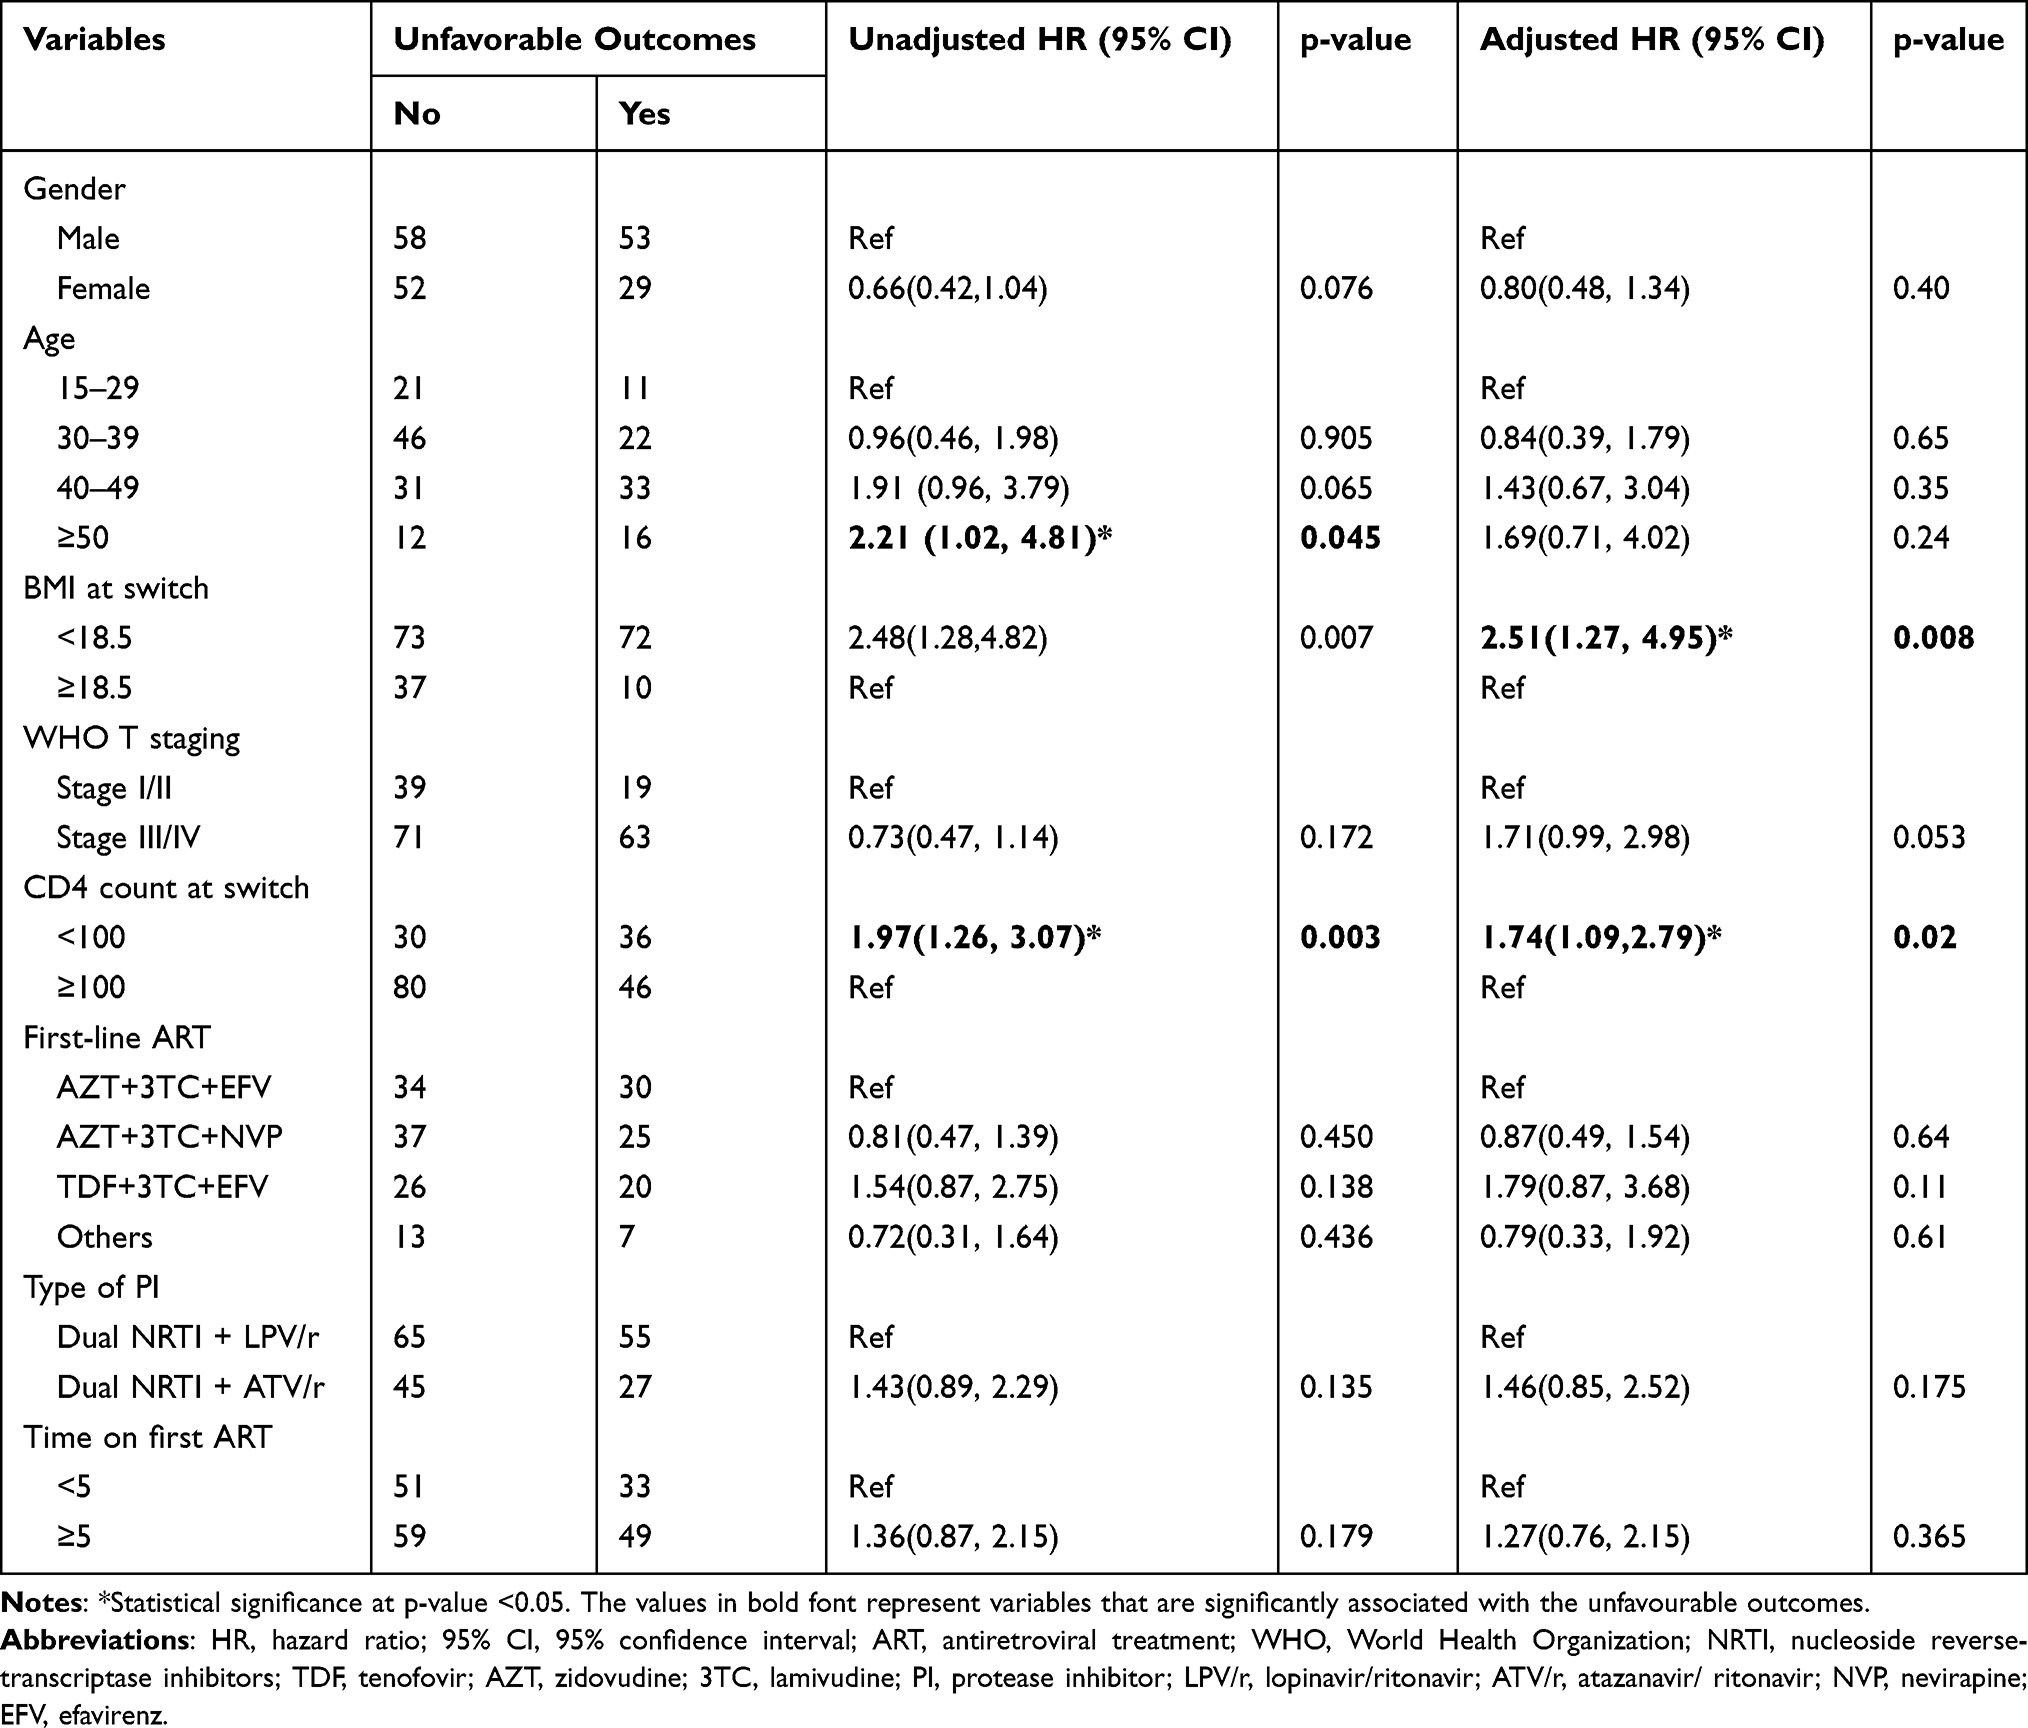 |
Table 3 Predictors of Unfavorable Outcomes in Patients on Second-Line ART in ACSH and MH, Ethiopia Between 2009 and 2020 |
Discussion
One of the main goals of this study was to assess treatment outcomes for second-line ART in patients who failed first-line ART therapy. We found an overall incidence rate of unfavorable treatment outcome of second-line ART to be 7.8 per 100 person-years of follow-up. Our results are consistent with previous results in Myanmar which reported the incidence rate of unfavorable outcomes of 7.9 per 100 PYFU.9 Similarly, the incidence of unfavorable outcomes in this study is in agreement with studies conducted in a multicenter study in Asia which found 8.8 failures per 100 patient/years.17
Our results differ, however, concerning the rates of unfavorable outcomes reported by Pujades-Rodriguez et al. Treatment failure occurred at a rate of 16.1 per 100 patient-years; almost double what we report here.12 The reason for this might be due to the difference in follow-up periods. Because most failures occur shortly after switching to a second line, a shorter follow-up period is likely to find a higher chance of failure compared to a study with a longer follow-up period. Another explanation may be differences in the diagnostic criteria for treatment failure. In the study by Pujades-Rodriguez et al, viral load was used to assess treatment failure, in addition to other criteria. Viral load increases earlier than other immunologic and clinical markers, which can shorten the time to diagnosis. This may explain the lower rates of virological failure in our study and may indicate under-diagnosis of second-line treatment failure.
Our study found that the incidence of unfavourable outcomes was significant during the first 24 months. This is consistent with a meta-analysis study conducted in sub-Saharan Africa, which found that the pooled treatment failure rates were high before 12 months and 12–18 months of follow-up after second-line drugs were initiated.7 This could be due to patients’ failure to respond to second-line therapy and the subsequent development of opportunistic infections and mortality following first-line failure. The rate of unfavourable result was reduced after 24 months of follow-up, showing that patients who responded initially had a comparably persistent virological response. Similarly, a relatively maintained virological response was observed after 18 months of follow-up.7
Our study also identified the predictors of unfavorable treatment outcomes. Lower BMI (<18) at second-line ART initiation was found to be a significant risk factor of unfavorable outcomes. This finding is in agreement with findings conducted in Uganda15 and Malawi18 which showed a strong association between BMI and unfavorable outcomes. This result may be explained by the fact that nutritional status of individuals has a positive effect on immunity.19,20 This finding highlights the importance of monitoring the nutritional status of HIV positive patients.
We found a CD4 count ≤ 100 cells/microL at the time of the switch was a strong predictor of unfavorable outcomes. Consistent with the present results, several studies have indicated that the failure of second-line treatment is associated with a lower baseline CD4 cell count at the initiation of the second line.9,12,21–23 One possible explanation for this could be that opportunistic infections have occurred at lower CD4 levels, which could lead to patient mortality and other adverse outcomes.24
Virologic monitoring of ART is superior to timely diagnosis of treatment failure.25 However, in our study, only 28% of the patients had a record of viral load when switching to second-line ART and in subsequent measures. Likewise, most countries in sub-Saharan Africa still use clinical and CD4 count to monitor treatment response and decide to switch to second-line ART. These indicators are poorly correlated with virological failure, resulting in long delays between failure and switching.26 A delay in recognizing treatment failure can lead to the accumulation of resistance mutations that compromise treatment options and efficacy.27 Thus, policymakers and healthcare providers should consider routine viral load monitoring for the patients on second-line ART.
Despite the large number of patients who failed treatment, none of the patients switched to any alternative third-line ART. A study in Myanmar also reported that none of the patients who failed second-line treatment had switched to third-line ART.9 In fact, the third-line ART regimen is not available in the HIV program in these settings. Continuing the failed regimen would not help the patient, and policymakers should consider a nationwide study of treatment outcomes and initiation of third-line ART in a small portion of patients.
The results of this study have important implications. Treatment failure with PI-based second-line regimen observed in a significant proportion of patients requires special attention. Policymakers and healthcare providers should consider the need for third-line ART in a small portion of patients to improve treatment outcomes in the country. Since this study shows that a lower BMI is an important predictor of unfavorable outcomes, attention should be paid to monitor the nutritional status of HIV patients. Health education should also be provided on the importance of a balanced diet for such patients. Moreover, a lower CD4 cell count at the time of switch was associated with unfavorable results. To maximize the durability of second-line ART, it is very important to recognize the failure of first-line ART early and switch to the second-line with a relatively high CD4 cell count.17,28 Thus, patients should be frequently monitored for treatment failure before the CD4 declines. It is also recommended to increase access for viral load monitoring throughout the region to promote early detection of treatment failures.
Interpretation of our results should take into account a number of limitations. The gold standard for assessing ART failure is using viral load. In this study, however, we assessed treatment failure for most patients using CD4 cell counts and clinical parameters. In the developed country settings, second-line ART failure would have been defined by results of genotyping. In this case, the second-line ART choice was empiric, due to genotyping not being available, which may have influenced the outcome of our patients. As our study was retrospective, some clinical variables such as adherence were not well documented at each follow-up visit and were not included in the analysis. Nonetheless, given that the two sites involved with a reasonable number of participants and a longer follow-up period, we believe our results reasonably reflect ART use and treatment outcomes, particularly in Tigray Regional State and in Ethiopia in general.
We recommend that further research be undertaken on the current topic. A prospective follow-up study using viral load as a measure of treatment failure and possibly including drug resistance. Furthermore, national and international policymakers should use the results of this assessment and other studies to improve HIV care.
Conclusion
The incidence rate of unfavorable outcomes for second-line ART in HIV-infected patients was found to be high. A low BMI and low baseline CD4 count were significant predictors of unfavorable treatment outcomes. Thus, patients with low CD4 count and low BMI should receive much attention in HIV care. Viral load was measured for only a few patients, and greater access to viral load monitoring is required to facilitate early detection of ART failure. In addition, an alternative third-line ART regimen should be considered for those receiving a failed second-line ART.
Abbreviations
3TC, Lamivudine; ACSH, Ayder Comprehensive Specialized Hospital; ABC, Abacavir; aHR, Adjusted hazard ratio; ART, Antiretroviral Therapy; ATV/r, Atazanavir/ritonavir; BMI, Body Mass Index; cHR, crude hazard ratio; CI, Confidence Interval; EFV, Efavirenz; HIV, Human Immunodeficiency Virus; LPV/r, Lopinavir/ritonavir; LTFU, Loss to follow-up; MH, Mekelle Hospital; NNRTI, Non-Nucleoside Reverse-Transcriptase Inhibitors; NRTI, Nucleoside Reverse Transcriptase Inhibitors; NVP, Nevirapine; PI, Protease inhibitors; TDF, Tenofovir; WHO, World Health Organization; ZDV, Zidovudine.
Data Sharing Statement
The dataset of this study is available from the corresponding author upon reasonable request.
Ethics Approval and Consent to Participate
Ethical approval was obtained from the Ethics Review Committee of the School of Pharmacy, College of Health Sciences, Mekelle University and the committee waived the need for informed consent as it was a retrospective study. The study was conducted in accordance with the Declaration of Helsinki. A letter of support was obtained from the hospital’s medical director to access the patient’s charts. Patient data were recorded using a personal identifier, and the privacy of personal information was strictly protected.
Acknowledgments
The authors would like to thank the College of Health Science, Mekelle University for their cooperation and material support. The authors would also like to thank for all Ayder comprehensive specialized hospital and Mekelle hospital staff members for their support during this study.
Author Contributions
All authors made a significant contribution to the work reported, whether that is in the conception, study design, execution, acquisition of data, analysis and interpretation, or in all these areas; took part in drafting, revising or critically reviewing the article; gave final approval of the version to be published; have agreed on the journal to which the article has been submitted; and agree to be accountable for all aspects of the work.
Funding
The study was carried out as part of our routine work.
Disclosure
The authors have declared that there are no conflicts of interest in this work.
References
1. Federal HIV/AIDS Prevention and Control Office. HIV Prevention in Ethiopia. National Road Map (2018-2020); 2018.
2. Sterne JA, Hernán MA, Ledergerber B, et al. Long-term effectiveness of potent antiretroviral therapy in preventing AIDS and death: a prospective cohort study. Lancet. 2005;366(9483):378–384. doi:10.1016/S0140-6736(05)67022-5
3. Bhaskaran K, Hamouda O, Sannes M, et al. Changes in the risk of death after HIV seroconversion compared with mortality in the general population. JAMA. 2008;300:51–59. doi:10.1001/jama.300.1.51
4. Keiser O, Tweya H, Braitstein P, et al. Mortality after failure of antiretroviral therapy in sub-Saharan Africa. Trop Med Int Health. 2010;15(2):251–258. doi:10.1111/j.1365-3156.2009.02445.x
5. Mills EJ, Nachega JB, Buchan I, et al. Adherence to antiretroviral therapy in sub-Saharan Africa and North America: a meta-analysis. JAMA. 2006;296(6):679–690. doi:10.1001/jama.296.6.679
6. Estill J, Ford N, Salazar-Vizcaya L, et al. The need for second-line antiretroviral therapy in adults in sub-Saharan Africa up to 2030: a mathematical modelling study. Lancet HIV. 2016;3(3):e132–9. doi:10.1016/S2352-3018(16)00016-3
7. Edessa D, Sisay M, Asefa F. Second-line HIV treatment failure in sub-Saharan Africa: a systematic review and meta-analysis. PLoS One. 2019;14(7):e0220159–e. doi:10.1371/journal.pone.0220159
8. Levison JH, Orrell C, Gallien S, et al. Virologic failure of protease inhibitor-based second-line antiretroviral therapy without resistance in a large HIV treatment program in South Africa. PLoS One. 2012;7(3):e32144. doi:10.1371/journal.pone.0032144
9. Kyaw NTT, Kumar AMV, Oo MM, et al. Long-term outcomes of second-line antiretroviral treatment in an adult and adolescent cohort in Myanmar. Glob Health Action. 2017;10(1):1290916. doi:10.1080/16549716.2017.1290916
10. Murphy RA, Court R, Maartens G, Sunpath H. Second-line antiretroviral therapy in sub-Saharan Africa: it is time to mind the gaps. AIDS Res Hum Retroviruses. 2017;33(12):1181–1184. doi:10.1089/aid.2017.0134
11. Tsegaye AT, Wubshet M, Awoke T, Addis Alene K. Predictors of treatment failure on second-line antiretroviral therapy among adults in northwest Ethiopia: a multicentre retrospective follow-up study. BMJ open. 2016;6(12):e012537. doi:10.1136/bmjopen-2016-012537
12. Pujades-Rodriguez M, O’Brien D, Humblet P, Calmy A. Second-line antiretroviral therapy in resource-limited settings: the experience of Medecins Sans Frontieres. AIDS. 2008;22(11):1305–1312. doi:10.1097/QAD.0b013e3282fa75b9
13. Adetunji AA, Achenbach C, Feinglass J, et al. Optimizing treatment switch for virologic failure during first-line antiretroviral therapy in resource-limited settings. J Int Assoc Provid AIDS Care. 2013;12(4):236–240. doi:10.1177/1545109712463733
14. Ongubo DM, Lim R, Tweya H, et al. A cross-sectional study to evaluate second line virological failure and elevated bilirubin as a surrogate for adherence to atazanavir/ritonavir in two urban HIV clinics in Lilongwe, Malawi. BMC Infect Dis. 2017;17(1):461. doi:10.1186/s12879-017-2528-0
15. Boerma RS, Kityo C, Boender TS, et al. Second-line HIV Treatment in Ugandan Children: favorable Outcomes and No Protease Inhibitor Resistance. J Trop Pediatr. 2017;63(2):135–143. doi:10.1093/tropej/fmw062
16. Getaneh Y, Zealyas K, Adugna F, et al. HIV drug resistance early warning indicators in Ethiopia: variability at regional and health facility levels and trend over time. Int J Infect Dis. 2020;95:90–97. doi:10.1016/j.ijid.2020.02.031
17. Boettiger DC, Nguyen VK, Durier N, et al. Efficacy of second-line antiretroviral therapy among people living with HIV/AIDS in Asia: results from the TREAT Asia HIV observational database. J Acquir Immune Defic Syndr. 2015;68(2):186–195. doi:10.1097/QAI.0000000000000411
18. Hosseinipour MC, Kumwenda JJ, Weigel R, et al. Second-line treatment in the Malawi antiretroviral programme: high early mortality, but good outcomes in survivors, despite extensive drug resistance at baseline. HIV Med. 2010;11(8):510–518. doi:10.1111/j.1468-1293.2010.00825.x
19. Alwarawrah Y, Kiernan K, MacIver NJ. Changes in Nutritional Status Impact Immune Cell Metabolism and Function. Front Immunol. 2018;9:1055. doi:10.3389/fimmu.2018.01055
20. De Rosa V, Galgani M, Santopaolo M, Colamatteo A, Laccetti R, Matarese G. Nutritional control of immunity: balancing the metabolic requirements with an appropriate immune function. Semin Immunol. 2015;27(5):300–309. doi:10.1016/j.smim.2015.10.001
21. Shearer K, Evans D, Moyo F, et al. Treatment outcomes of over 1000 patients on second-line, protease inhibitor-based antiretroviral therapy from four public-sector HIV treatment facilities across Johannesburg, South Africa. Trop Med Int Health. 2017;22(2):221–231. doi:10.1111/tmi.12804
22. Ssempijja V, Nakigozi G, Chang L, et al. Rates of switching to second-line antiretroviral therapy and impact of delayed switching on immunologic, virologic, and mortality outcomes among HIV-infected adults with virologic failure in Rakai, Uganda. BMC Infect Dis. 2017;17(582). doi:10.1186/s12879-017-2680-6
23. Rohr JK, Ive P, Horsburgh CR, et al. Marginal Structural Models to Assess Delays in Second-Line HIV Treatment Initiation in South Africa. PLoS One. 2016;11(8). doi:10.1371/journal.pone.0161469
24. Günthard HF, Aberg JA, Eron JJ, et al. Antiretroviral treatment of adult HIV infection: 2014 recommendations of the International Antiviral Society-USA Panel. JAMA. 2014;312:410. doi:10.1001/jama.2014.8722
25. World Health Organization. Consolidated Guidelines on the Use of Antiretroviral Drugs for Treating and Preventing HIV Infection: Recommendations for a Public Health Approach. Geneva: World Health Organization; 2013.
26. Haas AD, Keiser O, Balestre E, et al. Monitoring and switching of first-line antiretroviral therapy in adult treatment cohorts in sub-Saharan Africa: collaborative analysis. Lancet HIV. 2015;2:e271–8. doi:10.1016/S2352-3018(15)00087-9
27. Hosseinipour MC, van Oosterhout JJ, Weigel R, et al. The public health approach to identify antiretroviral therapy failure: high-level nucleoside reverse transcriptase inhibitor resistance among Malawians failing first-line antiretroviral therapy. AIDS. 2009;23(9):1127–1134. doi:10.1097/QAD.0b013e32832ac34e
28. Keiser O, Tweya H, Boulle A, et al. Switching to second-line antiretroviral therapy in resource-limited settings: comparison of programmes with and without viral load monitoring. AIDS. 2009;23(14):1867–1874.
 © 2023 The Author(s). This work is published and licensed by Dove Medical Press Limited. The
full terms of this license are available at https://www.dovepress.com/terms
and incorporate the Creative Commons Attribution
- Non Commercial (unported, 3.0) License.
By accessing the work you hereby accept the Terms. Non-commercial uses of the work are permitted
without any further permission from Dove Medical Press Limited, provided the work is properly
attributed. For permission for commercial use of this work, please see paragraphs 4.2 and 5 of our Terms.
© 2023 The Author(s). This work is published and licensed by Dove Medical Press Limited. The
full terms of this license are available at https://www.dovepress.com/terms
and incorporate the Creative Commons Attribution
- Non Commercial (unported, 3.0) License.
By accessing the work you hereby accept the Terms. Non-commercial uses of the work are permitted
without any further permission from Dove Medical Press Limited, provided the work is properly
attributed. For permission for commercial use of this work, please see paragraphs 4.2 and 5 of our Terms.