Back to Journals » International Journal of Chronic Obstructive Pulmonary Disease » Volume 18
Seasonal Dynamics of the Upper Respiratory Tract Microbiome in Chronic Obstructive Pulmonary Disease
Authors Cai S, Gao J, Liu X, Yang J, Feng D, Li G, Li S, Yang H ![]() , Wang Z, Yi X, Zhou Y
, Wang Z, Yi X, Zhou Y
Received 30 December 2022
Accepted for publication 30 May 2023
Published 20 June 2023 Volume 2023:18 Pages 1267—1276
DOI https://doi.org/10.2147/COPD.S403198
Checked for plagiarism Yes
Review by Single anonymous peer review
Peer reviewer comments 2
Editor who approved publication: Prof. Dr. Richard Russell
Shuping Cai,1,2,* Jingyuan Gao,3,* Xiaomin Liu,3,* Junhao Yang,3,* Dingyun Feng,1 Guijun Li,2 Sijia Li,1 Hailing Yang,1 Zhang Wang,3 Xinzhu Yi,3 Yuqi Zhou1
1Department of Pulmonary and Critical Care Medicine, Institute of Respiratory Diseases, the Third Affiliated Hospital of Sun Yat-Sen University, Guangzhou, Guang Dong, People’s Republic of China; 2Department of Pulmonary and Critical Care Medicine, the Seventh Affiliated Hospital of SUN YAT-SEN University, Shenzhen, Guang Dong, People’s Republic of China; 3Institute of Ecological Sciences, School of Life Sciences, South China Normal University, Guangzhou, Guang Dong, People’s Republic of China
*These authors contributed equally to this work
Correspondence: Xinzhu Yi; Yuqi Zhou, Email [email protected]; [email protected]
Introduction: Increasing evidence suggests that seasonal changes can trigger the alternation of airway microbiome. However, the dynamics of the upper airway bacterial ecology of chronic obstructive pulmonary disease (COPD) patients across different seasons remains unclear.
Methods: In this study, we present a 16S ribosomal RNA survey of the airway microbiome on 72 swab samples collected in different months (March, May, July, September, and November) in 2019 from 18 COPD patients and from six resampled patients in November in 2020.
Results: Our study uncovered a dynamic airway microbiota where changes appeared to be associated with seasonal alternation in COPD patients. Twelve clusters of temporal patterns were displayed by differential and clustering analysis along the time course, systematically revealing distinct microbial taxa that prefer to grow in cool and warm seasons, respectively. Moreover, the upper airway microbiome composition was relatively stable in the same season in different years.
Discussion: Given the tight association between airway microbiome and COPD disease progression, this study can provide useful information for clinically understanding the seasonal trend of disease phenotypes in COPD patients.
Keywords: chronic obstructive pulmonary disease, upper airway microbiome, seasonal variation
Graphical Abstract:

Introduction
Chronic obstructive pulmonary disease (COPD) is a chronic inflammatory lung disease that causes obstructed airflow from the lungs. The advent of the new culture-independent microbial sequencing technology has made it possible to disclose the complex microbial community of the respiratory tract and characterized a distinct bacterial community in the airway of COPD patients compared to healthy subjects.1–3 A number of studies revealed significant differences between the lung microbiome in healthy subjects and COPD patients. For example, Haldar et al observed an increased abundance of Proteobacteria, especially Haemophilus in COPD patients.4 Liu et al reported opposite alteration of bacterial and fungal diversity in COPD patients and healthy controls.5 Besides, the dynamic of lung microbiota was found to be associated with COPD exacerbation and airway inflammatory phenotypes. For example, an overall reduced microbial alpha diversity, a significant increase in Moraxella, as well as a decrease in beta diversity were observed to be associated with COPD exacerbation. On the species and strain levels, H. influenzae strains 86–028NP and PittGG was reported to inversely predict eosinophilic inflammation.6–9 In addition, bacterially derived extracellular vesicles have distinctive characteristics in the lungs of healthy subjects and COPD patients, which may lead to immune dysfunction and inflammation in COPD.10 These findings indicate that bacteria potentially play a key role in COPD pathogenesis and suggests that changes in the airway microbiota could be associated with enhanced airway inflammation and the progression of the disease.6–9
Human microbiota is known to be influenced by many environmental factors, including seasonal variations. The influence of seasonal variation has been noticed for the microbiome in gut and skin.11,12 For example, Tong et al reported seasonal variation of the fungal community on the skin which led to a more fragile skin microbial network in autumn than other seasons.12 Likewise, seasonal changes of the respiratory tract microbiome have also been documented in recent years. For example, a global seasonal shift in the anterior nares (nostrils) bacterial community has been observed across 25 healthy volunteers over 15 months, where the temporal shift of the abundance of Propionibacterium acnes and Staphylococcus epidermidis was strongly evident.13 Seasonal variation of the nasopharyngeal microbiota from 96 healthy children has been reported, which was independent of antibiotic use or viral coinfection.14 The dynamics of the upper respiratory tract microbiota in healthy infants within the first year of life was described in another study, where age and seasonality was reported to be the major factors driving the variation of nasal microbiota composition.15
Patients with COPD often experience more acute episodes of symptom worsening and exacerbations during the winter season of the year.16 This could be partly due to seasonal fluctuation since seasonal change is known to affect respiratory diseases by influencing viral activity and transmission (eg, respiratory syncytial virus), altering vectors, host immune response, and allergen disposition, etc.17,18 Wilkinson et al reported from an observational cohort study that the rise of the etiology of acute exacerbations of COPD in winter may be driven by increased pathogen presence as well as an interaction between non-typeable Haemophilus influenzae airway infection and viral infection.19 However, by now, we still know little about the dynamics of the upper airway bacterial ecology of COPD patients across different seasons. A better understanding of seasonality of COPD airway microbiota, especially pathogens, may allow us to implement future public health interventions and impart opportunities for clinical therapies of COPD.
In this study, we hypothesized that composition of the upper airway microbiome in COPD patients could alter by seasons. To this end, we performed a 16S rRNA-based microbiome survey on 72 swab samples collected from 18 COPD patients across 5 months (March, May, July, September, and November) in 2019 and from 6 resampled patients in November in 2020, and applied differential and clustering analysis to reveal distinct seasonal patterns of the upper respiratory microbiota in COPD patients.
Materials and Methods
Subject and Sample Acquisition
Eighteen COPD patients (diagnosed according to the GOLD criteria,20 age >40 years) were recruited. A total of 72 oropharyngeal swab samples were collected and processed, including 66 collected from March, May, July, September, and November in 2019 and 6 from resampled patients in November in 2020 (detailed in Table S1).
16S rRNA Sequencing and Microbiome Analysis
Bacterial genomic DNA was extracted from swabs using the Qiagen DNA Mini kit (Qiagen, USA) as per manufacturer’s protocol from swab samples. The extracted DNA yield and purity were evaluated using a NanoDrop 2000 spectrophotometer (Thermo Scientific, Waltham, MA, USA). The V4 hypervariable region of the 16S rRNA gene was then PCR-amplified with the appropriate reagent controls to avoid contamination introduced into the experiment. Amplified DNA fragments were sequenced using the Illumina MiSeq platform. Sequencing reads were processed using QIIME pipeline V.2.0.21 Sequences were denoised and the amplicon sequence variants (ASVs) were identified using the dada2 algorithm. Taxonomy was assigned to ASVs using the q2-feature-classifier classify-sklearn Naïve Bayes taxonomy classifier against Greengenes_13_8 at a cutoff of 99% operational taxonomic units (OTUs). Sequence data are deposited at the National Center for Biotechnology Information under PRJNA909340. To obtain microbial functional profiles, PICRUSt222 was used to predict the abundances of KEGG Orthology from 16S rRNA gene sequencing data.
Statistical Analysis
All statistical analyses and visualization were performed using R software (version 3.6). Alpha diversity was assessed using the Shannon index. Beta diversity was generated based on weighted UniFrac distance23 of OTU profiles or KO profiles in each sample and visualized using principal components analysis (PCA) plots. ANalysis Of SiMilarities (ANOSIM) was used to test the statistical significance of OTU profiles or KO profiles between different months. Kruskal–Wallis rank sum test was used to test differences of individual taxon or KO in different months. Differential analysis, clustering analysis and visualization of the temporal patterns of microbiome data were performed by using fuzzy c-means algorithm with timeclust function of TCseq package. Procrustes analysis was carried out using vegan24 package in R.
Results
The COPD Upper Airway Microbiome and Microbial Functional Features Were Different Among Different Months in a Year
A total of 66 swab samples were collected from 18 subjects across 5 months (March, May, July, September, and November) in 2019. The sample size of each subject varies from 2 to 5 (Table S1, Figure S1). Extraction blanks were featured with distinct microbial profiles from the samples, indicating a negligible effect from contamination (Figure S2). A total of 6110 OTUs were identified from these samples after rarefaction was done. Overall, PCA did not reveal significant differences of microbial profile in different months (Figure 1a, Anosim R2 = 0.057, P = 0.63). A moderate increase of alpha diversity was found (Figure 1b) in July compared with other months, which suggested a more diverse microbiome in July. Most OTUs belonged to the genus of Streptococcus, followed by Prevotella and Neisseria (Figure 1c). A significant increase (FDR < 0.05, Kruskal–Wallis rank sum test) of Helicobacteraceae, Clostridium, Oscillospira, Brevibacillus, Proteus and Weissella in May, Enhydrobacter, Methylobacteriaceae, and Brevibacillus in November, Proteus in March, Brevibacillus in July and September (Figure 1d) were recognized, revealing the preference of different microbiota to proliferate in different seasons in the airway of COPD patients.
 |
Figure 1 The airway microbiome composition of COPD patients changed with months. (a) Principal component analysis (PCA) of microbiome grouped by sampling months (b). Microbiome composition at genus level in different months. (c) Alpha diversity (Shannon) of airway microbiome in different months. (d) Microbiome with significantly changed relative abundance in different months (P < 0.05). Kruskal–Wallis rank sum test was used to test differences of OTUs in different months. |
Functional profiles of the microbial community were inferred from 16S rRNA gene sequences using PICRUSt2. Similar to the microbial composition, seasonal variation of the overall function profiles was insignificant (Figure S3a, Anosim R2 = 0.059, P = 0.52), and the microbial functions were consistently dominated by metabolism of carbohydrate, amino acids, cofactors, vitamins, etc (Figure S3b). The abundance of 14 KOs was significantly (FDR < 0.05) altered by month after p value adjustment throughout all Kruskal–Wallis tests, including nine spore forming-associated genes, one antimicrobial resistance gene, two dipeptide transporter genes and two amino acid metabolism associated genes (Figure S3c). The abundances of these KOs were all significantly higher in September and November than in other months.
Seasonal Dynamics of the COPD Upper Airway Microbiome
In order to further elucidate the main trends of microbial changes with seasons, we applied differential analysis and clustering analysis along the time course to our data set. Finally, 12 clusters were generated and the number of the taxa in each cluster varied from 10 to 84 (Table S2). Each cluster exhibits a distinct temporal variation pattern (Figure 2). A few clusters occur more prevalently in colder seasons. For example, cluster 9, of which the top five most abundant OTUs were Lautropia, Gemella, Coriobacteriaceae, Enterobacteriaceae and Clostridiaceae, appeared more in winter and early spring (November and March), and cluster 1 (represented by Rothia, Gemellaceae, Corynebacterium, Neisseriaceae and Oribacterium) was more abundant in November, cluster 5 (represented by Mogibacterium, Veillonellaceae, Peptostreptococcaceae, Bifidobacterium and Bilophila) was more observed in March. Cluster 4, represented by Haemophilus, Megasphaera, Lachnospiraceae, Lactobacillus, and Moryella, exhibited higher abundance during the switch from cold to warm seasons (March to May). In comparison, more clusters of microbiota showed higher abundance in the hot seasons of the year. For example, cluster 10 (represented by Neisseria, Staphylococcus, Comamonadaceae, Methylobacterium, and Burkholderia) and cluster 11 (represented by Actinomyces, Butyrivibrio, Xanthomonadaceae, Comamonadaceae, and Deinococcus) both showed a preponderance of abundance in May compared to other seasons, while cluster 8 (represented by Fusobacterium, Prevotella, Granulicatella, Campylobacter, and Actinomycetaceae) in July and cluster 12 (represented by Porphyromonas, Acinetobacter, Filifactor and Mogibacteriaceae in September. In addition, cluster 6, represented by Streptococcus, Actinobacillus, Treponema, Tannerella, and Dialister exhibited higher abundance during the shift from warm seasons to cold seasons (September to November). Unlike the above clusters which showed clear climate-oriented trends, a few clusters exhibited large fluctuations throughout the year, including cluster 2 (represented by Enterobacteriaceae, Pseudomonas, Cardiobacterium, Moraxella, and Anaerovorax), cluster 3 (represented by Prevotella, Veillonella, Leptotrichia, Capnocytophaga, and Selenomonas) and cluster 7 (represented by Clostridiales, Bacteroides, Lachnospiraceae, Pyramidobacter, and Tissierellaceae).
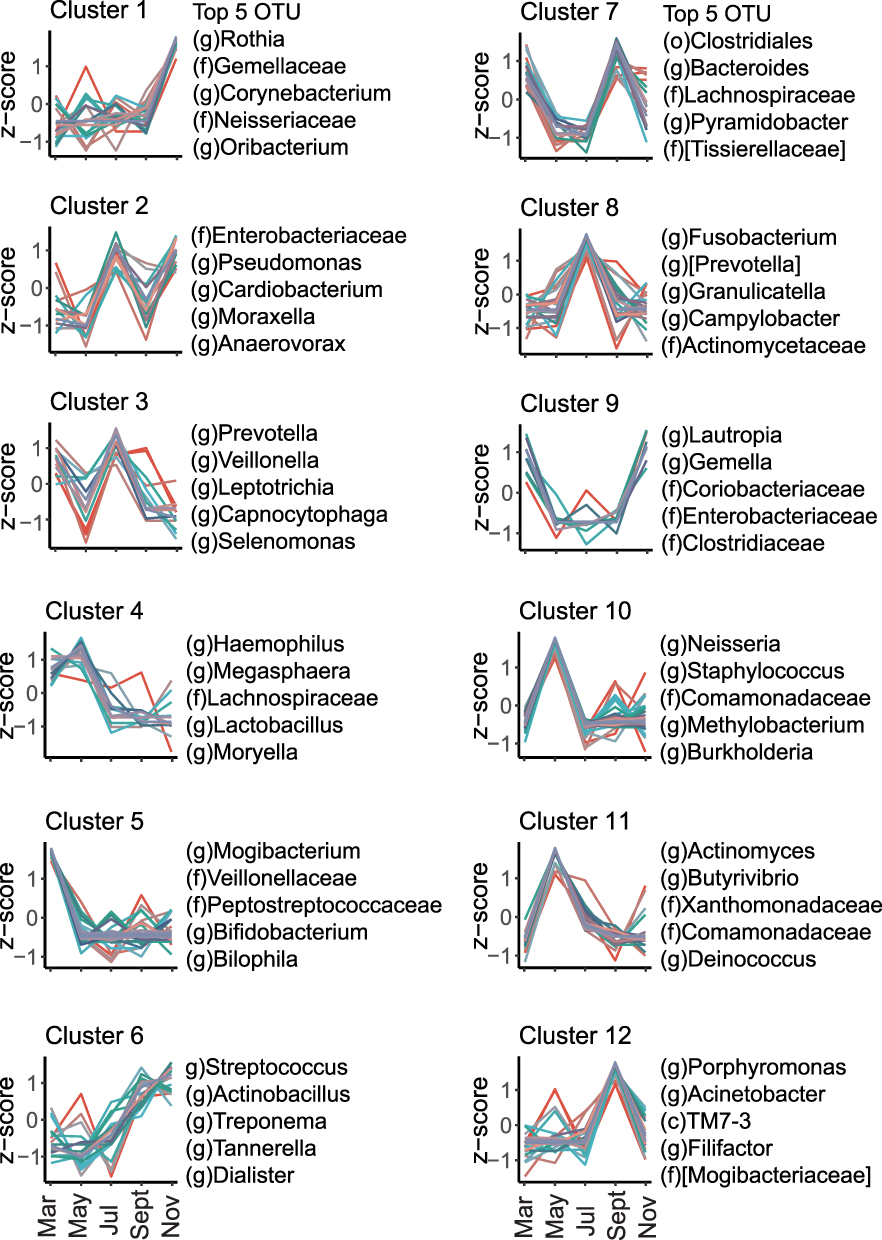 |
Figure 2 Differential and clustering analysis of the airway microbial relative abundance along the time course. Line charts represent the trends of z-score of the relative abundance of OTUs over time. The top five most abundant OTUs were listed on the right side of each plot. Full members of each cluster were listed in Table S2. Colors indicate membership values representing the degree to which data points belong to a cluster. |
Similar to the microbial compositions, clustering of functional characteristics was analyzed on the pathway level and distinct clustering patterns were formed. Notably, a number of cluster were more abundantly observed in colder months, including cluster 2 with more abundance in November, cluster 1 in November and March, as well as cluster 10 predominantly occurring in March (Figure S4, Table S3). These cold-weather-associated clusters include several pathways involved in pathogenicity. For example, cluster 1 includes pathways in bacterial invasion of epithelial cells and Staphylococcus aureus infection; cluster 2 includes pathways in cell adhesion molecules, focal adhesion, secretion and action, and some intestinal infection-associated pathways including Shigellosis and Vibrio cholerae infection. These functions might play potential roles in symptom worsening and exacerbations for COPD patients during the winter season of the year. Moreover, cluster 10 contains multiple antimicrobial resistance pathways, such as beta-lactam resistance, cationic antimicrobial peptide (CAMP) resistance, etc., which might be resulted from patients’ antimicrobial usage.
Stability of Seasonal Patterns of Airway Microbiome in COPD Patients in Different Years
Given the seasonal patterns in the one-year sampling above, we further examined whether the seasonal microbial composition was stable across years. Six subjects in our cohort were sampled during the same season (November) in 2019 and 2020, we then profiled and compared their upper airway microbiome. A total of 3645 OTUs at 99% sequence identity were observed in the 12 swab samples collected from these 6 subjects after rarefaction. Despite an overall reduced alpha diversity (Figure 3a), Procrustes analysis displayed a strong correlation between microbiome composition from the same subject sampled in the same season in two consecutive years (Figure 3b, M2 = 0.0784, P = 0.0958). A small and non-significant (P > 0.05, Paired Wilcoxon Signed Rank Test) microbial composition shift toward an increase in the relative abundance of Neisseria, Actinomyces, and Haemophilus and a decrease in the relative abundance of Streptococcus, Prevotella, and Rothia (Figure 3c) was observed in the sample collected in 2020 compared with that in 2019.
 |
Figure 3 Microbial profiles from the same patients sampled in the same season of different years. (a) Alpha diversity (Shannon). (b) Procrustes analysis of the airway microbiome profiles from the same patients sampled in different years. Solid dots indicate samples from the year 2019 and circles indicate samples from 2020. (c) Microbiome composition at the genus level. |
Discussion
By comparing the swab microbiomes of COPD patients in different seasons, our study, for the first time, elucidated the year-round seasonal microbiome changes in the upper respiratory tract of COPD patients.
Consistent observations were found between this study and previous literatures. For example, Brevibacillus was significantly increased in November and Proteus in March in the upper airway microbiome of COPD patients in our study. Previous studies have come up with the conclusion that Brevibacillus and Proteus are correlated with COPD exacerbation25,26 and other research has highlighted the effect of low temperature on increased exacerbation frequencies of chronic obstructive pulmonary disease patient.27,28 From this, we believe that season-induced changes in the respiratory microbiota may partially account for changes in the clinical phenotype of COPD.
Unlike cross-sectional studies with a focus mainly on core OTUs, we performed differential analysis and clustering analysis along the time course of our data to fully elaborate distinct patterns of microbial response to the seasonal change and comprehensively demonstrated the bacterial composition of each temporal pattern. In detail, cluster 1, cluster 2, and cluster 9 tend to become prevalent in cold weather (from September to November), and bacteria abundant in these clusters, for example, Rothia29 in cluster 1, Moraxella30 in cluster 2, and Veillonella31 in cluster 3 were reported to be enriched in airway microbiome of COPD patients and are associated with frequent exacerbation. Moreover, multiple pathogenicity-associated pathways, such as those contributing to cell adhesion, secretion and bacterial invasion, as well as some infection-related pathways such as Staphylococcus aureus and even intestinal infections such as Shigellosis and Vibrio cholerae infection were more abundantly observed in cooler seasons than in hot seasons. This further provides potential explanations for that COPD patients are more likely to suffer exacerbation in winter or early spring, and the causal relationships should be further studied in the future. The strong correlation (Figure 3b, M2=0.0784, P=0.0958 in Procrustes analysis) between microbial profiles from November 2019 and November 2020 from the same patients provide further evidence that seasonal microbial patterns were consistent across years, which further emphasized that seasonal changes could be a key factor inducing upper airway microbiome alternations in COPD patients.
Clustering microbiota along time points can provide an opportunity to peer into the potential dynamic interactions between microbiota. For example, many previous studies have revealed the interactions between human microbiome.32,33 Similarly, mutually exclusive relationships might exist between microbial clusters with opposite temporal trends, while the microorganism within one cluster or the clusters with consistent trends may benefit each other. However, more controlled experiments would be required to further elucidate the interactions of inter- and intra-cluster microorganisms.
There are several caveats of our study. Firstly, the study design is single-centered, and additional multi-centered cohorts preferably across continents with longitudinal follow-up are needed to further validate our findings. Secondly, we lack sufficient data to explore the stability of the microbiome composition in the same season after a one-year-long fluctuation. Finally, besides bacteria, the importance of viruses and fungi in COPD is just beginning to be appreciated and studied. Previous studies have mentioned the critical role of viruses in monitoring the phenotype and airway microbiome of COPD patient in different seasons.19 Therefore, further investigation of the interaction between microbiome and virus, especially in different seasons, would be needed.
Conclusions
A 16S rRNA-based upper airway microbiome survey of 18 COPD patients across five months (March, May, July, September, and November) in 2019 and 6 resampled patients in November in 2020 was performed in this study. Microorganisms and their functions were clustered according to their temporal pattern. A total of 12 clusters, for both microbial community and functional composition, with distinct temporal patterns were revealed and the full list of bacteria within each cluster were explored. In summary, our study highlighted the variability of the upper airway microbiome of COPD patients in different seasons, provided important information for clinical understanding of underlying microbial drivers of seasonal variation in disease phenotypes, and thus would provide new insights into the search for biomarkers for precision medicine in COPD.
Abbreviations
COPD, chronic obstructive pulmonary disease; OTU, operational taxonomic unit; PCA, principal component analysis; ANOSIM, analysis of similarities.
Data Sharing Statement
All data generated or analyzed during this study are included in this published article and its Supplementary Information Files.
Ethics Approval and Informed Consent
This study was approved by the ethics committee of The Third Affiliated Hospital of Sun Yat-sen University (No.: 2022-02-239-01).
Consent for Publication
All participants provided written informed consent and the study was conducted in accordance with the provisions of the Declaration of Helsinki.
Author Contributions
SC participated in study design and sample collection. JG analyzed the patient data and prepared draft manuscript. XL and SL participated in sample collection and performed experiments. JY performed bioinformatics analysis and statistical analysis. DF, GL, HY, ZW assisted in resource acquisition and manuscript improvement. All authors read and approved the final manuscript. XY instructed the data analysis and prepared the final manuscript. YZ conceived, designed and supervised the study. All authors made substantial contributions to conception and design, acquisition of data, or analysis and interpretation of data; took part in drafting the article or revising it critically for important intellectual content; agreed to submit to the current journal; gave final approval of the version to be published; and agree to be accountable for all aspects of the work.
Funding
This work was supported financially by the National Natural Science Foundation of China (Nos. 41907211).
Disclosure
The authors declare that they have no competing interests.
References
1. Lopez AD, Shibuya K, Rao C, et al. Chronic obstructive pulmonary disease: current burden and future projections. Eur Respir J. 2006;27(2):397–412. doi:10.1183/09031936.06.00025805
2. Franklin W, Lowell FC, Michelson AL, Schiller IW. Chronic obstructive pulmonary emphysema; a disease of smokers. Ann Intern Med. 1956;45(2):268–274.
3. Taraseviciene-Stewart L, Douglas IS, Nana-Sinkam PS, et al. Is alveolar destruction and emphysema in chronic obstructive pulmonary disease an immune disease? Proc Am Thorac Soc. 2006;3(8):687–690. doi:10.1513/pats.200605-105SF
4. Haldar K, George L, Wang Z, et al. The sputum microbiome is distinct between COPD and health, independent of smoking history. Respir Res. 2020;21(1):183. doi:10.1186/s12931-020-01448-3
5. Liu HY, Liang ZY, Cao NN, et al. Airway bacterial and fungal microbiome in chronic obstructive pulmonary disease. Med Microecol. 2021;7:100035. doi:10.1016/j.medmic.2021.100035
6. Wang Z, Bafadhel M, Haldar K, et al. Lung microbiome dynamics in COPD exacerbations. Eur Respir J. 2016;47(4):1082–1092. doi:10.1183/13993003.01406-2015
7. Wang Z, Singh R, Miller BE, et al. Sputum microbiome temporal variability and dysbiosis in chronic obstructive pulmonary disease exacerbations: an analysis of the COPDMAP study. Thorax. 2018;73(4):331–338. doi:10.1136/thoraxjnl-2017-210741
8. Wang Z, Liu HY, Wang FY, et al. A refined view of airway microbiome in chronic obstructive pulmonary disease at species and strain-Levels. Front Microbiol. 2020;30(11):1758.
9. Philip LM, Patrick M, Michael JC, et al. Outgrowth of the bacterial airway microbiome after rhinovirus exacerbation of chronic obstructive pulmonary disease. Am J Respir Crit Care Med. 2013;188(10):1224–1231. doi:10.1164/rccm.201302-0341OC
10. Kim HJ, Kim Y-S, Kim K-H, et al. The microbiome of the lung and its extracellular vesicles in nonsmokers, healthy smokers and COPD patients. Exp Mol Med. 2017;49(4):e316–e316. doi:10.1038/emm.2017.7
11. Smits SA, Leach J, Sonnenburg ED, et al. Seasonal cycling in the gut microbiome of the Hadza hunter-gatherers of Tanzania. Science (New York, N.Y.). 2017;357(6353):802–806. doi:10.1126/science.aan4834
12. Tong XZ, Leung MHY, Wilkins D, Cheung HHL, Lee PKH. Neutral Processes Drive Seasonal Assembly of the Skin Mycobiome. mSystems. 2019;4(2):e00004–00019. doi:10.1128/mSystems.00004-19
13. Camarinha-Silva A, Jáuregui R, Pieper DH, Wos-Oxley ML. The temporal dynamics of bacterial communities across human anterior nares. Environmental Microbiology Reports. 2012;4(1):126–132. doi:10.1111/j.1758-2229.2011.00313.x
14. Bogaert D, Keijser B, Huse S, et al. Variability and Diversity of Nasopharyngeal Microbiota in Children: a Metagenomic Analysis. PLoS One. 2011;6(2):e17035. doi:10.1371/journal.pone.0017035
15. Mika M, Mack I, Korten I, et al. Dynamics of the nasal microbiota in infancy: a prospective cohort study. J Allergy Clin Immunol. 2015;135(4):905–912.e911. doi:10.1016/j.jaci.2014.12.1909
16. Tseng CM, Chen YT, Ou SM, et al. The effect of cold temperature on increased exacerbation of chronic obstructive pulmonary disease: a nationwide study. PLoS One. 2013;8(3):e57066. doi:10.1371/journal.pone.0057066
17. Ayres JG, Forsberg B, Annesi-Maesano I, et al. Climate change and respiratory disease: European Respiratory Society position statement. Eur Respir J. 2009;34(2):295–302. doi:10.1183/09031936.00003409
18. Mehdi M, Hooman M, Mojdeh TK, Arash S, Michael C, Dean ES. Climate change and respiratory infections. Ann Am Thorac Soc. 2016;13(8):1223–1230. doi:10.1513/AnnalsATS.201511-729PS
19. Wilkinson TMA, Aris E, Bourne S, et al. A prospective, observational cohort study of the seasonal dynamics of airway pathogens in the aetiology of exacerbations in COPD. Thorax. 2017;72(10):919–927. doi:10.1136/thoraxjnl-2016-209023
20. 2022 Global strategy for prevention, diagnosis and management of COPD. Available from: https://goldcopdorg/2022-gold-reports/.
21. Caporaso JG, Kuczynski J, Stombaugh J, et al. QIIME allows analysis of high-throughput community sequencing data. Nat Methods. 2010;7(5):335–336. doi:10.1038/nmeth.f.303
22. Douglas GM, Maffei VJ, Zaneveld JR, et al. PICRUSt2 for prediction of metagenome functions. Nat Biotechnol. 2020;38(6):685–688. doi:10.1038/s41587-020-0548-6
23. Catherine L, Rob K. UniFrac: a new phylogenetic method for comparing microbial communities. Appl Environ Microbiol. 2005;71(12):8228–8235. doi:10.1128/AEM.71.12.8228-8235.2005
24. Dixon P. VEGAN, a package of R functions for community ecology. J Vegetation Sci. 2003;14(6):927–930. doi:10.1111/j.1654-1103.2003.tb02228.x
25. Huang YJ, Kim E, Cox MJ, et al. A persistent and diverse airway microbiota present during chronic obstructive pulmonary disease exacerbations. OMICS. 2010;14(1):9–59. doi:10.1089/omi.2009.0100
26. Shimizu K, Yoshii Y, Morozumi M, et al. Pathogens in COPD exacerbations identified by comprehensive real-time PCR plus older methods. Int J Chron Obstruct Pulmon Dis. 2015;10(1):2009–2016. doi:10.2147/COPD.S82752
27. Donaldson G, Wedzicha J. The causes and consequences of seasonal variation in COPD exacerbations. Int J Chron Obstruct Pulmon Dis. 2014;9(1):1101–1110. doi:10.2147/COPD.S54475
28. Donaldson GC, Wedzicha JA. Deprivation, winter season, and COPD exacerbations. Primary Care Respir J. 2013;22(3):264–265. doi:10.4104/pcrj.2013.00078
29. Tiew PY, Jaggi TK, Chan LLY, Chotirmall SH. The airway microbiome in COPD, bronchiectasis and bronchiectasis-COPD overlap. Clin Respir J. 2021;15(2):123–133. doi:10.1111/crj.13294
30. Timothy FM, Aimee LB, Brydon JBG, Sanjay S. Moraxella catarrhalis in Chronic Obstructive Pulmonary Disease. Am J Respir Crit Care Med. 2005;172(2):195–199. doi:10.1164/rccm.200412-1747OC
31. Li K, Luo C, Yuan YL, Gao C, Lin J, Zhang C. Investigation on the Pathological Mechanism of Frequent Exacerbators With Chronic Obstructive Pulmonary Disease Based on the Characteristics of Respiratory Flora. Front Med. 2022;20(8):816802.
32. Silbergleit M, Vasquez AA, Miller CJ, Sun J, Kato I. Chapter Five - Oral and intestinal bacterial exotoxins: potential linked to carcinogenesis. In: Sun J, editor. Progress in Molecular Biology and Translational Science. Vol. 171. Academic Press; 2020:131–193.
33. Marsh PD, Zaura E. Dental biofilm: ecological interactions in health and disease. J Clin Periodontol. 2017;44(18):S12–S22. doi:10.1111/jcpe.12679
 © 2023 The Author(s). This work is published and licensed by Dove Medical Press Limited. The
full terms of this license are available at https://www.dovepress.com/terms
and incorporate the Creative Commons Attribution
- Non Commercial (unported, 3.0) License.
By accessing the work you hereby accept the Terms. Non-commercial uses of the work are permitted
without any further permission from Dove Medical Press Limited, provided the work is properly
attributed. For permission for commercial use of this work, please see paragraphs 4.2 and 5 of our Terms.
© 2023 The Author(s). This work is published and licensed by Dove Medical Press Limited. The
full terms of this license are available at https://www.dovepress.com/terms
and incorporate the Creative Commons Attribution
- Non Commercial (unported, 3.0) License.
By accessing the work you hereby accept the Terms. Non-commercial uses of the work are permitted
without any further permission from Dove Medical Press Limited, provided the work is properly
attributed. For permission for commercial use of this work, please see paragraphs 4.2 and 5 of our Terms.