Back to Journals » Journal of Inflammation Research » Volume 17
scRNA-Seq and Bulk-Seq Analysis Identifies S100A9 Plasma Cells as a Potentially Effective Immunotherapeutic Agent for Multiple Myeloma
Authors Long X ![]() , Li F
, Li F ![]() , Tang S, Liu J, Fu Y, Feng Y
, Tang S, Liu J, Fu Y, Feng Y
Received 27 November 2023
Accepted for publication 20 February 2024
Published 9 March 2024 Volume 2024:17 Pages 1527—1548
DOI https://doi.org/10.2147/JIR.S452062
Checked for plagiarism Yes
Review by Single anonymous peer review
Peer reviewer comments 2
Editor who approved publication: Dr Tara Strutt
Xinyi Long,1 Fangfang Li,1 Sishi Tang,1 Jing Liu,1 Yunfeng Fu,2 Yanhui Feng3
1Department of Hematology, The Third Xiangya Hospital, Central South University, Changsha, 410013, People’s Republic of China; 2Department of Blood Transfusion, The Third Xiangya Hospital of Central South University, Changsha, 410013, People’s Republic of China; 3Department of Oncology, The Third Xiangya Hospital of Central South University, Changsha, 410013, People’s Republic of China
Correspondence: Yanhui Feng, Department of Oncology, The Third Xiangya Hospital, Central South University, No. 138 Tongzipo Road, Yuelu District, Hexi, Changsha, Hunan Province, People’s Republic of China, Tel +86-13549656766, Email [email protected]
Purpose: Immunological regimens are an important area of research for treating multiple myeloma (MM). Plasma cells play a crucial role in immunotherapy.
Patients and Methods: In our study, we used both single-cell RNA sequencing (scRNA-seq) and bulk sequencing techniques to analyze MM patients. We analyzed each sample using gene set variation analysis (GSVA) based on immune-related gene sets. We also conducted further analyses to compare immune infiltration, clinical characteristics, and expression of immune checkpoint molecules between the H-S100A9 and L-S100A9 groups of MM patients.
Results: We identified eight subpopulations of plasma cells, with S100A9 plasma cells being more abundant in patients with 1q21 gain and 1q21 diploid. CellChat analysis revealed that GAS and HGF signaling pathways were prominent in intercellular communication of S100A9 plasma cells. We identified 14 immune-related genes in the S100A9 plasma cell population, which allowed us to classify patients into the H-S100A9 group or the L-S100A9 group. The H-S100A9 group showed higher ESTIMATE, immune and stroma scores, lower tumor purity, and greater immune checkpoint expression. Patients with 1q21 gain and four or more copies had the lowest ESTIMATE score, immune score, stroma score, and highest tumor purity. Drug sensitivity analysis indicated that the H-S100A9 group had lower IC50 values and greater drug sensitivity compared to the L-S100A9 group. Quantitative reverse transcription (RT-q) PCR showed significantly elevated expression of RNASE6, LYZ, S100A8, S100A9, and S100A12 in MM patients compared to the healthy control group.
Conclusion: Our study has identified a correlation between molecular subtypes of S100A9 plasma cells and the response to immunotherapy in MM patients. These findings improve our understanding of tumor immunology and provide guidance for developing effective immunotherapy strategies for this patient population.
Keywords: multiple myeloma, single-cell sequencing, bulk transcription, tumor immune microenvironment, S100A9
Introduction
Multiple myeloma (MM) is a malignant proliferative disease that manifests with symptoms including hypercalcemia, anemia, bone pain, and renal dysfunction, which significantly impact the patient’s health status.1 While the exact etiology of MM remains incompletely understood, it is recognized that its occurrence and progression are influenced by various factors, including chromosomal abnormalities, genetic factors, and immune disorders.1
In recent years, researchers have conducted comprehensive investigations into the molecular genetics, immunology, cell biology, pathology, and other aspects of MM. This research has yielded more precise and effective approaches for understanding the disease’s pathogenesis, diagnosis, and treatment. The primary treatment modalities for MM consist of induction therapy and maintenance therapy. Induction therapy involves the use of injectable proteasome inhibitors, oral immunomodulatory agents, and dexamethasone. A combination of induction therapy and autologous hematopoietic stem cell transplantation, followed by lenalidomide maintenance therapy, is recommended for eligible patients.2 The introduction of proteasome inhibitors, such as bortezomib, has greatly enhanced the prognosis of patients diagnosed with multiple myeloma. However, a subset of patients have exhibited resistance to bortezomib treatment. Consequently, there is a need to explore alternative treatment approaches, including combination therapy and immunotherapy, in order to overcome this resistance.3 Prior research indicates that the combination of bortezomib and hydroxychloroquine treatment should be coupled with an anti-angiogenic drug to counteract the pro-angiogenic impact of bortezomib. This approach aims to inhibit the proliferation of a small residual tumor PC clone, thereby mitigating the risk of relapse.3 Recently, immunotherapy offers distinct advantages such as minimal invasiveness, reduced side effects, and favorable long-term outcomes, thereby providing additional therapeutic potential in the management of MM. As a novel approach, immunotherapy has emerged to cancer treatment and has gained widespread acceptance in MM therapy.4 Currently, various immunotherapy techniques are employed for treating MM, including anti-CTLA-4 and anti-PD-1/PD-L1 drugs, CAR-T cell therapy, among others. It is noteworthy that, despite the proven efficacy of immunotherapy in alleviating MM symptoms and improving patient survival, certain challenges and limitations still exist. For example, patients may exhibit different responses to immunotherapy methods like CAR-T cell therapy, and varying degrees of side effects may occur during the treatment process.5–7 Furthermore, more extensive research and exploration are necessary to determine optimal selection, dosage, and duration of specific immunotherapy regimens. Therefore, the identification of new immunotherapy targets assumes paramount importance.
MM with gain/amplification in the 1q21 gene region, known as 1q21 gain/amp MM, represents a distinct subtype characterized by chromosomal-level amplification. This subtype is frequently associated with adverse prognostic factors, including high-risk features, increased susceptibility to recurrence, and resistance to chemotherapy.8 However, 1q21 gain/amp MM also exhibits certain specificity in immunotherapy. Studies have indicated that amplification in the 1q21 gene region is linked to immune exclusion and resistance to immune checkpoint blockade therapies.9
MMs are characterized by clonal proliferation of malignant plasma cells whose development and progression hinge on their interplay with their surrounding microenvironment.10 The tumor microenvironment involves a variety of components, including bone marrow stromal cells around plasma cells, immune cells, the vascular system and the extracellular matrix.11 These elements form a complex network of interactions with plasma cells through cell signaling, cytokine release, and cell-cell interactions.11,12 Plasma cells secrete several cytokines and mediators, including IL-17, IL-10, and IL-35, that stimulate inflammation and promote cell proliferation, resulting in a tumor-friendly environment.13–15 Additionally, adipose tissue in the bone marrow promotes plasma cell proliferation and survival. Leptin, adiponectin, resistin, adipsin, and visfatin, all produced by adipose tissue within the bone marrow, are factors that promote plasma cell proliferation and survival via pSTAT-3/STAT-3 signaling.16,17 Finally, plasma cells interact with the tumor microenvironment via immune cells such as macrophages, dendritic cells, and T lymphocytes. These immune cells play crucial roles in immune monitoring and activation of MM by affecting immune tolerance, immune response, and plasma cell proliferation.18
At the single-cell level, Single-cell sequencing technology enables a detailed analysis of gene expression patterns and subpopulation distribution in the tumor microenvironment. In this way, the characteristics and interactions of various cell types in the tumor microenvironment can be studied in greater detail, providing us with tools and data that assist in studying MM.19 Recent advances in single-cell technology have led to an increase in studies using single-cell sequencing to examine MM pathogenesis and treatment strategies.20
In our study, we employed single-cell analysis to classify plasma cell subpopulations. We identified a specific plasma cell subpopulation characterized by the expression of the immuno-oncological target S100A9. By examining genes associated with S100A9 plasma cells and using GSVA, we calculated S100A9 scores for each sample. Subsequently, we divided into two categories based on S100A9 score: H-S100A9 and L-S100A9. The H-S100A9 category exhibited a higher immune infiltration rate and immune checkpoint expression compared to the L-S100A9 category. Figure 1 illustrates the workflow of this study. Our findings highlight the significant role of S100A9 plasma cells in tumor immunity, suggesting that patients with MM displaying H-S100A9 subpopulations are more suitable candidates for immunotherapy.
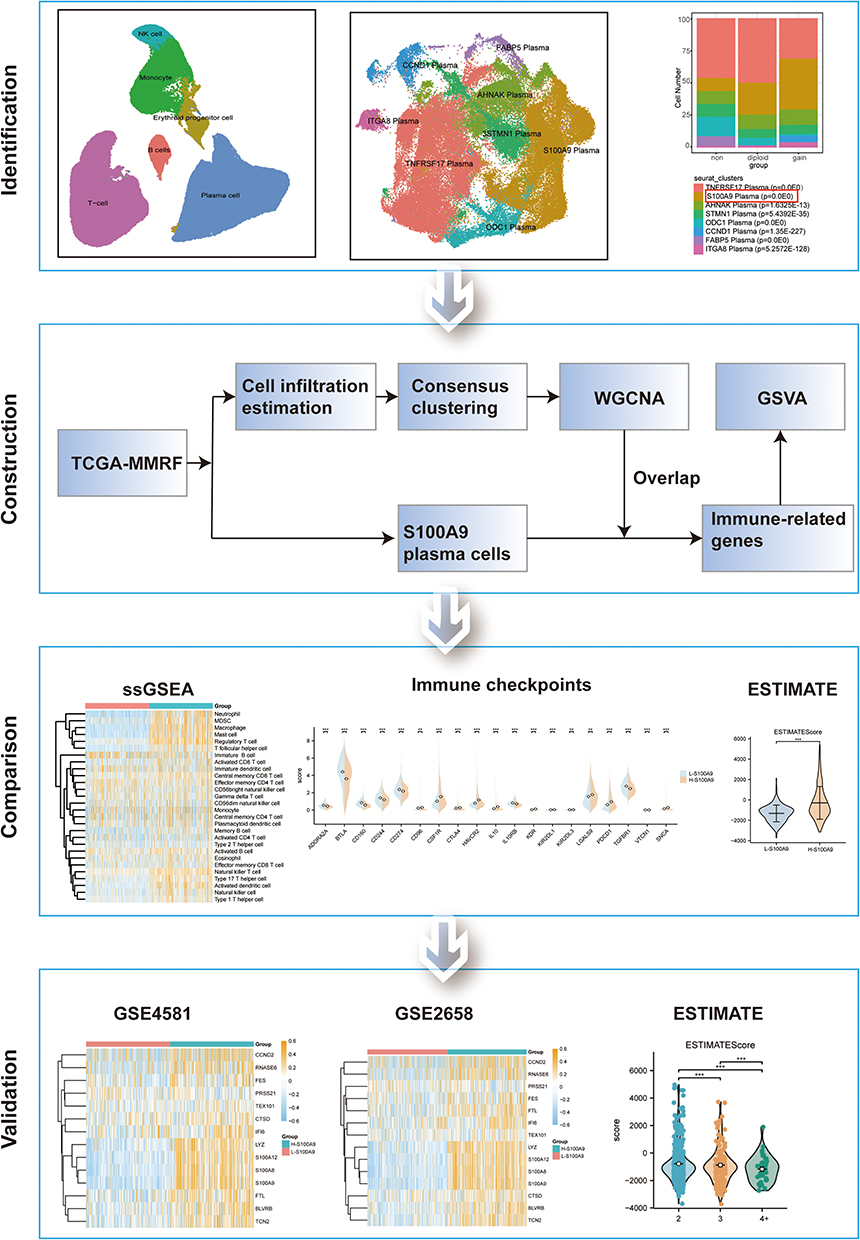 |
Figure 1 Flow chart. **P < 0.01, ***P < 0.001. |
Materials and Methods
Data Acquisition and Processing
Single-cell transcriptome data was obtained from the Gene Expression Omnibus (GEO) dataset GSE161801. A total of 18 MM samples were included for further analysis after excluding samples with 1q21 status unknown. The Seurat R package was used to analyze scRNA-seq data.21 The data was standardized and integrated using the “SCTransform” method and the “IntegrateData” function, resulting in the identification of 3000 highly variable genes. We excluded cells that contained less than 10% mitochondrial genes, cells with a total gene count exceeding 200, and genes with expression levels ranging from 200 to 10,000 that were detected in less than three cells. The first 30 principal components were determined using Seurat’s “RunPCA” function. Subsequently, UMAP was employed to reduce the dimensionality of the 3000 hypervariable genes with a resolution of 0.2. K-nearest neighbors (KNN) clustering was performed using the “FindNeighbors” and “FindCluster” functions. Furthermore, differential expression analysis was conducted using the Seurat’s “FindMarkers” function.
The RNA-seq data were obtained from TCGA-MMRF, GSE4581, and GSE2658. 787 MM patients’ count sequencing data and clinical data were downloaded from the Cancer Genome Atlas (TCGA, https://portal.gdc.cancer.gov/). The RNA sequencing data was transformed into transcripts per kilobase million and further log-2 transformed to ensure comparability of gene expression across different samples. Significantly differentially expressed genes were identified based on the screening criteria of a log fold change greater than 2 and an adjusted p-value less than 0.05. In addition, MM expression profile datasets GSE458122 and GSE265823 were also downloaded from the GEO database using GEOquery.24 Both GSE4581 and GSE2658 datasets consisted of homo sapiens bone marrow samples, including 414 and 559 cases, respectively. The GPL570 platform was used for both datasets. In all datasets, the expression level of each gene was transformed into z-scores.
Cell-Cell Communication Analysis
The intercellular communication of cell clusters was calculated and analyzed using the CellChat package.25 The standard process recommended by CellChat was followed to analyze the incoming and outgoing communication modes involving S100A9 plasma. Initially, the CellChat objects were generated through the utilization of the “createCellChat” function. Subsequently, the communication probability was deduced via the use of the “computeCommunProb” and “computeCommunProbPathway” functions. The network centrality scores and the impact of every ligand-receptor pair on the signaling pathway were calculated utilizing the “netAnalysis_computeCentrality” and “netAnalysis_contribution” functions, respectively. Finally, all visual representations depicting cell communications were created using the embedded functions within the CellChat package. Circle, heat, and bubble diagrams were used to visually represent the potential ligand-receptor interactions and the strength of cell-cell communication networks between S100A9 plasma and other cell clusters.
Immune Infiltration Analysis in MM
We performed single sample gene set enrichment analysis (ssGSEA)26,27 and quantified the relative abundance of 28 immune cell types in each sample using the GSVA package.28 GSVA package was used to perform single sample gene set enrichment analysis (ssGSEA) and quantify the relative abundance of 28 immune cell types in each sample. In addition, to verify the stability and robustness of the ssGSEA results, the ESTIMATE algorithm29 was employed.
Consensus Clustering
Consensus clustering30 was based on resampling and used subsampling to induce sampling variability to provide clustering stability and parameter decision-making. This approach is used to identify each member of subgroups and verify the rationality of clustering. The ConsensusClusterPlus package31 was used to identify different MM immune-related subtypes based on enrichment scores calculated by ssGSEA analysis.
Weighted Correlation Network Analysis (WGCNA)
WGCNA32 refers to a systems biology technique that is utilized for the characterization of gene association patterns across samples. Through this technique, highly synergistic gene sets can be identified and candidate biomarker genes or therapeutic targets can be explored based on the connectivity of gene sets and their associations with phenotypes. R package WGCNA32 was employed to calculate key gene sets related to Cluster 1, Cluster 2, and Cluster 3, and subsequently identified positive/negative correlation modules associated with MM immune-related aggregation. The “pickSoftThreshold” function was utilized to filter power parameter values ranging from 1 to 20. We selected a soft threshold value of 11 that met the criteria of a scale independence of 0.9 and a minimum power value. Next, we constructed modules, clustered similar ones, and obtained a gene list corresponding to each module. We specifically selected the positive correlation module within Cluster 3 and intersected it with the gene set highly expressed in S100A9 plasma cells. Finally, the key immune-related genes in MM were identified using a Venn diagram.
Gene Set Enrichment Analysis (GSEA) and Drug Sensitivity Analysis
To evaluate the impact of a pre-defined gene set on phenotype, GSEA was utilized to analyze the correlation distribution trend within a gene table sorted by phenotype correlation.33 To conduct enrichment analysis of all differentially expressed genes in our study, the clusterProfiler package34 was employed. The threshold for significance in the enrichment analysis was set at a P value less than 0.05. The GSEA gene set used in this study was obtained from the MSigDB Collections gene set database (https://www.gsea-msigdb.org/gsea/msigdb/index.jsp).
We used the pRRophytic35 package to predict the drug sensitivity analysis of MM patients, and used a box plot to display the differences in drug sensitivity between H-S100A9 group and L-S100A9 group.
Patients and Samples
The study complied with the Declaration of Helsinki and was approved by the Ethics Committee of Xiangya Third Hospital (permission number: 2021-S440), and all participating patients provided written informed consent. We applied the IMWG criteria for diagnosing MM to our patient cohort. Subsequent to obtaining informed consent, healthy donors were utilized as the control group. Eight bone marrow samples were obtained from both patients (four bone marrow samples) and the healthy control group (four bone marrow samples), and monocytes were isolated using lymphocyte isolation solution (Gibco, Carlsbad, CA, USA).
Quantitative Reverse Transcription (q-RT) PCR
Total RNA was extracted from cells using TRIzol reagent (Invitrogen, USA). The extracted RNA was then qualified and quantified using a UV spectrophotometer, and the concentrations were adjusted accordingly. To convert RNA to cDNA, a reverse transcription kit from Vazyme (Jiangsu, China) was utilized. For qPCR analysis, the SYBR qPCR master mix (Vazyme) was employed. GAPDH was selected as the reference gene for normalizing the expression of genes. The relative expression levels were determined using the 2–ΔΔCT method.
Statistical Analysis
All data processing and analysis in this article were conducted using R software (Version 4.1.2). Continuous variables were presented as mean ± standard deviation. Means of 2 continuous normally distributed variables were compared by independent samples Student’s t-test. Mann–Whitney U-test and Kruskal–Wallis test were used, respectively, to compare means of 2 and 3 or more groups of variables not normally distributed. Statistical significance between two groups of categorical variables was assessed using the chi-square test or Fisher’s exact test. P-value<0.05 was considered statistically significant.
Results
An Overview of the Cell Types in MM
To determine cell types in 1q21-negative, 1q21-diploid, and 1q21-gain MM samples, we analyzed the single-cell sequencing dataset GSE161801. Supplementary Table 1 shows the chromosome 1q21 status of all patients. There was no significant batch effect among the 18 samples, which were used for subsequent analysis (Figure 2A). 189,534 cells were obtained after quality control, including 55,212 cells from the 1q21-negative group, 22,319 cells from the 1q21-diploid group, and 112,003 cells from the 1q21-gain group (Figure 2B). Based on the surface marker genes of different cell types (Figure 2C and D), we identified six cell types: erythroid precursor cells, B cells, monocytes, natural killer cells, plasma cells, and T cells (Figure 2E).
 |
Figure 2 The Overview of Cell Types in MM. (A) The integration of the 18 samples yielded satisfactory results. (B) The UMAP diagram illustrates the cell distribution among the different groups of MM samples based on their 1q21 status (negative, diploid, or gain). (C and D) Dimension reduction cluster analysis was performed resulting in the identification of 11 distinct cell clusters across all 18 samples. (E) The UMAP map visualization provides insights into the expression patterns of marker genes. |
S100A9 Plasma Cells are More Abundant in MM Patients with 1q21 Gain and 1q21 Diploid Status
The plasma cells were categorized into eight subgroups (Figure 3A). We examined the distribution of each patient sample in the integrated dataset and analyzed the overall status of plasma cell clusters in patients with different 1q21 statuses, including 1q21 negative, 1q21 gain, and 1q21 diploid samples (Figure 3B and C). Each plasma cell subpopulation was annotated based on the identified cell markers (Figure 3E), such as TNFRSF17, S100A9, AHNAK, STMN1, ODC1, CCND1, FABP5, and ITGA8 plasma cells. Then, we compared the proportions of plasma cell subgroups among patients with different 1q21 statuses. Our findings revealed a markedly elevated ratio of S100A9 plasma cells in 1q21 gain and 1q21 diploid MM tissues compared to 1q21 negative MM patients (Figure 3F, Supplementary Table 2). This suggests that S100A9 plasma cell subsets are closely associated with the occurrence of MM. To better understand the function of S100A9 plasma cells, GSEA analysis was conducted, revealing significant enrichment of pathways such as HALLMARK_APOPTOSIS, HALLMARK_COMPLEMENT, HALLMARK_P53_PATHWAY, HALLMARK_TGF_BETA_SIGNALING, HALLMARK_WNT_BETA_CATENIN_SIGNALING, and others. These pathways are involved in immune response, apoptosis, cell transcription, and related processes (Figure 3D).
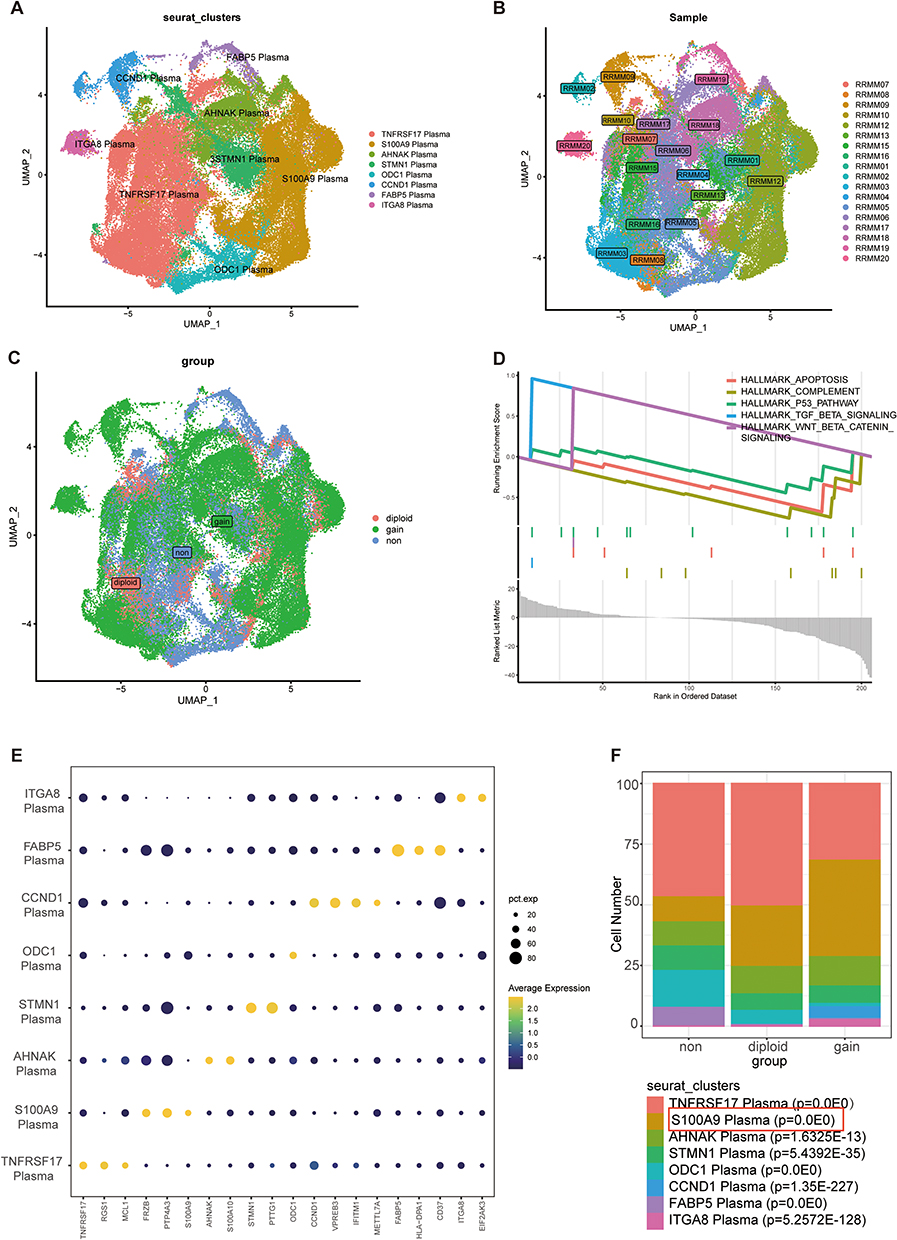 |
Figure 3 The identification and category S100A9 plasma cells in MM. S100A9 plasma cell is identified. (A) UMAP plot depicting the classification of different plasma subpopulations. (B) UMAP embedding with the colors representing patients in the MM group. (C) The distribution of plasma cells across 1q21 negative MM samples, 1q21 gain MM samples, and 1q21 diploid MM samples is visualized in the t-SNE plot. (D) GSEA analysis. (E) The expression patterns of marker genes for different subgroups are illustrated in the bubble diagram. (F) S100A9-expressing plasma cells are predominantly observed in both 1q21 gain MM samples and 1q21 diploid MM samples, as confirmed by chi-square test p-values. |
Cell-Cell Interaction Analysis of S100A9 Plasma
To investigate cellular interactions involving S100A9 plasma cells, we performed cell communication analysis using CellChat. An interaction network between all cell types was constructed, as presented in Figure 4A. Notably, S100A9 plasma cells exhibited greater interaction intensity with T cells and TNFRSF17 plasma cells than with other cell types, as illustrated in Figure 4B. Furthermore, important ligand-receptor pairs that may interact with S100A9 plasma cells were identified and depicted in Figure 4C. Additionally, our in-depth studies of the GAS signaling pathway and HGF signaling pathway revealed that the S100A9 plasma cluster displayed high expression levels of GAS and HGF pathway components, including the major sender, receiver, mediator, and influencer (Figure 4D and E).
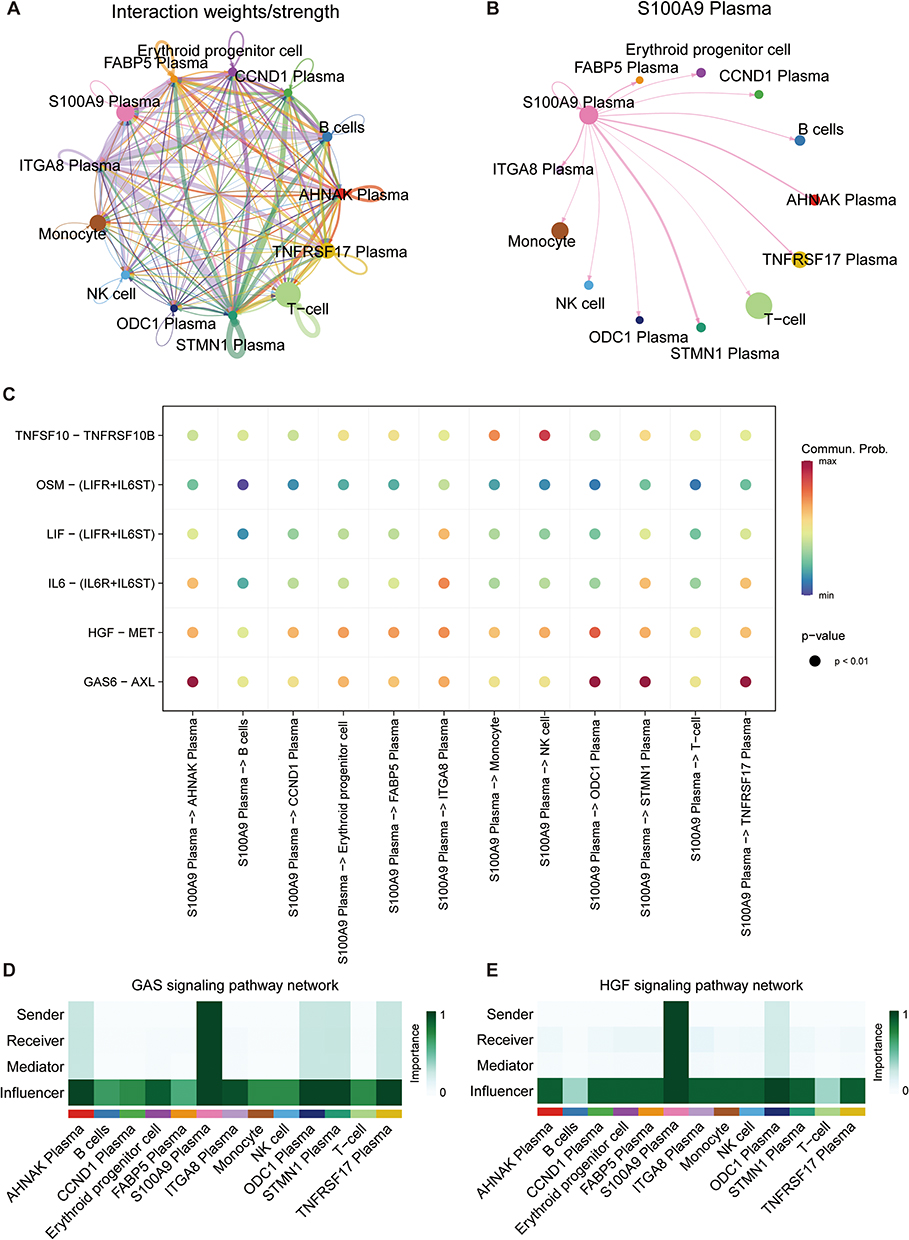 |
Figure 4 CellChat reveals the cell communication relationship among various cell groups. (A) The interaction among all cell types. (B) The interactions between S100A9 plasma cells and other cell types. (C) The identification of ligand-receptor pairs that may interact with S100A9 plasma cells. (D and E) The heatmaps heatmaps depict the GAS and HGF signaling pathways to evaluate each cell type’s involvement in cell interaction. |
Development of Consensus Clusters for Immune Infiltration
To investigate immune infiltration differences in MM, we employed the ssGSEA algorithm for the evaluation of the infiltration levels of 28 types of immune cells in the MM dataset. We conducted consensus clustering analysis to divide the MM samples into k clusters ranging from 2 to 9. The consensus score matrix, cumulative distribution function curve, and t-distributed stochastic neighbor embedding chart demonstrated that a cluster quantity of k=3 was optimal (Figure 5A and B, Supplementary Figure 1A). Immune infiltration was significantly different between Cluster3 compared to Cluster1 and Cluster2. The overall immune infiltration abundance of Cluster3 was significantly higher than that of Cluster1 and Cluster2 (Figure 5C, D), leading us to define Cluster1 and Cluster2 as “immune cold” tumors and Cluster3 as “immune hot” tumors. Furthermore, through the use of ESTIMATE, we validated the stability and robustness of the ssGSEA results. The ESTIMATE results indicated that Cluster3 had a higher immune score that was consistent with the ssGSEA results (Figure 5E).
 |
Figure 5 The identification of immune-related genes associated with S100A9 plasma cells. (A) The consensus score matrix of MM immune related subtypes. (B) Cumulative distribution function curve. (C) The infiltration abundance of three clusters was evaluated using ssGSEA. (D) A box plot illustrating the infiltration and distribution between the two groups. (E) Boxplot depicting the immune scores among the three immune cell subsets. (F) Relationship between module characters in MM, with correlation coefficients and P-values displayed in each cell. (G) Venn diagram shows the intersection of WGCNA and S100A9 plasma cell marker genes. (H) GSEA enrichment analysis of TCGA-MMRF cohort. ns P ≥ 0.05, *P < 0.05, **P < 0.01, ***P < 0.001. |
The Identification of the Immune Related Genes of S100A9 Plasma Cells
We utilized the immune infiltration level in MM to construct a co-expression network. After screening, we determined that a soft threshold of 11 provided an approximate scale-free topology, with a fitting index >0.9 and the lowest power value (Supplementary Figure 1B and C). We then performed clustering analysis to identify similar modules, resulting in 28 modules (Supplementary Figure 1D). Subsequently, the association between module features and clinical characteristics by examining the module sample feature genes were analyzed. Notably, in the Cluster 3 state, modules such as MEgrey60 (r=0.34; P=7e-06), MEdarkorange (r=0.31; P=3e-05), MEgreenyellow (r=0.43; P=5e-09), MEdarkolivegreen (r=0.19; P=0.02), and MElightgreen (r=0.19; P=0.02) showed positive correlations (Figure 5F). Consequently, we identified 2878 genes within these five modules as key genes associated with the immune subtype of MM. In order to accurately identify genes related to S100A9 plasma cells, we combined scRNA-seq and Bulk-seq data. By intersecting the genes obtained from WGCNA with those highly expressed in S100A9 plasma cells, we identified 14 genes (FTL, BLVRB, CTSD, FES, PRSS21, IFI6, LYZ, TEX101, S100A8, S100A9, S100A12, CCND2, RNASE6, TCN2) (Figure 5G). In order to better understand the functional differences between the two clusters, we conducted a GSEA. Differential genes were significantly enriched in several immunologically related terms, including Chemokine Signaling Pathway, Cd8 Tcr Pathway, Immunoregulatory Interactions, Natural Killer Cell Mediated Cytotoxicity, T Cell Receptor Signaling Pathway, and Pd-1 Signaling, among others (Figure 5H).
Compare Immune Infiltration and Related Factors in Two Clusters Based on S100A9 Score
Each sample in the TCGA-MMRF dataset had its S100A9 score calculated using the GSVA R package. On the basis of the median score, the samples were divided into two groups: L-S100A9 and H-S100A9. Analysis using the ssGSEA algorithm revealed that the H-S100A9 group exhibited higher levels of immune infiltration compared to the L-S100A9 group (Figure 6A and B). Moreover, we noted substantial up-regulation of critical immune checkpoints (CD96, CSF1R, CTLA4, HAVCR2, IL10, KDR, LGALS9, PDCD1, SNCA) in the H-S100A9 group when comparing the expression of immune checkpoints between the two groups (Figure 6C). Additionally, the H-S100A9 group displayed higher ESTIMATE score, Immune score, Stroma score, and lower tumor purity compared to the L-S100A9 group (Figure 6D–G).
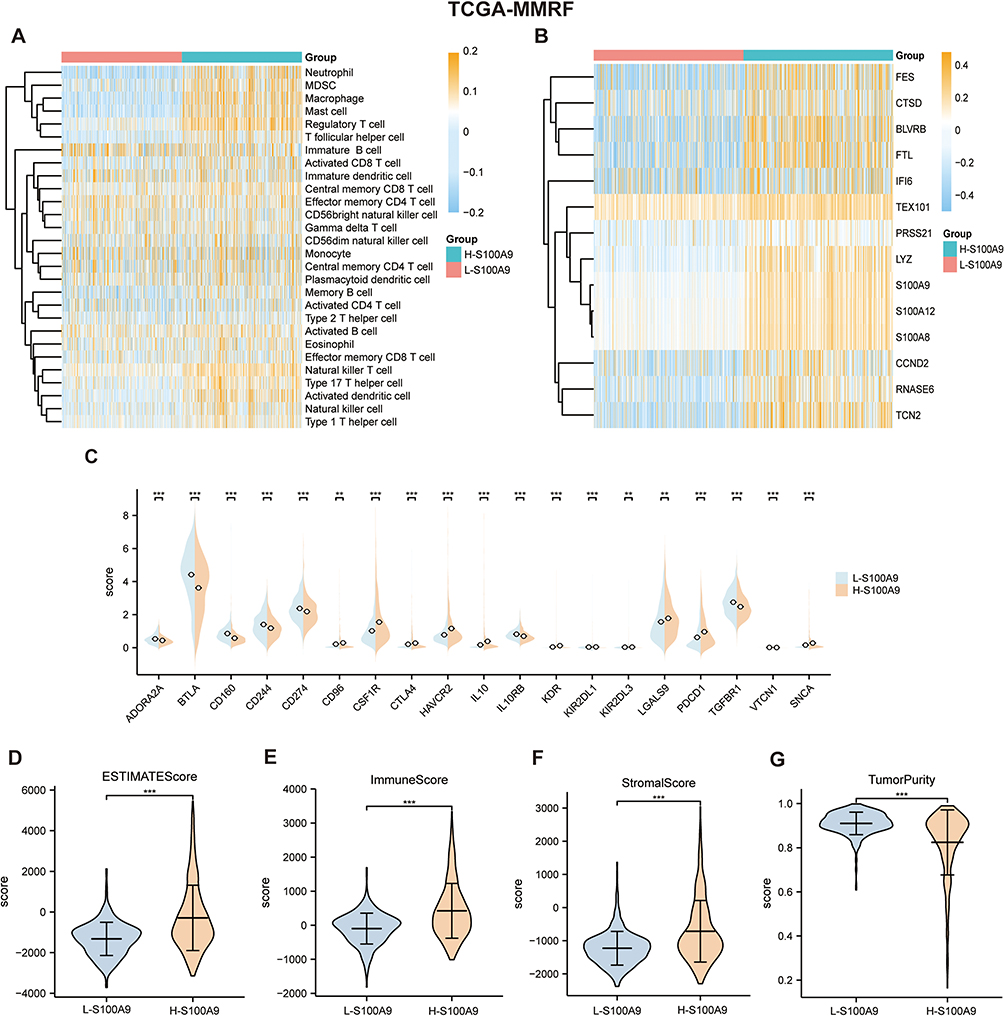 |
Figure 6 Two clusters in the TCGA-MMRF dataset were compared for immune cell infiltration. (A and B) SsGSEA showed that a higher level of immune cell infiltration in H-S100A9 compared to L-S100A9. (C) The expression of immune checkpoint markers between the two groups. (D–G) The comparison chart of ESTIMATE score (D), immune score (E), stromal score (F) and tumor purity score (G) between H-S100A9 group and L-S100A9 group. **P < 0.01, ***P < 0.001. |
The GEO Dataset Validates the Extent of Immune Infiltration Between the Two Clusters
We validated our findings using GSE4581 and GSE2658 datasets to confirm the relationship between S100A9 score and immune infiltration. Using the same approach as in the TCGA-MMRF cohort, we evaluated the S100A9 score in each sample. The H-S100A9 group showed significantly higher levels of immune cell infiltration than the L-S100A9 group in both GSE4581 and GSE2658 datasets (Figures 7A, B, 8A and B). A greater expression of immune checkpoint markers CSF1R, PDCD1, and PDCD1LG2 was observed in GSE4581 for the H-S100A9 group (Figure 7C), while in GSE2658, H-S100A9 was associated with increased expression of immune checkpoint genes CSF1R, PDCD1, PDCD1LG2, and TGFB1 (Figure 8D). Moreover, the H-S100A9 group demonstrated higher ESTIMATE score, immune score, and stroma score and lower tumor purity than the L-S100A9 group in both GSE4581 and GSE2658 (Figures 7D–G, Figure 8E–H). Notably, 1q21 gene copy number variations affected ssGSEA score, with different copy numbers displaying diverse ssGSEA scores (Figure 8C). Overall, consistent with our previous findings from TCGA-MMRF dataset, these results indicate that H-S100A9 group exhibits greater immune infiltration and expression of immune checkpoint markers.
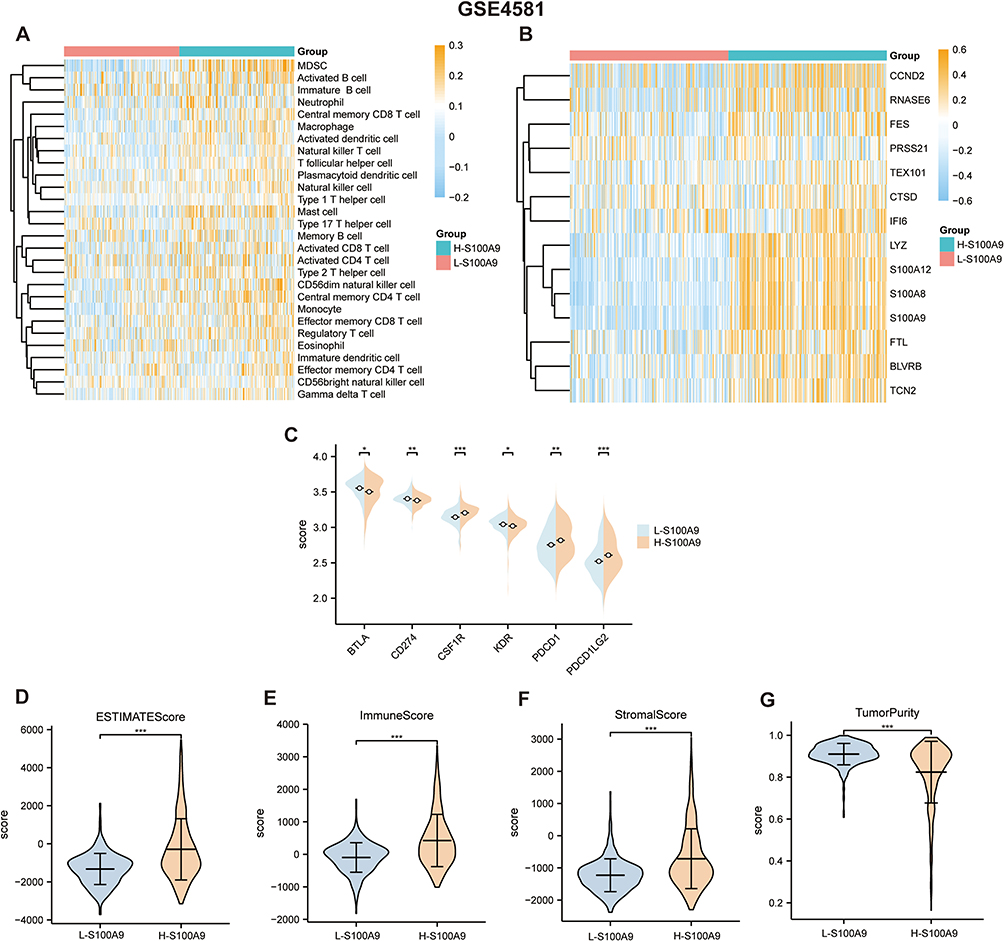 |
Figure 7 GSE4581 dataset confirms the immune infiltration levels between the L-S100A9 group and the H-S100A9 group. (A and B) the heatmap displays higher immune infiltration levels in the H-S100A9 group compared to the L-S100A9 group. (C) the expression of immune checkpoint-related genes in both groups. (D–G) The H-S100A9 group has higher ESTIMATE score, immune score, and stroma score, but lower tumor purity than the L-S100A9 group. *P < 0.05, **P < 0.01, ***P < 0.001. |
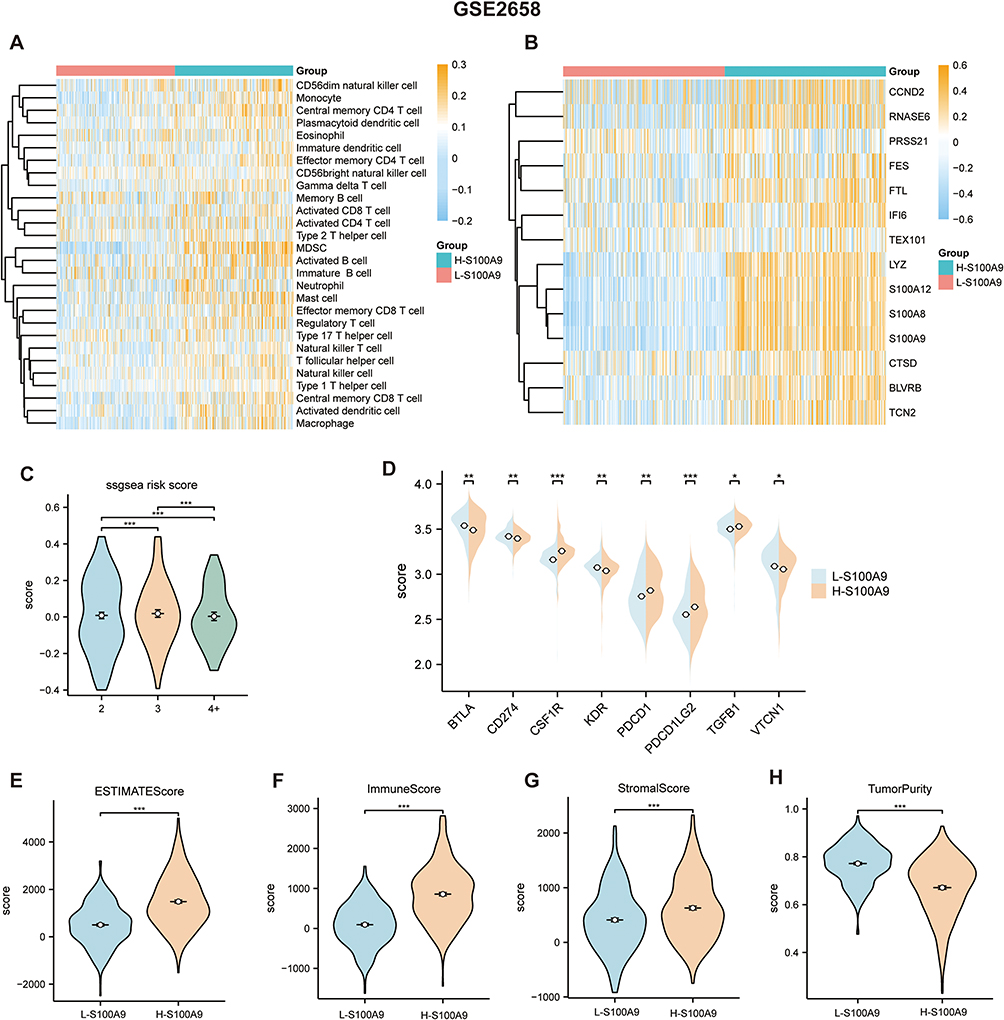 |
Figure 8 In the L-S100A9 and H-S100A9 groups, the GSE2658 dataset confirms the degree of immune infiltration. (A and B) A heatmap indicating the immune infiltration levels calculated by the ssGSEA algorithm. (C) Comparison of risk scores between the 2, 3, and 4 copies groups using the ssGSEA algorithm. (D) The expression of genes related to immune checkpoints in the two groups. (E–H) Compared with L-S100A9 group, H-S100A9 group has higher ESTIMATE score, immune score and stroma score and lower tumor purity. *P < 0.05, **P < 0.01, ***P < 0.001. |
The Relationship Between Immune Infiltration and 1q21 Copy Numbers
Our research found that a sequential decrease in the ESTIMATE score, immune score, and stroma score among cases with 2 copies, 3 copies, and 4+ copies of 1q21. Conversely, there was a sequential increase in tumor purity. Specifically, the 4+ copies group, which exhibited the most aggressive and poor prognosis, showed the lowest ESTIMATE score, immune score, and stroma score (Figure 9A–C). While Figure 9B does not demonstrate statistical significance in the stromal score between different 1q21 copy numbers, it is still evident that the stromal score is higher in cases with 2 copies compared to those with 3 copies and 4+ copies. A similar trend is observed in the stromal score shown in Figure 9C. This phenomenon may be attributed to the smaller number of cases with 4+ copies, as compared to those with 2 and 3 copies. Nevertheless, overall, patients with 4+ copies exhibit lower levels of immune infiltration.
 |
Figure 9 Comparison of immune scores between the 2, 3, and 4+ copies groups using the ESTIMATE algorithm. Immune scores between different copy numbers in the TCGA-MMRF dataset (A), GSE4581 dataset (B), and GSE2658 dataset (C). ns P ≥ 0.05, *P < 0.05, **P < 0.01, ***P < 0.001. |
Drug Sensitivity Analysis
We conducted drug sensitivity analyses on both the high S100A9 (H-S100A9) and low S100A9 (L-S100A9) groups, and presented the results through box plots. Figure 10 demonstrates that the S100A9 score is positively correlated with drug sensitivity for medications including AZD6482, bortezomib, and cisplatin, all of which are used to treat MM. These findings suggest that drug sensitivity may be influenced by the S100A9 score, which could ultimately impact patient prognosis. The H-S100A9 group exhibited lower IC50 values and greater drug sensitivity in comparison to the L-S100A9 group. Therefore, for patients in the H-S100A9 group, utilizing the drugs demonstrated in Figure 10 may lead to more favorable therapeutic outcomes.
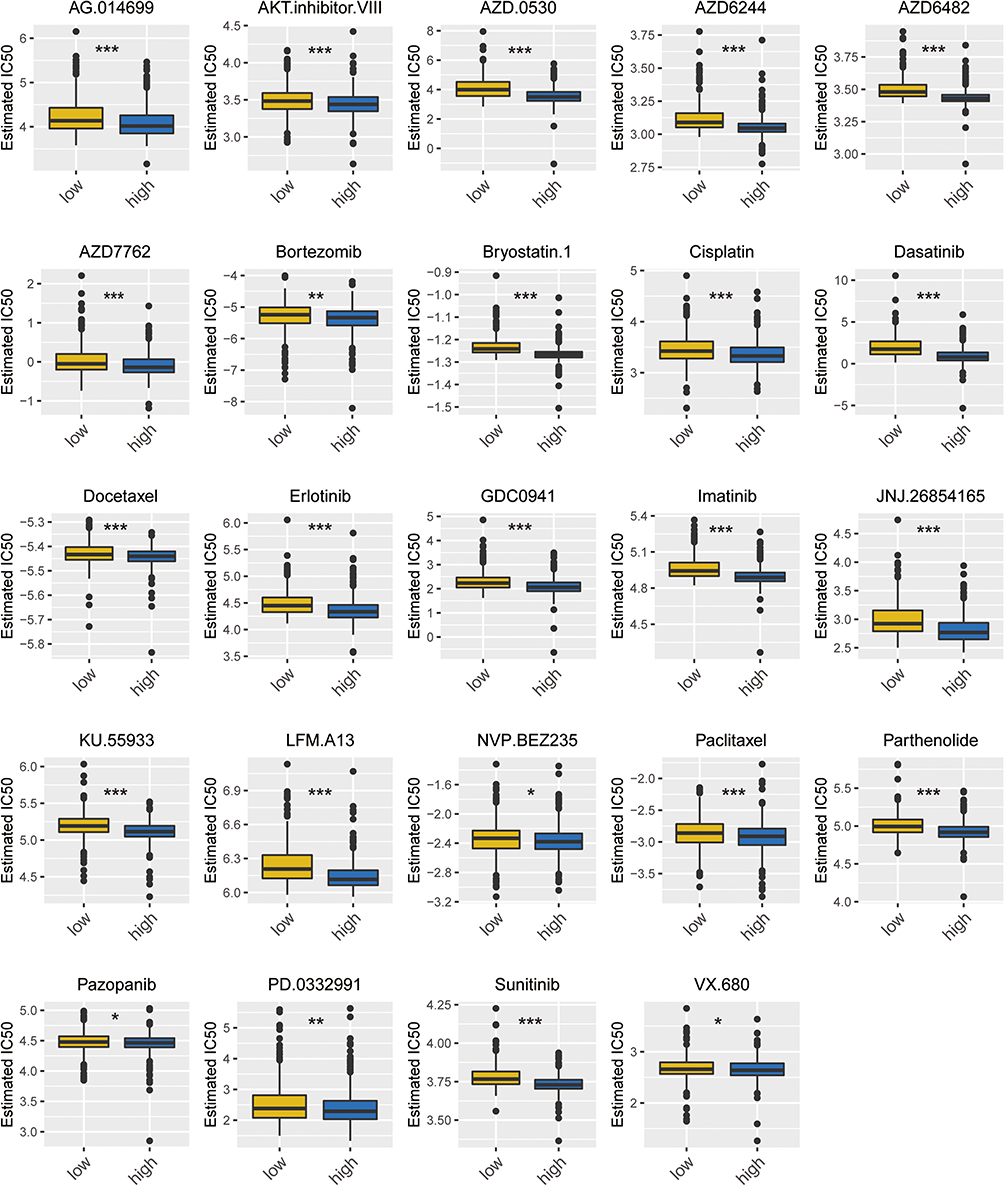 |
Figure 10 Box plot of drug sensitivity in H-S100A9 group and L-S100A9 group. The horizontal axis represents the L-S100A9 and H-S100A9 groups, while the vertical axis denotes the IC50 value of the drug. *P < 0.05, **P < 0.01, ***P < 0.001. |
Verification of Marker Genes
We used the STRING database for protein-protein interaction analysis of 14 immune-related genes (FTL, BLVRB, CTSD, FES, PRSS21, IFI6, LYZ, TEX101, S100A8, S100A9, S100A12, CCND2, RNASE6, TCN2). Subsequently, we constructed a protein-protein interaction network (Figure 11A). Notably, LYZ, S100A8, S100A9, S100A12, RNASE6, and TCN2 emerged as pivotal node proteins. To validate the expression levels of RNASE6, LYZ, S100A8, S100A9, and S100A12 in MM patients, we conducted qRT-PCR. The results depicted in Figure 11B–F demonstrate significantly elevated expression of RNASE6, LYZ, S100A8, S100A9, and S100A12 in MM patients compared to the healthy control group.
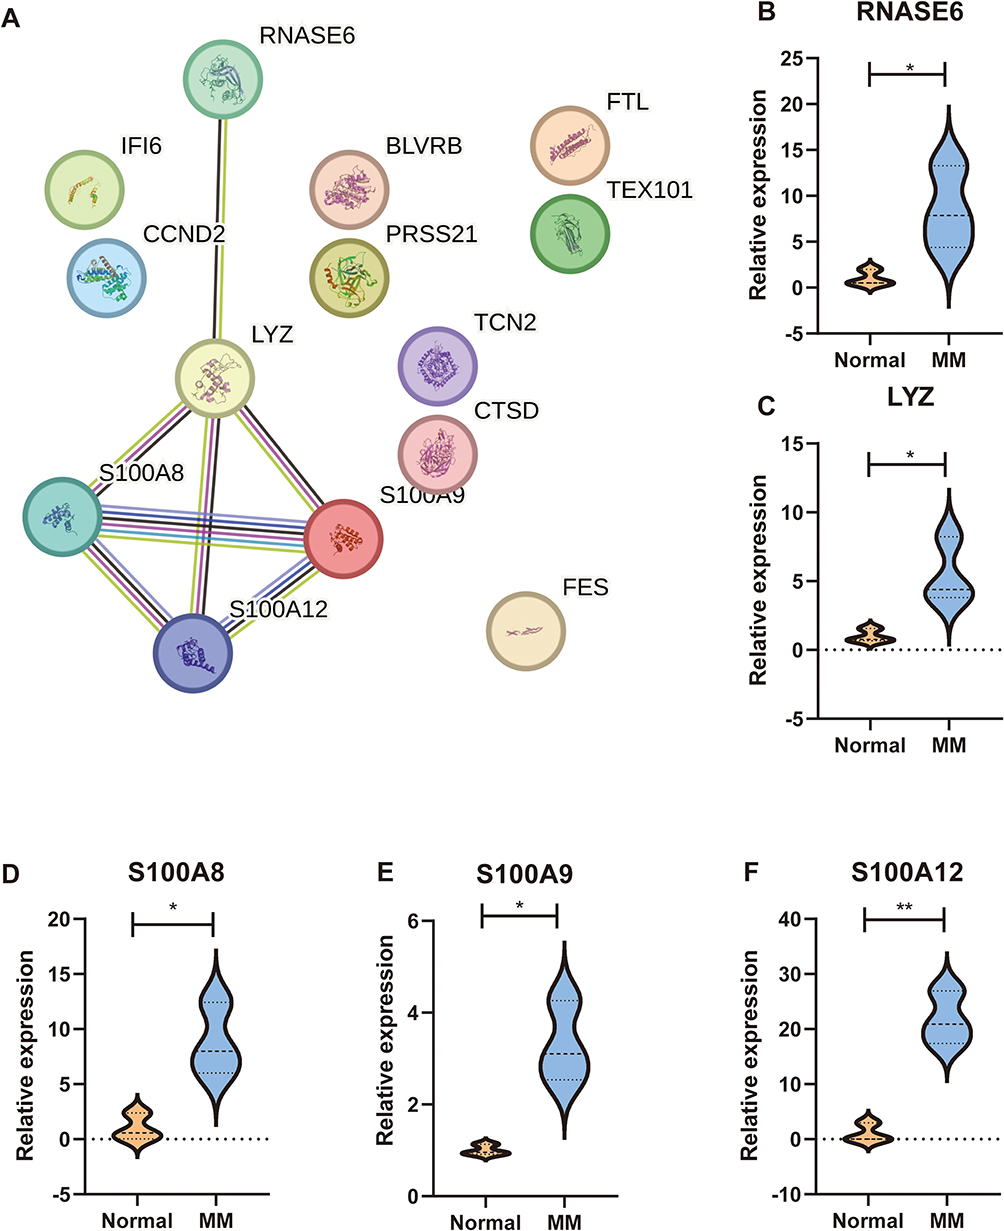 |
Figure 11 Validation of marker genes in clinical samples. (A) Protein-protein network. (B–F) Relative expression of RNASE6, LYZ, S100A8, S100A9, and S100A12 in MM patients. *p < 0.05, **p < 0.01. |
Discussion
In the development of MM, plasma cells play multiple roles. Firstly, abnormal proliferation and accumulation of plasma cells suppress normal hematopoietic cells in the bone marrow, leading to anemia, infection, and bleeding.1 Secondly, M-proteins secreted by plasma cells may cause kidney and organ damage, leading to renal dysfunction and other related clinical issues.36 Additionally, cytokines and regulatory molecules produced by plasma cells can affect the bone marrow microenvironment, suppressing immune responses and promoting tumor cell survival, proliferation, invasion.37 Although abnormal clonal proliferation of plasma cells is a fundamental characteristic of MM, there is still controversy and incomplete understanding regarding the initiation events, maintenance, and transformation of plasma cell clonality. Some studies have suggested the existence of different subclones of plasma cell populations in the development of MM, which may possess distinct characteristics, functions, and impacts on disease progression.38–40 Furthermore, the interaction between plasma cells and the bone marrow microenvironment is an active area of research. Cellular and molecular signals within the bone marrow microenvironment may play a crucial role in the growth and survival of plasma cells in MM. Plasma cells also influence and alter the bone marrow microenvironment by secreting cytokines and regulatory molecules, forming a vicious cycle.18 Single-cell sequencing has enabled the identification of distinct plasma cell subpopulations within the tumor microenvironment, subsequently enhancing our understanding of the relationship between MM and immunotherapy. Through single-cell sequencing, we have identified the S100A9 plasma cell subpopulation. Myeloid-derived S100A9 can produce TNFSF13B through myeloid cells, neutrophils, and macrophages, and the enhanced TNFSF13B signal can activate the NF-κB pathway, thereby promoting plasma cell proliferation.41 Additionally, the S100A8/S100A9 protein produced by bone marrow neutrophils and monocytes regulates myeloma progression by promoting megakaryocyte expansion and angiogenesis.42 However, it remains unclear whether plasma cells with high expression of S100A9 impact tumor immunity. In this study, we integrated scRNA-seq and Bulkseq to analyze the role of S100A9 plasma cells in MM patients. A higher proportion of S100A9 plasma cells were observed in 1q21 gain MM patients and 1q21 diploid MM patients compared to 1q21 negative MM patients. Furthermore, GSEA analysis revealed an association between S100A9 plasma cells and immune response, cell apoptosis, and cell transcription. We employed CellChat to explore cellular communication and signaling pathways involved in S100A9 plasma cells. Our findings indicate that the GAS and HGF signaling pathways exhibit high expression in the main senders, receivers, mediators, and influencers of this signaling pathway.
GAS, growth arrest-specific, impacts the immune status through various mechanisms. The Gas6/Axl signaling pathway regulates immune cell functions and has potential as a therapeutic target in cancer immunotherapy.43 In endometrial cancer, GAS5 enhances the phagocytosis, antigen presentation, and cytotoxic T cell activation of tumor-associated macrophages and endometrial cancer cells by activating the miR-21-PTEN-AKT pathway and inhibiting YAP1.44 In hepatocellular carcinoma, HGF exists in the immune microenvironment, stimulating tumor cell proliferation, migration, invasion, and promoting angiogenesis.45,46 Upon binding with HGF, c-MET becomes active and drives complex biological processes, contributing to the occurrence of various types of cancer.47–49 c-MET expression regulates immune regulatory molecules such as programmed cell death ligand 1 and indoleamine-2,3-dioxygenase in cancer cells.50 HGF has been implicated in the upregulation of programmed cell death ligand 1 mediated by PI3K signaling pathway, which is commonly mutated in head and neck cancer.51 The GAS and HGF signaling pathways represent prominent patterns in S100A9 plasma cells.
Single-cell analysis was employed to identify marker genes for the S100A9 plasma cell population. Transcriptome data were utilized to identify genes associated with immune infiltration in MM patients. The intersection of two gene sets resulted in the identification of 14 marker genes, namely FTL, BLVRB, CTSD, FES, PRSS21, IFI6, LYZ, TEX101, S100A8, S100A9, S100A12, CCND2, RNASE6, and TCN2, which were found to be related to immune infiltration in MM patients. FTL, an iron regulatory protein, regulates iron metabolism, antioxidant response, and inflammatory regulation, thereby affecting the phagocytosis, immune regulation, and antibacterial ability of macrophages.52 BLVRB, also known as biliverdin reductase B, participates in biliverdin metabolism and may contribute to immune regulation by protecting cells from oxidative stress and inflammation.53 CTSD (Cathepsin D) plays a vital role in antigen processing and presentation, suggesting its involvement in adaptive immune responses.54 FES, a tyrosine kinase, is involved in various aspects of immune system function, including limiting immune system activation, regulating hematopoietic cell growth, survival, differentiation, and activating macrophages and mast cells.55–57 PRSS21 encodes testosterone, which is anchored to the cell surface through glycosylphosphatidylinositol (GPI), inducing angiogenesis and regulating microvascular endothelial permeability.58 IFI6, also known as interferon alpha-inducible protein 6, prevents virus-induced ER membrane invasion, impairs viral entry by inhibiting EGFR activation, modulates innate immune responses, and inhibits virus replication.59 LYZ (Lysozyme) is an antibacterial protein present in various human tissues and fluids, capable of directly dissolving bacterial cell walls to exhibit antibacterial activity.60 Moreover, LYZ regulates proinflammatory cytokines and chemokines, thus influencing the overall immune response.61 TEX101 is a glycoprotein that influences the function of urokinase-type plasminogen activator receptor, matrix metalloproteinases, and cathepsin B. These proteins play crucial roles in immune responses and cancer progression.62 S100A8, a key regulator of inflammation and immune response, affects chemotaxis and inflammatory cell activation. It facilitates the aggregation of immune cells at inflammatory sites, intensifying and prolonging the inflammatory response.63 Additionally, S100A8 regulates the expression of complement factor C3, a pivotal component in nuclear-level immune defense, potentially impacting immune responses and inflammatory processes.64 S100A12, a member of the S100 protein family, activates and recruits immune cells, stimulates the production of pro-inflammatory cytokines, and contributes to various inflammatory diseases, such as inflammatory bowel disease, vasculitis, and systemic vasculitis.65,66 CCND2, belonging to the D-type cyclin family, is expressed in immune cells such as T cells, B cells, and macrophages. Upregulation of CCND2 promotes cells entering the G1 phase and initiating DNA replication.64 RNASE6, a key immunoinflammatory gene, potentially contributes to immunoinflammatory damage in the glomerulus.67 TCN2, a type of transcobalamin (TC), primarily binds to vitamin B12 and facilitates its transportation within the body.68 However, the expression level of TCN2 varies in certain inflammatory states, potentially influencing the regulation of the inflammatory response.69
Given the resistance observed in certain patients towards bortezomib treatment, the investigation into combination therapy involving multiple myeloma and immunotherapy has gained significant importance. A study conducted by Lernia et al demonstrated that the combination of bortezomib and hydroxychloroquine with anti-angiogenic drugs effectively suppresses the proliferation of residual tumor PC clones by neutralizing the pro-angiogenic impact of bortezomib, consequently impeding relapse.3 In this study, we utilized the GSVA algorithm to assign scores to patients with MM. Based on these scores, the patients were divided into two groups: H-S100A9 and L-S100A9, using the median score as the cut-off. We performed GSEA analysis to gain insights into the functional disparities between these two groups. The high S100A9 group had a significant impact on immune-related pathways, including the Chemokine Signaling Pathway, Cd8 Tcr Pathway, Immunoregulatory Interactions, Natural Killer Cell Mediated Cytotoxicity, T Cell Receptor Signaling Pathway, and PD-1 Signaling. Then, we utilized the ssGSEA and ESTIMATE algorithms to investigate the potential differences in immune infiltration between MM patients with high and low S100A9 scores. Our findings revealed that the H-S100A9 group exhibited a significantly higher level of immune infiltration, as evidenced by increased ESTIMATE score, immune score, and stroma score, and lower tumor purity. The higher the degree of immune infiltration, the more sensitive it is to immunotherapy. Moreover, the expression of immune checkpoints was examined in both cohorts, revealing that the H-S100A9 group exhibited heightened expression levels of specific immune checkpoints, including CSF1R and PDCD1. These findings potentially hold implications for the investigation and therapeutic targeting of these checkpoints. To validate our results, we applied the GSVA algorithm to score the samples from GSE4851 and GSE4658, enabling us to differentiate between the H-S100A9 and L-S100A9 groups, followed by confirmation using the ssGSEA and ESTIMATE algorithms. The validation outcomes were similar to those obtained previously. Additionally, we explored whether different copy numbers of 1q21 influenced the degree of immune infiltration. Our analysis revealed that an increase in 1q21 copy numbers led to a decrease in ESTIMATE score, immune score, and Stroma score, as well as an increase in tumor purity. Among the various groups, those with 4+ copies exhibited the lowest ESTIMATE score, immune score, and stromal score, indicating the strongest invasiveness and worst prognosis. Previous studies have shown that patients with 1q21 amplification (≥4 copy numbers) had shorter PFS than those with 1q21 gain (3 copy numbers) (median PFS was 24 months vs Not reached, P=0.0403). A difference in OS between these two groups was not considered clinically significant (the median OS was not reached, P=0.2162).8 Our results suggest that changes in 1q21 copy numbers could potentially influence the degree of immune infiltration, and hence, the effectiveness of immunotherapy. Patients with 1q21 amplification (≥4 copy numbers) exhibited lower degrees of immune infiltration than those with 1q21 gain (3 copy numbers) and patients with 2 copy numbers, indicating a possible need for stronger immunotherapy to achieve effectiveness.
Although the analysis of scRNA-seq and bulk-seq has partly revealed that S100A9 plasma cells may be associated with immunotherapy in MM, further in-depth mechanism research is still necessary. However, this study has some limitations that should be considered. Firstly, this is a retrospective study, and future prospective studies should be conducted to avoid potential analytical biases. By designing prospective research, we can obtain more accurate and reliable data of S100A9 plasma cells in immunotherapy. Secondly, in our current research, we have used existing scRNA seq and bulk seq datasets from GEO and TCGA, which may have limitations in sample size and variability. In the future, we will seek collaboration with multiple research institutions and access additional datasets to expand the patient cohort. Thirdly, this study primarily utilizes scRNA-seq and transcriptomic data, proteomic and spatial transcriptomic data should also be explored. These additional dimensions can provide more comprehensive information, helping us better comprehend the function and regulatory mechanisms of S100A9 plasma cells in MM patients. Fourthly, we conducted RT-qPCR on RNASE6, LYZ, S100A8, S100A9, and S100A12 expression in MM patients. In the future, we plan to perform additional experiments, such as Western blotting, flow cytometry, or functional assays to validate the functional significance of key genes in S100A9 plasma cells. Fifthly, due to the lack of information on patient post-treatment status in the immunotherapy queue, it is challenging to compare and predict treatment efficacy after chemotherapy. To more accurately assess the predictive ability of S100A9 plasma cells in immunotherapy, we need to collect detailed information about patients’ post-treatment status and systematically analyze these data.
Conclusion
In patients with MM who have 1q21 gain/diploid, there are a large number of S100A9 plasma cells. We identified 14 genes related to S100A9 plasma cell immunity and calculated S100A9 scores for each patient sample to predict the response to immunotherapy. Compared to the L-S100A9 group, the H-S100A9 group exhibited higher levels of immune infiltration and immune checkpoint gene expression. These findings offer a novel perspective that can aid in advancing our understanding of tumor immunology. Furthermore, these results provide valuable references for designing personalized immunotherapy regimens suitable for S100A9 patients in clinical practice. Based on these findings, we believe that immunotherapy can be directed more precisely towards S100A9 patients, which will lead to the achievement of better efficacy.
Data Sharing Statement
Publicly available datasets (GSE161801, GSE4581, GSE2658 and TCGA-MMRF) were analyzed in this study. These data can be found here: [GEO, https://www.ncbi.nlm.nih.gov/geo/; TCGA, https://portal.gdc.cancer.gov/].
Ethics Approval and Informed Consent
The study was conducted in accordance with the Declaration of Helsinki and approved by the Ethics Committee of the Xiangya Third Hospital. Informed consent was obtained from all subjects involved in the study.
Consent for Publication
Written informed consent has been obtained from the patients to publish this paper.
Author Contributions
All authors made a significant contribution to the work reported, whether that is in the conception, study design, execution, acquisition of data, analysis and interpretation, or in all these areas; took part in drafting, revising or critically reviewing the article; gave final approval of the version to be published; have agreed on the journal to which the article has been submitted; and agree to be accountable for all aspects of the work.
Disclosure
The authors report no conflicts of interest in this work.
References
1. Rajkumar SV. Multiple myeloma: 2022 update on diagnosis, risk stratification, and management. Am J Hematol. 2022;97(8):1086–1107. doi:10.1002/ajh.26590
2. Cowan AJ, Green DJ, Kwok M, et al. Diagnosis and management of multiple myeloma: a review. JAMA. 2022;327(5):464–477. doi:10.1001/jama.2022.0003
3. Di Lernia G, Leone P, Solimando AG, et al. Bortezomib treatment modulates autophagy in multiple myeloma. J Clin Med. 2020;9(2). doi:10.3390/jcm9020552
4. Cohen AD, Raje N, Fowler JA, Mezzi K, Scott EC, Dhodapkar MV. How to train your T cells: overcoming immune dysfunction in multiple myeloma. Clin Cancer Res. 2020;26(7):1541–1554. doi:10.1158/1078-0432.CCR-19-2111
5. Maus MV, Grupp SA, Porter DL, June CH. Antibody-modified T cells: cARs take the front seat for hematologic malignancies. Blood. 2014;123(17):2625–2635. doi:10.1182/blood-2013-11-492231
6. Lipowska-Bhalla G, Gilham DE, Hawkins RE, Rothwell DG. Targeted immunotherapy of cancer with CAR T cells: achievements and challenges. Cancer Immunol Immunother. 2012;61(7):953–962. doi:10.1007/s00262-012-1254-0
7. Han EQ, Li XL, Wang CR, Li TF, Han SY. Chimeric antigen receptor-engineered T cells for cancer immunotherapy: progress and challenges. J Hematol Oncol. 2013;6:47. doi:10.1186/1756-8722-6-47
8. You H, Jin S, Wu C, et al. The independent adverse prognostic significance of 1q21 gain/amplification in newly diagnosed multiple myeloma patients. Front Oncol. 2022;12:938392. doi:10.3389/fonc.2022.938392
9. Griffin GK, Wu J, Iracheta-Vellve A, et al. Epigenetic silencing by SETDB1 suppresses tumour intrinsic immunogenicity. Nature. 2021;595(7866):309–314. doi:10.1038/s41586-021-03520-4
10. Singh SR, Rameshwar P, Siegel P. Targeting tumor microenvironment in cancer therapy. Cancer Lett. 2016;380(1):203–204. doi:10.1016/j.canlet.2016.04.009
11. Gonzalez-Gonzalez L, Alonso J. Periostin: a matricellular protein with multiple functions in cancer development and progression. Front Oncol. 2018;8:225. doi:10.3389/fonc.2018.00225
12. Hinshaw DC, Shevde LA. The tumor microenvironment innately modulates cancer progression. Cancer Res. 2019;79(18):4557–4566. doi:10.1158/0008-5472.CAN-18-3962
13. Bermejo DA, Jackson SW, Gorosito-Serran M, et al. Trypanosoma cruzi trans-sialidase initiates a program independent of the transcription factors RORgammat and Ahr that leads to IL-17 production by activated B cells. Nat Immunol. 2013;14(5):514–522. doi:10.1038/ni.2569
14. Kulkarni U, Karsten CM, Kohler T, et al. IL-10 mediates plasmacytosis-associated immunodeficiency by inhibiting complement-mediated neutrophil migration. J Allergy Clin Immunol. 2016;137(5):1487–1497 e1486. doi:10.1016/j.jaci.2015.10.018
15. Shen P, Roch T, Lampropoulou V, et al. IL-35-producing B cells are critical regulators of immunity during autoimmune and infectious diseases. Nature. 2014;507(7492):366–370. doi:10.1038/nature12979
16. Bullwinkle EM, Parker MD, Bonan NF, Falkenberg LG, Davison SP, DeCicco-Skinner KL. Adipocytes contribute to the growth and progression of multiple myeloma: unraveling obesity related differences in adipocyte signaling. Cancer Lett. 2016;380(1):114–121. doi:10.1016/j.canlet.2016.06.010
17. Caers J, Deleu S, Belaid Z, et al. Neighboring adipocytes participate in the bone marrow microenvironment of multiple myeloma cells. Leukemia. 2007;21(7):1580–1584. doi:10.1038/sj.leu.2404658
18. Garcia-Ortiz A, Rodriguez-Garcia Y, Encinas J, et al. The role of tumor microenvironment in multiple myeloma development and progression. Cancers. 2021;13(2). doi:10.3390/cancers13020217
19. Dutta AK, Alberge JB, Sklavenitis-Pistofidis R, Lightbody ED, Getz G, Ghobrial IM. Single-cell profiling of tumour evolution in multiple myeloma - opportunities for precision medicine. Nat Rev Clin Oncol. 2022;19(4):223–236. doi:10.1038/s41571-021-00593-y
20. Zavidij O, Haradhvala NJ, Mouhieddine TH, et al. Single-cell RNA sequencing reveals compromised immune microenvironment in precursor stages of multiple myeloma. Nat Cancer. 2020;1(5):493–506. doi:10.1038/s43018-020-0053-3
21. Butler A, Hoffman P, Smibert P, Papalexi E, Satija R. Integrating single-cell transcriptomic data across different conditions, technologies, and species. Nat Biotechnol. 2018;36(5):411–420. doi:10.1038/nbt.4096
22. Li W, Yuan P, Liu W, et al. Hypoxia-immune-related gene SLC19A1 serves as a potential biomarker for prognosis in multiple myeloma. Front Immunol. 2022;13:843369. doi:10.3389/fimmu.2022.843369
23. Xiong W, Wu X, Starnes S, et al. An analysis of the clinical and biologic significance of TP53 loss and the identification of potential novel transcriptional targets of TP53 in multiple myeloma. Blood. 2008;112(10):4235–4246. doi:10.1182/blood-2007-10-119123
24. Davis S, Meltzer PS. GEOquery: a bridge between the Gene Expression Omnibus (GEO) and BioConductor. Bioinformatics. 2007;23(14):1846–1847. doi:10.1093/bioinformatics/btm254
25. Jin S, Guerrero-Juarez CF, Zhang L, et al. Inference and analysis of cell-cell communication using CellChat. Nat Commun. 2021;12(1):1088. doi:10.1038/s41467-021-21246-9
26. Charoentong P, Finotello F, Angelova M, et al. Pan-cancer immunogenomic analyses reveal genotype-immunophenotype relationships and predictors of response to checkpoint blockade. Cell Rep. 2017;18(1):248–262. doi:10.1016/j.celrep.2016.12.019
27. Barbie DA, Tamayo P, Boehm JS, et al. Systematic RNA interference reveals that oncogenic KRAS-driven cancers require TBK1. Nature. 2009;462(7269):108–112. doi:10.1038/nature08460
28. Hanzelmann S, Castelo R, Guinney J. GSVA: gene set variation analysis for microarray and RNA-seq data. BMC Bioinf. 2013;14:7. doi:10.1186/1471-2105-14-7
29. Yoshihara K, Shahmoradgoli M, Martinez E, et al. Inferring tumour purity and stromal and immune cell admixture from expression data. Nat Commun. 2013;4:2612. doi:10.1038/ncomms3612
30. Briere G, Darbo E, Thebault P, Uricaru R. Consensus clustering applied to multi-omics disease subtyping. BMC Bioinf. 2021;22(1):361. doi:10.1186/s12859-021-04279-1
31. Wilkerson MD, Hayes DN. ConsensusClusterPlus: a class discovery tool with confidence assessments and item tracking. Bioinformatics. 2010;26(12):1572–1573. doi:10.1093/bioinformatics/btq170
32. Langfelder P, Horvath S. WGCNA: an R package for weighted correlation network analysis. BMC Bioinf. 2008;9:559. doi:10.1186/1471-2105-9-559
33. Liberzon A, Birger C, Thorvaldsdottir H, Ghandi M, Mesirov JP, Tamayo P. The Molecular Signatures Database (MSigDB) hallmark gene set collection. Cell Syst. 2015;1(6):417–425. doi:10.1016/j.cels.2015.12.004
34. Yu G, Wang LG, Han Y, He QY. clusterProfiler: an R package for comparing biological themes among gene clusters. OMICS. 2012;16(5):284–287. doi:10.1089/omi.2011.0118
35. Geeleher P, Cox N, Huang RS. pRRophetic: an R package for prediction of clinical chemotherapeutic response from tumor gene expression levels. PLoS One. 2014;9(9):e107468. doi:10.1371/journal.pone.0107468
36. Kyle RA, Rajkumar SV. Treatment of multiple myeloma: a comprehensive review. Clin Lymphoma Myeloma. 2009;9(4):278–288. doi:10.3816/CLM.2009.n.056
37. Chu VT, Berek C. The establishment of the plasma cell survival niche in the bone marrow. Immunol Rev. 2013;251(1):177–188. doi:10.1111/imr.12011
38. Lannes R, Samur M, Perrot A, et al. In multiple myeloma, high-risk secondary genetic events observed at relapse are present from diagnosis in tiny, undetectable subclonal populations. J Clin Oncol. 2023;41(9):1695–1702. doi:10.1200/JCO.21.01987
39. Ziccheddu B, Biancon G, Bagnoli F, et al. Integrative analysis of the genomic and transcriptomic landscape of double-refractory multiple myeloma. Blood Adv. 2020;4(5):830–844. doi:10.1182/bloodadvances.2019000779
40. Dutta AK, Fink JL, Grady JP, et al. Subclonal evolution in disease progression from MGUS/SMM to multiple myeloma is characterised by clonal stability. Leukemia. 2019;33(2):457–468. doi:10.1038/s41375-018-0206-x
41. Meng L, Tang Q, Zhao J, et al. S100A9 derived from myeloma associated myeloid cells promotes TNFSF13B/TNFRSF13B-dependent proliferation and survival of myeloma cells. Front Oncol. 2021;11:691705. doi:10.3389/fonc.2021.691705
42. Lin C, Garcia-Gerique L, Bonner EE, et al. S100A8/S100A9 promote progression of multiple myeloma via expansion of megakaryocytes. Cancer Res Commun. 2023;3(3):420–430. doi:10.1158/2767-9764.CRC-22-0368
43. Tanaka M, Siemann DW. Gas6/Axl signaling pathway in the tumor immune microenvironment. Cancers. 2020;12(7). doi:10.3390/cancers12071850
44. Tu J, Tan X, Chen Y, et al. Growth arrest-specific transcript 5 represses endometrial cancer development by promoting antitumor function of tumor-associated macrophages. Cancer Sci. 2022;113(8):2496–2512. doi:10.1111/cas.15390
45. Bozkaya G, Korhan P, Cokakli M, et al. Cooperative interaction of MUC1 with the HGF/c-Met pathway during hepatocarcinogenesis. Mol Cancer. 2012;11:64. doi:10.1186/1476-4598-11-64
46. Menard L, Parker PJ, Kermorgant S. Receptor tyrosine kinase c-Met controls the cytoskeleton from different endosomes via different pathways. Nat Commun. 2014;5:3907. doi:10.1038/ncomms4907
47. Szturz P, Raymond E, Abitbol C, Albert S, de Gramont A, Faivre S. Understanding c-MET signalling in squamous cell carcinoma of the head & neck. Crit Rev Oncol Hematol. 2017;111:39–51. doi:10.1016/j.critrevonc.2017.01.004
48. International Cancer Genome Consortium PedBrain Tumor P. Recurrent MET fusion genes represent a drug target in pediatric glioblastoma. Nat Med. 2016;22(11):1314–1320. doi:10.1038/nm.4204
49. Kim B, Jung N, Lee S, Sohng JK, Jung HJ. Apigenin inhibits cancer stem cell-like phenotypes in human glioblastoma cells via suppression of c-Met signaling. Phytother Res. 2016;30(11):1833–1840. doi:10.1002/ptr.5689
50. Sangro B, Sarobe P, Hervas-Stubbs S, Melero I. Advances in immunotherapy for hepatocellular carcinoma. Nat Rev Gastroenterol Hepatol. 2021;18(8):525–543. doi:10.1038/s41575-021-00438-0
51. Raj S, Kesari KK, Kumar A, et al. Molecular mechanism(s) of regulation(s) of c-MET/HGF signaling in head and neck cancer. Mol Cancer. 2022;21(1):31. doi:10.1186/s12943-022-01503-1
52. Aloe CA, Leong TL, Wimaleswaran H, et al. Excess iron promotes emergence of foamy macrophages that overexpress ferritin in the lungs of silicosis patients. Respirology. 2022;27(6):427–436. doi:10.1111/resp.14230
53. Baranano DE, Rao M, Ferris CD, Snyder SH. Biliverdin reductase: a major physiologic cytoprotectant. Proc Natl Acad Sci U S A. 2002;99(25):16093–16098. doi:10.1073/pnas.252626999
54. Conus S, Simon HU. Cathepsins and their involvement in immune responses. Swiss Med Wkly. 2010;140:w13042. doi:10.4414/smw.2010.13042
55. Laight BJ, Jawa NA, Tyryshkin K, Maslove DM, Boyd JG, Greer PA. Establishing the role of the FES tyrosine kinase in the pathogenesis, pathophysiology, and severity of sepsis and its outcomes. Front Immunol. 2023;14:1145826. doi:10.3389/fimmu.2023.1145826
56. Weir MC, Hellwig S, Tan L, Liu Y, Gray NS, Smithgall TE. Dual inhibition of Fes and Flt3 tyrosine kinases potently inhibits Flt3-ITD+ AML cell growth. PLoS One. 2017;12(7):e0181178. doi:10.1371/journal.pone.0181178
57. Craig AW. FES/FER kinase signaling in hematopoietic cells and leukemias. Front Biosci. 2012;17(3):861–875. doi:10.2741/3961
58. Peroutka RJ, Buzza MS, Mukhopadhyay S, Johnson TA, Driesbaugh KH, Antalis TM. Testisin/Prss21 deficiency causes increased vascular permeability and a hemorrhagic phenotype during luteal angiogenesis. PLoS One. 2020;15(6):e0234407. doi:10.1371/journal.pone.0234407
59. Richardson RB, Ohlson MB, Eitson JL, et al. A CRISPR screen identifies IFI6 as an ER-resident interferon effector that blocks flavivirus replication. Nat Microbiol. 2018;3(11):1214–1223. doi:10.1038/s41564-018-0244-1
60. Brott AS, Clarke AJ. Peptidoglycan O-acetylation as a virulence factor: its effect on lysozyme in the innate immune system. Antibiotics. 2019;8(3). doi:10.3390/antibiotics8030094
61. Ragland SA, Criss AK. From bacterial killing to immune modulation: recent insights into the functions of lysozyme. PLoS Pathog. 2017;13(9):e1006512. doi:10.1371/journal.ppat.1006512
62. Shen CC, Kang YH, Yu L, et al. Human testis-expressed sequence 101 is limitedly distributed in germinal epithelium of testis and disappears in seminoma. Biol Res. 2014;47(1):52. doi:10.1186/0717-6287-47-52
63. van Lent PL, Grevers L, Blom AB, et al. Myeloid-related proteins S100A8/S100A9 regulate joint inflammation and cartilage destruction during antigen-induced arthritis. Ann Rheum Dis. 2008;67(12):1750–1758. doi:10.1136/ard.2007.077800
64. Schonthaler HB, Guinea-Viniegra J, Wculek SK, et al. S100A8-S100A9 protein complex mediates psoriasis by regulating the expression of complement factor C3. Immunity. 2013;39(6):1171–1181. doi:10.1016/j.immuni.2013.11.011
65. Brown KL, Lubieniecka JM, Armaroli G, et al. S100A12 serum levels and PMN counts are elevated in childhood systemic vasculitides especially involving proteinase 3 specific anti-neutrophil cytoplasmic antibodies. Front Pediatr. 2018;6:341. doi:10.3389/fped.2018.00341
66. Foell D, Kucharzik T, Kraft M, et al. Neutrophil derived human S100A12 (EN-RAGE) is strongly expressed during chronic active inflammatory bowel disease. Gut. 2003;52(6):847–853. doi:10.1136/gut.52.6.847
67. Li T, Wang Y, Zhu C, Yang Y, Long C, Chen Q. Identification of Ribonuclease 6 as an immunoinflammatory key gene associated with the glomerular injury in diabetic nephropathy. Sci Rep. 2022;12(1):19709. doi:10.1038/s41598-022-24289-0
68. Mitchell ES, Conus N, Kaput J. B vitamin polymorphisms and behavior: evidence of associations with neurodevelopment, depression, schizophrenia, bipolar disorder and cognitive decline. Neurosci Biobehav Rev. 2014;47:307–320. doi:10.1016/j.neubiorev.2014.08.006
69. Zhang K, Xu P, Sowers JL, et al. Proteome analysis of hypoxic glioblastoma cells reveals sequential metabolic adaptation of one-carbon metabolic pathways. Mol Cell Proteomics. 2017;16(11):1906–1921. doi:10.1074/mcp.RA117.000154
 © 2024 The Author(s). This work is published and licensed by Dove Medical Press Limited. The
full terms of this license are available at https://www.dovepress.com/terms
and incorporate the Creative Commons Attribution
- Non Commercial (unported, 3.0) License.
By accessing the work you hereby accept the Terms. Non-commercial uses of the work are permitted
without any further permission from Dove Medical Press Limited, provided the work is properly
attributed. For permission for commercial use of this work, please see paragraphs 4.2 and 5 of our Terms.
© 2024 The Author(s). This work is published and licensed by Dove Medical Press Limited. The
full terms of this license are available at https://www.dovepress.com/terms
and incorporate the Creative Commons Attribution
- Non Commercial (unported, 3.0) License.
By accessing the work you hereby accept the Terms. Non-commercial uses of the work are permitted
without any further permission from Dove Medical Press Limited, provided the work is properly
attributed. For permission for commercial use of this work, please see paragraphs 4.2 and 5 of our Terms.