Back to Journals » Journal of Inflammation Research » Volume 16
Screening of Potential Circulating Diagnostic Biomarkers and Molecular Mechanisms of Systemic Lupus Erythematosus-Related Myocardial Infarction by Integrative Analysis
Authors Ding H, Zhu G, Lin H, Chu J ![]() , Yuan D, Yao Y, Gao Y, Chen F, Liu X
, Yuan D, Yao Y, Gao Y, Chen F, Liu X
Received 6 March 2023
Accepted for publication 26 June 2023
Published 24 July 2023 Volume 2023:16 Pages 3119—3134
DOI https://doi.org/10.2147/JIR.S404066
Checked for plagiarism Yes
Review by Single anonymous peer review
Peer reviewer comments 2
Editor who approved publication: Dr Tara Strutt
Haoran Ding,* Guoqi Zhu,* Hao Lin, Jiapeng Chu, Deqiang Yuan, Yi’an Yao, Yanhua Gao, Fei Chen, Xuebo Liu
Department of Cardiology, Tongji Hospital, Tongji University School of Medicine, Shanghai, People’s Republic of China
*These authors contributed equally to this work
Correspondence: Fei Chen; Xuebo Liu, Email [email protected]; [email protected]
Background: The risk of acute myocardial infarction (AMI) is elevated in patients with systemic lupus erythematosus (SLE), and it is of great clinical value to identify potential molecular mechanisms and diagnostic markers of AMI associated with SLE by analyzing public database data and transcriptome sequencing data.
Methods: AMI and SLE-related sequencing datasets GSE62646, GSE60993, GSE50772 and GSE81622 were downloaded from the Gene Expression Omnibus (GEO) database and divided into prediction and validation cohorts. To identify the key genes associated with AMI related to SLE, WGCNA and DEGs analysis were performed for the prediction and validation cohorts, respectively. The related signaling pathways were identified by GO/KEGG enrichment analysis. Peripheral blood mononuclear cells (PBMCs) from patients with AMI were collected for transcriptome sequencing to validate the expression of key genes in patients with AMI. Least absolute shrinkage and selection operator (LASSO) regression analysis was applied to screen diagnostic biomarkers. The diagnostic efficacy of biomarkers was validated by ROC analysis, and the CIBERSORTx platform was used to analyze the composition of immune cells in AMI and SLE.
Results: A total of 108 genes closely related to AMI and SLE were identified in the prediction cohort, and GO/KEGG analysis showed significantly enriched signaling pathways. The results of differential analysis in validation cohort were consistent with them. By transcriptional sequencing of PBMCs from peripheral blood of AMI patients, combined with the results of prediction and validation cohort analysis, seven genes were finally screened out. LASSO analysis finally identifies DYSF, LRG1 and CSF3R as diagnostic biomarkers of SLE-related-AMI. CIBERSORTx analysis revealed that the biomarkers were highly correlated with neutrophils.
Conclusion: Neutrophil degranulation and NETs formation play important roles in SLE-related AMI, and DYSF, LRG1 and CSF3R were identified as important diagnostic markers for the development and progression of SLE-related AMI.
Keywords: myocardial infarction, systemic lupus erythematosus, WGCNA, DEGs, RNA-seq, neutrophil
Introduction
Acute myocardial infarction (AMI) is a serious cardiovascular disease, principally caused by acute coronary artery occlusion, leading to myocardial ischemia.1 AMI occurs primarily in patients with coronary artery disease (CAD) and may lead to heart failure, cardiac arrest, and death if not treated promptly.1,2 Classical risk factors related to AMI include genetics, hypertension, dyslipidemia, diabetes, smoking and obesity. In addition, the concurrence of immune system diseases may increase the risk of subsequent incidence and mortality of AMI.3
Systemic lupus erythematosus (SLE) is characterized by the excessive production of autoantibodies and immune-complex deposition that can affect multiple organs including the heart, blood vessels, brain, lungs, and others.4 Studies have shown that approximately 50% of patients with SLE can have comorbid cardiovascular disease, including myocardial infarction (MI), endocarditis, valvular disease, pericarditis, and myocarditis.5,6 Cardiovascular disease is the leading cause of premature mortality in patients with SLE, with ischaemic heart disease standing out as the major contributor.6–8 SLE patients have a twofold to fivefold higher risk of AMI than gender- and age-matched controls, and the figure has been demonstrated to be higher in younger age groups.9–11 Patients with SLE who develop AMI are difficult to achieve clinical remission and have a high mortality rate.12 At present, there are few studies on SLE complicated with myocardial infarction, and it is of great clinical significance to enhance early recognition and effective treatment. It is of great significance to predict and assess the occurrence of AMI in SLE patients and intervene it.
With the development of bioinformatics tools, gene chip technology and sequencing technology can quickly detect the expression patterns of tens of thousands of genes in diseases, which is helpful in understanding the pathogenic of diseases from the gene level.13–15 Previous studies have found that diagnostic markers in circulating peripheral blood mononuclear cells (PBMCs) of SLE and AMI through sequencing technology and bioinformatics.13–15
Then, obtaining genome-wide microarray datasets of AMI and SLE samples from public databases to identify hub genes for SLE associated AMI is an effective way to screen genes closely related to disease and signaling pathways. We took this analysis approach in this paper and verified the obtained results with our own sequencing data, which makes the results of our analysis more credible. This is of great significance for revealing diagnostic markers of AMI related to SLE.
Materials and Method
Microarray Datasets
We screened the sequencing datasets related to AMI and SLE in the Gene Expression Omnibus (GEO) database, GSE62646, GSE60993, GSE50772 and GSE81622 were selected for analysis and were divided into discovery and validation cohort (Table 1). GSE62646 contains sequencing data of circulating PBMCs from 14 patients with stable coronary artery disease (CAD) and 28 patients with ST-segment elevation myocardial infarction (STEMI).16 The dataset GSE60993 contains expression profiles from peripheral blood of ACS patients presenting to the emergency department within 4 hours of chest pain onset, including AMI patients (n = 17), unstable angina (UA) patients (n = 9), and normal controls (n = 9).17 The expression profiles of PBMCs in peripheral blood of SLE patients and healthy control groups were included in GSE50772 and GSE81622 datasets, GSE50772 contains 61 SLE and 20 control groups,18 while GSE81622 contains 25 control groups and 30 SLE patients.19 GSE60993 and GSE81622 were divided into a discovery cohort for weighted gene co expression network analysis (WGCNA), GSE62646 and GSE50772 were paired as a validation cohort, and differentially expressed genes (DEGs) analysis was performed.
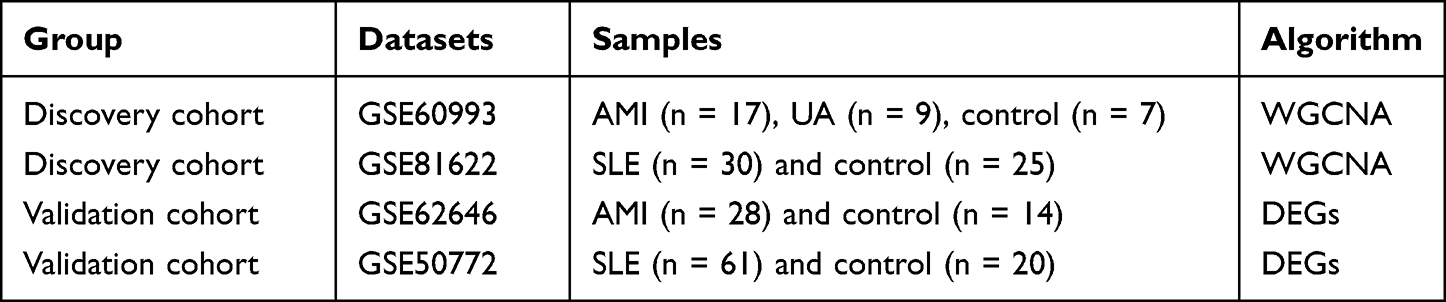 |
Table 1 Datasets Grouping Information |
Construction of Weighted Gene Co-Expression Network
WGCNA is an effective method to detect gene co-expression networks and gene modules correlated with clinical traits from the gene expression profiles of all individuals simultaneously by hierarchical clustering.20 The “WGCNA” package in Weighted gene co-expression network was constructed in R.4.0.1 software, and the gene modules closely related to AMI and SLE in GSE60993 and GSE81622 were identified.20 Clustering analysis was performed using the “hclust” function in R.4.0.1 software to exclude outlier samples. Appropriate soft thresholds were calculated using the “picksoftthreshold” function from the “WGCNA” package in R.4.0.1 software to create a scale-free distribution topology matrix and to further compute gene modules strongly associated with clinical features. Modules highly associated with AMI and SLE were selected for subsequent analysis.
GO/KEGG Enrichment Analysis
We intersected the AMI associated module in GSE60993 and the SLE associated modules in GSE81622, and the obtained intersection genes were designated as “discovery gene set” (DGS). The Metascape database, a functional online analysis database that aggregates relevant features from more than 40 independent databases, was used to perform GO/KEGG enrichment analysis.21 Genes in DGS were imported into the Metascape database for GO/KEGG enrichment analysis to explore the potential roles of these genes in AMI and SLE.
Screening of DEGs
Differential gene expression for GSE62646 and GSE50772 was calculated using GEO2R online tool, genes with a |log2 (Fold Change) | >0.5 and p < 0.05 were selected as differential genes.22 The differential genes obtained in the two datasets were intersected and named “validation gene set” (VGS), and the genes in VGS were imported into the Metascape database for GO/KEGG enrichment analysis.
PBMCs from AMI Patients Were Collected for Sequencing Analysis
Twenty patients who underwent coronary angiography (CAG) at Tongji Hospital, Tongji University between March and June 2021 were included in this study, including 10 AMI patients within 6 h of chest pain onset who underwent percutaneous coronary intervention (PCI) and 10 patients who underwent CAG but without MI. Before PCI, all patients received were treated with a loading dose of aspirin (300 mg) and ticagrelor (180mg), collection of whole blood samples was performed before the use of heparin or contrast medium. After completion of diagnostic CAG, the culprit lesions were identified on the basis of electrocardiogram, echocardiography and CAG findings.
PBMCs were isolated from whole blood samples within two hours of collection using Ficoll Paque PREMIUM (Cytiva) according to the instructions, the MagNA Pure Compact system (Roche Diagnostics GmbH) was used to isolated total RNA from PBMCs. According to the user manual, the VAHTS Total RNA-Seq (H/M/R) Library PrepKit for Illumina was used for gene expression library construction. Sequencing was performed on the Illumina Hiseq 2500 platform. The RNA expression matrix was imported into R.4.0.1 software and the raw expression data were normalized using CPM function in “edgeR” package. DEGs between AMI patients and controls were analysed by the “limma” package,23 genes with |log2 (Fold Change) | >0.5 and p < 0.05 were selected as DEGs. The identified DEGs were imported into the “Hiplot” (https://hiplot.com.cn) online tool to draw a volcano plot.
Identification of Hub Genes
To verify whether the screened genes were significantly differentially expressed in the peripheral blood of AMI patients, we detected the expression of the intersection genes of VGS and DGS in the sequencing results, genes with differential expression between AMI patients and controls were identified as hub genes. LASSO regression analysis was used for further screening of the hub genes. R packages “glmnet” were used to run LASSO regression analysis.24
Receiver Operating Characteristic (ROC) Analysis
To evaluate the ability of genes to discriminate AMI or SLE patients from controls, the “pROC” and “ggplot2” packages in R.4.0.1 software were used to calculate the area under the curve (AUC) and plot the ROC curve.25,26 We selected datasets GSE62646 and GSE50772 with larger sample sizes for ROC analysis. According to previous studies, 0.7 ≤ AUC < 0.8 represented acceptable diagnostic ability, 0.8 ≤ AUC < 0.9 implied good diagnostic ability, and AUC ≥ 0.9 indicated excellent evaluation efficacy.27
Immune Cell Analysis
Based on gene expression data, the online analysis tool CIBERSORTx (https://cibersortx.stanford.edu/) can estimate the immune-cell proportions in the mixed cell population.28 The LM22 gene file contains 547 genes, provided by CIBERSORTx was used to distinguishes the relative proportions of the 22 types of immune cell subtypes in the gene expression data. The expression matrix data for GSE62646 and GSE81622 were imported into CIBERSORTx for analysis, visualization of the results were performed using the “ggplot2” package in R.4.0.1 software.26 The “correlation” function and “ggplot2” packages in R software were used to analyze the correlation coefficient between hub genes and immune cells.
Construction of miRNAs-Target Genes Network
MicroRNAs (miRNAs) are small non-coding RNAs that can suppress gene expression by promoting mRNA degradation or inhibiting mRNA translation, and can also contribute to gene transcription unconventionally by targeting enhancers.29,30 Therefore, miRNAs may play an important role in SLE-related AMI by regulating hub genes. The human microRNA disease database (HMDD) contains 35,547 miRNA disease association data collected manually, including 1206 miRNA genes and 893 diseases in 19,280 papers. ENCORI and miRTarBase are miRNA target interaction database containing millions of miRNA-mRNA interaction relationships identified from multi-dimensional sequencing data.31,32 SLE-related and AMI-related miRNAs were screened from the HMDD database and intersected. The target genes of the overlapped miRNAs, screened from miRTarBase and ENCORI, and hub genes were imported into Cytoscape software for construction of miRNA-mRNA regulatory network.
Summary of the Method
In this study, the whole-genome microarray datasets of AMI and SLE samples were obtained from public database to identify hub genes of SLE-related AMI, and the PBMCs were collected from AMI patients for sequencing to screen hub genes. Based on the hub genes, the least absolute shrinkage and selection operator (LASSO) regression analysis was used to identify diagnostic biomarkers of SLE-related AMI. The CIBERSORTx platform was used to analyze the correlation between diagnostic markers and compositional changes of immune cell. Additionally, a miRNA mRNA network was constructed to improve our understanding of the underlying pathogenesis of SLE-related AMI.
Results
Discovery Cohort: Gene Modules Associated with SLE and AMI
To identify key genes that likely play important roles in SLE and AMI, we performed WGCNA analysis in the discovery cohort. For GSE60993, we selected appropriate soft threshold powers (β = 14) and created TOM matrices (Supplementary Figures 1A and B). Then, modules of genes associated with clinical traits were detected based on the TOM matrices. Four modules “turquoise”, “red”, “pink” and “magenta” were closely associated with AMI (Figure 1A). The turquoise module showed a significant positive correlation with AMI and negatively associated with controls, the magenta module showed a significant positive correlation with AMI and negative correlation with UA. For the analyses of GSE81622, the soft-threshold power β = 18 were selected for creating TOM matrices (Supplementary Figure 1C and D). In GSE81622, three modules (“yellow”, “magenta” and “greenyellow”) showed high association with SLE and blue module is significantly negatively associated with SLE (Figure 1B). A total of 108 intersection genes were identified in modules positively related with SLE and AMI, which was defined as DGS (Figure 2A).
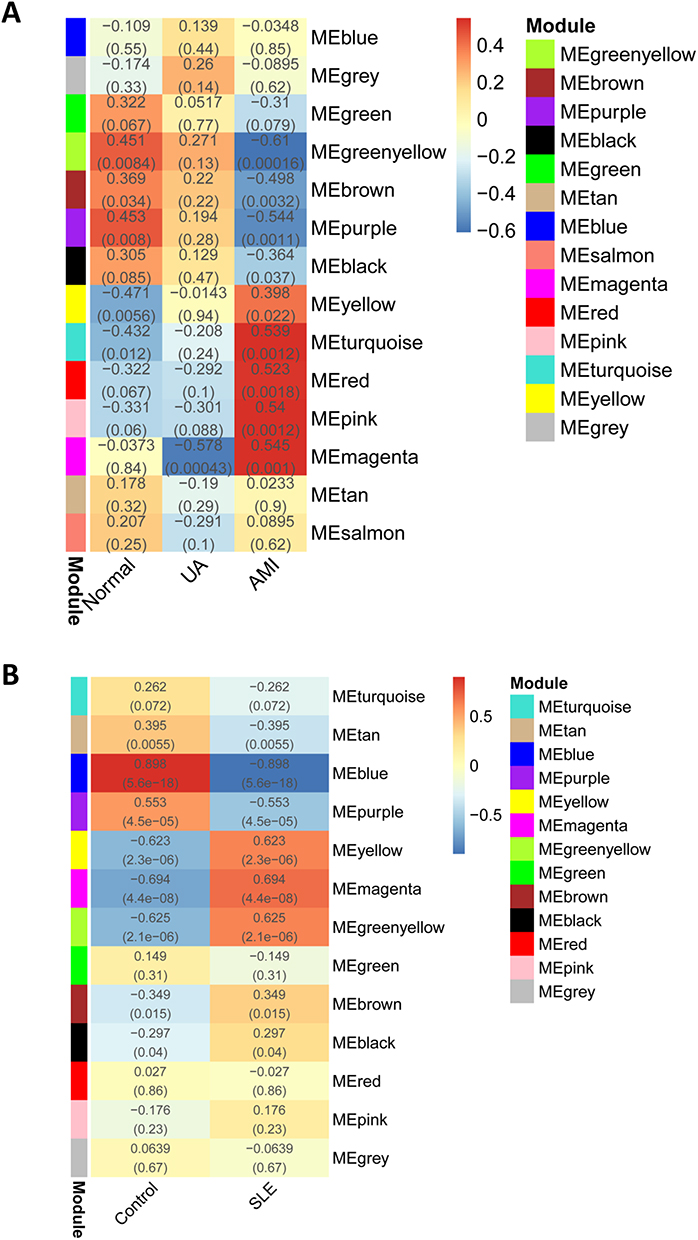 |
Figure 1 Weighted gene co-expression network analysis (WGCNA). (A) Relationship between co-expression gene modules and AMI in GSE60993. Each small lattice contains its corresponding correlation value and p-value. (B) Relationship between co-expression gene modules and SLE in GSE81622. Abbreviations: AMI, acute myocardial infarction; SLE, systemic lupus erythematosus. |
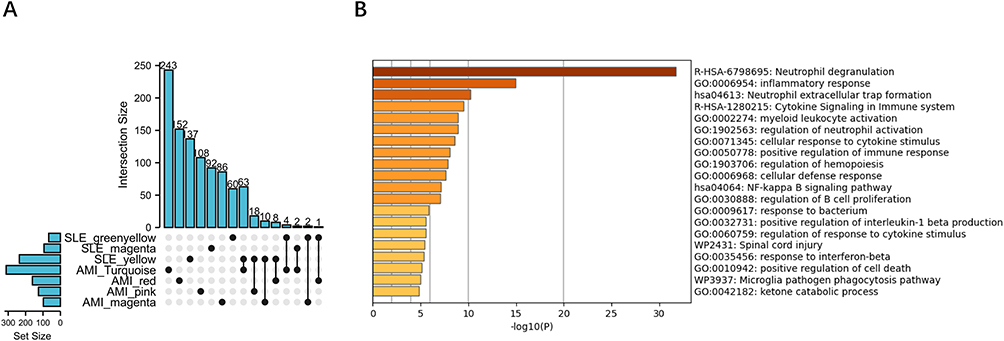 |
Figure 2 Identification of common expressed genes and pathway analysis. (A) The shared genes between the AMI-related modules in GSE60993 and the modules associated with SLE in GSE81622. (B) Signaling pathways significantly enriched in the common expressed genes. Abbreviations: AMI, acute myocardial infarction; SLE, systemic lupus erythematosus. |
Functional Enrichment Analysis of DGS
To explore the signaling pathways and potential biological functions associated with DGS, we performed GO/KEGG enrichment analysis with Metascape database. As shown in Figure 2B, the most significantly enriched signaling pathway was “neutrophil degranulation”, suggesting that this pathway plays an important role in both AMI and SLE. In addition, there was significant enrichment for “inflammatory response”, “neutrophil extracellular traps (NETs) formation”, and other immune-response-related signaling pathways (“cytokine signaling in immune system”, “myeloid leukocyte activation” and “regulation of neutrophil activation”).
The Differential Genes Analysis for Validation Cohort
In validation cohort, DEG screens were used to identify genes associated with AMI and SLE, and to validate the results in the discovery cohort. The DEGs analysis results were visualized using volcano plots (Figure 3). As shown in the UMAP diagram, STEMI and CAD samples are distributed on the left and right, respectively, which indicates that there is a great difference between the two groups (Supplementary Figure 2A). A total of 499 DEGs were identified from CAD samples based on the gene expression of STEMI group in dataset GSE62646 (Figure 3A). For GSE50772, UMP analysis demonstrated a significant discrimination between SLE and control samples (Supplementary Figure 2B). Based on the control group, 3071 DEGs were identified from SLE samples (Figure 3B). Among these DEGs, 107 overlapped genes were identified in both GSE62646 and GSE50772, which were defined as VGS (Figure 3C). The results of the functional enrichment analysis were highly consistent with DGS, with significant enrichment of “neutrophil degranulation” and “inflammatory response” pathways (Figure 3D). The intersection genes of VGS and DGS were identified as hub genes.
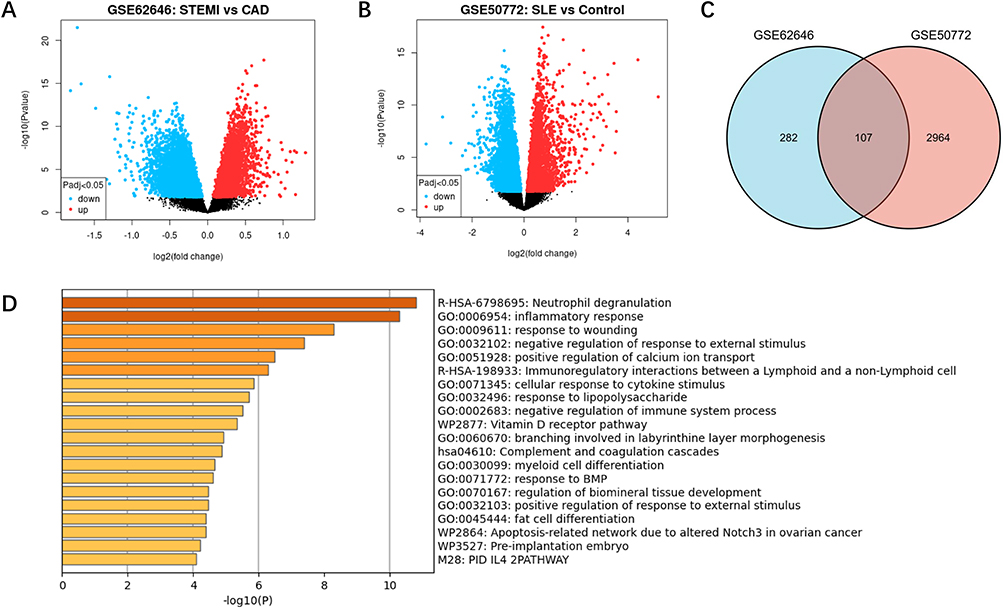 |
Figure 3 Identification of DEGs and pathway analysis in validation cohort. (A) Volcanic plot of DEGs in GSE62646. The Y-axis represents the -1og10 (P value) and the X-axis represents the gene fold change (log2FC). Blue and red colors dots represent low and high expression, respectively. (B) Volcanic map of DEGs in GSE50772 dataset. (C) Shared genes between the DEGs in GSE62646 and GSE50772. (D) Signaling pathways significantly enriched in shared DEGs in validation cohort. Abbreviation: DEGs, differentially expressed genes. |
Baseline Clinical Characteristics
Patients without AMI determined by CAG were included in the control group (n = 10), and patients with AMI were included in the AMI group (n = 10). The mean age ± SD of the control and the plaque rupture groups was 70 ± 3.98 years and 60.70 ±10.37 years. Baseline demographics and clinical characteristics of the patients are summarized in Supplementary Table 1. There were significant differences in four parameters between the two groups: plasma levels of blood glucose, BNP, hsCRP and HB were higher in patients with AMI than in controls (P < 0.05).
Validation of Hub Genes by Sequencing PBMCs Samples from Patients with AMI
To verify whether the screened genes were significantly differentially expressed in the peripheral blood of AMI patients, we extracted total RNA of plasma PBMCs from AMI patients and health controls for sequencing. DEGs analysis was performed and the visualization of the analysis results was presented by volcano plot (Figure 4A). The results indicated that a total of 4483 differentially expressed genes were screened, including 1099 up-regulated and 3379 down-regulated genes (Supplementary Table 2). Among these hub genes, as is shown in the volcano plot, a total of 7 genes (TNFAIP6, LRG1, DYSF, RNASE2, AQP9, TCN1, CSF3R) showed up-regulated expression in PBMCs from AMI patients (Table 2). The heatmap in Figure 4B illustrates the expression of hub genes in AMI and control patients, and the specific expression data are shown in Supplementary Table 3.
 |
Table 2 Differential Expression of Hub Genes in Sequencing Results |
 |
Figure 4 Gene expression profiling of patients with AMI. (A) Volcanic plot of DEGs. (B) Expression Heatmap of hub genes in AMI patients and controls. Abbreviations: AMI, acute myocardial infarction; DEGs, differentially expressed genes. |
ROC Analysis Validates the Discriminate Ability of Hub Genes
To validate the discriminating power of hub genes for AMI patients, we selected GSE62646, a dataset with a large sample size, for ROC analysis. The results showed that LRG1 (AUC = 0.908) and CSF3R (AUC = 0.946) exhibited excellent discriminatory power for AMI, and additionally DYSF (AUC = 0.855), RNASE2 (AUC = 0.849), AQP9 (AUC = 0.855) and TNFAIP6 (AUC = 0.712) also showed strong diagnostic power (Figure 5A). In addition, we validated these genes in GSE50772 for discriminating SLE patients, and the results showed that three genes, TNFAIP6 (AUC = 0.948), DYSF (AUC = 0.946) and LRG1 (AUC = 0.923) showed excellent discriminating power for SLE patients, and AQP9 (AUC = 0.886), RNASE22 (AUC = 0.885), CSF3R (AUC = 0.725) and TCN1 (AUC = 0.729) also showed strong diagnostic power (Figure 5B). Next, LASSO regression analysis was performed to screen the diagnostic biomarkers for AMI and SLE in the GSE62646 dataset (Figures 5C and E) and GSE50772 dataset (Figures 5D and F). DYSF, LRG1 and CSF3R are ultimately identified as diagnostic markers for SLE and AMI. ROC analysis shows the diagnostic power of the combination of the three genes for AMI (AUC = 0.954) (Figure 5G) and SLE (AUC = 0.986) (Figure 5H). We analyzed the expression levels of three diagnostic biomarkers in SLE and AMI patients, the results showed that the expression levels of these genes were significantly elevated in AMI and SLE samples than in control group (P < 0.05) (Figures 5I and J).
 |
Figure 5 Identification and validation of diagnostic biomarkers for SLE-related AMI. (A and B) ROC analysis revealed diagnostic power of the identified hub genes among the GSE62646 and GSE50772. (C and E) LASSO coefficient profiles and LASSO deviance profiles in GSE62646. (D and F) LASSO coefficient profiles and LASSO deviance profiles in GSE50772. (G and H) ROC analysis revealed the combined diagnostic efficacy of three biomarkers (DYSF, LR1G and CSF3R) identified by LASSO regression analysis. (I and J) Expression levels of three biomarkers in SLE and AMI samples; **P < 0.01; ***P < 0.001. Abbreviations: ROC, receiver operating characteristic; SLE, systemic lupus erythematosus; AMI, acute myocardial infarction. |
Immune Cell Infiltrative Patterns in AMI and SLE
For the analysis of AMI and SLE-related signaling pathways, most of the screened terms were associated with immune cells. The most significantly enriched pathway “neutrophil degranulation” in both the discovery and validation cohort was also significantly related with immune cells. To better understand the immune cell subtype enrichment differences between the AMI and CAD groups, we imported the dataset GSE62646 into the online analysis tool CIBERSORTx. Compared with controls, the proportions of monocytes, neutrophils, Tregs, and mast cells resting were significantly increased in AMI samples, whereas the proportions of NK cells resting, T cells CD4 memory resting, T cells CD8, T cells CD4 naive and macrophages M2 were significantly decreased (Figure 6A).
 |
Figure 6 Immune cell analysis. (A) The distribution of immune cells between the AMI and CAD samples. (B) The distribution of immune cells between the SLE and control samples; AMI, acute myocardial infarction; CAD, coronary artery disease; SLE, systemic lupus erythematosus. *P < 0.05;**P < 0.01; ***P < 0.001. |
To analyze the distribution of immune cells in the SLE and control groups, the CIBERSORTx algorithm was performed on the GSE81622 dataset. The results demonstrate that the proportion of monocytes, plasma cells (effector B cells), macrophages M0, and Tregs were increased in SLE samples, and the proportions of NK cells resting, T cells CD4 memory resting, T cells CD4 memory activated and mast cells resting were decreased. In SLE samples, the proportion of T cells CD4 naive increased, but there was no significant difference (Figure 6B). No changes in neutrophils were observed in SLE/control samples, whereas the proportion of neutrophils was significantly increased in the AMI samples compared with the CAD group (Figure 6).
Correlation of Immune Cells and Diagnostic Biomarkers
Next, we performed correlation analysis in GSE81622 and GSE62646 to explore the relationship between immune cells and three diagnostic biomarkers. As indicated in the results of correlation analysis (Supplementary Table 4), neutrophils have significant positive correlations with DYSF (r = 0.65, p < 0.001), LRG1 (r = 0.53, p < 0.001) and CSF3R (r = 0.67, p < 0.001) in GSE62646 (Figures 7A-C). As shown in Figures 7D-F, neutrophils showed a significantly strong positive correlation with DYSF (r = 0.53, p = 0.012), LRG1 (r = 0.58, p < 0.001) and CSF3R (r = 0.51, p = 0.0019) in the SLE-related datasets. Combined with the signaling pathway enrichment results, we speculate that the change of three diagnostic biomarkers and neutrophils may be one of the important regulatory mechanisms for the development of AMI in SLE patients.
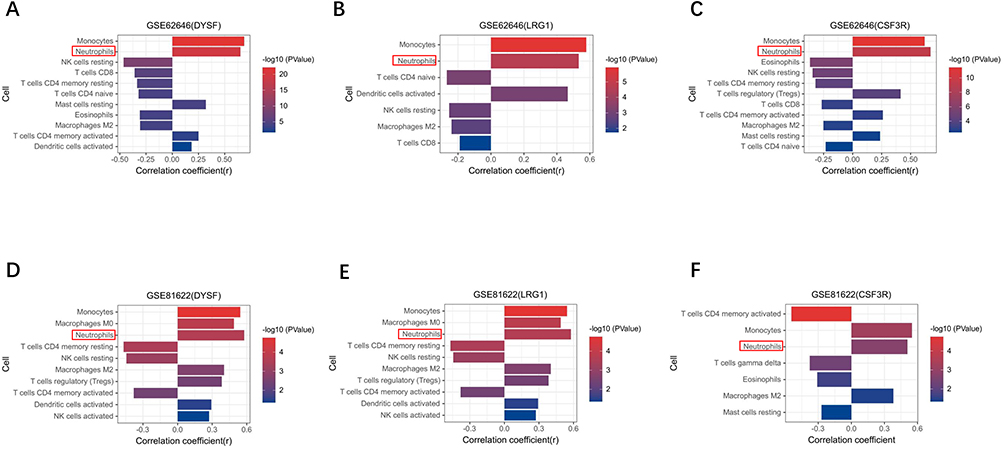 |
Figure 7 Correlation analysis between the enriched immune cells and three biomarkers. (A–C) Correlation analysis between three biomarkers (DYSF, LR1G and CSF3R) and immune cells in GSE62646. (D–F) Correlation analysis in GSE81622. |
The miRNAs-Target Genes Network in SLE-Related AMI
According to the HMDD, as shown in Figure 8A, a total of 64 SLE-related miRNAs and 22 AMI-related miRNAs were identified, including 7 overlapped miRNAs (hsa-mir-145-5p, hsa-mir-155-5p hsa-mir-181a-5p, hsa-mir-19b-3p, hsa-mir-21-5p, hsa-mir-221-3p, hsa-mir-380-3p). TNFAIP6 and AQP9 in hub genes were found in the target genes of the 7 overlapped miRNAs, and the miRNAs-RNA regulatory network was constructed in Cytoscape software (Figures 8B). As shown in Figure 8B, the “neutrophil degranulation” pathway was regulated by hsa-mir-19b-3p, hsa-mir-181a-5p and hsa-mir-155-5p through TNFAIP6. The regulation of AQP9 by hsa-mir-155-5p and hsa-mir-380-3p may play an important role in the “NETs formation” pathway.
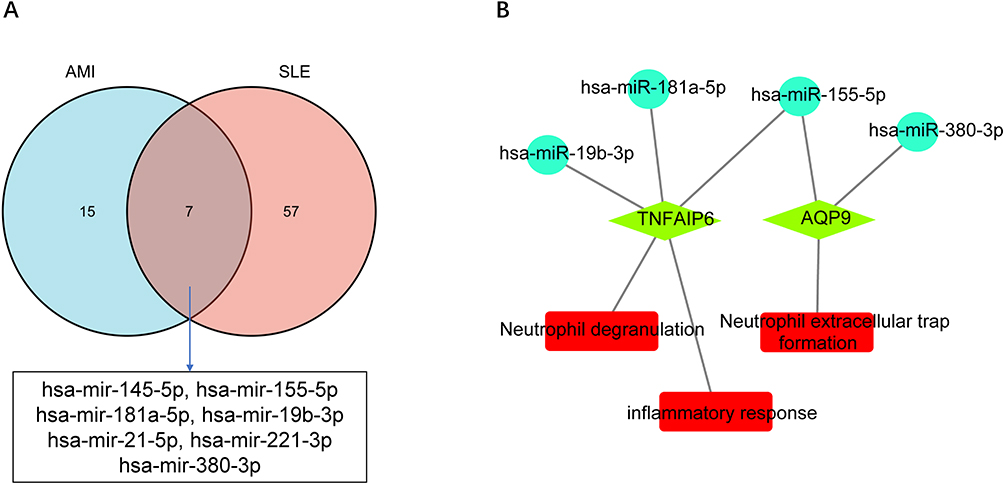 |
Figure 8 miRNAs-RNA regulatory network. (A) Shared miRNAs associated with both AMI and SLE identified from the HMDD database. (B) miRNAs-RNA regulatory network, circles represent miRNAs, green diamonds represent hub genes, and red rectangles represent signaling pathways. |
Discussion
The morbidity and mortality of AMI are still increasing, and it has become the leading cause of death in the world population.1 A study based on 4863 patients suggested patients with SLE had a more than 2-fold increase in odds of AMI.33 The disturbance of the immune system and the massive release of inflammatory mediators induced by SLE are important factors driving the development of AS and AMI.34 A certain amount of subclinical cardiovascular damage caused by SLE may accrue with an insidious onset before the occurrence of AMI, and little is currently known about its cellular and molecular mechanisms. Therefore, the identification of biomarkers and molecular mechanisms of SLE associated AMI by bioinformatics and sequencing technologies has important clinical implications.
In the present study, gene modules associated with SLE and AMI were identified based on the GSE81622 and GSE60993 datasets in discovery cohort and the GO/KEGG enrichment analysis was performed on the obtained 108 intersection genes. The results showed significant enrichment of signaling pathways involved in “neutrophil degranulation”, “inflammatory response” and “NETs formation”. Analysis in the validation cohort also supported this observation, which suggested that neutrophil-related signaling pathways played an important role in the development and progression of SLE-related AMI.
As the most abundant leukocytes in the blood and key effector cells of the innate immune system, neutrophils, when activated, release phagosomes or secrete antimicrobial and inflammatory proteins that are packaged into cytoplasmic granules in a process called neutrophil degranulation.35 Proteins in the granules derived from neutrophil degranulation play important roles in neutrophil chemotaxis, recruitment, antibacterial and neutrophil NETs formation.35 Neutrophils migrate to the sites of tissue inflammation early in the inflammatory response, and during the development of atherosclerosis (AS), neutrophils can promote the progression of AS by amplifying the inflammatory response and mediating NETs formation.36–38
Previous data have proposed that neutrophils are involved in AS and plaque rupture during myocardial infarction.39,40 An analysis of coronary thrombi from patients who developed coronary events found that activated neutrophils were the predominant cell type in coronary thrombi.37 Studies have shown that proteases produced by neutrophil degranulation can promote atherosclerotic plaque instability and may directly participate in the rupture of AS plaques by promoting NETs formation, leading to the occurrence of AMI.41–43 NETs, a specialized meshwork released after neutrophil death or apoptosis, mainly composed of extracellularly released granule proteins bound to a meshwork of decondensed chromatin, which can trap and kill bacteria.44 Increased formation and impaired clearance of NETs in peripheral blood and tissues play an important role in the development and progression of SLE and are a hallmark of SLE.45 Low-density granulocytes (LDGs), an inflammatory subset of neutrophils, play an important role in endothelial and vascular injury in SLE, and increased NETosis of LDG in SLE patients leads to externalization of IL-17, dsDNA and neutrophil elastase, and mediates endothelial cytotoxicity in a NETs mediated manner.46 The observation of NETs in thrombi from patients with myocardial infarction undergoing thrombectomy suggests that NETs are associated with the formation of arterial thrombosis.39,47 The results of the present study further demonstrate the important role of neutrophil degranulation and NETs formation in SLE associated myocardial infarction.
Through the analysis of the prediction and validation cohort, we screened a total of 13 genes that may play an important role in SLE associated myocardial infarction. In the present study, to further validate the expression of these genes in PBMCs from patients with AMI, we sequenced PBMCs from patients with AMI and finally screened a total of 7 genes that were differentially expressed in AMI patients: TNFAIP6, LRG1, DYSF, RNASE2, AQP9, TCN1, CSF3R. After applying lasso regression analysis, DYSF, LRG1 and CSF3R were selected as diagnostic biomarkers and their discriminatory power was verified using ROC analysis.
Correlation analysis between immune cells and biomarkers showed that the expression of biomarkers was significantly and positively correlated with neutrophils. The proportion of neutrophils was increased in patients with SLE compared with controls, but the difference is not statistically significant. The increase in neutrophils was more drastic in AMI patients compared with controls, which may contribute to the development of AMI in SLE patients. In addition, the proportion of monocytes was obviously elevated in both SLE and AMI patients, and exhibited strong correlations with all three biomarkers.
LRG1 is abundant in human serum and is mainly produced by hepatocytes and neutrophils. During neutrophil differentiation, LRG1 is highly expressed48,49 and promotes neutrophil differentiation by regulating the G-CSFR signaling pathway.50 Through regulation of the IL-6/STAT3 axis, LRG1 can promote neutrophil chemotaxis.51 Further studies showed that LRG1 is secreted as a granule protein of neutrophils when neutrophils are activated.52 In the present study, “neutrophil degranulation” and “NETs formation” pathways were significantly enriched in patients with SLE and AMI, suggesting that neutrophils may be a major source of circulating LRG1 and the LRG1 may contribute to neutrophil overactivation during SLE-related pathogenesis. In addition, growing evidence points to LRG1 being a proangiogenic factor, and local upregulation of LRG1 promotes the formation of defective neovasculature, resulting in vascular destabilisation, which may play an important role in SLE-related AMI.48,53
As a major regulator of the production, differentiation, and function of granulocytes, granulocyte colony-stimulating factor (G-CSF) plays a regulatory role in granulocyte by binding to its receptor G-CSFR, which is encoded by CSF3R.54 G-CSF promotes the progression of inflammation by promoting the neutrophil production and enhancing the function of mature neutrophil.55 Previous studies have indicated that AMI patients have elevated levels of CSF3R expression compared with CAD patients, which increases with progression of disease.54,56
DYSF encodes dysferlin, a protein containing C2 domains that plays an important role in calcium-mediated membrane fusion events, suggesting that it may be involved in membrane regeneration and repair.57 In addition, studies also suggest that DYSF was involved in the membrane repair and inflammatory regulation of vascular endothelial cells (VEC) and leukocytes.58 Moreover, DYSF can promote the activation of monocytes and increase their phagocytic, adhesive and migratory capacity, promote the formation of atherosclerotic necrotic core, playing an important role in atherosclerotic cardiovascular diseases.59,60
Combining our results with published studies, LRG1, DYSF, and CSF3R play important roles in the progression of SLE-related AMI and would be of great clinical value as important diagnostic markers for the development of AMI in patients with SLE. This study provides valuable clues for further exploring the pathophysiological mechanisms of SLE-related AMI. One reasonable assumption is that the immune imbalance induced by SLE leads to an increase in inflammatory cells such as neutrophils and monocytes, enhances the inflammatory response, and ultimately increases cardiovascular events. Unfortunately, these three biomarkers were not included in our constructed miRNA-mRNA network, which deserves further exploration.
The present study has several limitations. Further studies with larger numbers of patients are needed to definitively demonstrate the role of the three biomarkers in SLE-related AMI and their value as prospective biomarkers. In addition, plasma from SLE patients who developed AMI should be obtained for further analysis, compared with those from patients with SLE and healthy patients, and further analyzed for the diagnostic efficacy of these genes. In addition, prospective clinical studies will be indispensable to validate the diagnostic and therapeutic value of these biomarkers.
Conclusion
In summary, DYSF, LRG1 and CSF3R were screened as diagnostic markers for SLE-related AMI through a systematic comprehensive analysis, and these genes were significantly associated with neutrophils. Neutrophil degranulation and NETs formation signaling pathways were significantly enriched and may play important regulatory roles in the occurrence of AMI in SLE patients. These diagnostic biomarkers and signaling axes have important clinical implications for the prevention, diagnosis, and treatment of SLE-related AMI.
Data Sharing Statement
Correspondence and requests for materials should be addressed to FC and XL.
Ethics Statement
This study was approved by the Institutional Ethics Committee of The TongJi Hospital, TongJi University (2021-KYSB-121). Written informed consents were obtained from the patients for the publication of this study. Our study complies with the Declaration of Helsinki and all patients provided informed consent to participate in this study.
Acknowledgments
The authors acknowledge GEO database for providing their platforms and contributors for uploading their meaningful datasets. The authors acknowledge the online tools of HIPLOT (https://hiplot.com.cn/) and XIANTAO (https://www.xiantao.love/) for facilitating our data analysis.
Author Contributions
All authors made a significant contribution to the work reported, whether that is in the conception, study design, execution, acquisition of data, analysis and interpretation, or in all these areas; took part in drafting, revising or critically reviewing the article; gave final approval of the version to be published; have agreed on the journal to which the article has been submitted; and agree to be accountable for all aspects of the work.
Funding
This study was supported by the National Natural Science Foundation of China (Grant No. 82170346, 81670403 and 81370390), Grant of Shanghai Science and Technology Committee (NO.19XD1403300 and 19411963200), Shanghai Municipal Health Commission (NO.2019LJ10).
Disclosure
The authors report that they have no conflicts of interest in this work.
References
1. Virani SS, Alonso A, Benjamin EJ, et al. Heart disease and stroke statistics-2020 update: a report from the American Heart Association. Circulation. 2020;141:e139–e596. doi:10.1161/CIR.0000000000000757
2. Bueno H, Rossello X, Bardaji A. Has the fourth universal definition of myocardial infarction led to better diagnosis and risk stratification? Eur Heart J. 2021;42:2562–2564. doi:10.1093/eurheartj/ehaa486
3. Baigent C, Blackwell L, Emberson J; Cholesterol Treatment Trialists C, et al. Efficacy and safety of more intensive lowering of LDL cholesterol: a meta-analysis of data from 170,000 participants in 26 randomised trials. Lancet. 2010;376:1670–1681. doi:10.1016/S0140-6736(10)61350-5
4. Kaul A, Gordon C, Crow MK, et al. Systemic lupus erythematosus. Nat Rev Dis Primers. 2016;2:16039. doi:10.1038/nrdp.2016.39
5. Schoenfeld SR, Kasturi S, Costenbader KH. The epidemiology of atherosclerotic cardiovascular disease among patients with SLE: a systematic review. Semin Arthritis Rheum. 2013;43:77–95. doi:10.1016/j.semarthrit.2012.12.002
6. Ingvarsson RF, Landgren AJ, Bengtsson AA, Jonsen A. Good survival rates in systemic lupus erythematosus in southern Sweden, while the mortality rate remains increased compared with the population. Lupus. 2019;28:1488–1494. doi:10.1177/0961203319877947
7. Gustafsson JT, Simard JF, Gunnarsson I, et al. Risk factors for cardiovascular mortality in patients with systemic lupus erythematosus, a prospective cohort study. Arthritis Res Ther. 2012;14:R46. doi:10.1186/ar3759
8. Bernatsky S, Boivin JF, Joseph L, et al. Mortality in systemic lupus erythematosus. Arthritis Rheum. 2006;54:2550–2557. doi:10.1002/art.21955
9. Kiani AN, Magder LS, Post WS, et al. Coronary calcification in SLE: comparison with the multi-ethnic study of atherosclerosis. Rheumatology(Oxford). 2015;54:1976. doi:10.1093/rheumatology/kev198
10. Hak AE, Karlson EW, Feskanich D, Stampfer MJ, Costenbader KH. Systemic lupus erythematosus and the risk of cardiovascular disease: results from the nurses’ health study. Arthritis Rheum. 2009;61:1396–1402. doi:10.1002/art.24537
11. Bengtsson C, Ohman ML, Nived O, Rantapaa Dahlqvist S. Cardiovascular event in systemic lupus erythematosus in northern Sweden: incidence and predictors in a 7-year follow-up study. Lupus. 2012;21:452–459. doi:10.1177/0961203311425524
12. Benjamin EJ, Virani SS, Callaway CW, et al. Heart Disease and Stroke Statistics-2018 update: a report from the American Heart Association. Circulation. 2018;137:e67–e492. doi:10.1161/CIR.0000000000000558
13. Zhao E, Xie H, Zhang Y. Predicting diagnostic gene biomarkers associated with immune infiltration in patients with acute myocardial infarction. Front Cardiovasc Med. 2020;7:586871. doi:10.3389/fcvm.2020.586871
14. Yao M, Zhang C, Gao C, et al. Exploration of the shared gene signatures and molecular mechanisms between systemic lupus erythematosus and pulmonary arterial hypertension: evidence from transcriptome data. Front Immunol. 2021;12:658341. doi:10.3389/fimmu.2021.658341
15. Chen X, Li Q, Zhang Z, Yang M, Wang E. Identification of potential diagnostic biomarkers from circulating cells during the course of sleep deprivation-related myocardial infarction based on bioinformatics analyses. Front Cardiovasc Med. 2022;9:843426. doi:10.3389/fcvm.2022.843426
16. Kiliszek M, Burzynska B, Michalak M, et al. Altered gene expression pattern in peripheral blood mononuclear cells in patients with acute myocardial infarction. PLoS One. 2012;7:e50054. doi:10.1371/journal.pone.0050054
17. Park HJ, Noh JH, Eun JW, et al. Assessment and diagnostic relevance of novel serum biomarkers for early decision of ST-elevation myocardial infarction. Oncotarget. 2015;6:12970–12983. doi:10.18632/oncotarget.4001
18. Kennedy WP, Maciuca R, Wolslegel K, et al. Association of the interferon signature metric with serological disease manifestations but not global activity scores in multiple cohorts of patients with SLE. Lupus Sci Med. 2015;2:e000080. doi:10.1136/lupus-2014-000080
19. Zhu H, Mi W, Luo H, et al. Whole-genome transcription and DNA methylation analysis of peripheral blood mononuclear cells identified aberrant gene regulation pathways in systemic lupus erythematosus. Arthritis Res Ther. 2016;18:162. doi:10.1186/s13075-016-1050-x
20. Langfelder P, Horvath S. WGCNA: an R package for weighted correlation network analysis. BMC Bioinform. 2008;9:559. doi:10.1186/1471-2105-9-559
21. Zhou Y, Zhou B, Pache L, et al. Metascape provides a biologist-oriented resource for the analysis of systems-level datasets. Nat Commun. 2019;10:1523. doi:10.1038/s41467-019-09234-6
22. Armstrong G, Martino C, Rahman G, et al. Uniform Manifold Approximation and Projection (UMAP) reveals composite patterns and resolves visualization artifacts in microbiome data. mSystems. 2021;6:e0069121. doi:10.1128/mSystems.00691-21
23. Ritchie ME, Phipson B, Wu D, et al. limma powers differential expression analyses for RNA-sequencing and microarray studies. Nucleic Acids Res. 2015;43:e47. doi:10.1093/nar/gkv007
24. Friedman J, Hastie T, Tibshirani R. Regularization paths for generalized linear models via coordinate descent. J Stat Softw. 2010;33:1–22.
25. Robin X, Turck N, Hainard A, et al. pROC: an open-source package for R and S plus to analyze and compare ROC curves. BMC Bioinform. 2011;12:56.
26. Ginestet C. ggplot2: elegant graphics for data analysis. J R Stat Soc a Stat. 2011;174:245. doi:10.1111/j.1467-985X.2010.00676_9.x
27. Hosmer DW, Lemeshow S. Applied Logistic Regression.
28. Newman AM, Liu CL, Green MR, et al. Robust enumeration of cell subsets from tissue expression profiles. Nat Methods. 2015;12:453–457. doi:10.1038/nmeth.3337
29. Xiao M, Li J, Li W, et al. MicroRNAs activate gene transcription epigenetically as an enhancer trigger. RNA Biol. 2017;14:1326–1334. doi:10.1080/15476286.2015.1112487
30. Fabian MR, Sonenberg N, Filipowicz W. Regulation of mRNA translation and stability by microRNAs. Annu Rev Biochem. 2010;79:351–379. doi:10.1146/annurev-biochem-060308-103103
31. Chou CH, Shrestha S, Yang CD, et al. miRTarBase update 2018: a resource for experimentally validated microRNA-target interactions. Nucleic Acids Res. 2018;46:D296–D302. doi:10.1093/nar/gkx1067
32. Li JH, Liu S, Zhou H, Qu LH, Yang JH. starBase v2.0: decoding miRNA-ceRNA, miRNA-ncRNA and protein-RNA interaction networks from large-scale CLIP-Seq data. Nucleic Acids Res. 2014;42:D92–7. doi:10.1093/nar/gkt1248
33. Avina-Zubieta JA, To F, Vostretsova K, De Vera M, Sayre EC, Esdaile JM. Risk of myocardial infarction and stroke in newly diagnosed systemic lupus erythematosus: a general population-based study. Arthritis Care Res. 2017;69:849–856. doi:10.1002/acr.23018
34. Tselios K, Urowitz MB. Cardiovascular and pulmonary manifestations of systemic lupus erythematosus. CurrRheumatolRev. 2017;13:206. doi:10.2174/1573397113666170704102444
35. Yin C, Heit B. Armed for destruction: formation, function and trafficking of neutrophil granules. Cell Tissue Res. 2018;371:455–471. doi:10.1007/s00441-017-2731-8
36. Franck G, Mawson TL, Folco EJ, et al. Roles of PAD4 and NETosis in experimental atherosclerosis and arterial injury: implications for superficial erosion. Circ Res. 2018;123:33–42. doi:10.1161/CIRCRESAHA.117.312494
37. Sugiyama T, Yamamoto E, Bryniarski K, et al. Nonculprit plaque characteristics in patients with acute coronary syndrome caused by plaque erosion vs plaque rupture: a 3-vessel optical coherence tomography study. JAMA Cardiol. 2018;3:207–214. doi:10.1001/jamacardio.2017.5234
38. Rosales C. Neutrophil: a cell with many roles in inflammation or several cell types? Front Physiol. 2018;9:113. doi:10.3389/fphys.2018.00113
39. Stakos DA, Kambas K, Konstantinidis T, et al. Expression of functional tissue factor by neutrophil extracellular traps in culprit artery of acute myocardial infarction. Eur Heart J. 2015;36:1405–1414. doi:10.1093/eurheartj/ehv007
40. Frangou E, Vassilopoulos D, Boletis J, Boumpas DT. An emerging role of neutrophils and NETosis in chronic inflammation and fibrosis in systemic lupus erythematosus (SLE) and ANCA-associated vasculitides (AAV): implications for the pathogenesis and treatment. Autoimmun Rev. 2019;18:751–760. doi:10.1016/j.autrev.2019.06.011
41. Hansson GK, Libby P, Tabas I. Inflammation and plaque vulnerability. J Intern Med. 2015;278:483–493. doi:10.1111/joim.12406
42. Doring Y, Soehnlein O, Weber C. Neutrophil extracellular traps in atherosclerosis and atherothrombosis. Circ Res. 2017;120:736–743. doi:10.1161/CIRCRESAHA.116.309692
43. Doring Y, Drechsler M, Wantha S, et al. Lack of neutrophil-derived CRAMP reduces atherosclerosis in mice. Circ Res. 2012;110:1052–1056. doi:10.1161/CIRCRESAHA.112.265868
44. Mozzini C, Garbin U, Fratta Pasini AM, Cominacini L. An exploratory look at NETosis in atherosclerosis. Intern Emerg Med. 2017;12:13–22. doi:10.1007/s11739-016-1543-2
45. Radic M, Herrmann M, van der Vlag J, Rekvig OP. Regulatory and pathogenetic mechanisms of autoantibodies in SLE. Autoimmunity. 2011;44:349–356. doi:10.3109/08916934.2010.536794
46. Villanueva E, Yalavarthi S, Berthier CC, et al. Netting neutrophils induce endothelial damage, infiltrate tissues, and expose immunostimulatory molecules in systemic lupus erythematosus. J Immunol. 2011;187:538–552. doi:10.4049/jimmunol.1100450
47. de Boer OJ, Li X, Teeling P, et al. Neutrophils, neutrophil extracellular traps and interleukin-17 associate with the organisation of thrombi in acute myocardial infarction. Thromb Haemost. 2013;109:290–297. doi:10.1160/TH12-06-0425
48. Wang X, Abraham S, McKenzie JAG, et al. LRG1 promotes angiogenesis by modulating endothelial TGF-beta signalling. Nature. 2013;499:306–311. doi:10.1038/nature12345
49. O’Donnell LC, Druhan LJ, Avalos BR. Molecular characterization and expression analysis of leucine-rich alpha 2-glycoprotein, a novel marker of granulocytic differentiation. J Leukoc Biol. 2002;72:478–485.
50. Ai J, Druhan LJ, Hunter MG, Loveland MJ, Avalos BR. LRG-accelerated differentiation defines unique G-CSFR signaling pathways downstream of PU.1 and C/EBPepsilon that modulate neutrophil activation. J Leukoc Biol. 2008;83:1277–1285. doi:10.1189/jlb.1107751
51. Yu B, Yang L, Song S, Li W, Wang H, Cheng J. LRG1 facilitates corneal fibrotic response by inducing neutrophil chemotaxis via Stat3 signaling in alkali-burned mouse corneas. Am J Physiol Cell Physiol. 2021;321:C415–C28. doi:10.1152/ajpcell.00517.2020
52. Sun Y, Wang F, Zhou Z, et al. Urinary proteomics identifying novel biomarkers for the diagnosis of adult-onset still’s disease. Front Immunol. 2020;11:2112. doi:10.3389/fimmu.2020.02112
53. O’Connor MN, Kallenberg DM, Camilli C, et al. LRG1 destabilizes tumor vessels and restricts immunotherapeutic potency. Med. 2021;2:1231–52 e10. doi:10.1016/j.medj.2021.10.002
54. Su J, Gao C, Wang R, Xiao C, Yang M. Genes associated with inflammation and the cell cycle may serve as biomarkers for the diagnosis and prognosis of acute myocardial infarction in a Chinese population. Mol Med Rep. 2018;18:1311–1322. doi:10.3892/mmr.2018.9077
55. Molineux G. Granulocyte colony-stimulating factors. Cancer Treat Res. 2011;157:33–53. doi:10.1007/978-1-4419-7073-2_3
56. Li CR, Wang LM, Gong Z, et al. Expression characteristics of neutrophil and mononuclear-phagocyte related genes mRNA in the stable angina pectoris and acute myocardial infarction stages of coronary artery disease. J Geriatr Cardiol. 2015;12:279–286. doi:10.11909/j.issn.1671-5411.2015.03.021
57. Kokubu Y, Nagino T, Sasa K, et al. Phenotypic drug screening for dysferlinopathy using patient-derived induced pluripotent stem cells. Stem Cells Transl Med. 2019;8:1017–1029. doi:10.1002/sctm.18-0280
58. Sharma A, Yu C, Leung C, et al. A new role for the muscle repair protein dysferlin in endothelial cell adhesion and angiogenesis. Arterioscler Thromb Vasc Biol. 2010;30:2196–2204. doi:10.1161/ATVBAHA.110.208108
59. de Morree A, Flix B, Bagaric I, et al. Dysferlin regulates cell adhesion in human monocytes. J Biol Chem. 2013;288:14147–14157. doi:10.1074/jbc.M112.448589
60. Zhang X, He D, Xiang Y, et al. DYSF promotes monocyte activation in atherosclerotic cardiovascular disease as a DNA methylation-driven gene. Transl Res. 2022. doi:10.1016/j.trsl.2022.04.001
 © 2023 The Author(s). This work is published and licensed by Dove Medical Press Limited. The
full terms of this license are available at https://www.dovepress.com/terms
and incorporate the Creative Commons Attribution
- Non Commercial (unported, 3.0) License.
By accessing the work you hereby accept the Terms. Non-commercial uses of the work are permitted
without any further permission from Dove Medical Press Limited, provided the work is properly
attributed. For permission for commercial use of this work, please see paragraphs 4.2 and 5 of our Terms.
© 2023 The Author(s). This work is published and licensed by Dove Medical Press Limited. The
full terms of this license are available at https://www.dovepress.com/terms
and incorporate the Creative Commons Attribution
- Non Commercial (unported, 3.0) License.
By accessing the work you hereby accept the Terms. Non-commercial uses of the work are permitted
without any further permission from Dove Medical Press Limited, provided the work is properly
attributed. For permission for commercial use of this work, please see paragraphs 4.2 and 5 of our Terms.