")
Back to Journals » International Journal of General Medicine » Volume 17
Screening of Biomarkers Associated with Osteoarthritis Aging Genes and Immune Correlation Studies
Authors Xu L , Wang Z , Wang G
Received 7 November 2023
Accepted for publication 10 January 2024
Published 20 January 2024 Volume 2024:17 Pages 205—224
DOI https://doi.org/10.2147/IJGM.S447035
Checked for plagiarism Yes
Review by Single anonymous peer review
Peer reviewer comments 2
Editor who approved publication: Dr Woon-Man Kung
Lanwei Xu,1,2 Zheng Wang,3 Gang Wang1
1Department of Orthopedics, Nanfang Hospital, Southern Medical University, Guangzhou, 510515, People’s Republic of China; 2Department of Hand and Foot Surgery, Shandong Provincial Hospital Affiliated to Shandong First Medical University, Jinan, 250021, People’s Republic of China; 3Department of Neurosurgery, Liaocheng Traditional Chinese Medicine Hospital, Liaocheng, 252000, People’s Republic of China
Correspondence: Zheng Wang, Department of Neurosurgery, Liaocheng Traditional Chinese Medicine Hospital, Liaocheng, 252000, People’s Republic of China, Tel +86 18063560328, Email [email protected] Gang Wang, Department of Orthopedics, Nanfang Hospital, Southern Medical University, Guangzhou, 510515, People’s Republic of China, Tel +86 13791006108, Email [email protected]
Purpose: Osteoarthritis (OA) is a joint disease with a long and slow course, which is one of the major causes of disability in middle and old-aged people. This study was dedicated to excavating the cellular senescence-associated biomarkers of OA.
Methods: The Gene Expression Omnibus (GEO) database was searched and five datasets pertaining to OA were obtained. After removing the batch effect, the GSE55235, GSE55457, GSE82107, and GSE12021 datasets were integrated together for screening of the candidate genes by differential analysis and weighted gene co-expression network analysis (WGCNA). Next, those genes were further filtered by machine learning algorithms to obtain cellular senescence-associated biomarkers of OA. Subsequently, enrichment analyses based on those biomarkers were conducted, and we profiled the infiltration levels of 22 types immune cells with the ERSORT algorithm. A lncRNA-miRNA-mRNA regulatory and drug-gene network were constructed. Finally, we validated the senescence-associated biomarkers at both in vivo and in vitro levels.
Results: Five genes (BCL6, MCL1, SLC16A7, PIM1, and EPHA3) were authenticated as cellular senescence-associated biomarkers in OA. ROC curves demonstrated the reliable capacity of the five genes as a whole to discriminate OA samples from normal samples. The nomogram diagnostic model based on 5 genes proved to be a reliable predictor of OA. Single-gene GSEA results pointed to the involvement of the five biomarkers in immune-related pathways and oxidative phosphorylation in the development of OA. Immune infiltration analysis manifested that the five genes were significantly correlated with differential immune cells. Subsequently, a lncRNA-miRNA-mRNA network and gene-drug network containing were generated based on five cellular senescence-associated biomarkers in OA.
Conclusion: A foundation for understanding the pathophysiology of OA and new insights into OA diagnosis and treatment were provided by the identification of five genes, namely BCL6, MCL1, SLC16A7, PIM1, and EPHA3, as biomarkers associated with cellular senescence in OA.
Keywords: osteoarthritis, cellular senescence-related genes, biomarkers, drugs, PIM1
Introduction
Osteoarthritis is a common degenerative joint disease of the middle-aged and elderly, with about 3 million new cases diagnosed each year.1 The disease is a progressive, chronic disease that is characterized by damage to the cartilage of the joints and involves the entire joint tissue, manifesting itself in joint pain, stiffness, hypertrophy, and restricted movement, and is one of the main causes of disability in the middle-aged and elderly, and places a severe psychological, financial and physical burden on patients.2,3
The pathological features of OA include degeneration of articular cartilage, narrowing of the joint space, inflammation of the synovial membrane, formation of bone fragments and alteration of mechanical properties.4–6 Osteoarthritis is a comprehensive joint disease encompassing all joint tissues with risk factors including joint injury, poor joint development, genetics, age, obesity and gender.7–9 Conventional diagnostic methods, including the combination of clinical presentation, physical examination, and imaging techniques like X-ray, are inadequate for the early detection of osteoarthritis.10–12 Because of the difficulty of early diagnosis, most patients have limited treatment options, leading to poor prognoses. Screening of early biomarkers using bioinformatics has attracted the attention of researchers, developing early biomarkers of OA for disease diagnosis and providing therapeutic targets is of great significance.13–15
Cell aging is one of the signs of aging and a kind of cell fate.16 Cellular senescence is characterized by cell cycle arrest and releasing harmful pro-inflammatory molecules into the pericellular microenvironment.17 As age is the most common risk factor for OA, aging is related to the onset and progression of OA.18,19 In clinical practice, the efficacy of treating osteoarthritis (OA) is being evaluated through the use of senolytics. Senolytics are a category of medications that specifically trigger the death of aging cells in order to eliminate them. Examples of senolytics include p53 binding protein Mdm-2 inhibitors and B-cell lymphoma 2 (BCL-2) family inhibitors.20 However, the role of cell senescence-related genes in the pathogenesis and progression of OA needs further study.
Therefore, based on the cellular senescence-related genes obtained from the CellAge database, this study identified OA cellular senescence-related biomarkers through a comprehensive bioinformatics approach, providing a theoretical basis for further understanding of disease pathogenesis and new potential targets for clinical diagnosis and treatment.
Materials and Methods
Gene and Dataset Collection
Five OA-related datasets, namely, GSE55235, GSE55457, GSE82107, GSE12021, and GSE51588, were retrieved from the GEO database (https://www.ncbi.nlm.nih.gov/geo/) and enrolled in our study (Table 1). Datasets included in this study have to meet the following criteria: The organism of samples is Homo sapiens; The sample type is synovial tissue; dataset including OA and normal (negative control) samples; The dataset contains more than 3 samples per group. A total of 279 cellular senescence-related genes (CSRGs) were excavated from the CellAge database (https://genomics.senescence.info/cells/, accessed on 26 June 2022) (https://genomics.senescence.info/cells/, accessed on 26 June 2022).
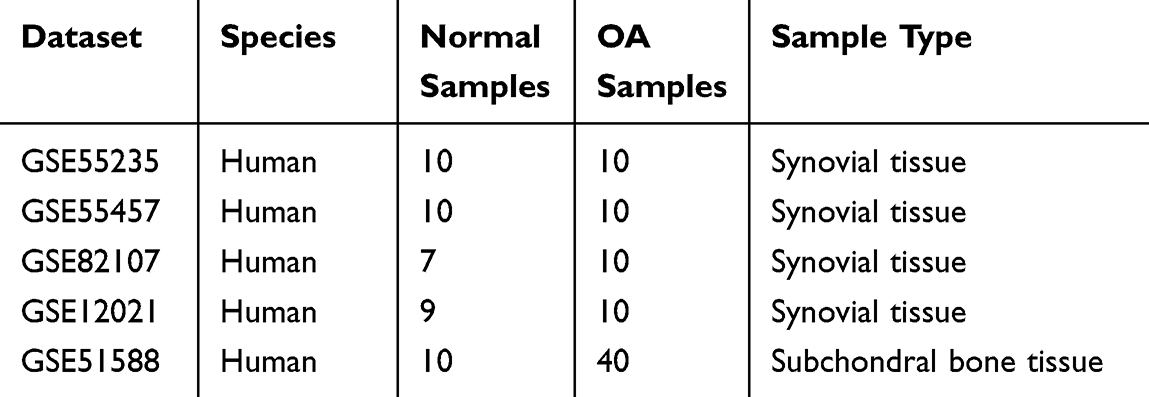 |
Table 1 Sample Size and Information of the OA-Related Datasets |
Preprocessing of Transcriptome Sequencing Data
Four OA-related datasets, namely GSE55235, GSE55457, GSE82107, and GSE12021, were merged by eliminating the batch effect through the combat function in R package “sva” (version 1.0.12).21,22
Excavating the Candidate Genes for Cellular Senescence-Associated Biomarkers in OA
We firstly determined the OA-related genes by WGCNA to develop a co-expression network.23 After samples clustering processing by the “goodSamplesGenes” function, outliers were recognized and then eliminated. The soft-thresholding power was computed to make the network contented the scale-free distribution. Then, modules (minimum genes number = 100) were developed by the dynamic tree-cutting method. We then mined the “limma” package for differentially expressed genes (DEGs) between OA and control samples. (version 3.4.3) with |log2 (FC)| > 0.5 and p-value < 0.05.24 Adopting the Venn diagram, we obtained the intersection of DEGs, OA-related genes, and CSRGs, which applied as candidate genes to screen out cellular senescence-associated biomarkers.
Functional Analysis of Genes
The “clusterProfiler” R package (version 4.0.2)25 was used for the enrichment analysis of Gene Ontology (GO) and the Kyoto Encyclopedia of Genes and Genomes (KEGG). Molecular function (MF), biological process (BP), and cellular component (CC) were the three main groups into which GO was divided. The criteria for significance was an adjusted p-value less than 0.05.
Certification of Cellular Senescence-Associated Biomarkers in OA
We implemented the Least absolute shrinkage and selection operator (LASSO)25 logistic regression by the “glmnet” package (version 4.0.2) and support vector machines recursive feature elimination (SVM-RFE)25 analysis by the “e1071” package (version 1.7–4). The recursive feature elimination (RFE) method was deployed to rank each gene based on its importance to procure feature genes. Finally, the overlapping genes were defined as cellular senescence-associated biomarkers.
Establishment of Diagnostic Model for OA
Based on the biomarkers obtained by machine learning, the “lrm” function in R was utilized to establish a diagnostic model and to visualize this model by drawing a nomogram. The corresponding calibration curve and DCA curve were plotted to assess the accuracy of the diagnostic model and patient benefit.
Single-Gene Gene Set Enrichment Analysis (GSEA)
The correlation coefficient between the expression of the target gene and all genes was calculated and used as a ranking criterion for GSEA enrichment analysis. The GO, KEGG, and reactome gene sets were extracted to act as the reference gene set. GSEA was executed using the R software “clusterProfiler” (version 4.0.2) package. Significance thresholds were adjusted p-value < 0.05.
Relevance Analysis of Cellular Senescence-Associated Biomarkers and Immune Cell Infiltration
The infiltration levels of 22 type immune cells in control and OA samples were profiled by the CIBERSORT algorithm.26 A Wilcoxon test was used to evaluate the differences in the infiltration levels of various immune cells between the control and OA samples. The results were then shown using a violin plot. Using the Pearson approach, we evaluated the correlations between the various immune cells and the biomarkers.
Construction of lncRNA-miRNA-mRNA Network
The miRDB and StarBase database were deployed to predict the target miRNAs of biomarkers. Then the StarBase database and miNet database were employed to predict lncRNAs targeting the miRNAs. The intracellular localization of predicted lncRNAs was analyzed by the lncATLAS database (https://lncatlas.crg.eu/) to obtain lncRNAs localized in the cytoplasm. The final lncRNA-miRNA-mRNA network was constructed using Cytoscape (version 3.8.2).27
Targeted Drug Prediction
With the CellMiner database, drugs targeting biomarkers were predicted by first selecting drugs that have been approved by the FDA or have been used in clinical trials and second retaining drug-gene relationship pairs with absolute values of correlation coefficients greater than 0.4 and p values less than 0.05. The final gene-drug network was mapped by Cytoscape software (version 3.8.2).
In vivo Validation of Key Genes
This study included 11 osteoarthritis patients and 11 healthy controls. The study included participants over 18 with radiologically verified knee osteoarthritis who satisfied American College of Rheumatology criteria. Orthopaedic surgeons diagnosed osteoarthritis. The study excluded patients with severe physical or behavioral problems, rheumatoid joints, or other joint disorders, and those who declined to participate. The healthy control tissues were taken from synovial joints of trauma patients. Trizol reagent (AG21101, China JSC) was used to extract total RNA from synovial tissues of 11 osteoarthritis patients and 11 healthy controls. A commercial reverse transcription kit (AG1706, China JSC) converted isolated RNA into cDNA. Real-time quantitative analysis was performed on the cDNA samples using the ABI7500 Real Time PCR System (7500 software v2.0.4, ABI, USA). The RT-PCR analysis used the SYBR premixed Ex Taq kit (AG11718, AG, China). The reference gene was 3-phosphoglyceraldehyde dehydrogenase. Table 2 lists the primers used to calculate relative mRNA levels using the 2(-Delta CT) technique. The Ethics Committee at Liaocheng Hospital, Shandong First Medical University approved the study (SWYX: NO.2023-005), and all participants gave informed consent.
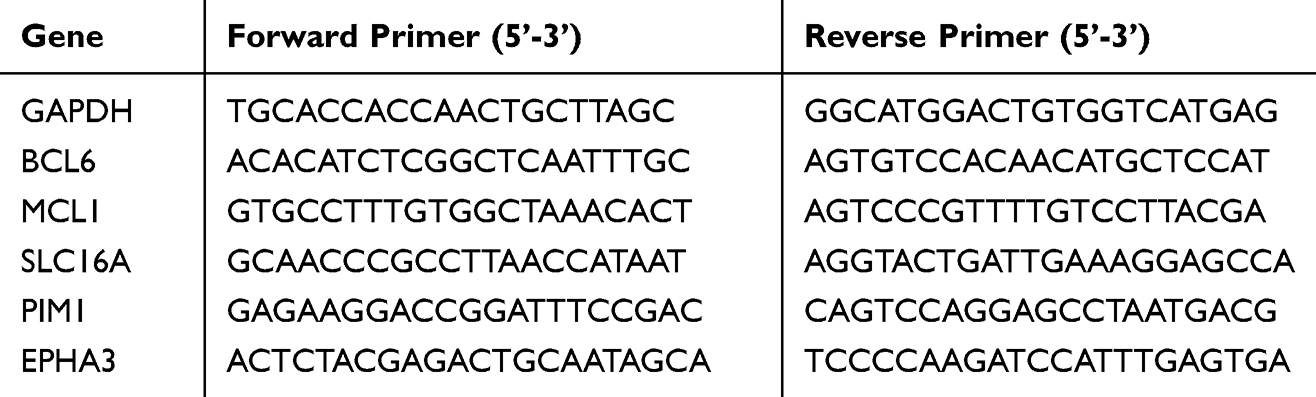 |
Table 2 Primers for RT-PCR |
Cell Culture and Transfection
The RPKFCL, derived from healthy synovial tissue of experimental rats, was obtained from Saibaikang (Shanghai, China). The cells were cultured in Fibroblast medium supplemented with 10% fetal bovine serum (FBS) from Gibco and 1% penicillin. The culture was maintained in an incubator at 37 degrees Celsius with 5% carbon dioxide. The whole PIM1 gene was put into the Ubi-MCS-3FLAG-SV40-IRES-puromycin Lentiviral Expression Vector and used to introduce it into RPKFCL by transfection. Perform the transfection of the lentiviral vector containing overexpressed PIM1 or overexpressed NC, together with two additional vectors (psPAX2 and pMD2.G), into the HEK293T cell line. Following a cultivation period of 48 hours, the liquid portion containing the desired substances was gathered and condensed for the purpose of introducing it into the RPKFCL cell line. Afterwards, puromycin was introduced into the RPKFCL culture system to acquire the targeted cells, and the effectiveness of PIM1 transfection was confirmed using q-PCR analysis.
Cell Proliferation Assay
A total of 5000 cells were distributed into each well of a 96-well plate and incubated at a constant temperature of 37 °C in a carbon dioxide-enriched environment of 5%. The CCK8 solution (Beyotime, China) was introduced and left to incubate for 40 minutes at the time of inoculation, as well as at 24 and 48 hours. Next, the measurement of absorbance at a wavelength of 450nm was conducted.28
Cell Viability Analysis
The vitality of the RPKFCL cell line was evaluated using a live/dead cell kit (YEASEN, China) following the instructions provided by the manufacturer. The cells were introduced into six-well plates (Sangong, China) at a density of 1 x 10^5. The cells were incubated in an incubator at 37 degrees Celsius overnight, and then hydrogen peroxide (H2O2) was added to the culture system to a concentration of 100 nM, and then continue cultured for 2 hours to emulate the oxidative damage environment associated with osteoarthritis.29,30 Afterward, the cells were stained with calcein and PI for 20 minutes at room temperature, and fluorescence images were captured using a fluorescence microscope manufactured by OLYMPUS in Japan.
Cell Senescence Analysis
The vitality of the RPKFCL cell line was evaluated using a live/dead cell kit (YEASEN, China) following the instructions provided by the manufacturer. Consistent with the steps mentioned above, RPKFCL were treated with hydrogen peroxide to mimic the oxidative damage environment of osteoarthritis.29,30 Subsequently, the cells were stained with calcein and PI for 20 minutes at room temperature, and fluorescence images were captured using an fluorescence microscope (OLYMPUS, Japan).
Cell Cloning Experiment
The clonogenic ability of the RPKFCL cells was assessed by the execution of a colony formation experiment. A total of 1500 cells were distributed evenly over six-well plates, and the culture media was replaced at regular intervals of 3 days. Following a two-week period, the cells were subjected to fixation using a 4% paraformaldehyde solution obtained from Biosharp (China). Then, staining was performed using crystal violet obtained from Solarbio (China). The colonies were then subjected to three rounds of washing and then photographed.
Cell Migration Assay
The migratory ability of the cells was tested using a transwell chamber (Corning, USA). RPKFCL cells were introduced at a concentration of 5×10⁴ cells per well in the top well, which contained medium without serum. The lower well was filled with 500 μL of complete medium. Following a 48-hour incubation period at 37°C in a temperature-controlled incubator, the non-migrating cells in the upper well were delicately eliminated. The cells in the lower chamber were treated with paraformaldehyde for 10 minutes to immobilize them, followed by staining with a 0.1% crystal violet solution for 20 minutes. Subsequently, the resulting images were examined and recorded using a microscope.
Statistical Analysis
The values are reported as the means ± standard deviation (SD) of a minimum of three separate experiments. The data were subjected to analysis using SPSS 25.0 software (IBM Corp. Released 2017. IBM SPSS Statistics for Windows, Version 25.0. Armonk, NY: IBM Corp), using an unpaired Student’s t-test to assess differences between the two groups. The receiver operating characteristic (ROC) curves were generated using the “pROC” software (version 1.17.0.1).24 The research was conducted using the R programming language (4.0.2), and the data from separate groups were compared using the Wilcoxon test. When explicit instructions were not provided, a p-value less than 0.05 was considered to show statistical significance.
Results
Candidate Genes for Cellular Senescence-Associated Biomarkers in OA
First, we merged four OA-related datasets (GSE55235, GSE55457, GSE82107, and GSE12021) by removing the batch effect with the “sva” package. The expression box plot and PCA result of pre- and post-standardized were exhibited in Supplementary Figure 1A–D. Combined with Q-Q plot (Supplementary Figure 1), these results indicated that cross-platform normalization successfully removed the batch effect. The merged dataset contained 36 control samples and 40 OA samples. WGCNA was then implemented using the combined dataset. First, sample cluster analysis removed no outliers (Figure 1A). Five was selected as the ideal soft threshold (R2=0.85) to maximise scale-free gene interactions (Figure 1B). Next, 10 modules were created using a gene clustering tree and dynamic tree cutting technique (Figure 1C and D). Based on absolute correlation coefficients larger than 0.5, we chose the MEturquoise, MEbrown, and MEyellow modules as important modules for disease OA (Figure 1E). Thus, important module genes were OA-related (Supplementary Figure 2).
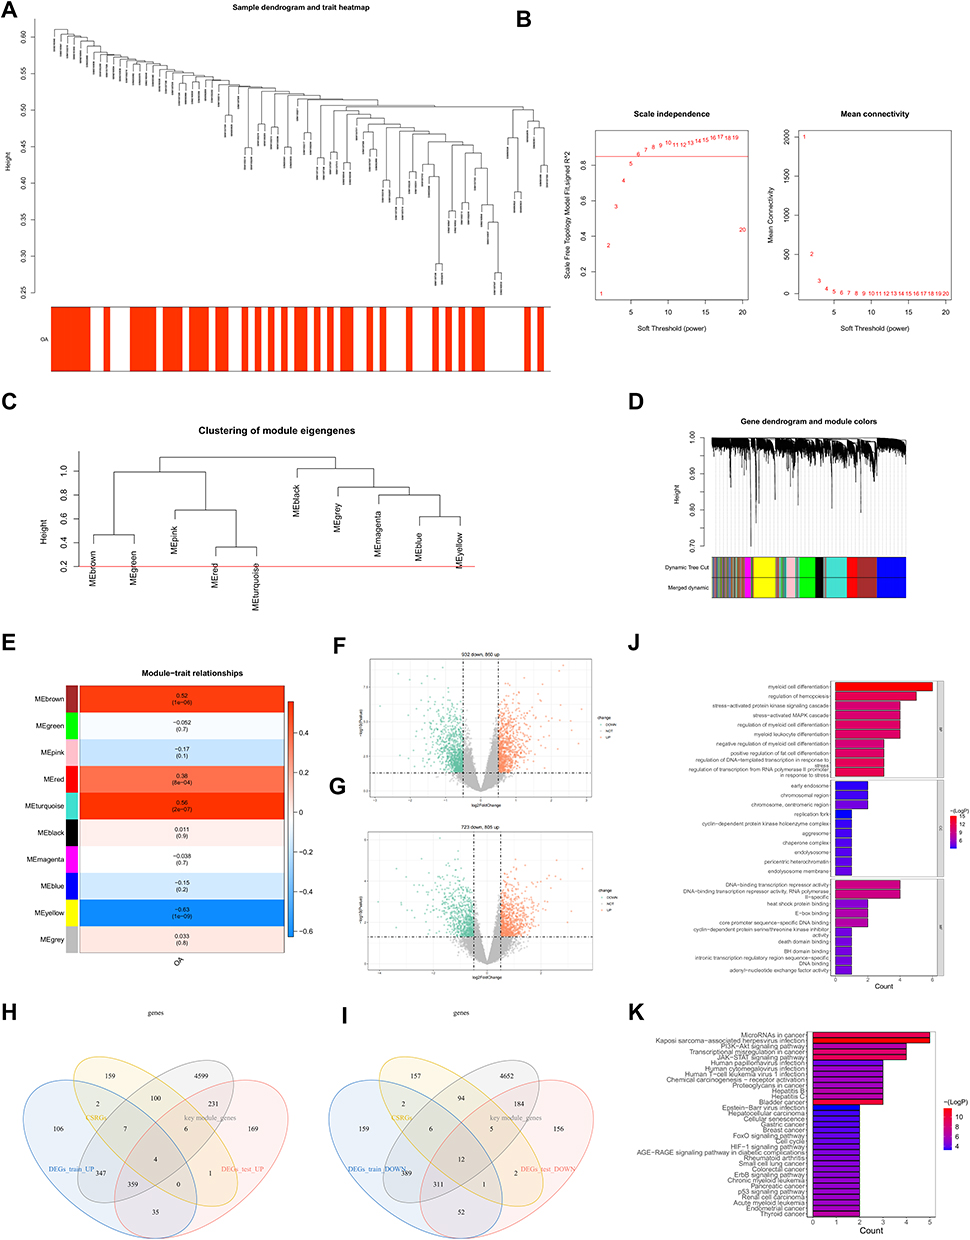 |
Figure 1 Candidate genes for cellular senescence-associated biomarkers in Osteoarthritis. Clustering diagram of merged dataset samples (A). Soft threshold analysis showed that gene associations were most consistent with the scale-free distribution when β = 5 (B). Clustering dendrogram of genes, dissimilarity based on the topological overlap, and assigned merged module colors and original module colors. (C and D). Heatmap of the relevance between gene modules and osteoarthritis (E). The training set on the differentially expressed genes screened under the conditions of | log2FC |>0.5 and p value<0.05. The red dot is the gene up-regulated, and the green dot is the gene down-regulated (F). The testing set on the differentially expressed genes screened under the conditions of | log2FC |>0.5 and p value<0.05. The red dot is the gene up-regulated, and the green dot is the gene down-regulated (G). Test set and training set (up-regulated gene and down-regulated gene) as well as OA-related gene and CSRG are displayed by overlapping Venn diagram. Four up-regulated genes and 12 down-regulated genes were screened (H and I). GO (J) and KEGG (K) enrichment analyses of 16 genes. |
Next, the merged dataset was divided into a training set and a validation set according to a 7:3 ratio. The training set contained 29 OA samples and 25 control samples. The validation set included 11 OA samples and 11 control samples. To mine the variably expressed OA-related genes, we then authenticated the differentially expressed genes (DEGs) between OA and control samples in the training set and testing set respectively. According to |log2FC| > 0.5 and p value < 0.05, a grand total of 1792 DEGs (OA vs control), including 860 up-regulated and 932 down-regulated genes in the OA samples, were identified in the training set (Figure 1F). Meanwhile, 1528 DEGs (OA vs control), including 805 up-regulated and 723 down-regulated genes in the synovial tissue of OA samples, were uncovered in the testing set (Figure 1G). In the following, we overlapped the DEGs, OA-related genes, and CSRGs. Sixteen DE-CSRGs associated with OA, including four intersecting up-regulated genes (Figure 1H) and twelve intersecting down-regulated genes (Figure 1I), namely EPHA3, TLR3, ZMAT3, TNFSF13, BCL6, MCL1, MYC, SLC16A7, VEGFA, ZFP36, PIM1, CEBPB, CDKN1A, BAG3, CYR61, and SNAI1, were identified as the candidate genes for cellular senescence-associated biomarkers in the synovial tissue of OA. Functional enrichment analysis was used to investigate these 16 genes. 770 GO items (714 BP, 10 CC, and 46 MF) and 33 KEGG pathways (Figure 1J) were generated. The bar chart showed the top 10 GO items per categorization (Figure 1K). We noted that these genes involved many cell differentiation-related and immune-related biological processes. For KEGG pathways, these DE-CSRGs from the synovial tissue associated with OA were linked to the “JAK-STAT signaling pathway”, “PI3K-Akt signaling pathway”, “p53 signaling pathway”, “ErbB signaling pathway”, “Rheumatoid arthritis”, “HIF-1 signaling pathway”, “Cell cycle”, “FoxO signaling pathway”, and “Cellular senescence”.
Cellular Senescence-Associated Biomarkers in OA
To further recognize cellular senescence-associated biomarkers in OA, we immediately executed machine learning analysis based on 16 candidate genes in the training set. As shown in Figure 2A and B, five genes (BCL6, MCL1, SLC16A7, PIM1, and EPHA3) were picked out by LASSO logistic regression. Meanwhile, nine genes (MCL1, EPHA3, PIM1, ZFP36, BAG3, SLC16A7, MYC, CEBPB, and BCL6) were selected by SVM-RFE model (Figure 2C and D). Hence, five overlapping genes (BCL6, MCL1, SLC16A7, PIM1, and EPHA3) were obtained by crossing the genes filtered by two machine learning methods. Next, we analyzed the diagnostic ability of the 5 genes as a whole in the training set, test set, and external validation set GSE51588. The ROC curves showed that the AUC values of the 5 genes as a whole were 0.975, 1, and 1 in the training set, test set, and external validation set, respectively, showing a powerful ability to distinguish OA samples from normal samples (Figure 2E–G). ROC curves of each gene were graphed for the training and testing datasets to evaluate the five genes’ diagnostic usefulness. The area under the curve (AUC) values of each gene surpassed 0.8, indicating that their expression could identify osteoarthritis (OA) samples from normal ones (Figure 2H and I). To further confirm the credibility of the above results, we created the corresponding ROC curves in the external validation set GSE51588. The AUC values of the ROC curves were all greater than 0.6, manifesting the tolerable ability to distinguish OA samples from normal samples (Figure 2J). Therefore, we defined these five genes as cellular senescence-associated biomarkers in OA.
 |
Figure 2 Optimization algorithm for screening important Cellular senescence-associated biomarkers in OA. The 16 candidate genes previously screened were calculated using LASSO logistic regression analysis (A and B). SVM-RFE machine learning algorithm to select genes corresponding to the smallest classifier error as candidate key genes (C and D). ROC curves of 5 genes as a whole in the training set (E), test set (F) and external validation set (GSE51588) (G). The ROC curves of the single gene in the training set and testing set (H and I). The ROC curves of the single gene in the external validation set (J). |
The OA Diagnostic Model Consisting of Cellular Senescence-Associated Biomarkers
Based on the five identified cellular senescence-associated biomarkers of OA, a nomogram for predicting the probability of disease, ie, a diagnostic model, was created (Figure 3A). The expression of each biomarker corresponds to a score, and the total score of the five biomarkers is used to estimate the risk of the sample developing OA. The higher the score, the greater the risk of developing the disease. The calibration curve revealed that the difference between the predicted and observed probabilities of disease was quite small, indicating that the nomogram performed satisfactorily (Figure 3B). In addition, the DCA curves also indicated that the nomogram model consisting of five genes had a higher benefit rate than individual genes (Figure 3C).
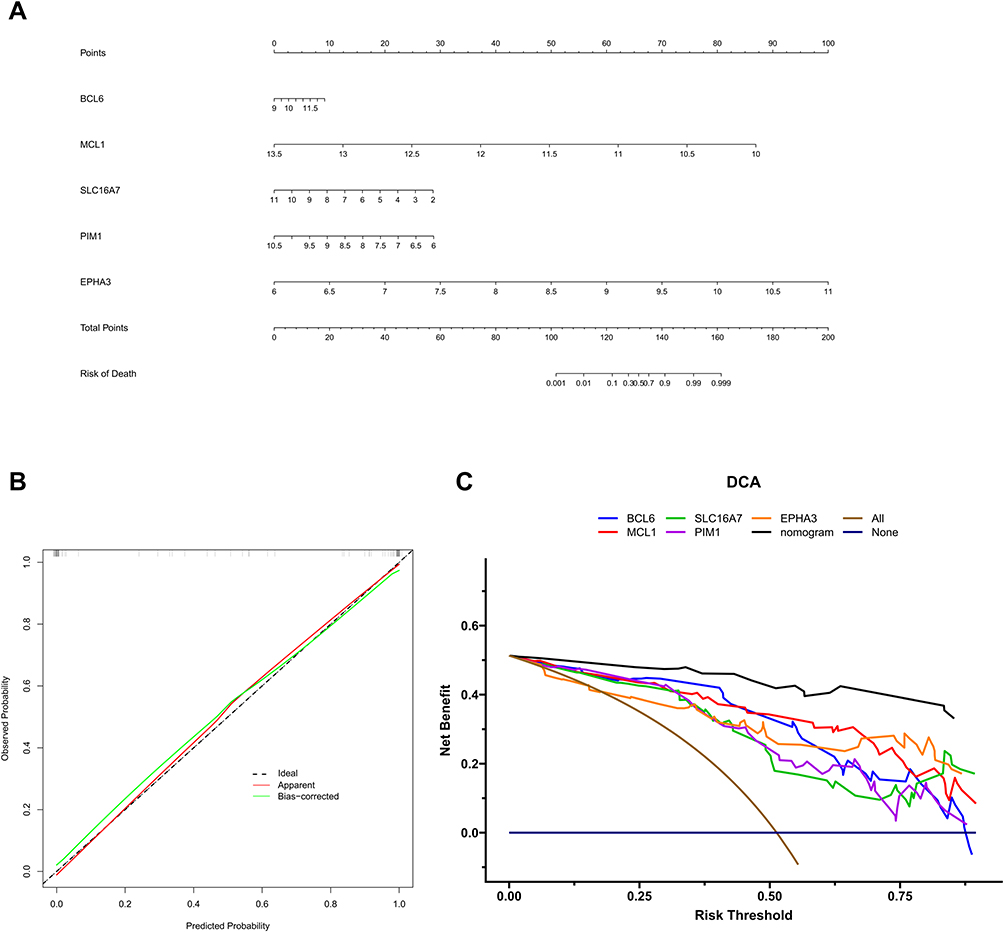 |
Figure 3 Diagnostic model for OA. Based on the five biomarkers obtained from the above analysis, a line graph of the biomarkers was constructed (A). Calibration curve of 5 genes (B). The decision curves show the predictive power of the line graph prediction model, with different coloured curves representing different genes and black curves representing the nomogram model (C). |
Single-Gene GSEA
To explore the molecular mechanisms of cellular senescence-associated biomarkers in OA, we performed the single-gene GSEA based on GO, KEGG, and Reactome gene sets. The top 10 GO items, KEGG pathways, and Reactome pathways enriched by each gene were displayed in Figure 4 and Supplementary Figure 3. All five genes were related to “Oxidative phosphorylation”. Meanwhile, all five biomarkers were associated with some immune-related pathways, including Toll-Like Receptor Cascade, IL-17 signaling pathway, TNF signaling pathway, and NF-kappa B signaling pathway.
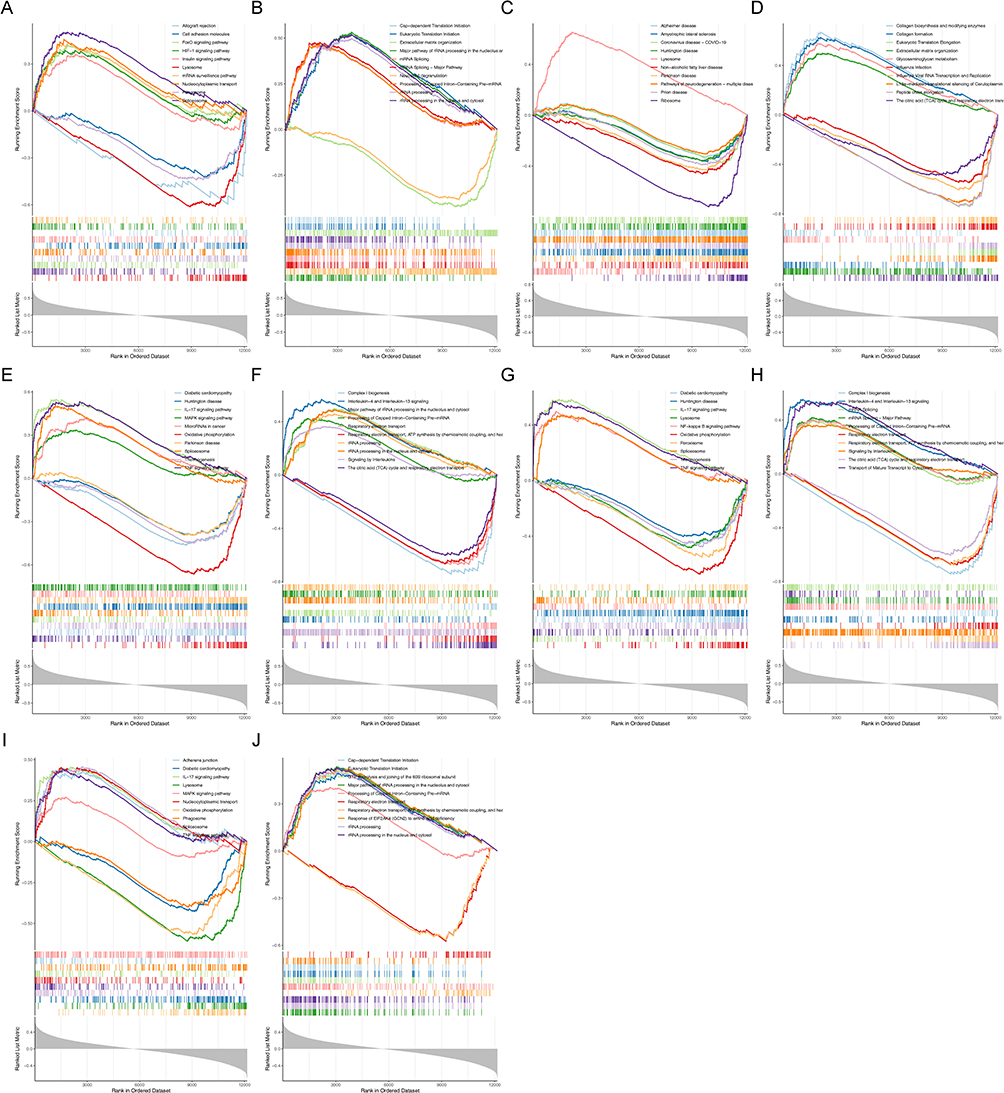 |
Figure 4 Single-gene GSEA based on KEGG, and reactome gene sets. KEGG results for BCL6 (A). Reactome gene results for BCL6 (B). KEGG results for EPHA3 (C). Reactome gene results for EPHA3 (D). KEGG results for MCL1 (E). Reactome gene results for MCL1 (F). KEGG results for PIM1 (G). Reactome gene results for PIM1 (H). KEGG results for SLC16A7 (I). Reactome gene results for SLC16A7 (J). |
The Relevance of Cellular Senescence-Associated Biomarkers to Immune Cells in OA
Since all five cellular senescence-associated biomarkers were linked to immune-related pathways, we then probed the relationship between cellular senescence-associated biomarkers and immune cells in OA. We first compared the infiltration level of 22 immune cell types between OA samples and control samples through the CIBERSORT method. The proportion of each immune cell in each sample was shown in the bar stack (Figure 5A). The violin plot manifested that the fraction of T cells CD4 memory resting, NK cells activated, Dendritic cells activated, Mast cells activated, and Neutrophils in OA samples were significantly lower than control samples, and the fraction of B cells memory, Plasma cells, and Mast cells resting in OA samples were significantly higher than control samples (Figure 5B). The Pearson correlation coefficient was then used to determine the relationship between differential immune cells and indicators of cellular senescence. As illustrated in Figure 5C–H, on the basis of |correlation coefficient|>0.3 and p value<0.05, all five biomarkers were notably correlated with T cells CD4 memory resting and Mast cells resting. BCL6 and MCL1 were prominently correlated with NK cells activated. BCL6 was significantly correlated with dendritic cells activated. BCL6, MCL1, SLC16A7, and PIM1 were significantly correlated with Mast cells activated.
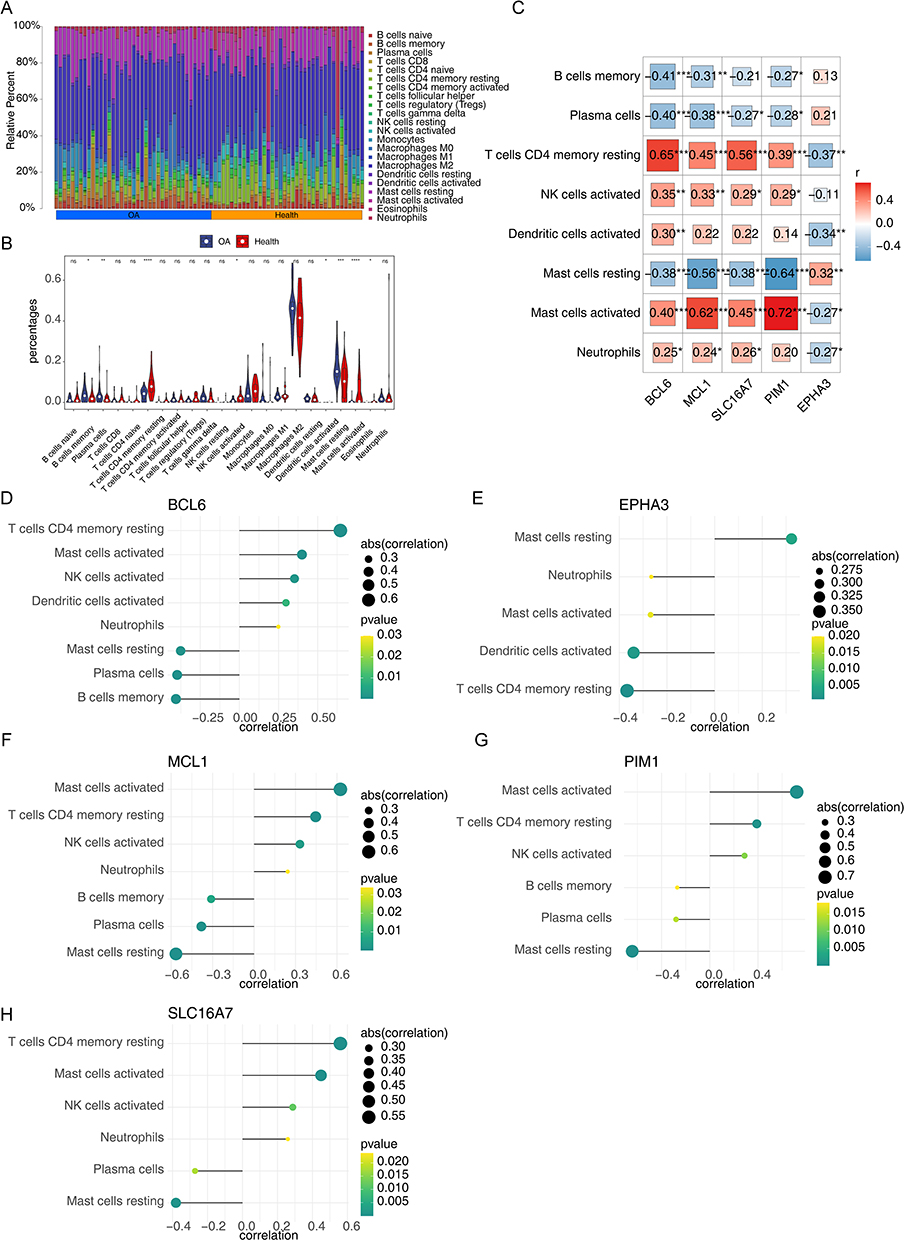 |
Figure 5 The relevance of cellular senescence-associated biomarkers to immune cells in OA. The composition of 22 kinds of immune cells in each sample showed in a histogram (A). The violin plot manifested that significantly different infiltrates of immune cells in OA (B). Analysis of differential immune cell and model gene correlations (C). Relationship between immune cells and 5 genes (BCL6, MCL1, SLC16A7, and PIM1) (D–H). *p<0.05; **p<0.01; ***p<0.001; ****p<0.0001. Abbreviation: ns, not significant. |
OA lncRNA-miRNA-mRNA and Gene-Drug Networks Based on Cellular Senescence-Associated Biomarkers
To further probe the upstream regulatory mechanisms of biomarkers, we predicted 15 shared miRNAs targeting five biomarkers from the miRDB and StarBase database (Supplementary Figure 4A). Next, we predicted 323 shared lncRNAs targeting the 15 miRNAs from the Starbase and miNET database (Supplementary Figure 4B). The intracellular localization of 323 lncRNAs was identified through the lncATLAS database, of which 60 lncRNAs located in the cytoplasm were included in the subsequent lncRNA-miRNA-mRNA network construction (Supplementary Figure 5). Finally, a lncRNA-miRNA-mRNA network with 80 nodes (5 mRNAs, 15 miRNAs, and 60 lncRNAs) and 168 edges was generated using Cytoscape (Figure 6A). The relationship pairs in the lncRNA-miRNA-mRNA network were also exhibited in a Sankey diagram (Figure 6B).
 |
Figure 6 The regulating mechanisms of 5 biomarkers. The lncRNA-miRNA-mRNA network was generated using Cytoscape (A). The relationship network between 5 genes and targeted drugs extracted from the CellMiner database (B). Gene-drug network containing 5 nodes and 26 edges (C). |
To initially explore potential drugs targeting the five cellular senescence -associated biomarkers, we predicted 12 drugs targeting PIM1, 7 drugs targeting BCL6, 3 drugs targeting MCL1, 2 drugs targeting EPHA3, and 2 drugs targeting SLC16A7 through the CellMiner database. Ultimately, we constructed a gene-drug network containing 5 nodes and 26 edges (Figure 6C). In this network, vorinostat targeted PIM1.
Verification the Expression of Cellular Senescence-Associated Biomarkers in External Dataset
As illustrated in Figure 7A and B, BCL6, MCL1, SLC16A7, and PIM1were down-regulated in OA samples compared to control samples, and EPHA3 was up-regulated in OA samples compared to control samples in the training set and testing set. We further confirmed the expression in the external dataset (GSE51588). Consistent with the results of the training and testing sets, the expression of SLC16A7 and PIM1 were notably decreased in OA samples and EPHA3 was significantly up-regulated in OA samples compared to control samples (Figure 7C). Probably due to sample heterogeneity, the expression differences of BCL6 and MCL1 between OA samples and control samples were not significant, but there was a trend of decreasing expression in OA samples (Figure 7C).
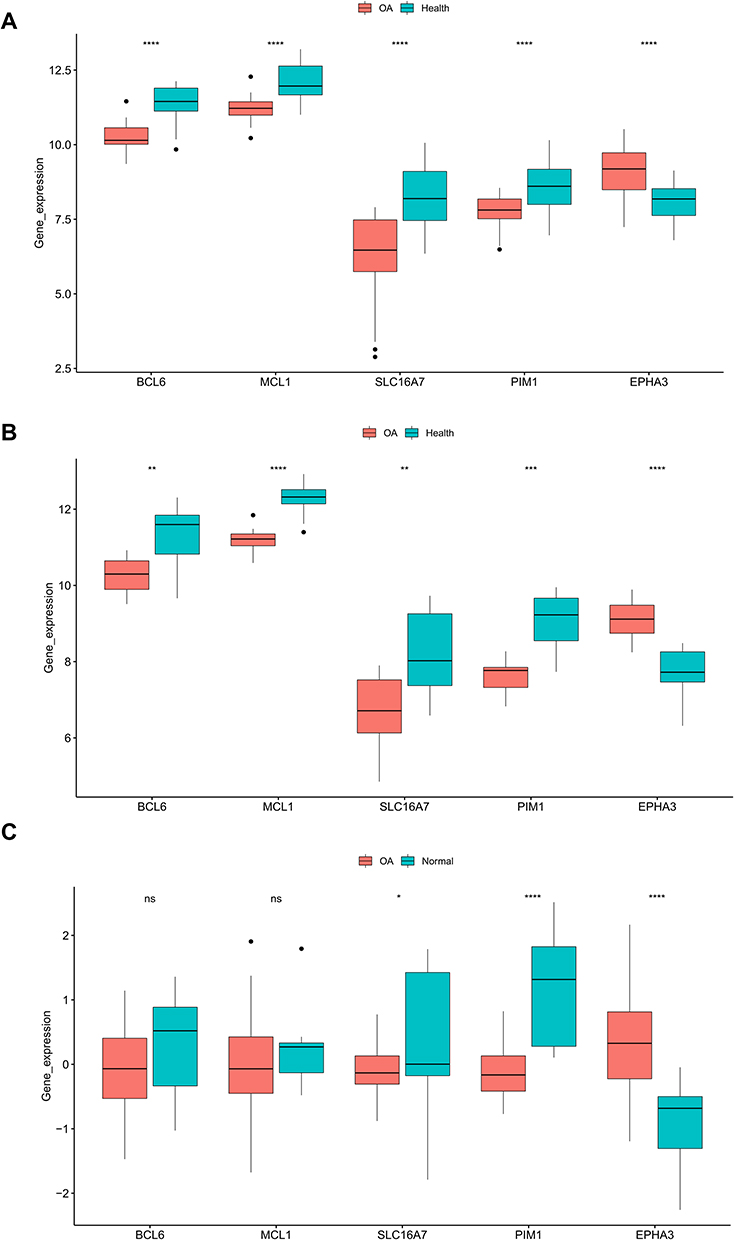 |
Figure 7 Gene expression in the OA group compared with the standard group. In the training set (A) and test set (B), compared with the normal group, the expression of five genes in the OA group. Verification of critical gene expression in the external validation set (C). *p<0.05; **p<0.01; ***p<0.001; ****p<0.0001. Abbreviation: ns, not significant. |
In vivo Verification of Key Genes
In addition, we also provided the RT-PCR results of the five hub genes (Figure 8). Compared to the healthy group, EPHA3 was expressed in the osteoarthritis group at higher levels, while BCL6, MCL1 SLC16A7, and PIM1 were expressed at lower. This result was consistent with the bioinformatics analysis.
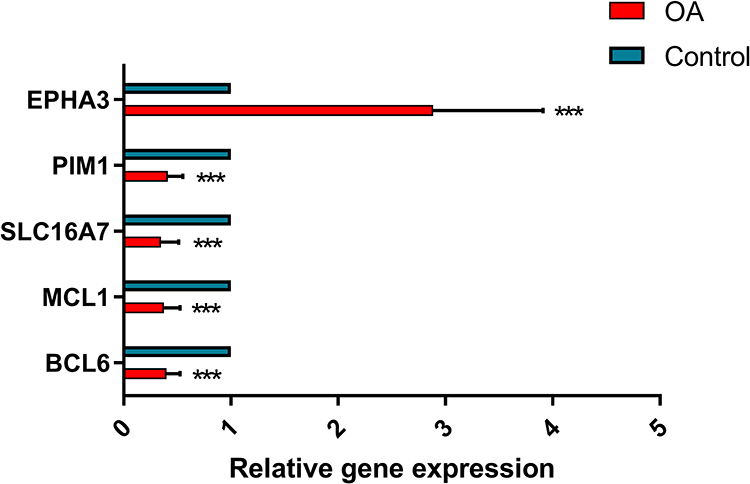 |
Figure 8 In vivo verification of key genes. The PCR experiments were used to analyse the relative expression of key genes in osteoarthritic tissues. Compared to the healthy group, EPHA3 was expressed in the osteoarthritis group at higher levels, while BCL6, MCL1 SLC16A7, and PIM1 were expressed at lower. ns, not significant; ***p<0.001. |
In vitro Validation of Key Genes
The relative expression of PIM1 in the oe-PIM1 group was shown to be significantly higher than that in the oe-NC group by q-PCR analysis (Figure 9A). The CCK8 assay indicated that PIM1 enhances the proliferative capacity of RPKFCL cell line (Figure 9B). The Live/Dead Cell kit suggested that PIM1 enhances the Viability of the RPKFCL cell line (Figure 9C). The cellular senescence analysis revealed that PIM1 enhances the proliferative capacity of RPKFCL (Figure 9D). The clone formation experiments demonstrated that PIM1 improves the proliferation of single cells of RPKFCL cell line (Figure 9E). Transwell assay displayed that PIM1 enhances the migration ability of RPKFCL cell line (Figure 9F).
 |
Figure 9 In vitro validation of PIM1. The relative expression of PIM1 was significantly higher in the oe-PIM1 group (A). The CCK8 assay (B). The Cell viability assay (C). The cellular senescence analysis (D). The clone formation experiment (E). Transwell assay (F). *p<0.05; **p<0.01; ***p<0.001. |
Discussion
With rapid advances in sequencing and computer technology, bioinformatics analysis has improved our understanding of the underlying mechanisms associated with complex diseases. Approximately 60% elderly and 10–15% young are afflicted by osteoarthritis disease, and aging is closely associated with the onset and progression of OA.31 Therefore, this study identifies cellular senescence-related biomarkers of OA and preliminarily explores their mechanisms of action and targeting agents.
First, we identified 16 differentially expressed cellular senescence-associated genes associated with OA by differential expression analysis and WGCNA. Functional enrichment results showed that these genes are associated with many immune-related biological processes, suggesting that the immune response may play an important role in OA.32 In addition, these genes are also enriched in the JAK-STAT signaling pathway, PI3K-Akt signaling pathway, HIF-1 signaling pathway, cell cycle, and cellular senescence KEGG pathways.33 Studies have shown that the PI3K/AKT pathway is associated with the development of OA and changes in the extracellular matrix and that PI3K/AKT/mTOR signaling plays a vital role in OA cartilage degeneration and synovial inflammation. The critical role of the JAK-STAT signaling pathway in the senescence of cartilage-derived stem/progenitor cells (CSPCs) has been demonstrated, and the senescence of CSPCs may promote the development of OA.34 The articular cartilage microenvironment is in a hypoxic state, and the hypoxia-inducible factor (HIF-1α) signaling pathway also has an important role in the development of OA and is critical to tissue homeostasis.35 Cell senescence is a state of cell cycle arrest induced by cell stress and is related to the occurrence of OA.19,20 Therefore, we infer that 16 differentially expressed cellular senescence-related genes related to OA mediate the occurrence of OA through the above pathways.
Then, five biomarkers related to cell senescence were finally determined through machine learning, including BCL6, MCL1, SLC16A7, PIM1, and EPHA3. BCL6 (BCL6 transcription inhibitor) is related to the aging of human fibroblasts.36 The findings of our investigation revealed a decrease in BCL6 levels in individuals with osteoarthritis. BCL6, a member of the POZ/BTB-zinc finger protein family, has been demonstrated to enhance the production of chondrocytes and plays a crucial role in controlling the differentiation of osteoblasts and maintaining bone balance. Deficiency of BCL6 results in heightened osteoclast genesis.37,38 MCL1 was significantly reduced in OA in this study. MCL1 (MCL1 apoptosis regulator, a member of the BCL2 family) is an anti-apoptotic molecule essential for the survival of lymphocytes, macrophages, and synovial fibroblasts.39 The study demonstrated that reducing MCL1 expression hinders the PI3K/Akt signaling pathway, enhances the inflammatory response, and induces death in chondrocytes affected by osteoarthritis.40,41 PIM1, a member of the pim gene family, is a crucial regulator of apoptosis, differentiation, proliferation, and tumorigenesis. Pim-1 enhances cell proliferation and differentiation by directly phosphorylating Cdc25C to facilitate the G2/M transition of the cell cycle.42,43 PIM diminishes the extent of airway inflammation in mice and enhances the viability of Human bronchial epithelial BEAS-2B cells.44 Various studies indicate that PIM1 is linked to cellular senescence, PIM1 preserves the integrity and structure of mitochondria by increasing the levels of anti-apoptotic proteins. This process may promote cell proliferation, survival, metabolic activity, and counteract senescence.45–48 However, there is a lack of relevant studies on Pim-1 in osteoarthritis. Our study revealed that PIM1 enhanced the viability, proliferative capacity, and migratory ability of RPKFCL cells and reduced cellular senescence. EPHA3 has been reported to promote a variety of tumours, however osteoarthritis is unclear.49,50 However, the relationship between these five cellular senescence-associated genes and OA has been poorly reported and further experimental studies are needed.51–53 We report for the first time that BCL6, MCL1, SLC16A7, PIM1, and EPHA3 are biomarkers associated with OA cellular senescence.
Previous studies have shown that aging is closely related to cellular immunity, and that deficiencies in the immune system accelerate the aging process.54,55 The single-sample GSEA results showed that these five genes might participate in immune-related pathways in the occurrence and progression of OA. Through the CIBERSORT algorithm, we found that T cell CD4 memory quiescence, NK cell activation, dendritic cell activation, mast cell activation, and neutrophil decrease, and B cell memory, plasma cell, and mast cell quiescence increase may be related to the occurrence of OA. Correlation analysis showed that BCL6 and MCL1 were significantly associated with NK cell activation. BCL6 was significantly associated with dendritic cell activation; BCL6, MCL1, SLC16A7, and PIM1 were significantly associated with mast cell activation. Previous studies have shown that NK cells and neutrophils play an essential role in experimental osteoarthritis and that the CXCL10/CXCR3 axis facilitates the interaction between the two.56 Dendritic cells play a vital role in the development and progression of inflammatory arthritis (IA).57 Nie et al find that increased Toll-like receptor expression in OA-derived dendritic cells contributes to inflammatory conditions.58 Increasingly studies have shown that mast cells play an important role in the pathophysiology of OA, including inflammation and cartilage destruction.59,60 However, further studies are needed to elucidate the interaction between these five cellular senescence-related biomarkers and the above immune cells.
The results of ROC curves showed that the combination of five biomarkers could clearly distinguish OA samples from normal samples. Therefore, we constructed a column line graph OA diagnostic model based on the expression of 5 genes. The expression amount of five biomarkers can score this nomogram, and this score can indicate the prevalence probability of the sample. The calibration curves indicate that the predictive accuracy of the column line graphs is high and can provide guidance for the diagnostic evaluation of OA.
We also constructed a lncRNA-miRNA-mRNA regulatory network of 5 biomarkers, which provides direction and basis for further study of the regulatory mechanisms of these 5 genes in OA. Current clinical medications for OA treatment, such as oral NSAIDs and glucosamine, are only used for pain relief and do not prevent or intervene in the progression of the disease, and thus treat it.61,62 We have identified five biomarkers and predicted 26 targeted drugs for potential targeted therapeutics. These drugs include AZD-3965, Imatinib, ABL-001, ARQ-087, BMN-673, AT-9283, Entosplenitib, Vemurafenib, Tandutinib, Brigatinib, Melphalan, Okadaic acid, ABT-199, AMONAFIDE, PD 184352, MPC-3100, CH-5132799, Copanlisib, Bosutinib, 5-aza-T-dCyd, Ulixertinib, Apitolisib, ABT-737, GDC-0084, Vorinostat, and GSK-2126458. Imatinib exhibits anti-inflammatory properties and inhibits synovial fibroblast proliferation.63,64 PD184352 acts as an anti-inflammatory and antioxidant, and it reduces osteoarthritis symptoms in mice. Vorinostat inhibits IL-6 signaling in chondrocytes, which is relevant to osteoarthritis.65 The relationship between the remaining 23 drugs and osteoarthritis is unclear, and further research is needed to explore their potential as targeted therapies for osteoarthritis.
Finally, we conducted RT-PCR to confirm the expression of BCL6, MCL1, SLC16A7, PIM1, and EPHA3 in the synovial tissue of osteoarthritis and healthy controls. Our findings are consistent with the results of the GEO dataset, where the expression levels of EPHA3 were significantly elevated in osteoarthritis, and the levels of BCL6, MCL1, SLC16A7, and PIM1 were significantly downregulated compared to healthy controls. Our results confirm the potential of the above genes as diagnostic markers for osteoarthritis.
Our study focused on bioinformatics analysis, and although five genes were validated by qRT-PCR, the relatively insufficient sample size may lead to bias, and future studies need to be supported and validated by more clinical samples and data. Second, the mechanism of action of the identified cellular senescence-related biomarkers in the onset and progression of OA requires further experimental studies. The clinical application value of the predicted drugs targeting the five biomarkers needs to be validated in further clinical trials.
Conclusion
We identified, for the first time, cellular senescence-related biomarkers in OA patients. We established corresponding diagnostic models, which can provide a reference for the clinical diagnosis and treatment of OA patients, as well as a basis for further understanding of the pathogenesis of OA.
Data Available Statement
The datasets used in this investigation are available in internet sources. Below, you can find the names of the repository/repositories together with their corresponding accession number(s). The provided URL leads to the National Centre for Biotechnology Information (NCBI) website, GSE55235, GSE55457, GSE82107, GSE12021, and GSE51588. Cellular senescence-related genes (CSRGs) can be download from CellAge database: https://genomics.senescence.info/cells/query.php. The original images of the cell experiments in the article can be accessed at the following link: 10.6084/m9.figshare.24328570
Ethics Statement
The studies involving human participants were reviewed and approved by the Institutional Ethical Committee of the Shandong Provincial Hospital Affiliated to Shandong First Medical University (ethical review number: SWYX: NO.2023-005). The patients/participants provided their written informed consent to participate in this study. The present study fulfils the requirements of the Declaration of Helsinki.
Funding
No fundings.
Disclosure
The authors declare that there is no conflict of interest.
References
1. Palazzo C, Nguyen C, Lefevre-Colau MM, Rannou F, Poiraudeau S. Risk factors and burden of osteoarthritis. Ann Phys Rehabil Med. 2016;59(3):134–138. PubMed PMID: 26904959. Epub 2016/02/26. eng. doi:10.1016/j.rehab.2016.01.006
2. Zhang Y, Jordan JM. Epidemiology of osteoarthritis. Clin Geriatr Med. 2010;26(3):355–369. PubMed PMID: 20699159. PMCID: PMC2920533. Epub 2010/08/12. eng. doi:10.1016/j.cger.2010.03.001
3. Hunter DJ, Schofield D, Callander E. The individual and socioeconomic impact of osteoarthritis. Nat Rev Rheumatol. 2014;10(7):437–441. PubMed PMID: 24662640. Epub 2014/03/26. eng. doi:10.1038/nrrheum.2014.44
4. Pettenuzzo S, Arduino A, Belluzzi E, et al. Biomechanics of chondrocytes and chondrons in healthy conditions and osteoarthritis: a review of the mechanical characterisations at the microscale. Biomedicines. 2023;11(7):1942. PubMed PMID: 37509581. PMCID: PMC10377681. Epub 2023/07/29. eng. doi:10.3390/biomedicines11071942
5. Murphy CA, Garg AK, Silva-Correia J, Reis RL, Oliveira JM, Collins MN. The meniscus in normal and osteoarthritic tissues: facing the structure property challenges and current treatment trends. Ann Rev Biomed Eng. 2019;21(1):495–521. PubMed PMID: 30969794. Epub 2019/04/11. eng. doi:10.1146/annurev-bioeng-060418-052547
6. Rousseau J, Garnero P. Biological markers in osteoarthritis. Bone. 2012;51(2):265–277. PubMed PMID: 22538364. Epub 2012/04/28. eng. doi:10.1016/j.bone.2012.04.001
7. Xia B, Di C, Zhang J, Hu S, Jin H, Tong P. Osteoarthritis pathogenesis: a review of molecular mechanisms. Calcif Tissue Int. 2014;95(6):495–505. PubMed PMID: 25311420. PMCID: PMC4747051. Epub 2014/10/15. eng. doi:10.1007/s00223-014-9917-9
8. De Filippis L, Gulli S, Caliri A, et al. Epidemiologia e fattori di rischio dell’osteoartrosi: review della letteratura e dati dal progetto OASIS[Epidemiology and risk factors in osteoarthritis: literature review data from ”OASIS” study] Epidemiologia e fattori di rischio dell’osteoartrosi: review della letteratura e dati dal progetto OASIS. Reumatismo. 2004;56(3):169–184. Italian. Italian. doi:10.4081/reumatismo.2004.169
9. Che X, Chen T, Wei L, et al. MicroRNA‑1 regulates the development of osteoarthritis in a Col2a1‑Cre‑ERT2/GFPfl/fl‑RFP‑miR‑1 mouse model of osteoarthritis through the downregulation of Indian hedgehog expression. IntJ Mol Med. 2020;46(1):360–370. PubMed PMID: 32626917. PMCID: PMC7255451. Epub 2020/07/07. eng. doi:10.3892/ijmm.2020.4601
10. Sinusas K. Osteoarthritis: diagnosis and treatment. Am Family Phys. 2012;85(1):49–56. PubMed PMID: 22230308. Epub 2012/01/11. eng.
11. Katz JN, Arant KR, Loeser RF. Diagnosis and treatment of hip and knee osteoarthritis: a review. JAMA. 2021;325(6):568–578. PubMed PMID: 33560326. PMCID: PMC8225295. Epub 2021/02/10. eng. doi:10.1001/jama.2020.22171
12. Elsadek BEM, Abdelghany AA, Abd El-Aziz MA, et al. Validation of the diagnostic and prognostic values of ADAMTS5 and FSTL1 in osteoarthritis rat model. Cartilage. 2021;13(2_suppl):1263s–73s. PubMed PMID: 31177809. PMCID: PMC8804805. Epub 2019/06/11. eng. doi:10.1177/1947603519852405
13. Xia L, Gong N. Identification and verification of ferroptosis-related genes in the synovial tissue of osteoarthritis using bioinformatics analysis. Front Mol Biosci. 2022;9:992044. PubMed PMID: 36106017. PMCID: PMC9465169. Epub 2022/09/16. eng. doi:10.3389/fmolb.2022.992044
14. Han Y, Wu J, Gong Z, et al. Identification and development of a novel 5-gene diagnostic model based on immune infiltration analysis of osteoarthritis. J Transl Med. 2021;19(1):522. PubMed PMID: 34949204. PMCID: PMC8705150. Epub 2021/12/25. eng. doi:10.1186/s12967-021-03183-9
15. Liu Y, Lu T, Liu Z, et al. Six macrophage-associated genes in synovium constitute a novel diagnostic signature for osteoarthritis. Front Immunol. 2022;13:936606. PubMed PMID: 35967352. PMCID: PMC9368762. Epub 2022/08/16. eng. doi:10.3389/fimmu.2022.936606
16. López-Otín C, Blasco MA, Partridge L, Serrano M, Kroemer G. The hallmarks of aging. Cell. 2013;153(6):1194–1217. PubMed PMID: 23746838. PMCID: PMC3836174. Epub 2013/06/12. eng. doi:10.1016/j.cell.2013.05.039
17. He S, Sharpless NE. Senescence in health and disease. Cell. 2017;169(6):1000–1011. PubMed PMID: 28575665. PMCID: PMC5643029. Epub 2017/06/03. eng. doi:10.1016/j.cell.2017.05.015
18. McCulloch K, Litherland GJ, Rai TS. Cellular senescence in osteoarthritis pathology. Aging Cell. 2017;16(2):210–218. PubMed PMID: 28124466. PMCID: PMC5334539. Epub 2017/01/27. eng. doi:10.1111/acel.12562
19. Jeon OH, David N, Campisi J, Elisseeff JH. Senescent cells and osteoarthritis: a painful connection. J Clin Invest. 2018;128(4):1229–1237. PubMed PMID: 29608139. PMCID: PMC5873863 Unity Biotechnology, Buck Institute, Mayo Clinic, and Johns Hopkins and licensed to Unity Biotechnology (9,849,218 and 9,855,266). JHE is a consultant to, and ND and JC are founders of, Unity Biotechnology. Epub 2018/04/03. eng. doi:10.1172/JCI95147
20. Childs BG, Gluscevic M, Baker DJ, et al. Senescent cells: an emerging target for diseases of ageing. Nat Rev Drug Discov. 2017;16(10):718–735. PubMed PMID: 28729727. PMCID: PMC5942225. Epub 2017/07/22. eng. doi:10.1038/nrd.2017.116
21. Leek JT, Johnson WE, Parker HS, Jaffe AE, Storey JD. The sva package for removing batch effects and other unwanted variation in high-throughput experiments. Bioinformatics. 2012;28(6):882–883. PubMed PMID: 22257669. PMCID: PMC3307112. Epub 2012/01/20. eng. doi:10.1093/bioinformatics/bts034
22. Chen C, Grennan K, Badner J, et al. Removing batch effects in analysis of expression microarray data: an evaluation of six batch adjustment methods. PLoS One. 2011;6(2):e17238. PubMed PMID: 21386892. PMCID: PMC3046121. Epub 2011/03/10. eng. doi:10.1371/journal.pone.0017238
23. Langfelder P, Horvath S. WGCNA: an R package for weighted correlation network analysis. BMC Bioinf. 2008;9:559. PubMed PMID: 19114008. PMCID: PMC2631488. Epub 2008/12/31. eng. doi:10.1186/1471-2105-9-559
24. Ritchie ME, Phipson B, Wu D, et al. limma powers differential expression analyses for RNA-sequencing and microarray studies. Nucleic Acids Res. 2015;43(7):e47. PubMed PMID: 25605792. PMCID: PMC4402510. Epub 2015/01/22. eng. doi:10.1093/nar/gkv007
25. Wu T, Hu E, Xu S, et al. clusterProfiler 4.0: a universal enrichment tool for interpreting omics data. Innovation. 2021;2(3):100141. PubMed PMID: 34557778. PMCID: PMC8454663. Epub 2021/09/25. eng. doi:10.1016/j.xinn.2021.100141
26. Chen B, Khodadoust MS, Liu CL, Newman AM, Alizadeh AA. Profiling tumor infiltrating immune cells with CIBERSORT. Methods Mol Biol. 2018;1711:243–259. PubMed PMID: 29344893. PMCID: PMC5895181. Epub 2018/01/19. eng.
27. Shannon P, Markiel A, Ozier O, et al. Cytoscape: a software environment for integrated models of biomolecular interaction networks. Genome Res. 2003;13(11):2498–2504. PubMed PMID: 14597658. PMCID: PMC403769. Epub 2003/11/05. eng. doi:10.1101/gr.1239303
28. Zhou J, Zhang L, Wang M, et al. CPX targeting DJ-1 triggers ROS-induced cell death and protective autophagy in colorectal cancer. Theranostics. 2019;9(19):5577–5594. PubMed PMID: 31534504. PMCID: PMC6735393. Epub 2019/09/20. eng. doi:10.7150/thno.34663
29. Facchini A, Cetrullo S, D’Adamo S, et al. Hydroxytyrosol prevents increase of osteoarthritis markers in human chondrocytes treated with hydrogen peroxide or growth-related oncogene α. PLoS One. 2014;9(10):e109724. PubMed PMID: 25279550. PMCID: PMC4184903. Epub 2014/10/04. eng. doi:10.1371/journal.pone.0109724
30. Veronesi F, Contartese D, Borsari V, et al. Ageing and osteoarthritis synergically affect human synoviocyte cells: an in vitro study on sex differences. J Clin Med. 2022;11(23):7125. PubMed PMID: 36498698. PMCID: PMC9739144. Epub 2022/12/12. eng. doi:10.3390/jcm11237125
31. Jafri MA, Kalamegam G, Abbas M, et al. Deciphering the association of cytokines, chemokines, and growth factors in chondrogenic differentiation of human bone marrow mesenchymal stem cells using an ex vivo osteochondral culture system. Front Cell Develop Biol. 2019;7:380. PubMed PMID: 32010693. PMCID: PMC6979484. Epub 2020/02/06. eng. doi:10.3389/fcell.2019.00380
32. Chen J, Crawford R, Xiao Y. Vertical inhibition of the PI3K/Akt/mTOR pathway for the treatment of osteoarthritis. J Cell Biochem. 2013;114(2):245–249. PubMed PMID: 22930581. Epub 2012/08/30. eng. doi:10.1002/jcb.24362
33. Sun K, Luo J, Guo J, Yao X, Jing X, Guo F. The PI3K/AKT/mTOR signaling pathway in osteoarthritis: a narrative review. Osteoarthritis Cartilage. 2020;28(4):400–409. PubMed PMID: 32081707. Epub 2020/02/23. eng. doi:10.1016/j.joca.2020.02.027
34. Ji T, Chen M, Sun W, et al. JAK-STAT signaling mediates the senescence of cartilage-derived stem/progenitor cells. J Mol Histol. 2022;53(4):635–643. PubMed PMID: 35716329. Epub 2022/06/19. eng. doi:10.1007/s10735-022-10086-6
35. Fernández-Torres J, Martínez-Nava GA, Gutiérrez-Ruíz MC, Gómez-Quiroz LE, Gutiérrez M. Role of HIF-1α signaling pathway in osteoarthritis: a systematic review. Rev Bras Reumatol. 2017;57(2):162–173. PubMed PMID: 28343622. Epub 2017/03/28. eng por. doi:10.1016/j.rbre.2016.07.008
36. Chen J, Wang M, Guo M, Xie Y, Cong Y-S, Navarro A. miR-127 regulates cell proliferation and senescence by targeting BCL6. PLoS One. 2013;8(11):e80266. PubMed PMID: 24282530. PMCID: PMC3840165. Epub 2013/11/28. eng. doi:10.1371/journal.pone.0080266
37. Ishii R, Kami D, Toyoda M, et al. Placenta to cartilage: direct conversion of human placenta to chondrocytes with transformation by defined factors. Mol Biol Cell. 2012;23(18):3511–3521. PubMed PMID: 22833560. PMCID: PMC3442400. Epub 2012/07/27. eng. doi:10.1091/mbc.e11-10-0869
38. Miyauchi Y, Ninomiya K, Miyamoto H, et al. The Blimp1-Bcl6 axis is critical to regulate osteoclast differentiation and bone homeostasis. J Exp Med. 2010;207(4):751–762. PubMed PMID: 20368579. PMCID: PMC2856022. Epub 2010/04/07. eng. doi:10.1084/jem.20091957
39. Liu H, Eksarko P, Temkin V, et al. Mcl-1 is essential for the survival of synovial fibroblasts in rheumatoid arthritis. J Immunol. 2005;Vol. 175(12):8337–8345. PubMed PMID: 16339575. Epub 2005/12/13. eng.
40. Xiong S, Zhao Y, Xu T. DNA methyltransferase 3 beta mediates the methylation of the microRNA-34a promoter and enhances chondrocyte viability in osteoarthritis. Bioengineered. 2021;12(2):11138–11155. PubMed PMID: 34783292. PMCID: PMC8810119. Epub 2021/11/17. eng. doi:10.1080/21655979.2021.2005308
41. Wu DM, Hong XW, Wen X, et al. Retracted: MCL1 gene silencing promotes senescence and apoptosis of glioma cells via inhibition of the PI3K/Akt signaling pathway. IUBMB Life. 2019;71(1):81–92. PubMed PMID: 30296359. Epub 2018/10/09. eng. doi:10.1002/iub.1944
42. Asati V, Mahapatra DK, Bharti SK. PIM kinase inhibitors: structural and pharmacological perspectives. Eur J Med Chem. 2019;172:95–108. PubMed PMID: 30954777. Epub 2019/04/08. eng. doi:10.1016/j.ejmech.2019.03.050
43. Zhao Y, Aziz AUR, Zhang H, Zhang Z, Li N, Liu B. A systematic review on active sites and functions of PIM-1 protein. Hum Cell. 2022;35(2):427–440. PubMed PMID: 35000143. Epub 2022/01/10. eng. doi:10.1007/s13577-021-00656-3
44. de Vries M, Heijink IH, Gras R, et al. Pim1 kinase protects airway epithelial cells from cigarette smoke-induced damage and airway inflammation. Am J Physiol Lung Cell Mol Physiol. 2014;307(3):L240–51. PubMed PMID: 24816488. Epub 2014/05/13. eng. doi:10.1152/ajplung.00156.2013
45. Tursynbay Y, Zhang J, Li Z, et al. Pim-1 kinase as cancer drug target: an update. Biomed Rep. 2016;4(2):140–146. PubMed PMID: 26893828. PMCID: PMC4734217. Epub 2016/02/20. eng. doi:10.3892/br.2015.561
46. Ebeid DE, Khalafalla FG, Broughton KM, et al. Pim1 maintains telomere length in mouse cardiomyocytes by inhibiting TGFβ signalling. Cardiovasc Res. 2021;117(1):201–211. PubMed PMID: 32176281. PMCID: PMC7797214. Epub 2020/03/17. eng. doi:10.1093/cvr/cvaa066
47. Samse K, Emathinger J, Hariharan N, et al. Functional effect of pim1 depends upon intracellular localization in human cardiac progenitor cells. J Biol Chem. 2015;290(22):13935–13947. PubMed PMID: 25882843. PMCID: PMC4447967. Epub 2015/04/18. eng. doi:10.1074/jbc.M114.617431
48. Del Re DP, Sadoshima J. Enhancing the potential of cardiac progenitor cells: pushing forward with Pim-1. Circ Res. 2012;110(9):1154–1156. PubMed PMID: 22539751. PMCID: PMC3350802. Epub 2012/04/28. eng. doi:10.1161/CIRCRESAHA.112.269183
49. Janes PW, Slape CI, Farnsworth RH, Atapattu L, Scott AM, Vail ME. EphA3 biology and cancer. Growth Factors. 2014;32(6):176–189. PubMed PMID: 25391995. Epub 2014/11/14. eng.
50. La Rocca F, Airoldi I, Di Carlo E, et al. EphA3 targeting reduces in vitro adhesion and invasion and in vivo growth and angiogenesis of multiple myeloma cells. Cell Oncol. 2017;40(5):483–496. PubMed PMID: 28721629. Epub 2017/07/20. eng. doi:10.1007/s13402-017-0338-4
51. Jin B, Wang Y, Wu CL, Liu KY, Chen H, Mao ZB. PIM-1 modulates cellular senescence and links IL-6 signaling to heterochromatin formation. Aging Cell. 2014;13(5):879–889. PubMed PMID: 25040935. PMCID: PMC4331745. Epub 2014/07/22. eng. doi:10.1111/acel.12249
52. Yang J, Liu K, Yang J, et al. PIM1 induces cellular senescence through phosphorylation of UHRF1 at Ser311. Oncogene. 2017;36(34):4828–4842. PubMed PMID: 28394343. Epub 2017/04/11. eng. doi:10.1038/onc.2017.96
53. Wu W, Yu A, Chen K, et al. The oncogene PIM1 contributes to cellular senescence by phosphorylating Staphylococcal Nuclease Domain-containing protein 1 (SND1). Med Sci Monit. 2019;25:8651–8659. PubMed PMID: 31860636. PMCID: PMC6876065. Epub 2019/12/21. eng. doi:10.12659/MSM.917867
54. Gill Z, Nieuwoudt M, Ndifon W. The hayflick limit and age-related adaptive immune deficiency. Gerontology. 2018;64(2):135–139. doi:10.1159/000478091
55. Covarrubias AJ, Perrone R, Grozio A, Verdin E. NAD(+) metabolism and its roles in cellular processes during ageing. Nat Rev Mol Cell Biol. 2021;22(2):119–141. doi:10.1038/s41580-020-00313-x
56. Benigni G, Dimitrova P, Antonangeli F, et al. CXCR3/CXCL10 Axis Regulates Neutrophil-NK Cell Cross-Talk Determining the Severity of Experimental Osteoarthritis. J Immunol. 2017;198(5):2115–2124. PubMed PMID: 28108560. Epub 2017/01/22. eng.
57. Marzaioli V, Canavan M, Floudas A, et al. CD209/CD14(+) dendritic cells characterization in rheumatoid and psoriatic arthritis patients: activation, synovial infiltration, and therapeutic targeting. Front Immunol. 2021;12:722349. PubMed PMID: 35095831. PMCID: PMC8789658. Epub 2022/02/01. eng. doi:10.3389/fimmu.2021.722349
58. Nie F, Ding F, Chen B, Huang S, Liu Q, Xu C. Dendritic cells aggregate inflammation in experimental osteoarthritis through a toll-like receptor (TLR)-dependent machinery response to challenges. Life Sci. 2019;238:116920. PubMed PMID: 31610189. Epub 2019/10/15. eng. doi:10.1016/j.lfs.2019.116920
59. Nigrovic PA, Lee DM. Synovial mast cells: role in acute and chronic arthritis. Immunol Rev. 2007;217(1):19–37. PubMed PMID: 17498049. Epub 2007/05/15. eng. doi:10.1111/j.1600-065X.2007.00506.x
60. de Lange-Brokaar BJ, Ioan-Facsinay A, van Osch GJ, et al. Synovial inflammation, immune cells and their cytokines in osteoarthritis: a review. Osteoarthritis Cartilage. 2012;20(12):1484–1499. PubMed PMID: 22960092. Epub 2012/09/11. eng. doi:10.1016/j.joca.2012.08.027
61. Zhang W, Ouyang H, Dass CR, Xu J. Current research on pharmacologic and regenerative therapies for osteoarthritis. Bone Res. 2016;4:15040. PubMed PMID: 26962464. PMCID: PMC4772471. Epub 2016/03/11. eng. doi:10.1038/boneres.2015.40
62. Graverand-Gastineau MP L. Disease modifying osteoarthritis drugs: facing development challenges and choosing molecular targets. Current Drug Targets. 2010;11(5):528–535. PubMed PMID: 20199396. Epub 2010/03/05. eng. doi:10.2174/138945010791011893
63. Kumari A, Silakari O, Singh RK. Recent advances in colony stimulating factor-1 receptor/c-FMS as an emerging target for various therapeutic implications. Biomed Pharmacothe. 2018;103:662–679. PubMed PMID: 29679908. Epub 2018/04/22. eng. doi:10.1016/j.biopha.2018.04.046
64. Berger MG, Pereira B, Rousselot P, et al. Longer treatment duration and history of osteoarticular symptoms predispose to tyrosine kinase inhibitor withdrawal syndrome. Br J Haematol. 2019;187(3):337–346. PubMed PMID: 31271217. Epub 2019/07/05. eng. doi:10.1111/bjh.16083
65. Singh CK, Nihal M, Ahmad N. Histone Deacetylase inhibitory approaches for the management of osteoarthritis. Am J Pathol. 2016;186(10):2555–2558. PubMed PMID: 27560709. PMCID: PMC5037642. Epub 2016/08/26. eng. doi:10.1016/j.ajpath.2016.08.001
 © 2024 The Author(s). This work is published and licensed by Dove Medical Press Limited. The full terms of this license are available at https://www.dovepress.com/terms.php and incorporate the Creative Commons Attribution - Non Commercial (unported, v3.0) License.
By accessing the work you hereby accept the Terms. Non-commercial uses of the work are permitted without any further permission from Dove Medical Press Limited, provided the work is properly attributed. For permission for commercial use of this work, please see paragraphs 4.2 and 5 of our Terms.
© 2024 The Author(s). This work is published and licensed by Dove Medical Press Limited. The full terms of this license are available at https://www.dovepress.com/terms.php and incorporate the Creative Commons Attribution - Non Commercial (unported, v3.0) License.
By accessing the work you hereby accept the Terms. Non-commercial uses of the work are permitted without any further permission from Dove Medical Press Limited, provided the work is properly attributed. For permission for commercial use of this work, please see paragraphs 4.2 and 5 of our Terms.