Back to Journals » Psychology Research and Behavior Management » Volume 14
Risky Decision-Making and Hazard Prediction are Negatively Related and Could Be Assessed Independently Using Driving Footage
Authors Castro C ![]() , Ventsislavova P
, Ventsislavova P ![]() , Garcia-Fernandez P
, Garcia-Fernandez P ![]() , Crundall D
, Crundall D
Received 12 February 2021
Accepted for publication 1 April 2021
Published 24 June 2021 Volume 2021:14 Pages 857—876
DOI https://doi.org/10.2147/PRBM.S305979
Checked for plagiarism Yes
Review by Single anonymous peer review
Peer reviewer comments 2
Editor who approved publication: Professor Mei-Chun Cheung
Candida Castro,1 Petya Ventsislavova,2 Pedro Garcia-Fernandez,3 David Crundall2
1CIMCYC (Mind, Brain and Behaviour Research Centre), Experimental Psychology Department, Faculty of Psychology, University of Granada, Granada, Spain; 2Psychology, School of Social Sciences, Nottingham Trent University, Nottingham, UK; 3Electronic and Computer Sciences Department, University of Granada, Granada, Spain
Correspondence: Candida Castro
CIMCYC (Mind, Brain and Behaviour Research Centre), Experimental Psychology Department, Faculty of Psychology, University of Granada, Campus Cartuja, s/N., Granada, 18197, Spain
Email [email protected]
Introduction: Traffic collisions are a principal cause of death in Europe, disproportionately affecting young drivers. Driving safety depends not only on our ability to anticipate and respond to dangers on the road but also on the level of risk we are willing to engage within our own driving behaviour.
Methods: Hazard prediction (HPr) and risky decision-making (RDM) tests were given to three groups of young Spaniards (169 participants): 54 non-drivers (M= 20), 65 novice (M= 21) and, 50 experienced drivers (M= 26 years old). Both tests presented participants with video clips of driving recorded from the driver’s perspective. The HPr test contained hazardous situations caused by the actions of another road user (eg, a pedestrian crossing the road). Each HPr clip was occluded as a hazard began to unfold and participants were asked to predict “what happens next?” They selected their answer from four on-screen options. The RDM test used clips where any imminent danger would be provoked by the film-car driver’s risky behaviour (eg, overtaking illegally). Participants were asked to report the probability of following certain types of risky behaviour (eg, “Would you go forward with the lights on amber?” or “Would you overtake the cyclist/lorry/bus at this point?”). In addition, the effect of the locality of the driving scenarios was manipulated: they could take place in the participant’s native country (Spain) or in a different country (UK).
Results: Non-drivers and novice drivers were less able to predict upcoming hazards and more likely to make risky decisions. Driving scenarios from another country (UK) provoked riskier decisions than those from the participants’ home country (Spain).
Conclusion: Improvement in HPr skills among novice or new drivers poses a huge challenge as far as driver training is concerned, though it is only part of the solution. Young inexperienced drivers’ willingness to engage in risky behaviour also needs to be tackled. Our results suggest that such RDM can be assessed in a similar way to HPr skill, using a naturalistic approach, which raises the possibility of assessing and training drivers on a wider range of safety-related behaviours.
Keywords: driving, hazard detection, anticipation, hazard perception, risk estimation, decision taking
Introduction
In 2019, 22,800 people died in road collisions across the 27 EU member states. Thirteen per cent of these victims were aged between 18 and 25, despite only 8% of European drivers falling within this age group.1 This reflects an international pattern of where inexperienced drivers are over-represented in collision statistics. This can be partly explained by under-developed skills such as hazard perception,2 though risky behaviour linked to lifestyle and age undoubtedly plays a role.
Young people with insufficient driving experience underestimate risk (ie, novice drivers show less awareness of the real hazards of the road environment), overestimate their driving skills (they consider they have mastered all the necessary driving skills) and do not adapt their driving behaviour to the demands of the specific traffic situation (eg, excessive speed, small safety margins, unsafe following-distances, aggressive driving, risky manoeuvres and engaging in secondary behaviours such as making a phone call).3–6 Efforts should be made to raise the awareness of novice drivers about the danger of overconfidence in their driving skills. For instance, training after obtaining their driving licence should be contemplated to help fully develop their driving skills. The inherent caution of newly licensed drivers decreases once they start driving, as they feel they have already received their formal training. An accurate calibration of driving skills and driving demands depends not only on the amount of practice but also on the quality of the feedback the driver receives from the environment:5 Novice drivers’ training should gather information from different assessment methods to compare their subjective view of their driving skills with their real driving ability. This can be achieved by using active search (eg, hazard awareness training) and feedback from the environment to improve their ability to read the road.
Driving: A Question of Skill and Assumed Risk
Driving safety depends not only on the skill of the person driving but also the risk he or she willingly assumes in carrying it out.7 Many recent attempts to assess and give training in hazard skills will only mitigate part of the underlying problem. To better assess the safety of a driver, we must also consider the harm that they place themselves in through their behavioural choices. Risky decision-making (RDM) can have a number of causes including an inability to understand the level of danger their actions place them in, over-confidence in their own abilities, sensation seeking, and an incorrect assessment of the advantages and costs of taking that risk.3,5
In hazard awareness tests, hazardous situations are typically provoked by the actions of another road user (eg, a delivery driver half-hidden by their vehicle suddenly crosses the road). In this sense they can be considered as “passive” hazards. Guidelines for the development of such tests state that the driver whose perspective we adopt should not cause the hazard.8 In order to measure a driver’s likelihood of risky decision-making, the converse situations are required, where any inherent danger in the scene would be caused by the film car driver’s actions. Such “active” hazards might include driving too closely to the vehicle ahead, driving at inappropriate or excessive speed, or making a risky overtaking manoeuvre.
While clip-based assessment of RDM appears possible, there has been confusion in the hazard awareness literature due to the mixing of hazard perception and RDM measures within the same test. HPr and RDM tests should measure these underlying processes separately, though it would still be feasible to do this within the same assessment, providing scores for these two constructs are kept separate. This is necessary as internal consistency has been a problem for hazard perception tests, possibly due to the inclusion of active hazards such as “tailgating”.9 Similarly, the inclusion of gap-acceptance clips again introduces active hazards into an otherwise purer measure hazard perception (as the film car driver’s decision will initiate the hazard).10 In fact, the correlation between a propensity to take risky decisions and the skill of hazard perception is poor, which might explain why typical hazard awareness tests have avoided measures of RDM.11 This has been evidenced in studies featuring re-offender drivers, who perceive the hazards correctly but seem to underestimate the risks posed by their behavioural choices.12,13
Several studies have attempted to measure risk-taking independently from hazard awareness. For instance, clips filmed from vehicles travelling at different speeds were used to assess drivers’ speed choices. According to the results, drivers’ propensity to be involved in speed-related collisions was related to their speed choices.14,15 More recently, video-based measures of drivers’ following distance and gap acceptance behaviours were studied.16 Drivers’ risk propensity has also been assessed via the Vienna Risk Test,17,18 where the dimensionality and construct validity of this test was piloted. Finally, a Go No-Go driving simulator task was also used to evaluate drivers’ RDM.19
Hazard Perception in Driving
While it does not always follow that prediction of hazards will lead to successful avoidance, we argue that it is an essential antecedent. It has been demonstrated that a greater ability in hazard perception20 and HPr21 correlates with a decrease in collisions. Moreover, it has been found that hazard scores correlate with the execution of abrupt braking during real driving.22,23
Hazard perception has been defined as the skill of “reading the road”, anticipating what is going to happen in order to detect and respond to events on the road that have a high probability of producing a collision and require the driver to carry out an evasive manoeuvre, brake or change trajectory.14 Novice drivers typically perform worse in hazard perception than experienced drivers.8,12,13
It has been argued that experience helps in the identification of hazard precursors: clues of imminent hazards that can be either behavioural or environmental. Behavioural hazards involve a visible road user in a situation that has not yet become hazardous but may do so. Environmental hazards (also called latent hazards) are those where the object of the hazard is not yet visible and can only be predicted by the environment (eg, a high-sided vehicle may hide a pedestrian).24 We argue that experience influences identification of such precursors; thus, drivers with less experience will be less able to use precursors to predict hazards, and their subsequent responses to on-road dangers are likely to be reactive and unplanned.25
To perceive a hazard and be able to respond to it requires at least three stages, typically co-opted from situation awareness.26 These are perception (ie, perceiving the relevant elements on the road), comprehension (ie, understanding how these elements interact with each other and the environment) and projection (ie, predicting what will happen next). The situation awareness that is derived from these processes feeds into a driver’s decision-making process. Other influences such as goals, expectations and information processing biases will also contribute in decision-making. Due to these multiple influences, it is not the case that perfect situation awareness will always result in the desired outcome.
In addition, previous results from our lab have demonstrated how attentional capture in complex driving situations can influence HPr. Trials in which a salient traffic element might attract attention away from the location of a developing hazard produced the worst results compared to trials where a salient element was coincident with the spatial location of the hazard. Simple hazards, where the relevant precursor was the only salient object, produced the best performance. Drivers with experience achieved better performance than novices, and novices obtained better results than non-drivers.27
Taking Risky Decisions in Driving
Not all drivers perceive the same risk in a situation or understand their own ability to confront it. To improve our understanding of the problem of unsafe driving, it is necessary to explore which variables allow us to predict and identify unsafe drivers. Evaluating them more precisely could allow us to improve the efficacy of the diagnostics (ie, understanding of the mechanisms underlying unsafe driving choices) and equally, of the interventions to be carried out to modify them.
Risk perception could be defined as the subjective assessment of the extent and controllability of risk in a decision situation.28 While some drivers are simply not aware of the risk in some hazardous situations,29 the literature demonstrates a relationship between personality and risky driving.30–32 Specifically, a greater risk acceptance is related to personality traits such as sensation-seeking,33 aggression and extroversion, as well as low levels of altruism and low levels of aversion to risk;31,32,34 under-estimation of risk and greater sensitivity to reinforcement.35
Regarding driving experience, those drivers with greater experience are likely to have encountered many risks and had several opportunities to calibrate their own skill against their risk appraisals. Young and inexperienced drivers have had fewer opportunities to calibrate their risk–skill relationship and tend to perceive situations on the road as less hazardous while also overestimating their skills.36
Research has been undertaken where the propensity to assume risk in driving was measured using real driving situations recorded on clips. The researchers measured the predisposition to assume risks according to the speed at which drivers chose to drive in different real driving situations recorded on video clips.7 Their findings verify that the differential effect on speed choice is due to drivers having learned to detect hazards: they were only choosing slower speeds when they had detected a more hazardous scene. More recently, the predisposition to assume risk was measured according to the drivers’ own minimum comfortable distance and gap acceptance behaviours in comparison with the distance shown in the clip.16 Riskier choices were made by young drivers than by older drivers for both gap acceptance and following distance behaviours.
The Vienna Risk Taking Test17 also measures the propensity to assume risk in driving by using situations recorded on clips that vary in degrees of objective risk. The published study included 15 clips of traffic situations with a high degree of objective risk that required the driver to perform a manoeuvre: “an overtaking manoeuvre in a situation where one meets another car”; 7 video clips dealing with passing manoeuvres or “traffic situations that require speed choices” (eg, passing a slower car in front of one’s own before a blind bend, deciding when to slow down when approaching another car on a highway) and 7 traffic situations at intersections (eg, turning right in a situation with crosswise traffic, crossing a road that has right of way). Drivers had to watch and press a button if they thought the manoeuvre had become too dangerous to continue. The mean latency before the button was pressed was taken as a measure of the respondent’s subjectively accepted degree of risk (according to Scheiblechner’s model). The Vienna Risk Taking Test is reported to assess from the results a (unidimensional) latent personality trait that could be considered as a measure of the degree of risk accepted by drivers,18 and positive correlations were also found between the Vienna Test and sensation-seeking measures, and negative correlations between the Vienna Test and personality traits such as responsibility and self-control.
The Effect of Locality on Hazard Awareness and Risk Taking
Different countries show wide differences in driving, including the social and legal rules that their governments consider acceptable. In addition, driving styles, road laws, vehicles and culture can influence the nature of the traffic hazards, hazard perception and the willingness of their drivers to take risks. The effect of “environmental familiarity” on hazard perception has been explored.37 Novice vs experienced Australian drivers’ performance was assessed using both Australian and UK traffic video clips. It was found that the advantage of experience persists even in unfamiliar environments. The authors concluded that hazard perception abilities contain at least some general components. However, it should be noted that the UK and Australian traffic environments recorded shared very similar environmental features.37
Malaysian and UK drivers’ hazard performance using videos recorded in these two countries has also been compared.38 Using a speeded push button response to the appearance of a hazard, the researchers found UK drivers responded to more hazards than the Malaysian drivers, especially when they were presented with Malaysian clips. The authors suggested that cultural differences in hazard criteria (ie, the internal threshold at which one considers an event to be a hazard) impacted more than experience on hazard perception test performance (even though many hazards share similarities across countries at a structural level).39 When given an occlusion-based hazard prediction test however, the impact of drivers’ internal criteria was mitigated in their responses to the question “what happens next?” Hazard prediction tests are certainly harder than push-button hazard response tests where the full hazard is always visible,40 but they appear better at differentiating driver groups in a variety of international contexts. Considering the above, two questions emerged: Are drivers aware of their poor performance in these different circumstances? Will this affect the risks they are willing to take in different local contexts?
The Current Study
This study aims to develop new HPr and RDM tests using footage of Spanish and UK driving. The aim is to assess whether either test can distinguish between drivers with different levels of driving experience and whether the socio-cultural context (same country context – clips filmed in Spain vs a foreign country context – clips filmed in England), and driving habits of the country will impact performance in the test.
In the HPr test, participants are presented with traffic clips of real driving situations recorded from the driver’s perspective. These clips are cut just when a hazard is on the point of unfolding (for example, a pedestrian encroaching on the road). An “active” scenario would be one where the driver of the car in the clip has made choices that instigated the hazard, whereas in the “passive” videos, the driver of the viewpoint vehicle is responding to hazards provoked by others. It is possible to clearly and reliably distinguish between “passive” and “active” hazards when selecting idiosyncratic source material from the naturalistic driving footage for each distinct test: HPr and RDM.
In the RDM test, clips of real traffic scenes (clips recorded in Spain and the UK) where risky situations are about to happen (eg, jumping a traffic light on amber or overtaking illegally) are used in a novel way, asking participants to what degree they would continue with the risky manoeuvre. Therefore, the participant assumes the role of the film-car driver and thus these situations can be considered active scenarios where participants must consider what behaviour they would perform, based on an appraisal of risk compared to their self-perceived skills.
The HPr test should be able to differentiate between our participant groups according to their driving experience, with more experienced drivers performing better. We also expect performance in the same country (Spanish) clips to be better than in different country (UK) clips. With regard to the RDM test, we expect non-drivers and novice drivers to accept a higher degree of risk than more experienced drivers.
Finally, if calibration can be defined as behavioural regulation on the basis of anticipated hazards, HPr and RMD measures, it is expected that these measures could be negatively correlated (although some authors insisted that the negative correlation between RDM and HPr was poor).11
Method
Design
A 2×3 mixed design was employed using clips from different countries (Spanish vs English clips) presented to three groups of drivers (non-drivers, novice and experienced drivers). Scores on the HPr test and on the RDM test were the dependent variables. The two tests were presented separately in two blocks. These blocks were counterbalanced across participants and across type of block (Spanish vs English clips).
Participants
A total of 169 Spanish participants (64 female), aged between 18 and 30 years took part in this study. Participants were recruited via social media platforms and driving schools. They were students attending the University of Granada (Faculty of Psychology and Faculty of Sciences) or learner drivers attending Genil and Victoria Driving Schools (Granada). They were selected according to their driving experience and were distributed in three groups: non-drivers, novices and experienced drivers. Specifically: the non-drivers group included 54 participants (M=20 years old) who had no driving experience (and no driving license). There were 65 novice drivers (M=21 years old) in possession of a driving license for less than 5 years (M=3 years), who had driven less than 10,000 kms (M=4195 km) in the previous 12 months and drove with a medium-low frequency (eg, once a month). Finally, a total of 50 drivers with more than 5 years’ driving experience (M=26 years old) were also recruited. These drivers had at least five years of post-licensure experience (M=8 years) and had driven more than 10,000 km in the previous 12 months (M=17,800 Km). They also drove with high frequency (ie, every day or nearly every day). None of the participants had experience of driving in the UK.
Young people are proportionally more likely to be involved in a fatal road collision. Therefore, only young people under thirty were recruited (non-drivers, novice and experienced drivers: M= 20, 21 and 26 years old, respectively).
None of the participants were offender drivers (none of them had received the Spanish re-education course to recover lost points of their driving license) or had had a car crash in the last 2 years. None of the participants had children. The final sample of participants is described in Table 1.
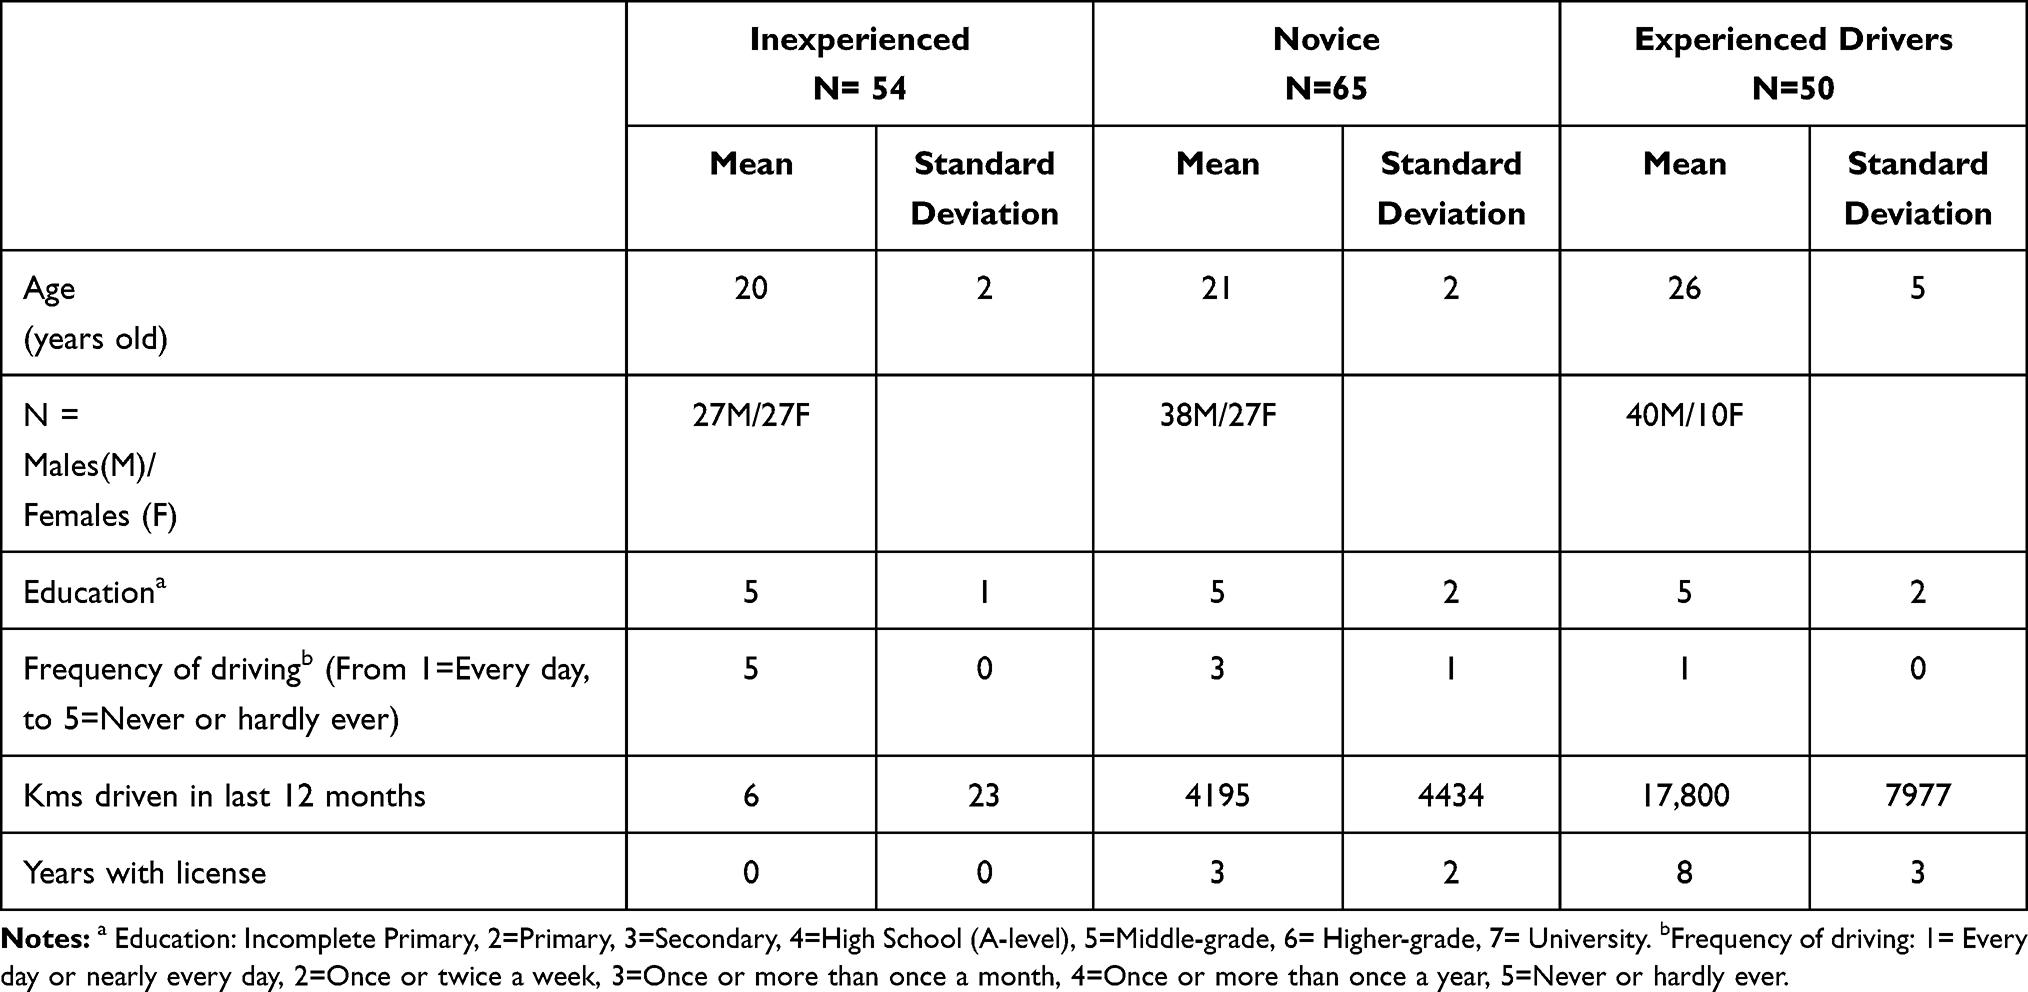 |
Table 1 Descriptive Statistics of All Participants |
All the participants affirmed that their educational level was medium or high (middle-grade or higher, or university studies). As compensation for contributing to the investigation, participants from the Faculty of Psychology received a course credit corresponding to 0.2 of the final mark (10) of one of their assignments in the Department of Experimental Psychology. The remaining participants were compensated with a small souvenir from the University shop, eg, a keychain.
Ethical Considerations
This study was conducted in accordance with the Declaration of Helsinki. The project was approved by the Ethics and Research with Humans Committee of the University of Granada (147/CEIH/2016). Prior to the experiment, participants received information about the study, guaranteeing the voluntary nature of their participation, anonymity and confidentiality of their data. All participants were given details about the project and asked to sign a voluntary consent form to participate in this study. Participants were provided with an email in case they wished to withdraw their data, since ultimately their performances in such tests could reflect their driving (and safety) performance.
Materials and Procedure
Both the HPr test and the RDM test were programmed and run with E-Prime 2.0 software (Psychology Software Tools, Inc.). In both tests, the clips were selected from a database of more than 300 clips of real driving situations recorded in a naturalistic way in traffic in the province of Granada and in Nottinghamshire (England) with 4 cameras simulating the front field of vision of the car, the side and rear-view mirrors. The clips were displayed with a resolution of 1920×1080 on a 16-inch screen, in an aspect relation of 16:9, at a distance of 50–60 cms.
The assessment demands of a country-specific test should be as follows. First, a culturally agnostic HPr and RDM driving test should take into account the driving habits, norms and rules of the country concerned.39 By recording naturalistic driving situations, this should be guaranteed. Spain and the UK are comparable in safety records; however, these countries differ in terms of road norms and culture (for instance, they drive on a different side of the road, on the right in Spain vs the left in the UK). Second, the test must be as comparable as possible in all other aspects. The two blocks of (Spanish/British) video clips selected in the tests (HPr and RDM) were similar in terms of situation depicted: type of hazard, driving environment and time of day (daytime, no bad weather conditions).
Participants were seated in front of a screen at a distance of around 60 cms. Prior to the experiment, they were required to provide demographic data: sex and age (see Table 1).
In the general instructions, participants were told that they would perform two tasks, or blocks, separated by a short rest, each block having 20 clips: 10 of the situations were recorded in Spain, 10 in England.
Two experts in Psychology and Traffic Safety, with more than twenty years of experience in the field of road safety, classified the HPr and RDM videos, selected the occlusion points of the HPr videos (that could make a HPr Test easier or more difficult) at the moment just before the hazard unfolded (approx. 2 seconds in advance of a potential collision), and chose the multiple choice options for the HPr test questions, in order to standardise them for the Spanish and UK clips. There was considerable agreement between the judgments of the two experts, the disagreements were resolved, and the guidelines reconsidered. In this way, a HPr test of medium to high difficulty was developed.
The order of performing the tasks of HPr and of RDM was counterbalanced across participants. Both began with instructions on how to complete the tests and 2 practice trials specific to the particular task. The duration of the experiment (watching 40 clips in total) was approximately 25 minutes. The duration of the clips varied between 8 seconds and 48 seconds.
Task of Hazard Prediction
For the selection of situations for the HPr test, the situations considered were those in which some obstacle with which the participant’s vehicle could collide was encountered on its trajectory. The clip was cut just as the hazard was beginning to develop (see Table 2).
 |
Table 2 Spanish Clips (Same Country) and United Kingdom Clips (Different Country) Used in Hazard Prediction Test |
Participants were told,
In this test you will see clips of driving recorded from the perspective of a driver. It is very important that you observe the clips as if you were the driver. These clips will be abruptly cut just before a ‘Hazard’ appears. We understand a ‘Hazard’ to be an obstacle that requires a reaction, whether by braking or by carrying out a manoeuvre to avoid colliding with it. Your task consists of telling us: ‘What will happen in the traffic scene just after the clip is cut?’ For this you must select (from between 4 alternatives we will suggest) the option you think best describes how the hazardous situation will evolve, by pressing the number of your chosen option on the keyboard.
For the question: “What will happen in the traffic scene when the video clip is cut?” a multiple-choice test with 4 possible answers (3 distracting options and 1 correct option) was created. For example: a. The vehicle ahead of us brakes sharply, b. The cyclist enters the road, c. The bus starts moving and enters our lane. D. The pedestrian on the right enters the road (See Figure 1). The correct answers for each clip and the multiple-choice distracter options are provided in Table 3.
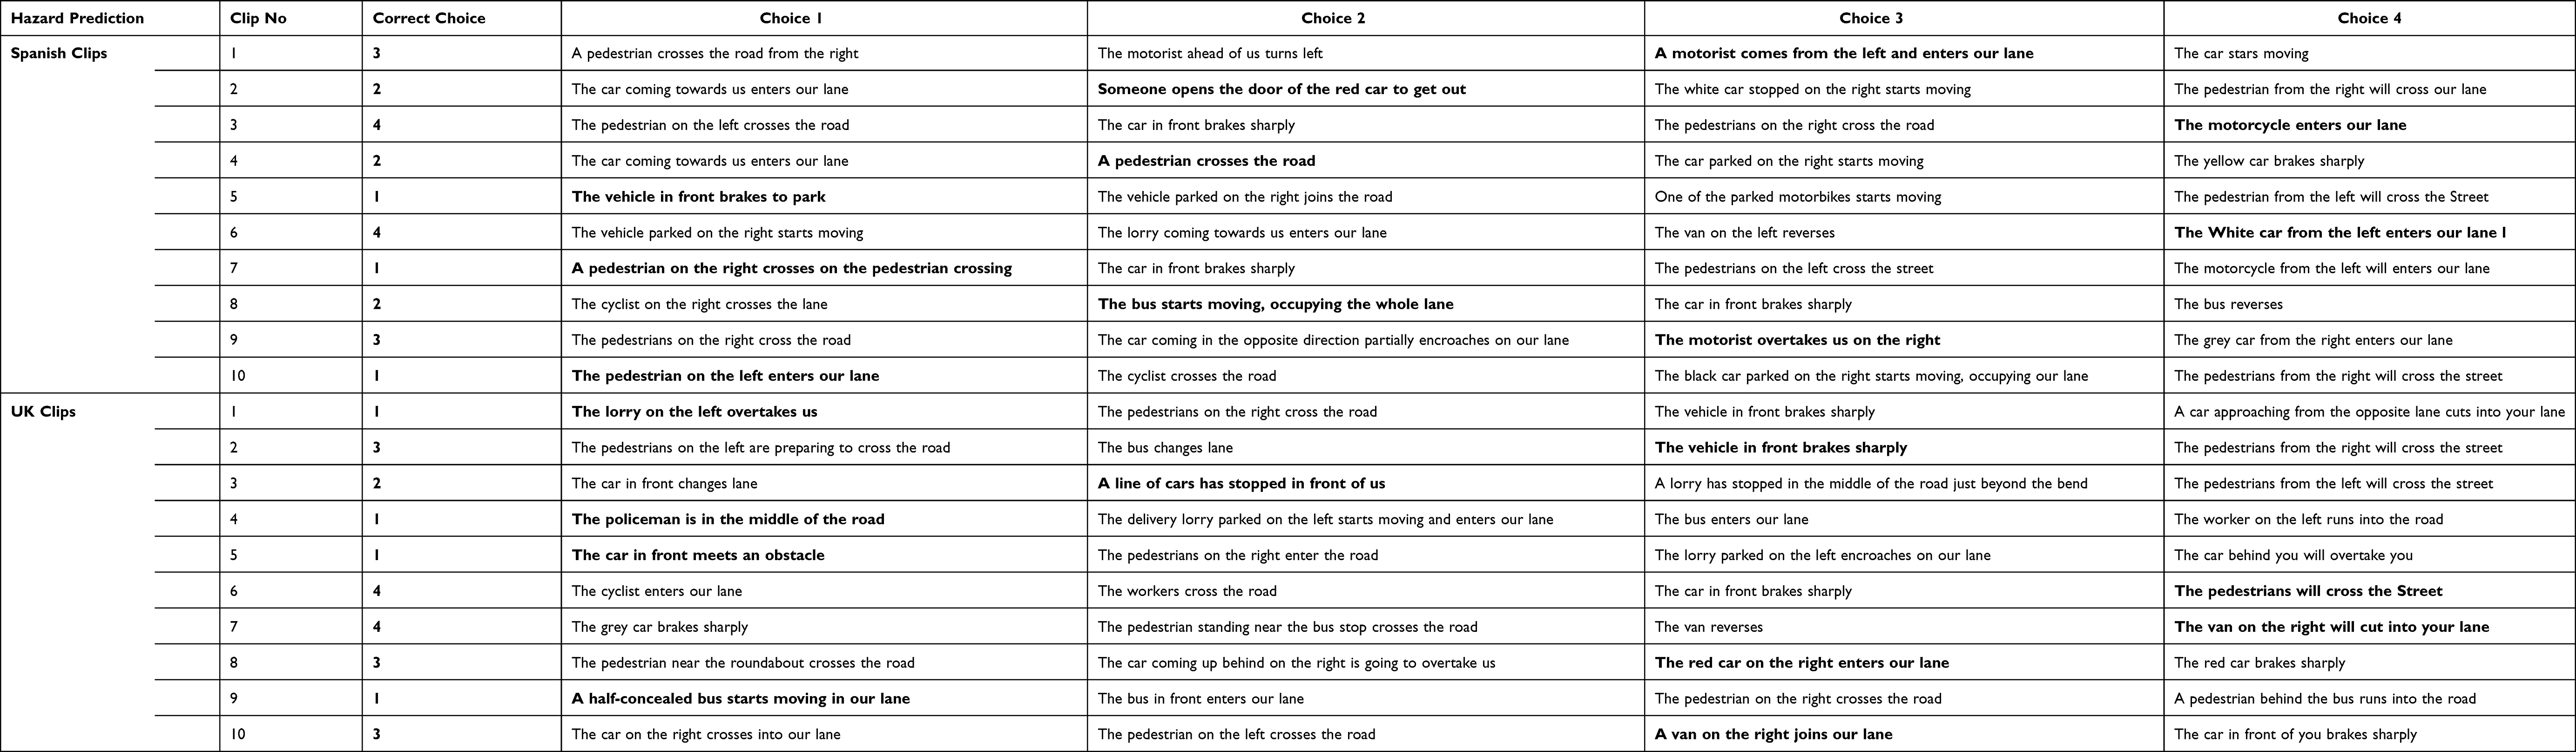 |
Table 3 Multiple Choices Used in the Hazard Prediction Test, After the Question “What Will Happen in the Traffic Scene Just When the Clip is Cut?” the Correct Choice per Each Clip is Shown in Bold |
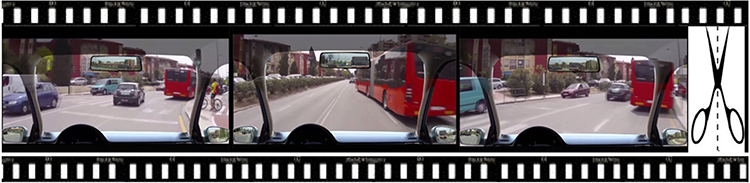 |
Figure 1 The 3 images represent the end of a video-clip (for example, this clip where the hazard is a bus that enters our lane) followed by an occlusion panel (cut-to-black) and finally the 4 multiple choice options are shown on screen. |
Both the correct answer and all three distracting options were designed following the guidelines to develop and validate multiple-choice test items (eg, short, simple sentences).41 One point was awarded for selecting the correct option. The correct option described the hazardous situation that would really occur after the video was cut. This methodology follows several previously successful studies using a multiple-choice hazard prediction test and finding significant differences between experienced and novice drivers.13,27,39,42–45 As supplementary material, a more detailed description of the traffic situations used for the Spanish and UK hazard prediction test are shown in Figures S1–S2
Risky Decision-Making Task
For the new RDM test, risky driving situations were selected and cut just before a risky behaviour could have been undertaken, eg, jumping a red traffic light or overtaking recklessly (ie, performing an illegal manoeuvre or aberrant behaviour; Figure 2).
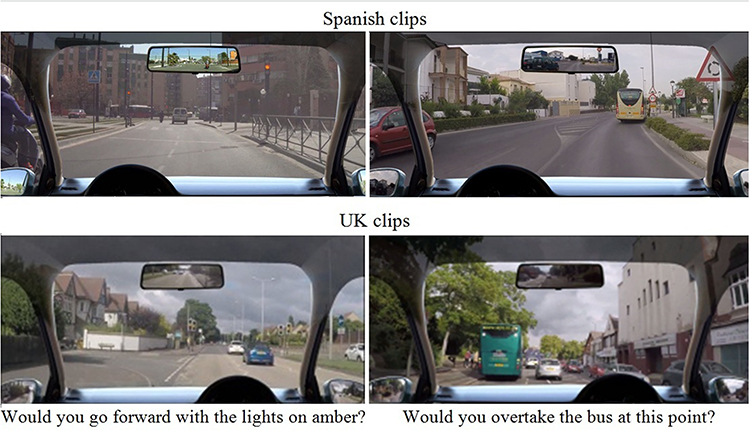 |
Figure 2 Examples of risky decision-making trials. |
These are the RDM test instructions:
You will now be presented with clips that will be cut immediately prior to a specific driving situation and you will be asked to respond: ‘How likely are you to engage with this behaviour (eg, overtake or pass through an amber light?’). These are some examples of the situations that you may be asked about: ‘Would you go forward with the lights on amber?’ or ‘Would you overtake the cyclist/lorry/bus at this point?’ You should rate your answer on a Likert scale from 1 to 6: (1-not likely to 6-very likely). (See Table 4).
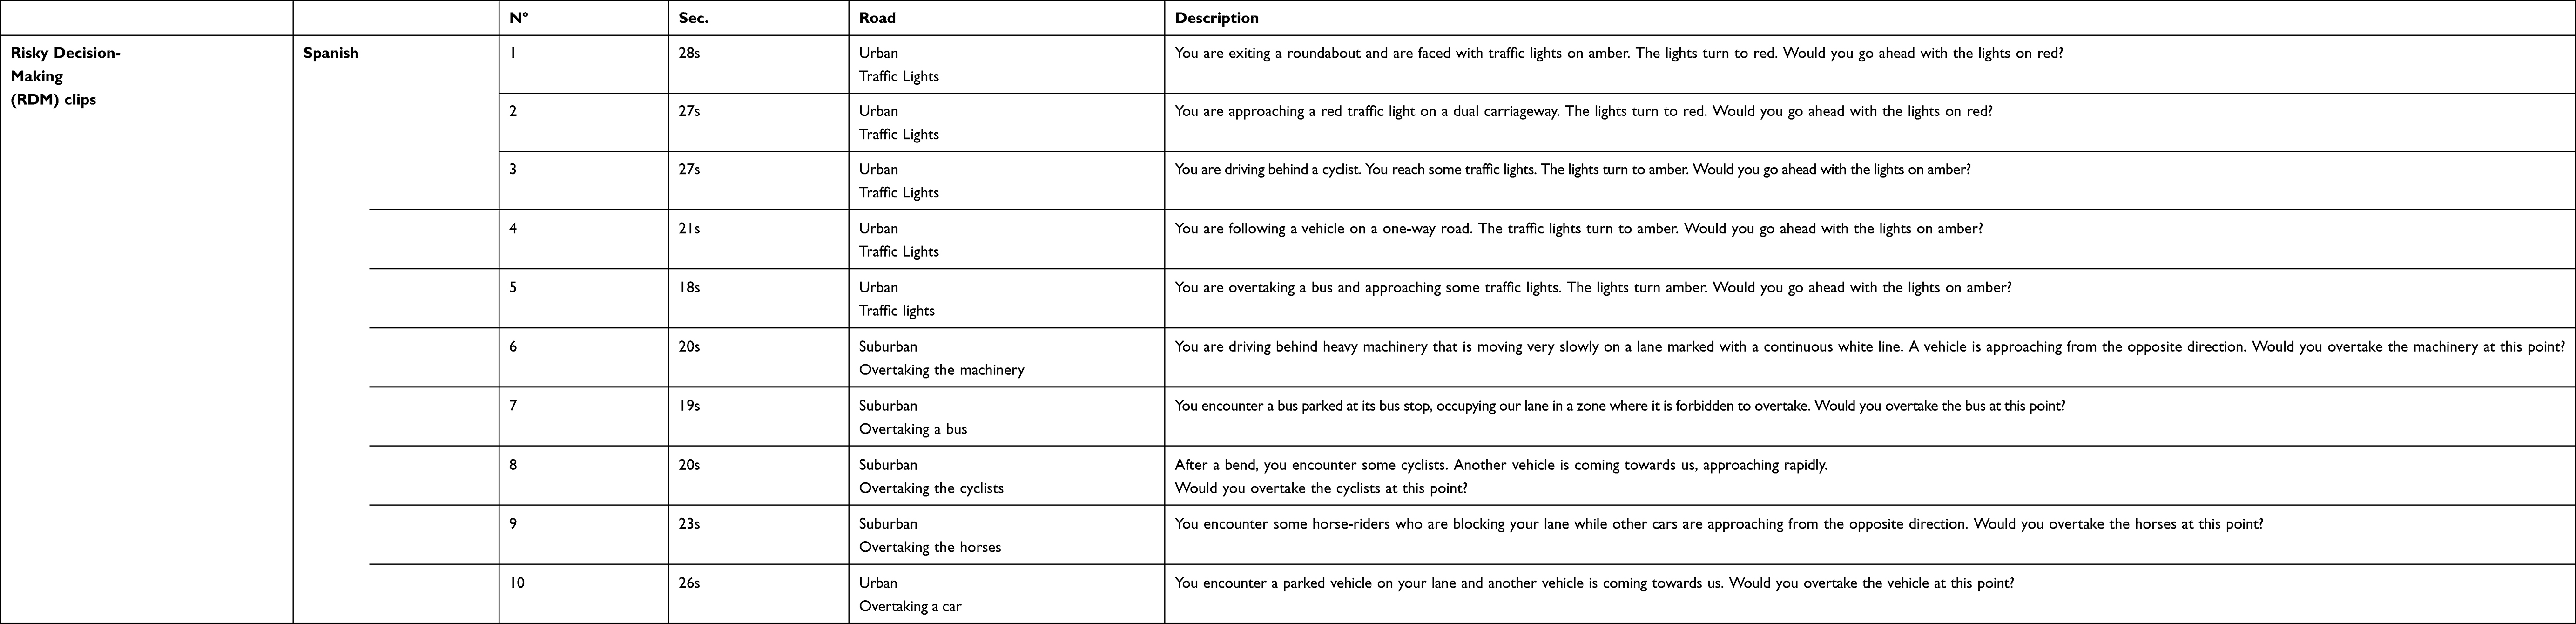 |
Table 4 Spanish Clips (Same Country) and United Kingdom Clips (Different Country) Used in Risky Decision-Making Test |
There were no right or wrong answers as the test measured the participant’s proneness to taking risky decisions.
As supplementary materials, a more detailed description of the traffic situations used for the Spanish and UK risky decision-making test are shown in Figures S3–S4.
Results
Hazard Prediction
A (2) x3 Analysis of Variance (ANOVA) compared test locality (Spain vs UK) across the three driver groups for HPr accuracy (mean % of clips accurately responded to).
The interaction between these factors approached significance [F(2166)=10.26, p<0.08, η2p=0.057] but only marginally. The main effect of locality was significant [F(1166)=8.27, p<0.005, η2p=0.047], with higher scores for the same country clips from Spain (Mean = 71.66, Standard Deviation = 12.54) than for the different country clips from the UK (M=68.84, SD=15.77). A significant main effect of driving experience was also found [F(2166)=10.26, p<0.005, η2p=0.1]. Non-drivers (M=65.83, SD =13.02) performed worse than novice drivers (M=70.92, SD=14.25), with the experienced drivers producing the highest scores (M=7400 SD=9.25). Pairwise comparisons yielded significant differences for non-drivers and novices (Mean Difference, MD=5.09, Standard Error, SE=2, p=0.042) and for non-drivers and experienced drivers (DM=8.17, SE=2.1, p<0.001). P-values were adjusted with the Bonferroni correction for multiple comparisons (see Figure 3).
 |
Figure 3 Mean of percentage of correct answers obtained by each participant in the same hazard prediction test for the different locations studied: same country (Spanish clips) and different country (English clips) according to driving experience (non-drivers, novice and experienced drivers) (with standard error bars). |
Risky Decision-Making
Means were calculated for RDM task scores for each participant across video clips, grouped by locality and driving experience. A mixed (2) x 3 ANOVA was performed on participants’ mean RDM ratings for driving manoeuvres across the two countries and three driving groups.
A main effect of locality was found [F(1166)=149.85, p<0.001, η2p=0.47], with participants showing greater willingness to accept risk in the UK clips (UK) (M=3.07, SD=0.78) compared to the clips from the Spanish driving context (M=2.38, SD=0.84).
The main effect of driving experience was also significant [F(2166)=11.31, p<0.001, η2p=0.11]. Greater willingness to accept risk is demonstrated for the novices (M=3, SD=0.84) and non-drivers (M=2.78, SD=0.84). Lower risk acceptance is shown by experienced drivers (M=2.38, SD=0.93).
The interaction between the two factors was also found to be significant [F(2166)=5.644, p<0.004, η2p=0.064]. As can be seen in Figure 4, while all drivers increase the level of risk they are willing to accept in the English clips, the non-drivers show the largest increase in willingness to accept risk.
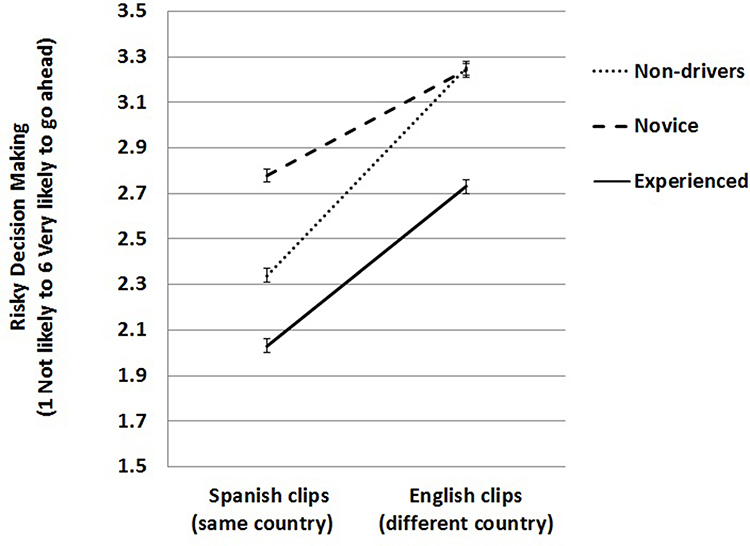 |
Figure 4 Risky decision-making scores for risky driving manoeuvres in same country (Spanish clips) and different country (English clips) according to driving experience (with standard error bars). Mean RDM test score per participant across the video clips’ locality. The figures refer to the answer to the question: “What is the probability that you will go ahead with this behaviour? (eg, going forward with the lights on amber, overtaking a bus, overtaking a bicycle.” Participants selected from numbers 1 to 6: (1-not likely to 6-very likely). |
The interaction could benefit from being statistically decomposed: significant differences were found between non-drivers (M=2.34) and novice drivers (M=2.78) in RDM scores obtained with the same country, Spanish clips t(117)= −2.88 p=0.0001 and between novice (M=2.78) and experienced drivers (M=2.03), in RDM scores with the same country, Spanish clips t(113)=4.102, p=0.001). The differences only marginally approached significance between non-drivers (M=2.34) and experienced drivers (M=2.03) in RDM for the Spanish clips t(102)=1.98, p=0.056)
In addition, significant differences were found between non-drivers (M=3.25) and experienced drivers (2.73) in RDM scores obtained with different country, UK clips t(102)=3.181, p=0.011, and between novice (M=3.24) and experienced drivers (2.73) in RDM scores obtained with different country, UK clips t(113)=3.417, p=0.001.
Correlations Between the Hazard Prediction and Risky Decision-Making Scores
Pearson correlations between the raw scores of the two tests were calculated: the HPr scores (ie, the average percentage of correct answers) and the RDM scores (ie, response to the question: “What is the probability that you will go ahead with this behaviour?” (eg, going forward with the lights on amber, overtaking a bus or overtaking a bicycle (from 1-not likely to 6-very likely) in the Spanish and English clips. Several of the two-tailed Pearson correlations were found to be significant and can be seen in Table 5:
 |
Table 5 Pearson Correlations Between the Hazard Prediction (% Mean Accuracy of Correct Answers) and the Risky Decision-Making Scores (Probability of Going Ahead with Reckless Overtaking or Running Amber Lights) in the Spanish (Same Country) and English (Different Country) Clips |
A strong positive correlation was found between performance on the two prediction tests across the countries (r =0.504, p<0.01). A similar strength correlation was found between performance on the two risk tests (r = 632, p<0.01). Perhaps more interestingly, a significant, negative correlation was found between risk taking and hazard prediction score for the two Spanish tests (r = −0.189, p<0.05). The negative correlation between the Spanish risk test and the UK hazard test was also significant and slightly stronger (r = −0.236, p<0.01).
Discussion
The current study explored whether HPr and RDM differ across driver groups with different levels of driving experience, and whether these scores vary with context locality comparing clips from the same country (clips from Spain) vs a foreign country (clips from UK).
Hazard Prediction Performance Improves with Experience
The hypotheses set out with regard to the HPr Test were confirmed. The effect of experience obtained by many other studies12,13,42–45 was replicated for the HPr tests, with experienced drivers once again being more precise in predicting hazards on the road, followed by novice drivers and lastly non-drivers.
The HPr test found the drivers with least experience performed significantly worse on this test than the other two groups. The difference between the novice group (of middling experience) and the more highly experienced group did not reach the threshold of significance, though the means tended towards the predicted direction. The reason for this may lie in the number of years’ experience held by this novice group. With up to 5 years’ driving experience following their driving test, several of these drivers may have developed sufficient hazard awareness to perform at the same level as our highly experienced group. An additional issue with using experience as a surrogate for crash risk is that these two factors do not perfectly align. There will always be some highly experienced drivers who are poor at hazard perception, and these drivers can impact on the ability of experience to produce an effect. Nonetheless, the experiential effects that are noted in the current study still demonstrate that the tests are tapping into a skill that develops over time.
Risk Taking Changes with Driving Experience
Risky behaviour has been linked to high collision rates, possibly due to poor awareness of the risk in certain dangerous situations,29 and the overestimation by drivers of their abilities.47 The current results suggest that driving experience can have a moderating effect on such risky behaviour.
The new RDM Test (containing video recordings of real driving situations where the driver plays an “active” role in provoking the hazard) has been shown to be sufficiently sensitive to detect differences in the judgment of risk by participants according to their level of driving experience. The most experienced drivers were the least willing to engage in risky behaviour. Therefore, the hypothesis proposing that non-drivers and novice drivers accept a higher level of risk than experienced drivers was confirmed.
It was particularly interesting to note that our novices reported the greatest intention to behave in a risky manner, with the non-drivers group falling in between novices and experienced drivers. This result demonstrated the value of adding a non-drivers group to the study. The evidence suggests that gaining a few years of driving experience raises novice drivers’ willingness to engage in risky behaviour. This has been found with specific skill-based driver training that can inadvertently lead to an increase in confidence that potentially outstrips the concomitant improvement in skill. There has in fact been considerable investigation of this issue, looking at young/novice drivers’ balancing of skills and task demands that has been defined as calibration: young/novice drivers overrate their driving skills and undervalue the risks of driving, and therefore fail to adapt their driving behaviour sufficiently to the actual driving scenarios “(eg, excessive speeding, gap acceptance problems or reckless overtaking)”.3,5 Training should address this calibration issue and ensure that risk inoculation is included with training to help non-drivers to anticipate hazards (see, for instance, the “online hazard perception training course for drivers”). By up-skilling drivers while constantly reminding them of the risk and dangers of driving (in relation to their newly found skills), we might avoid the increase in risk that comes with untethered increases in confidence.46
The Influence of Context Familiarity on Test Performance
Both the hazard prediction test and the risky decision-making test were sensitive to the original source location of the clips. The prediction test revealed an effect of clip origin, with drivers performing worse on the UK clips. The analysis strongly suggests that the locality effect is driven primarily by the participant group with the least driving experience. The findings support previous research that has demonstrated that experiential effects can be preserved across countries,37 especially when a hazard prediction format is used rather than a traditional speeded-response hazard perception test.38,39 The experiential differences were, however, dependent on the least experienced group performing poorly. The most experienced group appears to perform identically on both the Spanish and UK hazard prediction tests, which suggests that they can extrapolate from their experience in the familiar context and apply this learning to a novel context. This has also been noted with highly experienced drivers who were tested on hazard prediction tests filmed in familiar and unfamiliar locations, though these locations were within the same country.47
While the two current contexts differ in more details than those in the study by Kroll et al51 these differences arguably relate more to surface details (scenery, road signs, right-hand vs left-hand driving, etc.). Even though these clips represent the driving conditions in two different countries, they share many of the underlying hazard structures (eg, a bus indicating and entering your lane). With greater experience, it is likely that our drivers rely more on abstracted rules rather than stored instances of hazards or exemplars, and thus they may find it easier to transfer their learning to this superficially different context.
A stronger country-based effect was noted for risk ratings, with all drivers appearing more willing to take risks in the UK clips. This effect may have occurred for a number of reasons. First, it may be the case that our drivers implicitly or explicitly registered that the hazard clips filmed in the UK were less dangerous. If the participants did identify such a difference in absolute danger, they may have been prepared to increase their willingness to engage in risky behaviour following the theory of risk allostasis.52 Certainly, the collision rates between Spain and the UK suggest that the latter provides the safer driving context, though a previous comparison of perceived hazardousness in Spanish and English clips found that Spanish drivers thought them to be similar in their levels of danger.38
A second possible explanation may lie in the arguably superficial differences between the clips from Spain and the UK. Although these differences did not appear sufficient to impact on our experienced drivers’ prediction scores (if we assume that the significant main effect of clip familiarity is primarily driven by the non-drivers group as suggested in the marginal interaction), they may have been sufficient to interfere with the appraisal of the risk presented by the imminent hazard. The question “What happens next?” merely probes their understanding of projected events. It does not, however, ask drivers how dangerous they consider this hazard to be (indeed, that is one of the claimed advantages of the prediction test format45). It is plausible that the additional mental workload that is incurred when interpreting a traffic scene filmed in a country with different road rules may disrupt the appraisal of danger, if not the prediction of the actual event.49 If appraisal is negatively affected, then drivers may be more willing to accept higher levels of risky behaviour in that situation.50,51 However, experienced drivers perform equally well across clips from both countries, although they also increase their risk ratings with UK stimuli. Driving experience may produce attention resource savings enabling them to handle new or unexpected traffic hazards.47
Alternatively, the roads depicted in the UK clips may have seemed so far removed from our participants’ driving experience that they did not prime safety-related concerns. Whereas clips of one’s own country are directly relatable to memories of prior risk-taking (and any associated consequences), the UK clips will have no such link to memories. This may result in an increased willingness to engage in risky behaviour.
Regardless of the underlying reasons for this familiarity effect, it poses a potential risk for driving overseas, eg, in the case of English tourists driving in Spain. Travelling cross-country UK to Spain happens on a regular basis. In order to decrease the risk and improve safe driving for both countries or for Europe in general, car rental agencies could consider the possibility of including advice and even providing online training options for overseas drivers, especially for drivers with little or no driving experience and whose ignorance of driving habits may compound their greater bravado and predisposition to risk.
The Relationship Between Risky Decisions and Hazard Prediction
In this study, negative correlations between participants’ risk ratings on the Spanish clips and their performance on both hazard prediction tests reach significance: those drivers with better hazard prediction scores are less likely to report risky decisions.
Although other authors have argued that the relationship between risk and hazard perception is weak,11 a recent study has found the possibility of a stronger link.56 Drivers were trained in hazard perception and their sample was found to be less willing to engage in distracting in-car tasks, such as using a mobile phone, in a post-training simulator drive. While iterations of the tests and a more heterogeneous sample (eg, including traffic offenders) might increase the strength of the current correlations, these significant results argue for a relationship between hazard prediction skill and risky behaviour ratings. As drivers’ hazard skills improve, they are better able to read the danger in the road, and are therefore less willing to engage in risky behaviours.
This effect does not hold however for the risk ratings produced by the UK risky decision-making test (although there is a strong correlation between the risk ratings given to the Spanish and UK RDM tests). This may be partly due to an inability to read the UK roads as well as the Spanish roads (at least for our non-drivers), but for our experienced drivers this is likely more to do with a disconnect between predicting a hazard and appraising that prediction for the danger it presents. Yet again we suggest that the increased cognitive load of interpreting a non-familiar driving scene may have more of an impact on anticipating the level of imminent danger than just anticipating the hazard per se.
Conclusion
Improvement in hazard perception and prediction skills among novice or new drivers is important and poses a huge challenge as far as driver training is concerned, though it is only part of the solution. Drivers’ willingness to engage in risky behaviour also needs to be tackled. Our results suggest that such risky decision-making can be assessed in a similar way to HPr skill, which raises the possibility of assessing and training drivers on a wider range of safety-related behaviours. Together, tests could also be a useful way to train young, offender and elderly drivers.53 They could be a tool to ascertain not only the Situation Awareness processes (Perception, Comprehension and Projection) but also Decision Making. It could however be considered inappropriate to use tests of risky driving behaviour in licensing situations because they are much more prone to elicit faked responses than are tests of HPr.8 This is part of the rationale for arguing that the HPr test should not reflect risk-taking propensity. But, it could be posited that the RDM test might be useful to provide a bigger picture of the driving processes underlying safe and unsafe driver behaviour. Our effort was directed to creating RDM assessment that could avoid or, at least, minimise faked responses.
Future Research
Future research will aim to explain the between-person variation in risk behaviour, looking at demographic variables such as age, gender or cultural background. Future studies should assess participants with a wider age range, and from both countries, to find out whether the same effects of locality (same or different country) occurs with Spanish vs UK footage (ie, whether UK participants will also make riskier decisions and predict fewer hazards when looking at the Spanish footage).
In addition, HPr and RDM processes must be studied while participants are carrying out other tasks concurrently with driving. Driving is a complex task in which many sub-tasks are performed, either simultaneously or consecutively. Trained drivers could probably succeed in conducting several sub-tasks if they were asked to do them independently but might fail if required to do them simultaneously. The execution of sub-tasks in driving requires coordination, just as in synchronised swimming the music connects with the movements, the “timing” being crucial for a successful performance. The here and now, the who and when of each movement are crucial. Therefore, one might predict, for example, that HPr would be adversely affected with the increase in demands imposed by other simultaneous tasks.
Efforts should be made in the validation and adaptation of the new HPr and RDM tests to different countries, taking into account the traffic norms and regulations, road infrastructure, driving habits and attitudes that are different in each country (International Test Commission, ITC, 2017).54 Future studies should include a larger number of videos in order to allow the calculation of psychometric properties and internal consistency of the tests, as good psychometric reliability is desirable. Alpha values are sensitive to the number of items contained in each scale and the variety of answers per item; therefore, a sample with a small number of items may shrink it. An exploratory factor analysis of the HPr and RDM cross-cultural tests could also be considered.55
One of the limitations of this type of study might be its environmental validity. Some might argue that HPr and RDM tests using clips or a simulator differ too much from reality, as the consequences of not detecting a hazard are far more serious in real driving. In the next investigations, Virtual Reality (VR) could be used as a possible solution in order to achieve realism and context without suffering the grave consequences of errors in real driving. These environmentally valid contexts might produce recordable and measurable driving responses from the participants that would be difficult to obtain by traditional means. In these contexts of immersive simulation, people react physically and emotionally as if the virtual world surrounding them existed physically. Via VR, participants’ HPr skill and their RDM could be evaluated in a situation where they may react more similarly to the way they would in a real situation. See, for instance, this recent work using the 360º field-of-view recordings provided by Head Mounted Display (HMD) technology.59
Investigation must continue into the most effective means of training in HPr as well as evaluation through longitudinal studies of its long-term efficacy. These studies will hopefully continue to demonstrate negative correlations with collision rates, since it should be possible to extrapolate from anticipating hazards in these tests to real driving, leading to a reduction in collisions.2,23 Scores in a HPr Test are associated not only with the experience of the driver but also with the data of self-reported accident rates.21 Future investigations will need to continue creating and validating tests adapted to each driving context in order to evaluate the differential underlying processes involved in HPr and RDM.
Highlights
- Riskier decisions and fewer hazards predicted in novices and non-drivers.
- Risky decision-making can be assessed, using clips where the driver plays an “active” role in provoking the hazard.
- Participants show poorer performance in hazard prediction and riskier decisions in driving scenarios from another country (UK) than in their home country (Spain).
Author Note
The clips and materials are available to genuine researchers on request. All legitimate researchers can contact us for access to the stimuli for use in specific research projects. The clips should not be shared by third party users or used for commercial gain (Creative Commons Attribution-NonCommercial-NoDerivatives 4.0 International Public License).
Acknowledgments
We would like to thank the Spanish participants who volunteered for the tests, the reviewers whose comments enabled us to improve the ms. and our English editor Barbara Lamplugh for revising and translating the ms. into English. We are also indebted to the driving schools in Granada (Genil and La Victoria) from whom we obtained our sample of participants. We gratefully acknowledge support from the resources supplied by the Centro de Servicios de Informatica y Redes de Comunicaciones (CSIRC) of the University of Granada (UGR). The project was approved by the UGR Human Ethics Committee 147/CEIH/2016. PND-2020-019 Financed research from Government Delegation grants for the National Plan on Drugs”, Spain. The study design, data collection, analysis and interpretation were carried out independently of the funding bodies, as were the writing up of the experiment and the decision to seek publication.
Disclosure
Dr David Crundall reports grants from Department for Transport during the conduct of the study, from RAC Foundation, from Road Safety Trust, from Driver and Vehicle Standards Agency, outside the submitted work; and is a founder of Esitu Solutions (the company supplies situation awareness assessment and training tools to industry). The authors report no other potential conflicts of interest for this work.
References
1. European Commision. 2019 Road safety statistics: what is behind the figures?; 2020. Available from: https://ec.europa.eu/commission/presscorner/detail/en/QANDA_20_1004.
2. Horswill MS. Hazard perception in driving. Curr Dir Psychol Sci. 2016;25(6):425–430. doi:10.1177/0963721416663186
3. De Craen S. The X-Factor: A Longitudinal Study of Calibration in Young Novice Drivers. TU Delf University of Technology; 2010.
4. Engström I, Gregersen NP, Hernetkoski K, Keskinen E, Nyberg A Young novice drivers, driver education and training. Report no. 491A. Linköping, Sweden: Swedish National Road and Transport Research Institute; 2003.
5. Kuiken M, Twisk D. Safe Driving and Training Calibration: Literature Review. The Netherlands: SWOW Institute for Road Safety research; 2001.
6. Sayer JR, Devonshire JM, Flannagan CA The effects of secondary tasks on naturalistic driving performance. Report no. UMTRI‐2005‐29. Ann Arbor, Michigan, USA: The University of Michigan, Transportation Research Institute; 2005.
7. McKenna FP, Horswill MS, Alexander JL. Does anticipation training affect drivers’ risk taking? J Exp Psychol Appl. 2006;12(1):1–10. doi:10.1037/1076-898X.12.1.1
8. Wetton M, Hill A, Horswill M. The development and validation of a hazard perception test for use in driver licensing. Accid Anal Prev. 2011;43(5):1749–1770. doi:10.1016/j.aap.2011.04.007
9. Deery HA, Love AW. The effect of a moderate dose of alcohol on the traffic hazard perception profile of young drink-drivers. Addiction. 1996;91(6):815–827. doi:10.1046/j.1360-0443.1996.9168158
10. Hull M, Christie R Hazard perception test: the Geelong trial and future development. 1992. In
11. Horswill MS, McKenna FP. Drivers’ hazard perception ability: situation awareness on the road. In: Banbury S, Tremblay S, editors. A Cognitive Approach to Situation Awareness: Theory and Application. London: Ashgate Publishing, Ltd; 2004:155–175.
12. Castro C, Padilla JL, Roca J, et al. Development and validation of the Spanish hazard perception test. Traf Inj Prev. 2014;15(8):817–826. doi:10.1080/15389588.2013.879125
13. Ventsislavova P, Gugliotta A, Peña-Suarez E, et al. What happens when drivers face hazards on the road? Accid Anal Prev. 2016;91:43–54. doi:10.1016/j.aap.2016.02.013
14. McKenna FP, Crick JL. Experience and expertise in hazard perception. In: Grayson GB, Lester JF, editors. Behavioural Research in Road Safety. UK: PA2038/91.Transport and Road Research Laboratory; 1991.
15. Horswill MS, McKenna FP. The development, validation, and application of a video-based technique for measuring an everyday risk-taking behavior: drivers‘ speed choice. J Appl Psychol. 1999;84(6):977–985. doi:10.1037/0021-9010.84.6.977
16. Horswill MS, Hill A, Silapurem L. The development and validation of video-based measures of driver’s following distance and gap acceptance behaviors. Accid Anal Prev. 2020;146:105626. doi:10.1016/j.aap.2020.105626
17. Arendasy ME, Hergovich A, Sommer M, Bognar B. Dimensionality and construct validity of a clips-based, objective personality test for the assessment of willingness to take risks in road traffic. Psychol Rep. 2005;97(1):309–320. doi:10.2466/pr0.97.1.309-320
18. Hergovich A, Arendasy M, Sommer M, Bognar B. The Vienna risk-taking test - traffic: a new measure of road traffic risk-taking. J Individ Diffe. 2007;28(4):198–204. doi:10.1027/1614-0001.28.4.198
19. Ba Y, Zhang W, Salvendy G, Cheng AS, Ventsislavova P. Assessments of risky driving: a Go/No-Go simulator driving task to evaluate RDM and associated behavioral patterns. Appl Ergon. 2016;52:265–274. doi:10.1016/j.apergo.2015.07.020
20. Wells P, Tong S, Sexton B, Grayson G, Jones E. Cohort II: A Study of Learner and New Drivers. London: Department of Transport (UK); 2008.
21. Horswill MS, Hill A, Jackson T. Scores on a new hazard prediction test are associated with both driver experience and crash involvement. Transp Res Part F Traffic Psychol Behav. 2020;71:89–109. doi:10.1016/j.trf.2020.03.016
22. Botzer A, Musicant O, Mama Y. Relationship between hazard-perception-test scores and proportion of hard-braking events during on-road driving - an investigation using a range of thresholds for hard-braking. Accid Anal Prev. 2019;132:105267. doi:10.1016/j.aap.2019.105267
23. Hill A, Horswill MS, Whiting J, Watson O. Computer-based hazard perception test scores are associated with the frequency of heavy braking in everyday driving. Accid Anal Prev. 2019;122:207–214. doi:10.1016/j.aap.2018.08.030
24. Crundall D, Chapman P, Trawley S, et al. Some hazards are more attractive than others: drivers of varying experience respond differently to different types of hazard. Accid Anal Prev. 2012;45:600–609. doi:10.1016/j.aap.2011.09.049
25. Pradhan AK, Crundall D. Hazard avoidance in young novice drivers: definitions and a Framework. (Chapter 6). In: Fisher DL, Caird JK, Horrey JKW, Trick L, editors. Handbook of Teen and Novice Drivers: Research, Practice, Policy, and Directions. FL: CRC Press; 2016:61-73. doi:10.1201/9781315374123.
26. Endsley MR. Toward a theory of situation awareness in dynamic systems. Hum Factors. 1995;37(1):32–64. 10.1518/001872095779049543
27. Muela I, Chica A, Garcia-Fernandez P, Castro C. Visual attention in realistic driving situations: attentional capture and hazard prediction. Appl Ergon. 2021;2021(90):103235. doi:10.1016/j.apergo.2020.103235
28. Sitkin SB, Pablo AL. Reconceptualizing the determinants of risk behavior. Acad Manage Rev. 1992;17(1):137–153. doi:10.5465/AMR.1992.4279564
29. Armsby P, Boyle AJ, Wright CC. Methods for assessing drivers‘ perception of specific hazards on the road. Accid Anal Prev. 1989;21(1):45–60. doi:10.1016/0001-4575(89)90048-1
30. Dahlen ER, White RP. The big five factors, sensation seeking, and driving anger in the prediction of unsafe driving. Pers Individ Dif. 2006;41(5):903–915. doi:10.1016/j.paid.2006.03.016
31. Ulleberg P, Rundmo T. Personality, attitudes and risk perception as predictors of risky driving behaviour among young drivers. Saf Sci. 2003;41(5):427–443. doi:10.1016/S0925-7535(01)00077-7
32. Machin M, Sankey K. Relationships between young drivers’ personality characteristics, risk perceptions, and driving behaviour. Accid Anal Prev. 2008;40(2):541–547. doi:10.1016/j.aap.2007.08.010
33. Constantinou E, Panayiou G, Konstantinou N, Loutsiou-Ladd A, Kapardis A. Risky and aggressive driving in young adults: personality matters. Accid Anal Prev. 2011;43(4):1323–1331. doi:10.1016/j.aap.2011.02.002
34. Taubman-Ben-Ari O, Mikulincer M, Gillath O. The multidimensional driving style inventory-scale construct and validation. Accid Anal Prev. 2004;36(3):323–332. doi:10.1016/S0001-4575(03)00010-1
35. Padilla JL, Doncel P, Gugliotta A, Castro C. Which drivers are at risk? Factors that determine the profile of the reoffender driver. Accid Anal Prev. 2018;119:237–247. doi:10.1016/j.aap.2018.07.021
36. Halpern-Felsher B, Ramos M, Exley T, Aggarwal S. Development factors in risky driving (Chapter 9). In: Fisher DL, Caird JK, Horrey JKW, Trick L, editors. Handbook of Teen and Novice Drivers: Research, Practice, Policy, and Directions. FL: CRC Press; 2016:107-116. doi:10.1201/97815374123.
37. Wetton MA, Horswill MS, Hatherly C, Wood JM, Pachana NA, Anstey KJ. The development and validation of two complementary measures of drivers’ hazard perception ability. Accid Anal Prev. 2010;42(4):1232–1239. doi:10.1016/j.aap.2010.01.017
38. Lim PC, Sheppard E, Crundall D. A predictive hazard perception paradigm differentiates driving experience cross-culturally. Transp Res Part F Traffic Psychol Behav. 2014;26:210–217. doi:10.1016/j.trf.2014.07.010
39. Ventsislavova P, Crundall D, Baguley T, et al. A comparison of hazard perception and hazard prediction tests across China, Spain and the UK. Accid Anal Prev. 2019;122:268–286. doi:10.1016/j.aap.2018.10.010
40. Haladyna T. Developing and Validating Multiple-Choice Items. Lawrence Erlbaum Associates, Inc; 1994.
41. Castro C, Ventsislavova P, Peña-Suarez E, et al. Proactive listening to a training commentary improves hazard prediction. Saf Sci. 2016;82:144–154. doi:10.1016/j.ssci.2015.09.018
42. Gugliotta A, Peña-Suárez E, Ventsislavova P, et al. Are situation awareness and decision-making in driving totally conscious processes? Results of a hazard prediction task. Transp Res Part F Traffic Psychol Behav. 2017;44:168–179. doi:10.1016/j.trf.2016.11.005
43. Castro C, Padilla JL, Doncel P, et al. How are distractibility and hazard prediction in driving related? Role of driving experience as moderating factor. Appl Ergon. 2019;81:102886. doi:10.1016/j.apergo.2019.102886
44. Castro C, Muela I, Doncel P, Garcia-Fernandez P. Hazard perception and prediction test for walking, riding a bike and driving a car: “Understanding of the global traffic situation”. PLoS One. 2020;15(10):e0238605. doi:10.1371/journal.pone
45. Crundall D. Hazard prediction discriminates between novice and experienced drivers. Accid Anal Prev. 2016;2016(86):47–58. doi:10.1016/j.aap.2015.10.006
46. Gregersen NP. Young drivers’ overestimation of their own skill - an experiment on the relation between training strategy and skill. Accid Anal Prev. 1996;28(2):243–250. doi:10.1016/0001-4575(95)00066-6
47. Rowe R, Andrews E, Harris PR, Armitage CJ, McKenna FP, Norman P. Identifying beliefs underlying pre-drivers’ intentions to take risks: an application of the theory of planned behaviour. Accid Anal Prev. 2016;89:49–56. doi:10.1016/j.aap.2015.12.024
48. Katila A, Keskinen E, Hatakka M, Laapotti S. Does increased confidence among novice drivers imply a decrease in safety? The effects of skid training on slippery road accidents. Accid Anal Prev. 2004;36(4):543–550. doi:10.1016/S0001-4575(03)00060-5
49. Horswill MS, Hill A, Silapurem L, Watson MO. A thousand years of crash experience in three hours: an online hazard perception training course for drivers. Accid Anal Prev. 2021;152:105969. doi:10.1016/j.aap.2020.105969
50. Horrey WJ, Lesch MF, Mitsopoulos-Rubens E, Lee JD. Calibration of skill and judgement in driving: development of a conceptual framework and the implications for road safety. Accid Anal Prev. 2015;76:25–33. doi:10.1016/j.aap.2014.12.017
51. Kroll V, Mackenzie AK, Goodge T, Hill R, Davies R, Crundall D. Creating a hazard-based training and assessment tool for emergency response drivers. Accid Anal Prev. 2020;144:105607. doi:10.1016/j.aap.2020.105607
52. Fuller R. Driver control theory: from task difficulty homeostasis to risk allostasis. (Chapter 2) In: Porter BE, editor. Handbook of Traffic Psychology. Amsterdam: Elsevier; 2011:13–26. doi:10.1016/C2009-0-01975-8
53. Patten CJ, Kircher A, Ostlund J, Nilsson L, Svenson O. Driver experience and cognitive workload in different traffic environments. Accid Anal Prev. 2006;38(5):887–894. doi:10.1016/j.aap.2006.02.014
54. Wilde GJS. The theory of risk homeostasis: implications for safety and health. Risk Analysis. 1982;1882(2):
55. Wilde GJS. Risk homeostasis theory and traffic accidents: propositions, deductions and discussion of dissension in recent reactions. Ergonomics. 1988;31(4):
56. Horswill MS, Hill A, Rodwell D, Larue GS, Bates L, Watson B. A brief and unsupervised online intervention improves performance on a validated test of hazard perception skill used for driver licensing. Transp Res Part F Traffic Psychol Behav. 2021;78:1130–1136. doi:10.1016/j.trf.2021.02.003
57. Ledesma RD, Fernando PJ, Trogolo MA, Poo FM, Tosi JD, Castro C. Exploratory factor analysis in transportation research: current practices and recommendations. Transp Res Part F Traffic Psychol Behav. 2021;78:340–352. doi:10.1016/j.trf.2021.02.021
58. International Test Commission (ITC). The ITC Guidelines for Translating and Adapting Tests.
59. Madigan R, Romano R. Does the use of a head mounted display increase the success of risk awareness and perception training (RAPT) for drivers? Appl Ergon. 2020;85:103076. doi:10.1016/j.apergo.2020.103076
 © 2021 The Author(s). This work is published and licensed by Dove Medical Press Limited. The
full terms of this license are available at https://www.dovepress.com/terms
and incorporate the Creative Commons Attribution
- Non Commercial (unported, 3.0) License.
By accessing the work you hereby accept the Terms. Non-commercial uses of the work are permitted
without any further permission from Dove Medical Press Limited, provided the work is properly
attributed. For permission for commercial use of this work, please see paragraphs 4.2 and 5 of our Terms.
© 2021 The Author(s). This work is published and licensed by Dove Medical Press Limited. The
full terms of this license are available at https://www.dovepress.com/terms
and incorporate the Creative Commons Attribution
- Non Commercial (unported, 3.0) License.
By accessing the work you hereby accept the Terms. Non-commercial uses of the work are permitted
without any further permission from Dove Medical Press Limited, provided the work is properly
attributed. For permission for commercial use of this work, please see paragraphs 4.2 and 5 of our Terms.