Back to Journals » Journal of Pain Research » Volume 16
Risk Factors in Patients with Low Back Pain Under 40 Years Old: Quantitative Analysis Based on Computed Tomography and Magnetic Resonance Imaging mDIXON-Quant
Authors Fan Z, Wang T, Wang Y, Zhou Z, Wu T, Liu D ![]()
Received 7 July 2023
Accepted for publication 28 September 2023
Published 9 October 2023 Volume 2023:16 Pages 3417—3431
DOI https://doi.org/10.2147/JPR.S426488
Checked for plagiarism Yes
Review by Single anonymous peer review
Peer reviewer comments 2
Editor who approved publication: Dr Alaa Abd-Elsayed
Zheng Fan,1 Tong Wang,2 Yang Wang,3 Zimo Zhou,1 Tong Wu,1 Da Liu1
1Department of Orthopedics, Shengjing Hospital of China Medical University, Shenyang, Liaoning, People’s Republic of China; 2Department of Radiology, Shengjing Hospital of China Medical University, Shenyang, Liaoning, People’s Republic of China; 3Departments of Orthopedics, The 4th People’s Hospital of Shenyang, Liaoning, Shenyang, Liaoning, People’s Republic of China
Correspondence: Da Liu, Department of Orthopedics, Shengjing Hospital of China Medical University, Shenyang, Liaoning, 110004, People’s Republic of China, Email [email protected]
Purpose: While low back pain (LBP) constitutes a global life disorder cause, the contribution of paraspinal muscles to its pathogenicity remains elusive. We characterized the paraspinal muscles of patients with LBP using lumbar three-dimensional computed tomography (CT) and magnetic resonance imaging (MRI) mDIXON-Quant, and evaluated the risk factors combined with clinical data.
Methods: A retrospective study involving 181 patients (10– 40 years) who underwent lumbar 3D-CT and MRI mDIXON from January 1, 2021 to December 31, 2022, and divided into normal, non-chronic LBP [non-CLBP], and CLBP groups. Clinical data, paraspinal muscle cross-sectional area, Hounsfield unit for CT values, and fat fraction derived from mDIXON-Quant were compared. Three readers analyzed the images independently; intra- and interobserver agreement was measured. Spearman analysis and multiple logistic regression were used to analyze the correlation between clinical data, radiologic and paraspinal muscle parameters. A nomogram was constructed for individualized prediction.
Results: Correlation analysis revealed that body mass index, visual analog scale score, Pfirrmann grade, annulus fibrosus tear, lumbar lordosis (LL), and Modic changes correlated with LBP (all P< 0.05). The Pfirrmann grade and annulus fibrosus tear showed positive correlation (r=0.673, 0.559), whereas LL was negatively correlated (r=− 0.469). The multifidus CT values were negatively correlated with LBP at L4– 5/L5–S1; the multifidus fat fraction was positively correlated at L4– 5/L5–S1 (r=0.734, r=0.584, P< 0.001). The multiple logistic regression showed that L4– 5 multifidus fat fraction (P=0.046, OR=1.167), Pfirrmann grade (P=0.017, OR=0.063), LL (P=0.002, OR=0.828) and annulus fibrosus tear (P=0.005, OR=0.024) were risk factors for predicting LBP in the non-CLBP group; in the CLBP group, BMI (P=0.048 OR=1.225), L4-5 multifidus fat fraction (P=0.001 OR=1.299), LL (P=0.003, OR=0.841) and Pfirrmann classification (P=0.009, OR=0.046) were risk factors.
Conclusion: BMI, L4-5 multifidus fat fraction, LL, and Pfirrmann grade are risk factors for CLBP in patients under 40; whereas annulus fibrosus tear is an independent risk factor for non-CLBP, nomograms derived from these parameters can help predict LBP and MRI mDIXON-Quant is recommended for quantitatively analyzing paraspinal muscle fat infiltration.
Keywords: chronic low back pain, paraspinal muscles, fat infiltration, Pfirrmann grade, computed tomography values, mDIXON-Quant
Introduction
Since 1990, low back pain (LBP) has gradually become a major cause of life disorders worldwide.1 According to the definition of the National Institutes of Health (NIH), LBP is a type of pain that lasts for at least 3 months and that is being experienced for longer than half a day in the last 6 months.2
Many factors lead to LBP, and it is now generally accepted that LBP is associated with lumbar disc degeneration, atrophy, and fat infiltration in the multifidus and erector spinalis muscles.3,4 Paraspinal muscles (multifidus, erector spinae) are the main stabilizers of the lumbar spine. Previous studies demonstrated the correlation between fat infiltration in paraspinal muscles and LBP,5 while some studies have suggested an association between endplate degeneration and altered sagittal angulation of the spine.6,7 The onset age of LBP is at a younger age, but the current research mainly focuses on older people and has not been widely implemented in young and middle-aged populations.8
Computed tomography (CT) and magnetic resonance imaging (MRI) are commonly used imaging techniques to assess lumbar disc degeneration and fat infiltration of the paraspinal muscles.8 CT measures the CT value and cross-sectional area (CSA) of the paraspinal muscles and is used to reflect muscle density and performance—the higher the degree of fat substitution in muscle, the lower the CT value.9 MRI mDIXON-Quant (PHILIPS Healthcare) uses three-dimensional (3D) acquisition of gradient echo sequences and acquires six echoes, which can achieve multiple contrast display and fat quantification. It has the advantages of being noninvasive, convenient to collect, and highly reproducible. Previous studies had shown that mDIXON can be used to quantify muscle adipose tissue, both intramuscular and intermuscular, at high resolution.10 Yet, few studies have compared both techniques for the evaluation of paraspinal muscles.11
In this study, we excluded the effects of degenerative lumbar spondylolisthesis, facet joint osteoarthritis occurring in older patients, as well as endocrine effects due to menopause in women, and used CT and MRI mDIXON-Quant for the quantitative analysis of the paraspinal muscles to understand the reliability of these methods. We additionally combined them with other imaging features and clinical data to investigate the risk factors for LBP in young and middle-aged patients.
Materials and Methods
We retrospectively analyzed a total of 181 patients (age range, 10–40 years) who simultaneously underwent MRI mDIXON-Quant and 3D-CT of the lumbar spine at our hospital from January 1, 2021, to December 31, 2022, among which were 66 normal cases, 32 patients with non-chronic LBP (pain lasting < 3 months), and 83 patients with chronic LBP (pain lasting≥3 months). The two imaging modality mentioned above were performed in the normal population for routine physical examinations or for differential diagnosis of other diseases (Table 1).
 |
Table 1 Descriptive Statics of Demographic and Clinical Data |
The inclusion criteria were as follows: 1) complete imaging and clinical data; 2) being able to follow up; 3) no history of drug abuse; 4) no history of abdominal or pelvic surgery. The exclusion criteria were the following: 1) age <10 years or >40 years; 2) history of previous spinal trauma or surgery; 3) presence of kyphosis, scoliosis, or congenital dysplasia; 4) previous history of vertebral infection, tuberculosis, or myelopathy. The study was conducted in accordance with the Declaration of Helsinki and approved by the Institutional Review Board of Shengjing Hospital of China Medical University (protocol code: 2023PS382K).
CT and MRI Scanning Techniques
Axial and reformatted sagittal images were acquired using a CT scanner (Philips IQon-Spectral CT or Philips iCT 256, The Netherlands). The CT scanning parameters were as follows: tube current modulation, 120 kVp; rotation speed, 0.33 s/rotation; helical pitch, 0.671; collimation, 64×0.625 mm; and matrix, 512×512, with a slice thickness of 1 mm at 1-mm increments.
MRI was performed using an Ingenia 3.0T magnetic resonance system (Philips Healthcare, Netherlands) with a spine coil used for participants. The MRI sequences are listed in Table 2.
 |
Table 2 Parameters of MRI m-DIXON-Quant |
Image Analysis
All measurements were performed independently by two senior radiologists and one senior spinal surgeon (with 10 years of experience) using a postprocessing workstation (IntelliSpace Portal Version 6.5, Philips Healthcare), and the mean values were calculated. The intra-observer and inter-observer agreement of the measurements was excellent (intraclass correlation coefficient [ICC] 0.78–0.90).
We analyzed images on Neusoft PACS phantom workstation (V5.5.0, Neusoft Group Co., Ltd., China) and regions of interest (ROIs) were manually drawn along the muscle margins on axial CT and MRI. The collected data were from the L4 upper and lower endplates, L4–5 middle of the intervertebral disc, L5 upper and lower endplates, and L5–S1 intervertebral disc level. The paraspinal muscle area, Hounsfield unit (HU) on CT, and fat fraction were calculated on the painful side, using the average of both sides if the pain location is uncertain.
The following parameters were obtained (Figures 1 and 2): 1) lumbar lordosis (LL) was measured from the L1 upper endplate to the S1 upper endplate; 2) a high-intensity annular fracture at the edge of the fibrous ring was judged to be an annulus fibrosus tear; 3) low back fasciitis showed a low signal on T1WI and a high signal on T2WI; 4) evaluation of L4–5 and L5–S1 discs was performed in the MRI sagittal plane, and high values were taken—those with Pfirrmann grading 1, 2, or 3 were classified as category one (normal or mild) and those with Pfirrmann grades 4 and 5 were classified as category two (moderate/severe degeneration); 5) the endplate Modic changes were judged as follows: low signal at T1 and high signal at T2 on the MRI for type I, high signal at both T1 and T2 for type II, and low signal at both for type III; 6) the CSA of the multifidus and erector muscles was measured at the same level, and the region of interest was drawn along the edges of the muscles using the CT value (HU) and fat fraction on MRI mDIXON-Quant to indicate the degree of fat infiltration (FI); and 7) a visual analog scale (VAS) was used to assess the severity of pain in patients, with 0 representing no pain and 10 representing the most severe pain.
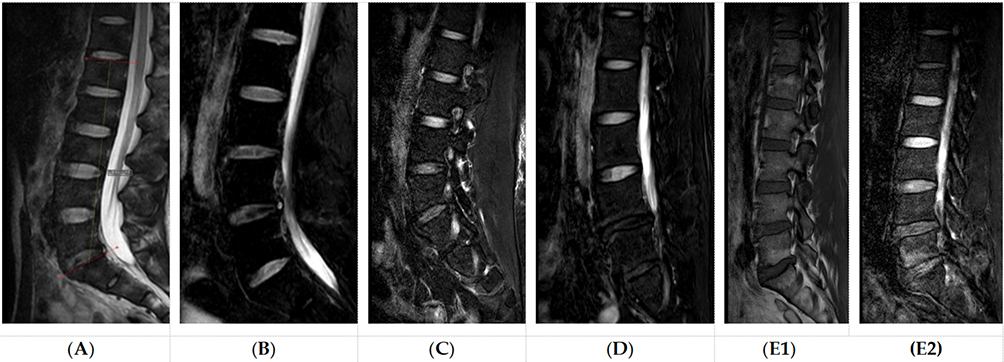 |
Figure 1 (A) Lumbar lordosis angle; (B) Fiber ring damage; (C) Lumbar back fasciitis; (D) Pfirrmann classification Grade V; (E1) and (E2) Modic change type II. |
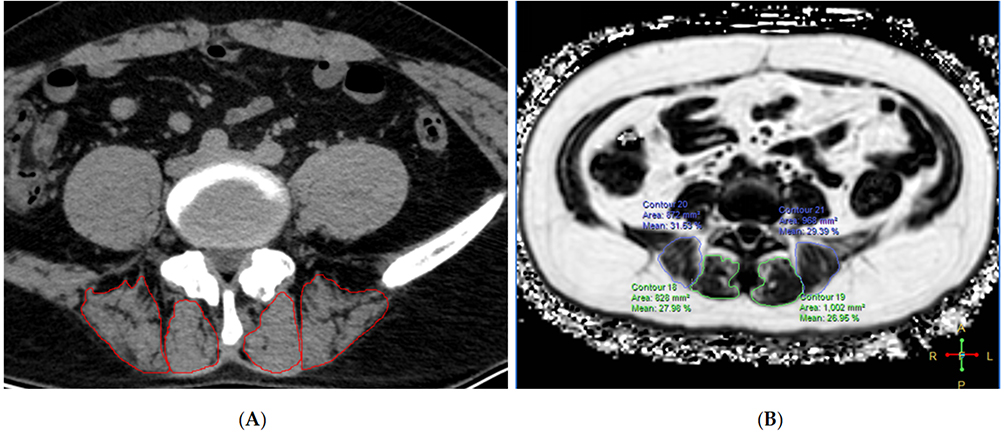 |
Figure 2 Image shows an example of the region of interest (ROI) of paraspinal muscle on axial plane and acquisition of the quantitative indicators.(A) for CT; (B) for MRI m-DIXON-Quant. |
Statistical Methodology
Data were analyzed using SPSS (R26.0, IBM), MedCalc (Version 19.6.4, Ostend, Belgium), and GraphPad Prism (Version 9.0.0, Dotmatics), and the normal distribution of each group was analyzed. The Mann–Whitney U-test and Kruskal–Wallis test were used for non-normally distributed data, while normally distributed data were compared using Student’s t-test or Fisher’s test, and categorical data were compared using chi-square tests.
Correlations between demographic data and radiological and clinical parameters were analyzed using Spearman’s analysis. Univariate and multivariate logistic regression were used to screen for significantly different variables. The ICC was used to calculate the agreement between readers’ assessments of the parameters. A nomogram was constructed using R (version 4.2.0). Statistical significance was set at P<0.05.
Results
A total of 181 patients (age range, 10–40 years) were enrolled in this study, including 66 in Group I (normal), 32 in Group II (non-CLBP), and 83 in Group III (CLBP). The body mass index (BMI), LL, Pfirrmann grade, and annulus fibrosus tear were significantly different in the three groups (P<0.05), and a further two-by-two comparison revealed that the difference between Groups II and III was not statistically significant (P>0.05) (Table 1).
CSA of Multifidus and Erector Spinae
CT measurements showed statistically significant differences between the three groups of multifidus in the upper and lower endplates of L4, and statistically significant differences were also uncovered in multifidus between Groups I and III (P<0.05). The same was true for the erector spinae at the same level, and statistically significant differences were found between Groups I and II. (P<0.05) (Table 3).
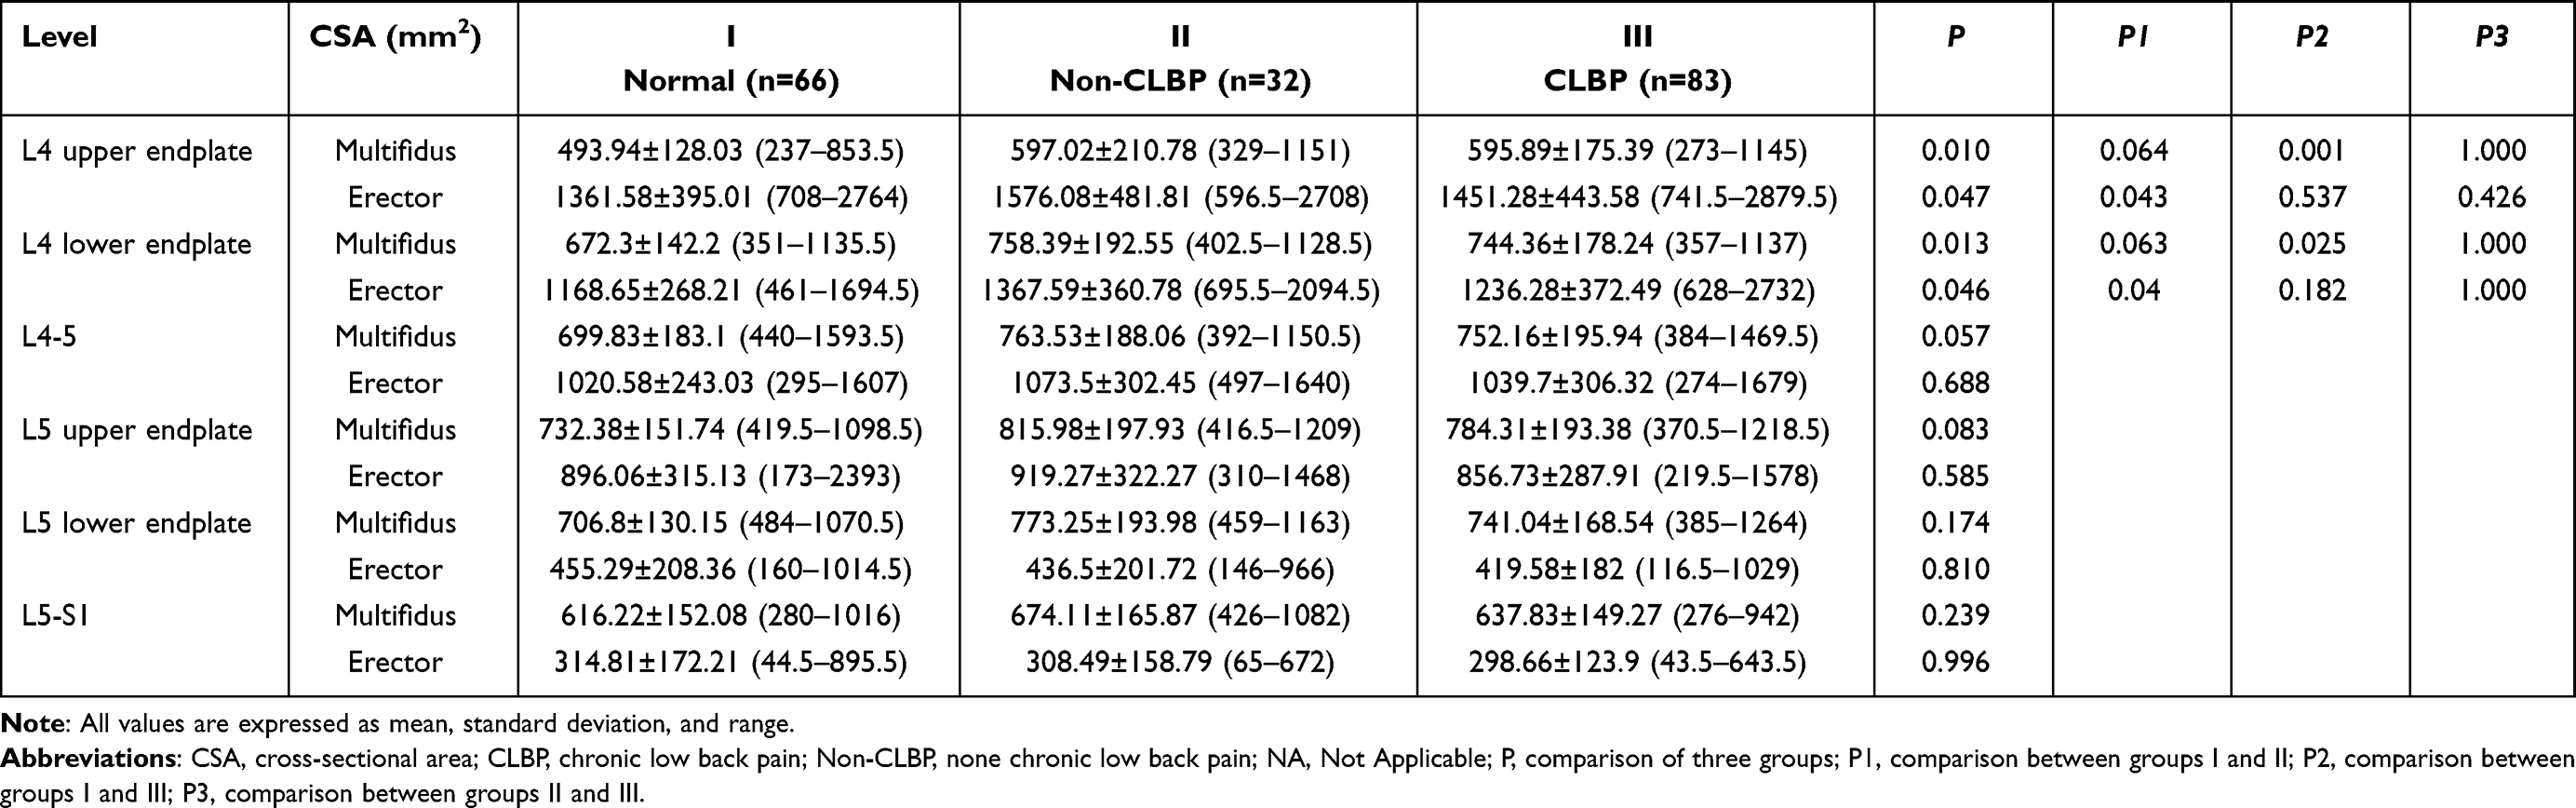 |
Table 3 Paraspinal Muscle Area and Statistical Difference Measured Under CT |
MRI results showed statistically significant differences between the three groups in the multifidus muscle at the L4 upper endplate level as well as between Groups I and III (P<0.05). The erector spinae at the L4 upper and lower endplate levels were significantly different among all three groups (P<0.05) (Table 4).
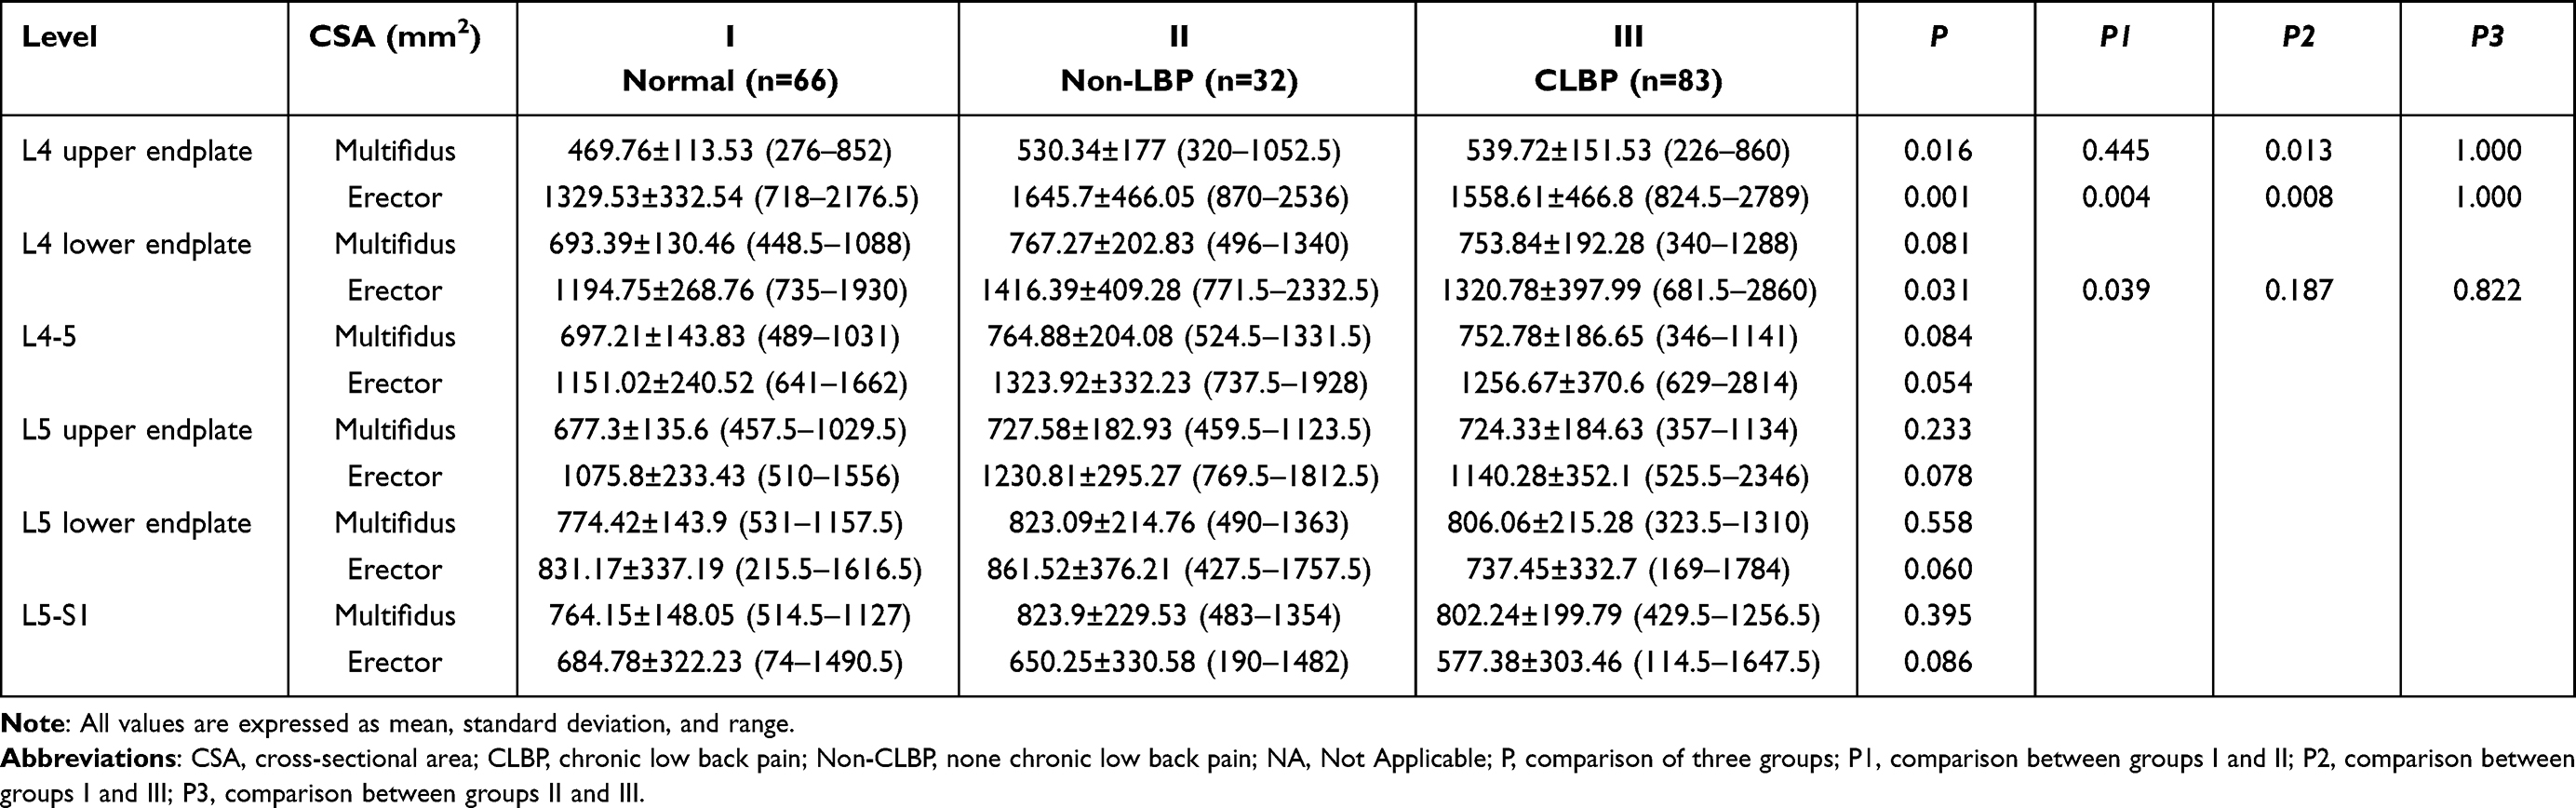 |
Table 4 Paraspinal Muscle Area and Statistical Difference Measured Under MR |
CT Values and MRI Fat Fraction of the Multifidus and Erector Spinae
The CT values of the multifidus in the L4 upper endplate, L5 lower endplate, and L5–S1 were significantly different (P<0.05). The difference between Groups I and III at the L5 lower endplate and L5–S1 was statistically significant (P<0.05); the CT value of the erector spinae was significantly different among the levels of the L4 lower endplate, L4–5, L5 upper and lower endplate, and L5–S1, and the difference between Groups I and III was statistically significant (P<0.05).
The fat fraction (FF) on MRI mDIXON-Quant showed statistically significant differences in the multifidus at the level of the L4 lower endplate, L4–5, L5 upper and lower endplates, and L5–S1. A pairwise group comparison revealed differences between Group I and III (P<0.05). The differences in the erector spinae were also significant among all three groups compared at the above levels (P<0.05) (Table 5).
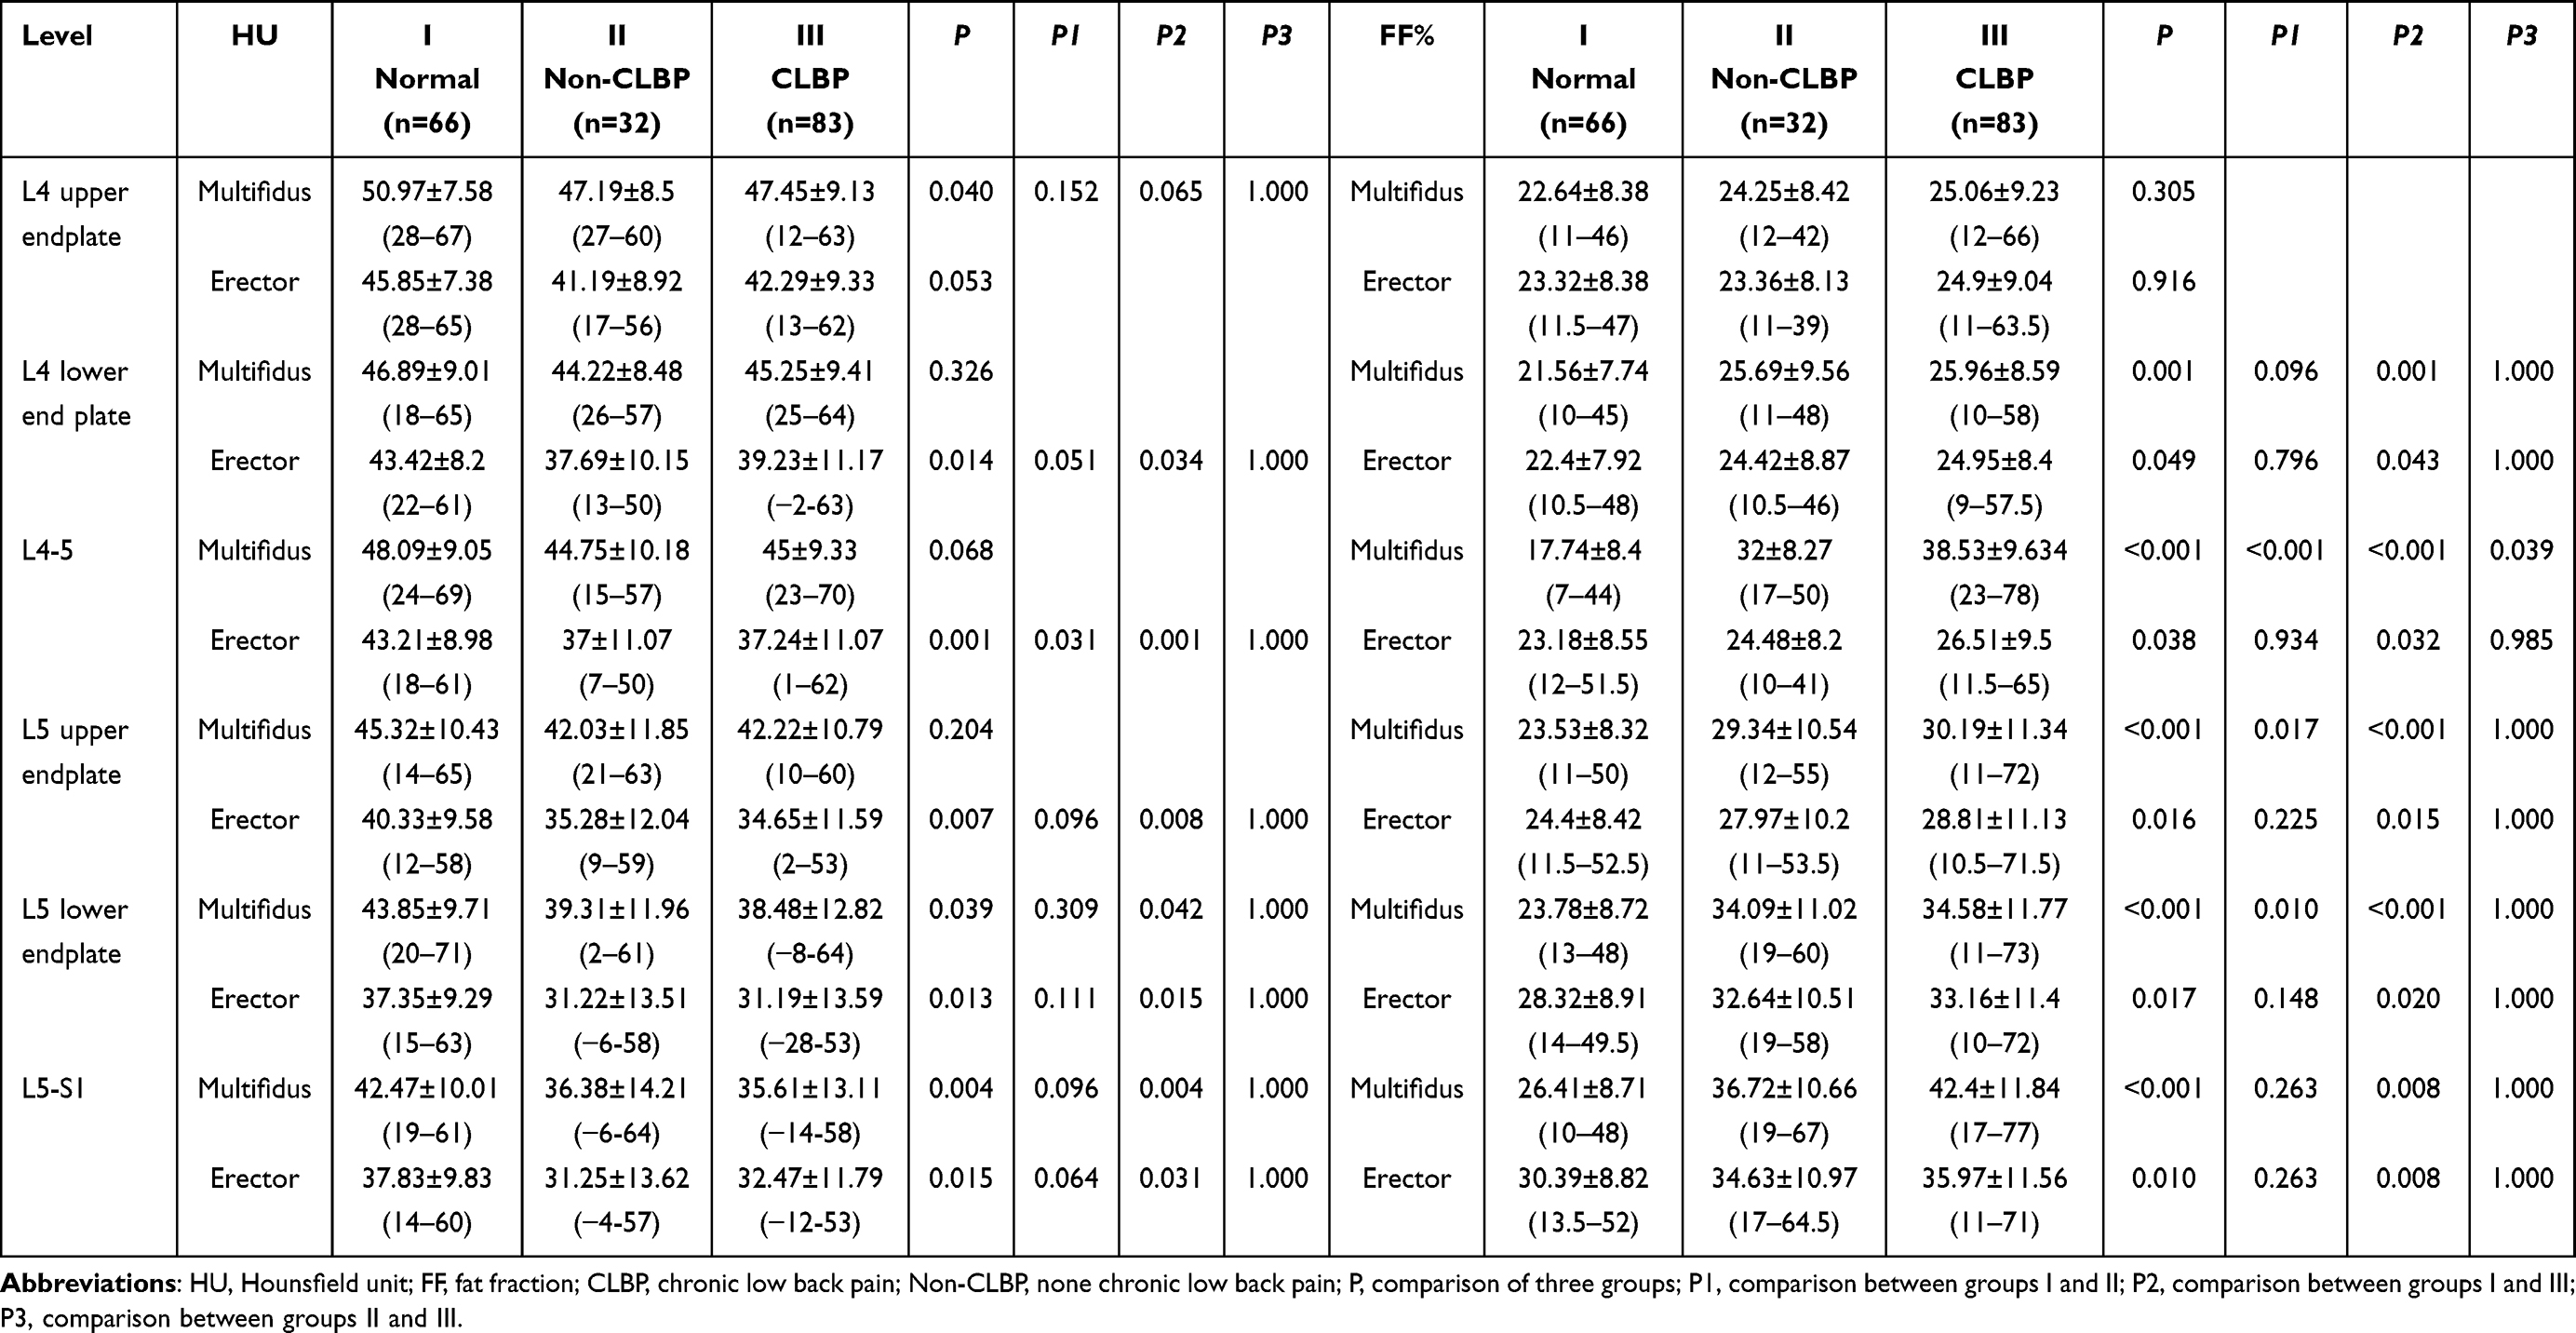 |
Table 5 CT Value and MRI Fat Fraction of Paraspinal Muscles |
Correlation Analysis
The BMI, VAS score, Pfirrmann grade, annulus fibrosus tear, LL, and Modic changes were all correlated with LBP (all P<0.05), of which the Pfirrmann grade (r=0.673) and annulus fibrosus tear (r=0.559) showed a moderate positive correlation, and LL showed a negative correlation (r=−0.469).
The CSA of the multifidus on CT was correlated at the L4 upper and lower endplates, L4-5 (P<0.05), whereas the CSA of the erector was not correlated at any level. The CSA of the multifidus on MRI was correlated at the L4 upper and lower endplates (both P<0.05), and the area of the erector was correlated at the L4 upper endplate, L5 lower endplate, and L5–S1 (all P<0.05). The CT values of the multifidus were negatively correlated with LBP at L4 upper endplate, L4–5, L5 lower endplate and L5–S1; the CT values of the erector spinae yielded negative correlations at all levels (all P<0.05); the FF of the multifidus exhibited positive correlations above moderate at L4–5 and L5–S1 (r=0.734, r=0.584, P<0.001), and the FF of the erector spinae bore a weak positive correlation at the same levels (r=0.193, r=0.221, P<0.05) (Figure 3 and Table 6).
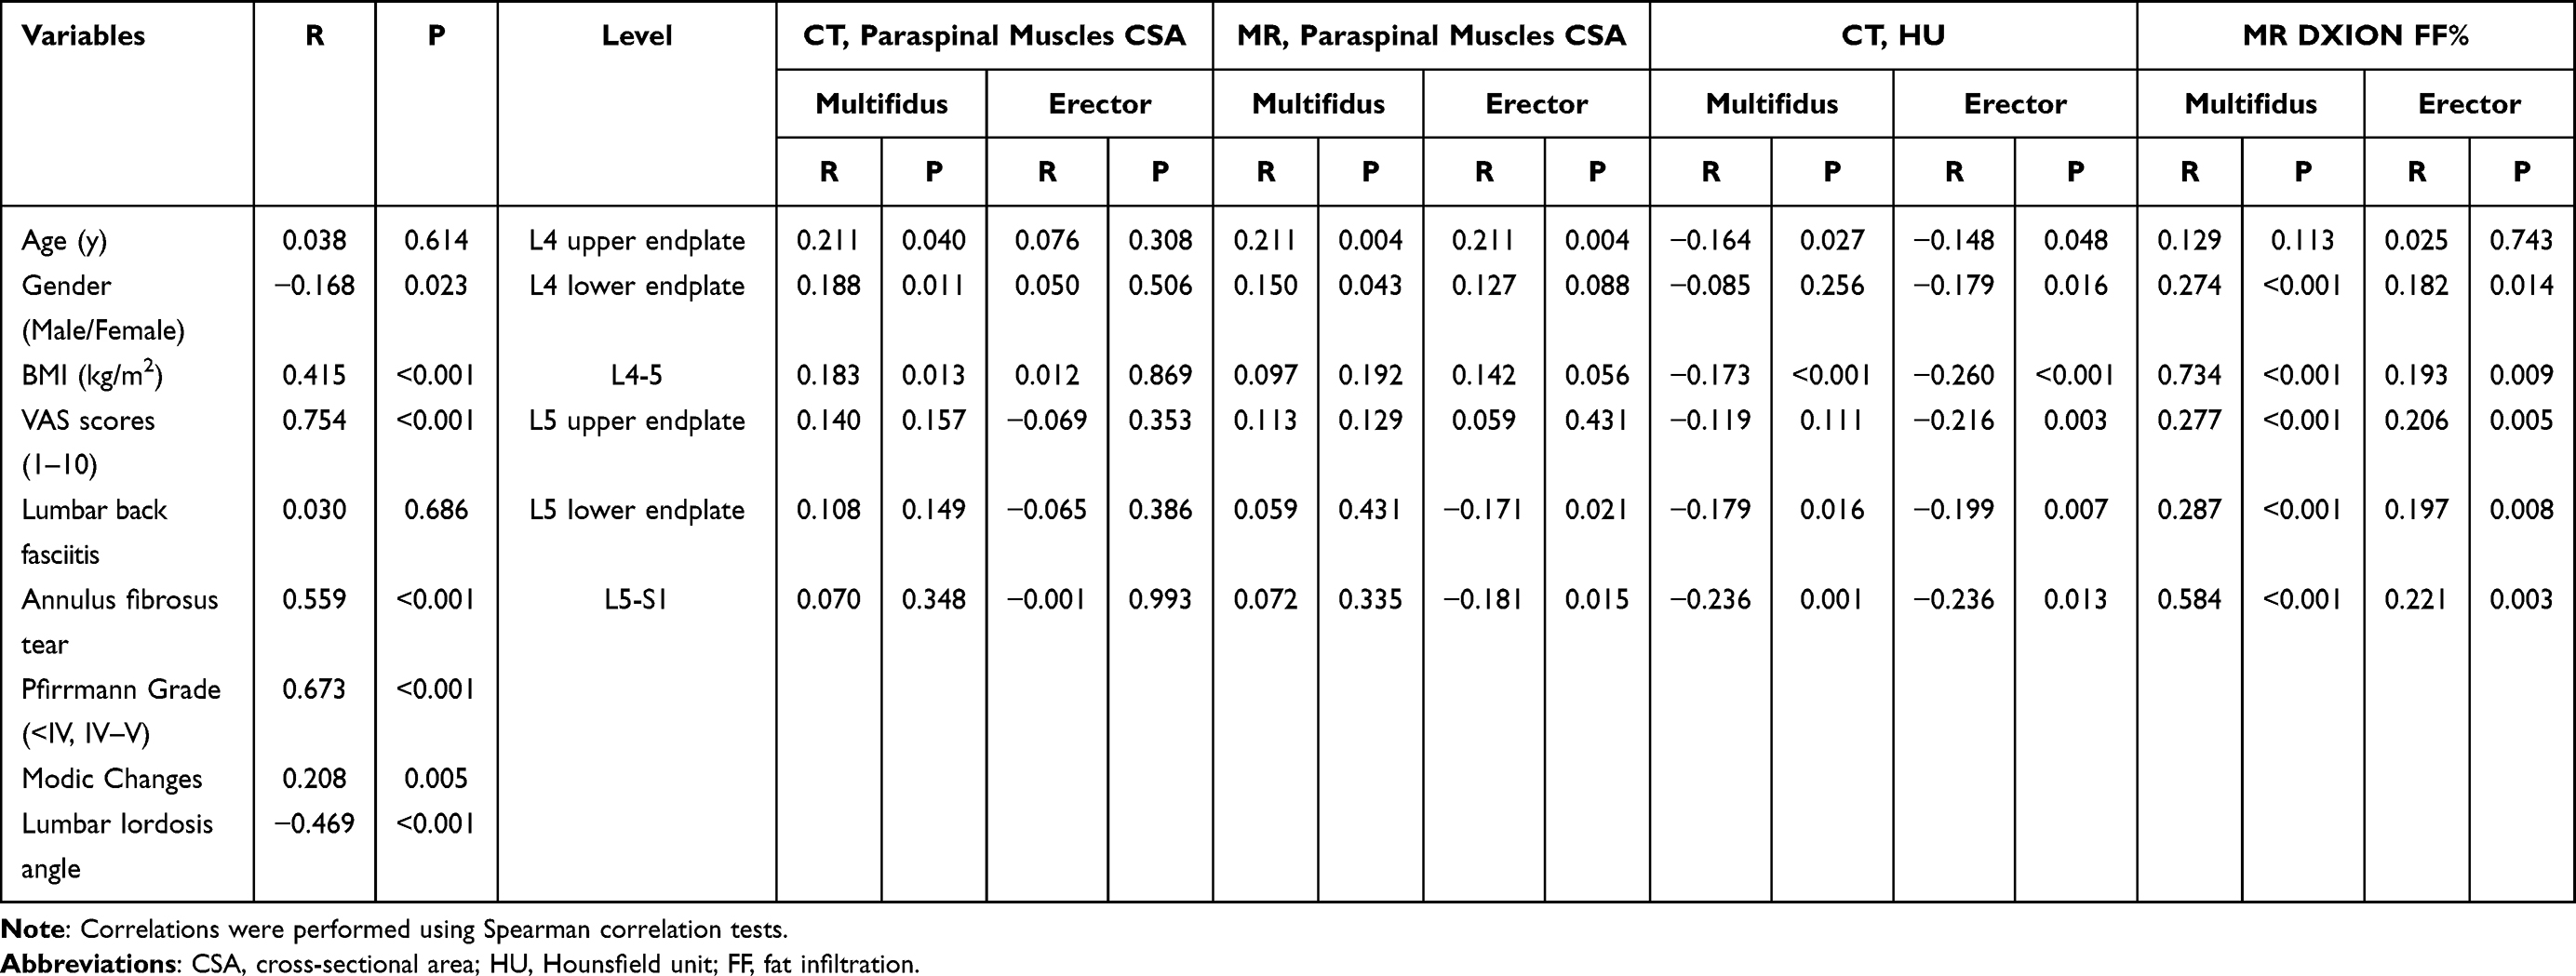 |
Table 6 Correlations Between Demographic Data, Clinical Data, CT Parameters, and MRI Parameters and LBP |
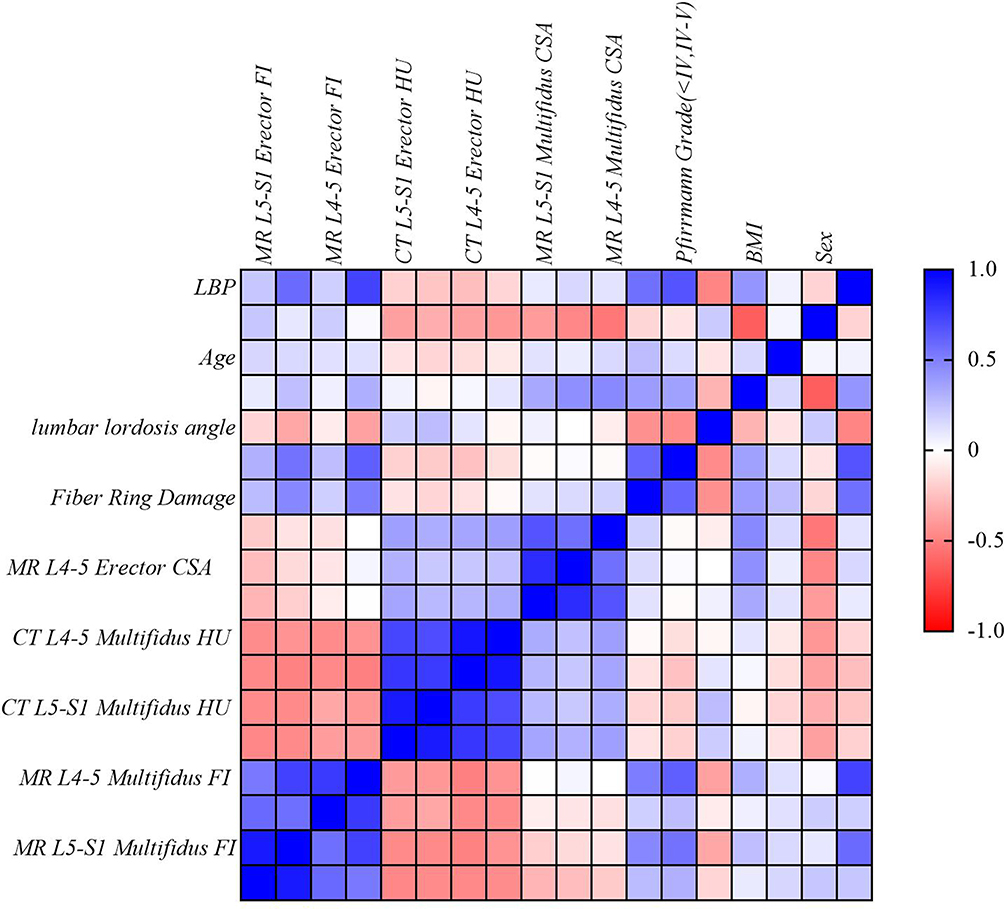 |
Figure 3 Correlation heat map. |
Multivariate Regression Analysis and Nomogram
For non-CLBP patients with a disease duration of <3 months, L4–5 multifidus FF (P=0.046, OR 1.167), LL (P=0.002, OR 0.828), Pfirrmann grade (P=0.017, OR 0.063), and annulus fibrosus tear (P=0.005, OR 0.024) were risk factors.
For CLBP patients with a disease course of ≥3 months, BMI (P=0.048 OR=1.225), L4–5 multifidus FF (P=0.001, OR 1.299), LL (P=0.003, OR 0.841), and Pfirrmann grade (P=0.009, OR 0.046) were risk factors (Table 7).
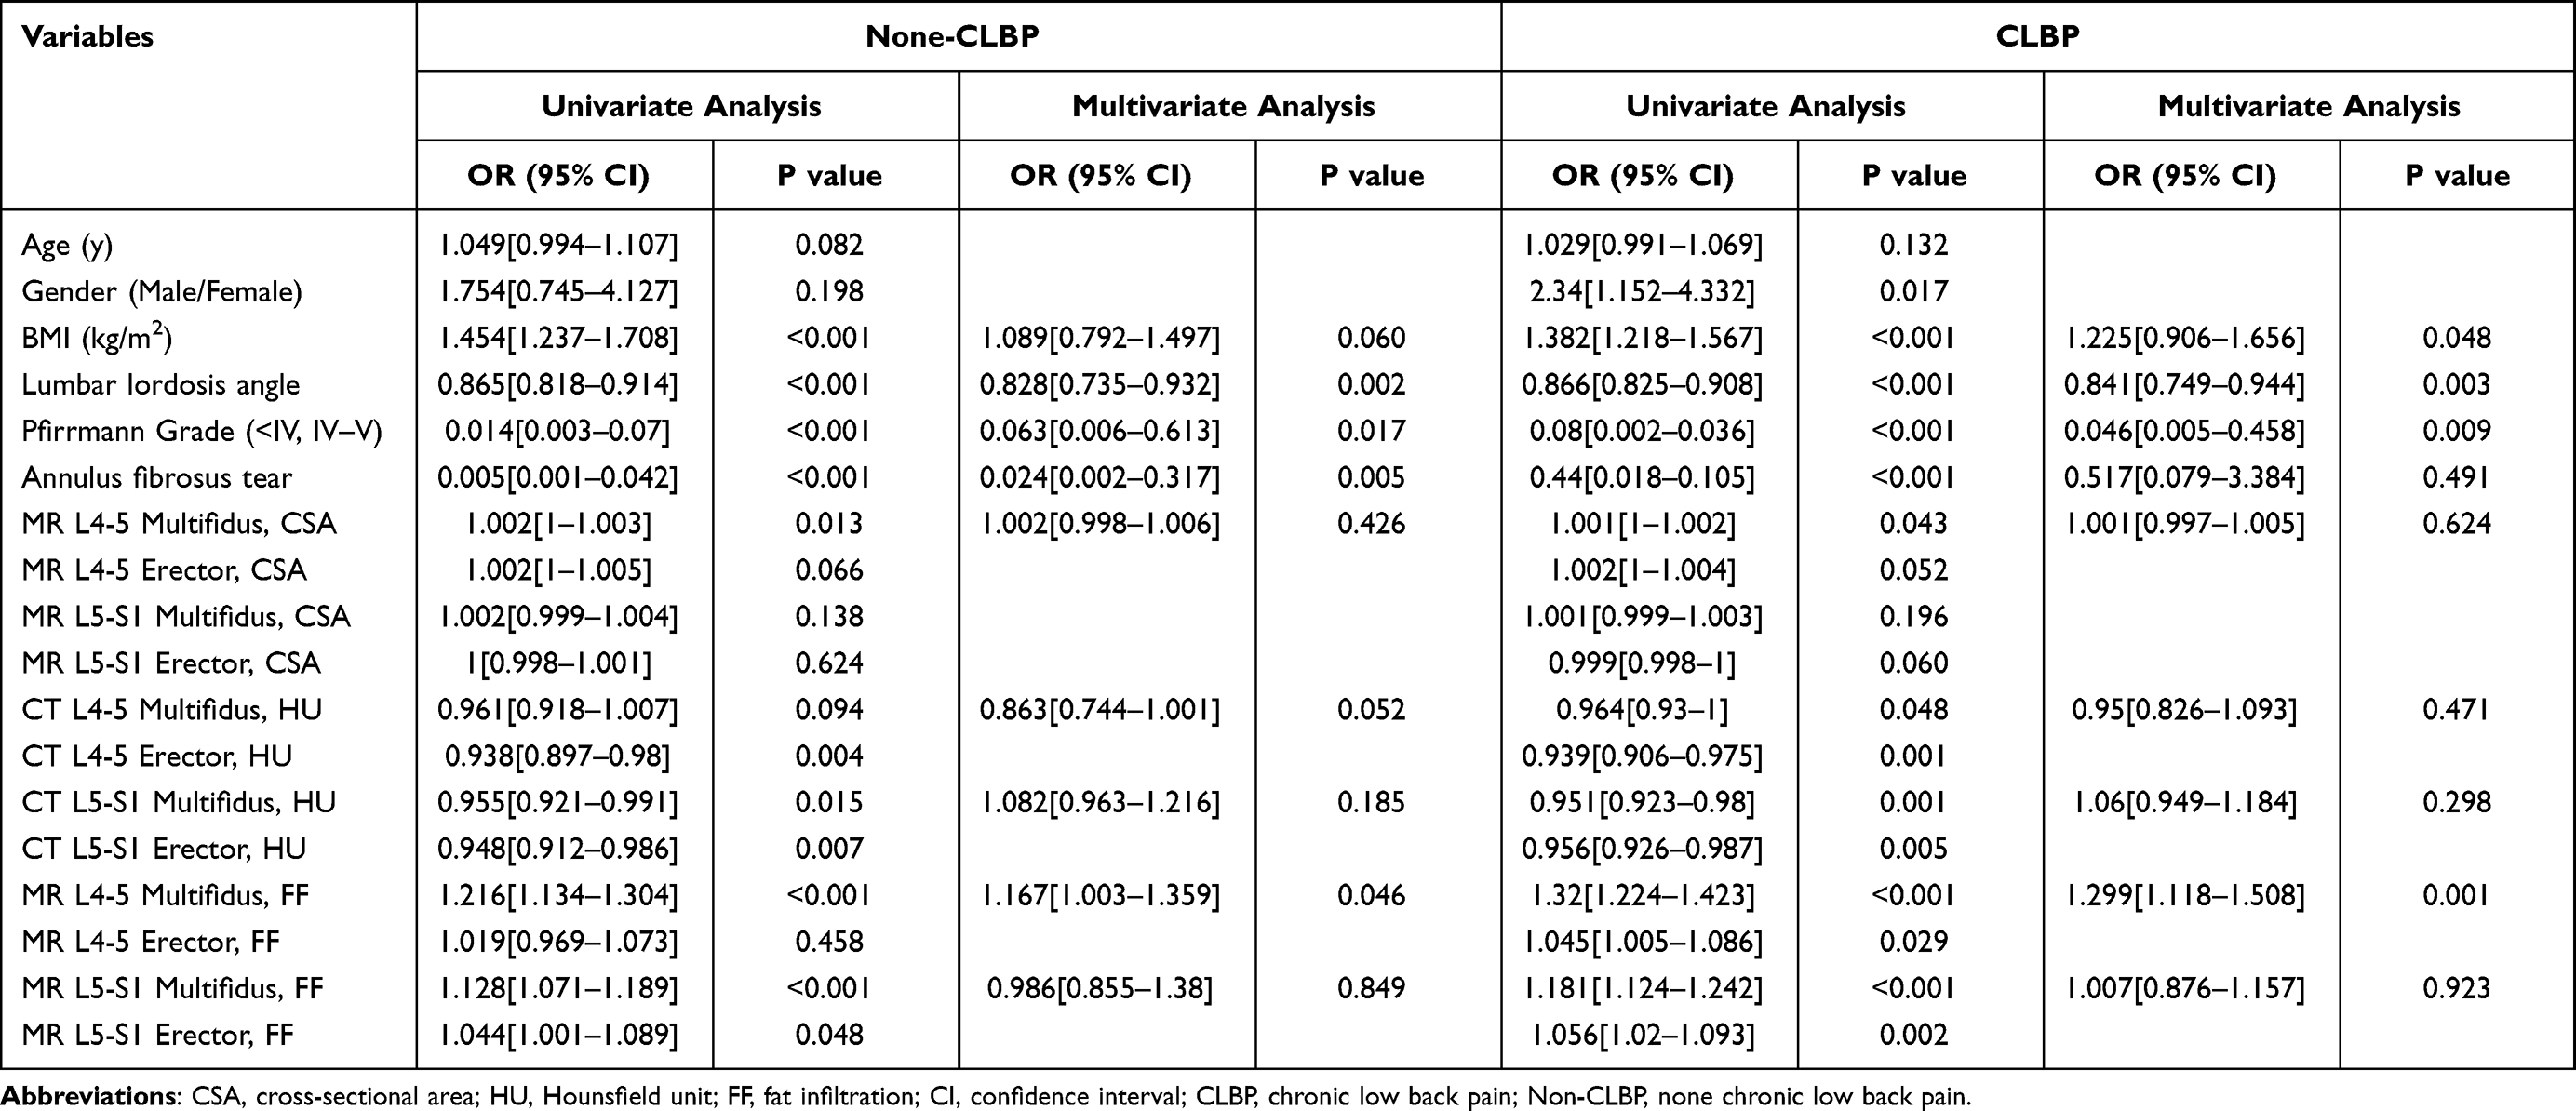 |
Table 7 Multivariate Analysis for Predicting Non-CLBP and CLBP Risk Factors |
These four parameters were used to build a nomogram respectively (Figures 4 and 5), with each feature corresponding to the value of the score in the uppermost scale and the sum of the scores corresponding to the hazard coefficient on the lowermost axis.
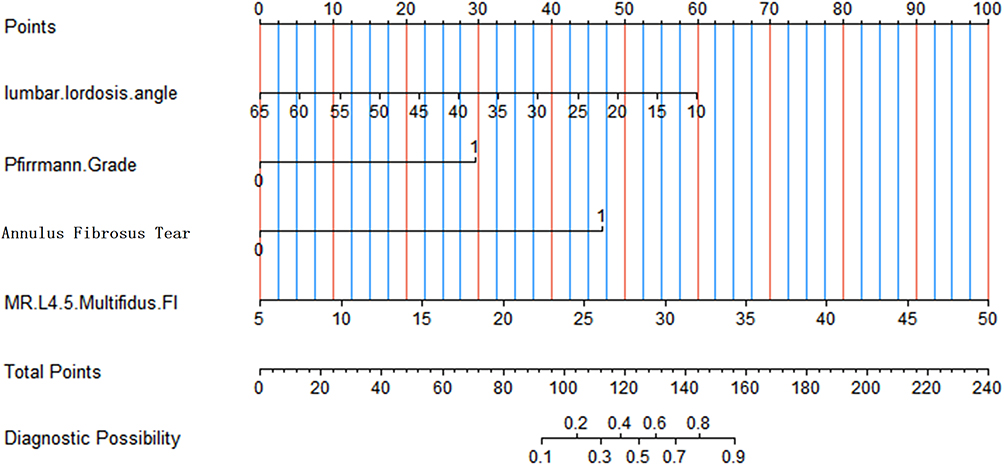 |
Figure 4 Nomogram created by combining the parameters predicting Non-CLBP. |
 |
Figure 5 Nomogram created by combining the parameters predicting CBLP. |
Discussion
In this study, we used CT and MRI mDIXON-Quant simultaneously to quantitatively analyze the CSA and fat infiltration (FI) of the multifidus and erector muscles and combined it with clinical data for LBP correlation and risk factor analysis. The results showed that there were statistically significant differences between BMI, LL, Pfirrmann grading, annulus fibrosus tear, and multiple segments of paraspinal muscle area, CT value, and fat fraction, in which LL, Pfirrmann grading, fibrous ring injury, and FI of the L4–5 multifidus had moderate or greater correlation with LBP, and further revealed that FI of the L4–5 multifidus, LL, and Pfirrmann classification were risk factors for CLBP. Nomogram constructed based on the above parameters helps to individualize the prediction.
This study found that there was a statistically significant difference in the area of the multifidus between the normal group and CLBP, with the average age of CLBP group being 29.92±7.51 (11–40) years old. It was believed that paraspinal muscle atrophy of CLBP appeared at about 30 years, consistent with the results of Murata et al,12 while Sasaki et al and Janssen et al suggested that multifidus atrophy appeared at 45–50 years of age or after the age of 50 years.13,14 There was a statistically significant difference in the CSA of the erector between the normal group and the non-CLBP group, as seen in patients with a disease duration of <3 months who already had muscle atrophy, in agreement with the study by Yaltırık et al,15 while Kim et al suggested that it takes 3 months or even longer for muscle atrophy to appear.16
In this study, correlation analysis showed that BMI was positively correlated with LBP and multivariate regression analysis further identified BMI as a a risk factor for CLBP. It had been shown that a BMI of ≥25.5 kg/m2 is associated with reduced paraspinal muscle area, which is a risk factor for LBP.12,17 Increased storage of extracellular lipids in the paraspinal muscle in people with high BMI affects muscle nutrition, leading to muscle weakness and steatosis.18
Changes in the sagittal angle of the spine are currently considered a factor for chronic low back pain, and changes in spinal-pelvic parameters are associated with sarcopenia.7,19 This study only included LL; combined with the results of multivariate regression analysis, LL was found to be a risk factor for and negatively correlated with LBP, suggesting that maintaining a physiological LL can reduce the incidence of LBP. It is worth noting that LL may be caused by poor posture (decreased LL) and muscle atrophy in patients with LBP, which needs to be recognized in clinical practice.
In addition, we found that annulus fibrosus tear was a risk factor in patients with LBP of <3 months duration, similar to the study by Long et al,20 whereas in patients with chronic LBP, it was not. This is because a high concentration of inflammatory mesons stimulates nerve endings to produce pain in the early stage of injury, which gradually turns into mechanical compression of the nucleus pulposus over time, and the pain caused by inflammatory stimulation is reduced.21,22
The results showed that the Pfirrmann grade had a moderate positive correlation with LBP and that it was a risk factor. Brinjikji et al and Cooley et al confirmed that lumbar disc herniation is related to fat infiltration of the paraspinal muscles.23,24 It is believed that lumbar disc herniation compresses the dorsal branch of the spinal nerve, resulting in muscle denervation, muscle atrophy, and fat infiltration in nutritional disorders. Furthermore, the degree of muscle atrophy and fat infiltration is relatively strong and on the same side of lumbar disc herniation,3 causing an imbalance in muscle strength on both sides, which aggravates pain, while patients with LBP lack exercise, resulting in gradual muscle wasting and degeneration.25
We found that the FF of the L4–5 and L5–S1 multifidus and erector muscles had a moderate positive correlation with LBP, and the FF of the L4–5 multifidus was a risk factor. This is consistent with previous research.6 From an anatomical perspective, the multifidus is located medially and is unidirectionally innervated by the medial branch of the dorsal spinal nerve, whereas the erector is mostly innervated by several branches; therefore, multifidus atrophy tends to be segmental atrophy,26 and the incidence of disc degeneration is highest in L4–5, where CLBP occurs. Therefore, the FF of the multifidus is more pronounced at L4–5, consistent with the findings of earlier studies.27,28 Thakar et al concluded that the multifidus and erector play an important role in maintaining lumbar spine stability and that the erector constitutes a compensatory mechanism for multifidus atrophy.29 Huang et al found that reduced CSA of the multifidus is correlated with LBP,17 while Huang et al believed that paraspinal area reduction is not a risk factor.30 In the present study, MRI-measured CSA of the multifidus had a positive correlation at L4–5 and the area of the erector showed a negative correlation at L5–S1, which also confirmed that the erector functions in a compensatory manner in accordance with Huang et al.17
Both CT and MRI can be used for qualitative and quantitative analyses of the paraspinal muscles and have good reliability. However, there are differences between the various studies.31–33 This study found that both the CT value and MRI mDIXON-Quant can perform quantitative analysis of CSA and FI, but the correlation of CT value was lower than FF in L4–5/L5–S1, which was a risk factor for LBP, indicating that FF can better reflect the degree of fat infiltration, considering MRI is superior in identifying muscle volume and fat content. The mDIXON-Quant is a valuable technology for fat quantification. It can produce six images in a single scan, namely, fat, water, in-phase, out-of-phase, R2*map, and fat-fraction maps. The latter can determine fat content very accurately without the use of other tools in a noninvasive, easy, and reproducible manner.34,35
This study has several limitations. First, it is a single-center, retrospective study with limited size. Ideally, a prospective and multi-center comparison would have been required. Second, the results are not representative of all ages and races, as data on young and middle-aged patients are lacking. Third, we did not include the psoas major muscle, considering that it is not significantly altered in LBP and lumbar degenerative disease,15 since multifidus and erector play a more decisive role. Fourth, the samples enrolled were of less advanced stage with fewer Modic changes (only 8 cases). Therefore, to reduce bias, these factors were not included in the risk factor analysis.
Conclusions
In conclusion, BMI, L4–5 multifidus fat fraction, LL, and Pfirrmann grade are risk factors for CLBP for patients aged under 40 years, whereas annulus fibrosus tear is an independent risk factor for patients with disease duration of <3 months, nomograms derived from these parameters can help predict LBP. MRI mDIXON-Quant is recommended for the quantitative analysis of paraspinal muscle fat infiltration.
Data Sharing Statement
All data is available upon request.
Ethics Approval
The study was conducted in accordance with the Declaration of Helsinki and approved by the Institutional Review Board of Shengjing Hospital of China Medical University (protocol code: 2023PS382K).
Consent to Participate
The need for written informed consent was waived due to the retrospective nature of the study.
Author Contributions
All authors made a significant contribution to the work reported, whether that is in the conception, study design, execution, acquisition of data, analysis and interpretation, or in all these areas; took part in drafting, revising or critically reviewing the article; gave final approval of the version to be published; have agreed on the journal to which the article has been submitted; and agree to be accountable for all aspects of the work.
Funding
This work was supported by grants from the Liaoning Province Key Research and Development Project (JH2/202, 1686036606770), 345 Talent Project and Outstanding Scientific Fund of Shengjing Hospital.
Disclosure
The authors declare no competing interests in this work.
References
1. Angarita-Fonseca A, Pagé MG, Meloto CB, et al; Quebec Back Pain Consortium, & Quebec Back Pain Consortium. The Canadian version of the national institutes of health minimum dataset for chronic low back pain research: reference values from the Quebec low back pain study. Pain. 2023;164(2):325–335. doi:10.1097/j.pain.0000000000002703
2. GBD 2017 Disease and Injury Incidence and Prevalence Collaborators. Global, regional, and national incidence, prevalence, and years lived with disability for 354 diseases and injuries for 195 countries and territories, 1990–2017: a systematic analysis for the global burden of disease study 2017. Lancet. 2018;392(10159):1789–1858. doi:10.1016/S0140-6736(18)32279-7
3. Shi L, Yan B, Jiao Y, et al. Correlation between the fatty infiltration of paraspinal muscles and disc degeneration and the underlying mechanism. BMC Musculoskelet Disord. 2022;23(1):509. doi:10.1186/s12891-022-05466-8
4. Ekşi MŞ, Özcan-Ekşi EE, Özmen BB, et al. Lumbar intervertebral disc degeneration, end-plates and paraspinal muscle changes in children and adolescents with low-back pain. J Pediatr Orthop B. 2022;31(1):93–102. doi:10.1097/BPB.0000000000000833
5. Özcan-ekşi EE, Börekci A, Ekşi MŞ. Facet joint orientation/tropism could be associated with fatty infiltration in the lumbar paraspinal muscles. World Neurosurg. 2023;173:e606–e615. doi:10.1016/j.wneu.2023.02.111
6. Özcan-ekşi EE, Ekşi MŞ, Turgut VU, Canbolat Ç, Pamir MN. Reciprocal relationship between multifidus and psoas at L4-L5 level in women with low back pain. Br J Neurosurg. 2021;35(2):220–228. doi:10.1080/02688697.2020.1783434
7. Park JS, Park YS, Kim J, Hur J, Choe DH. Sarcopenia and fatty degeneration of paraspinal muscle associated with increased sagittal vertical axis in the elderly: a cross-sectional study in 71 female patients. Eur Spine J. 2020;29(6):1353–1361. doi:10.1007/s00586-020-06416-5
8. Peng X, Li X, Xu Z, et al. Age-related fatty infiltration of lumbar paraspinal muscles: a normative reference database study in 516 Chinese females. Quant Imaging Med Surg. 2020;10(8):1590–1601. doi:10.21037/qims-19-835
9. Kim EH, Kim KW, Shin Y, et al. Reference data and t-scores of lumbar skeletal muscle area and its skeletal muscle indices measured by CT scan in a healthy Korean population. J Gerontol a Biol Sci Med Sci. 2021;76(2):265–271. doi:10.1093/gerona/glaa065
10. Li J, Wang Y, Zhang X, et al. Associations of muscle size and fatty infiltration with bone mineral density of the proximal femur bone. Front Endocrinol. 2022;13:990487. doi:10.3389/fendo.2022.990487
11. Khil EK, Choi JA, Hwang E, Sidek S, Choi I. Paraspinal back muscles in asymptomatic volunteers: quantitative and qualitative analysis using computed tomography (CT) and magnetic resonance imaging (MRI). BMC Musculoskelet Disord. 2020;21(1):403. doi:10.1186/s12891-020-03432-w
12. Murata Y, Nakamura E, Tsukamoto M, et al. Longitudinal study of risk factors for decreased cross-sectional area of psoas major and paraspinal muscle in 1849 individuals. Sci Rep. 2021;11(1):16986. doi:10.1038/s41598-021-96448-8
13. Sasaki T, Yoshimura N, Hashizume H, et al. MRI-defined paraspinal muscle morphology in Japanese population: the Wakayama spine study. PLoS One. 2017;12(11):e0187765. doi:10.1371/journal.pone.0187765
14. Janssen I, Heymsfield SB, Wang ZM, Ross R. Skeletal muscle mass and distribution in 468 men and women aged 18-88 yr. J Appl Physiol. 2000;89(1):81–88. doi:10.1152/jappl.2000.89.1.81
15. Yaltırık K, Güdü BO, Işık Y, Altunok Ç, Tipi U, Atalay B. Volumetric muscle measurements indicate significant muscle degeneration in single-level disc herniation patients. World Neurosurg. 2018;116:e500–e504. doi:10.1016/j.wneu.2018.05.019
16. Kim WH, Lee SH, Lee DY. Changes in the cross-sectional area of multifidus and psoas in unilateral sciatica caused by lumbar disc herniation. J Korean Neurosurg Soc. 2011;50(3):201–204. doi:10.3340/jkns.2011.50.3.201
17. Huang Y, Wang L, Zeng X, et al. Association of paraspinal muscle CSA and PDFF measurements with lumbar intervertebral disk degeneration in patients with chronic low back pain. Front Endocrinol. 2022;13:792819. doi:10.3389/fendo.2022.792819
18. Ogon I, Takebayashi T, Takashima H, et al. Quantitative analysis concerning atrophy and fat infiltration of the multifidus muscle with magnetic resonance spectroscopy in chronic low back pain. Spine Surg Relat Res. 2018;3(2):163–170. doi:10.22603/ssrr.2018-0023
19. Glassman SD, Bridwell K, Dimar JR, Horton W, Berven S, Schwab F. The impact of positive sagittal balance in adult spinal deformity. Spine. 2005;30(18):2024–2029. doi:10.1097/01.brs.0000179086.30449.96
20. Long RG, Ferguson SJ, Benneker LM, et al. Morphological and biomechanical effects of annulus fibrosus injury and repair in an ovine cervical model. JOR Spine. 2019;3(1):e1074. doi:10.1002/jsp2.1074
21. Gooyers CE, Callaghan JP. Peak stress in the annulus fibrosus under cyclic biaxial tensile loading. J Biomech Eng. 2016;138(5):051006. doi:10.1115/1.4032996
22. Li XF, Xue CC, Zhao YJ, et al. Deletion of opg leads to increased neovascularization and expression of inflammatory cytokines in the lumbar intervertebral disc of mice. Spine. 2017;42(1):E8–E14. doi:10.1097/BRS.0000000000001701
23. Brinjikji W, Diehn FE, Jarvik JG, et al. MRI findings of disc degeneration are more prevalent in adults with low back pain than in asymptomatic controls: a systematic review and meta-analysis. AJNR Am J Neuroradiol. 2015;36(12):2394–2399. doi:10.3174/ajnr.A4498
24. Cooley JR, Walker BF, Ardakani M, et al. Relationships between paraspinal muscle morphology and neurocompressive conditions of the lumbar spine: a systematic review with meta-analysis. BMC Musculoskelet Disord. 2018;19(1):351. doi:10.1186/s12891-018-2266-5
25. Zhao X, Liang H, Hua Z, et al. The morphological characteristics of paraspinal muscles in young patients with unilateral neurological symptoms of lumbar disc herniation. BMC Musculoskelet Disord. 2022;23(1):994. doi:10.1186/s12891-022-05968-5
26. Ding JZ, Kong C, Li XY, Sun XY, Lu SB, Zhao GG. Different degeneration patterns of paraspinal muscles in degenerative lumbar diseases: a MRI analysis of 154 patients. Eur Spine J. 2022;31(3):764–773. doi:10.1007/s00586-021-07053-2
27. Hebert JJ, Kjaer P, Fritz JM, Walker BF. The relationship of lumbar multifidus muscle morphology to previous, current, and future low back pain: a 9-year population-based prospective cohort study. Spine. 2014;39(17):1417–1425. doi:10.1097/BRS.0000000000000424
28. Bailey JF, Fields AJ, Ballatori A, et al. The relationship between endplate pathology and patient-reported symptoms for chronic low back pain depends on lumbar paraspinal muscle quality. Spine. 2019;44(14):1010–1017. doi:10.1097/BRS.0000000000003035
29. Thakar S, Sivaraju L, Aryan S, Mohan D, Sai Kiran NA, Hegde AS. Lumbar paraspinal muscle morphometry and its correlations with demographic and radiological factors in adult isthmic spondylolisthesis: a retrospective review of 120 surgically managed cases. J Neurosurg Spine. 2016;24(5):679–685. doi:10.3171/2015.9.SPINE15705
30. Huang R, Pan F, Kong C, Lu S. Age- and sex-dependent differences in the morphology and composition of paraspinal muscles between subjects with and without lumbar degenerative diseases. BMC Musculoskelet Disord. 2022;23(1):734. doi:10.1186/s12891-022-05692-0
31. Hyun SJ, Bae CW, Lee SH, Rhim SC. Fatty degeneration of the paraspinal muscle in patients with degenerative lumbar kyphosis: a new evaluation method of quantitative digital analysis using MRI and CT scan. Clin Spine Surg. 2016;29(10):441–447. doi:10.1097/BSD.0b013e3182aa28b0
32. Prasetyo M, Nindita N, Murdana IN, Prihartono J, Setiawan SI. Computed tomography evaluation of fat infiltration ratio of the multifidus muscle in chronic low back pain patients. Eur J Radiol Open. 2020;7:100293. doi:10.1016/j.ejro.2020.100293
33. Hu ZJ, He J, Zhao FD, Fang XQ, Zhou LN, Fan SW. An assessment of the intra- and inter-reliability of the lumbar paraspinal muscle parameters using CT scan and magnetic resonance imaging. Spine. 2011;36(13):E868–E874. doi:10.1097/BRS.0b013e3181ef6b51
34. Hu L, Zha YF, Wang L, et al. Quantitative evaluation of vertebral microvascular permeability and fat fraction in alloxan-induced diabetic rabbits. Radiology. 2018;287(1):128–136. doi:10.1148/radiol.2017170760
35. Fischer MA, Nanz D, Shimakawa A, et al. Quantification of muscle fat in patients with low back pain: comparison of multi-echo MR imaging with single-voxel MR spectroscopy. Radiology. 2013;266(2):555–563. doi:10.1148/radiol.12120399
 © 2023 The Author(s). This work is published and licensed by Dove Medical Press Limited. The
full terms of this license are available at https://www.dovepress.com/terms
and incorporate the Creative Commons Attribution
- Non Commercial (unported, 3.0) License.
By accessing the work you hereby accept the Terms. Non-commercial uses of the work are permitted
without any further permission from Dove Medical Press Limited, provided the work is properly
attributed. For permission for commercial use of this work, please see paragraphs 4.2 and 5 of our Terms.
© 2023 The Author(s). This work is published and licensed by Dove Medical Press Limited. The
full terms of this license are available at https://www.dovepress.com/terms
and incorporate the Creative Commons Attribution
- Non Commercial (unported, 3.0) License.
By accessing the work you hereby accept the Terms. Non-commercial uses of the work are permitted
without any further permission from Dove Medical Press Limited, provided the work is properly
attributed. For permission for commercial use of this work, please see paragraphs 4.2 and 5 of our Terms.