Back to Journals » Diabetes, Metabolic Syndrome and Obesity » Volume 16
Risk Factors Associated with Bone Marrow Adiposity Deposition in Postmenopausal Women in the CASH China Study
Authors Xu L, Gong Y, Zhao Q, Blake GM ![]() , Li K, Zhang Y, Liu Q, Li C
, Li K, Zhang Y, Liu Q, Li C ![]() , Cheng X
, Cheng X ![]()
Received 18 December 2022
Accepted for publication 16 April 2023
Published 24 April 2023 Volume 2023:16 Pages 1167—1176
DOI https://doi.org/10.2147/DMSO.S401910
Checked for plagiarism Yes
Review by Single anonymous peer review
Peer reviewer comments 2
Editor who approved publication: Professor Gian Paolo Fadini
Li Xu,1,* Yanping Gong,2,* Qian Zhao,3 Glen M Blake,4 Kai Li,1 Yong Zhang,1 Qianqian Liu,2 Chunlin Li,2 Xiaoguang Cheng1
1Department of Radiology, Beijing Jishuitan Hospital, Beijing, People’s Republic of China; 2Department of Endocrinology, the Second Medical Center, the Chinese People’s Liberation Army General Hospital, National Clinical Research Center for Geriatric Disease, Beijing, 100853, People’s Republic of China; 3International Medical Center, Sichuan University West China Hospital, Chengdu, People’s Republic of China; 4Biomedical Engineering Department, King’s College London, London, UK
*These authors contributed equally to this work
Correspondence: Xiaoguang Cheng, Department of Radiology, Beijing Jishuitan Hospital, Beijing, 100035, People’s Republic of China, Email [email protected] Chunlin Li, Department of Endocrinology, the Second Medical Center, the Chinese People’s Liberation Army General Hospital, National Clinical Research Center for Geriatric Disease, Beijing, 100853, People’s Republic of China, Email [email protected]
Purpose: To investigated the factors that influence BMAC.
Patients and Methods: Quantitative computed tomography (QCT) and magnetic resonance imaging (MRI) were applied to measure abdominal fat areas, liver fat content, erector muscle fat content, and BMAC of the L2-4 vertebrae. Sex hormone, adipokine, and inflammatory factor levels were measured on the same day.
Results: Although age, erector muscle fat content, estradiol, testosterone, and adiponectin/leptin levels showed correlations with BMAC in the correlation analysis, the equations obtained from the whole population by multivariate analysis were unclear. Patients were stratified according to BMAC quartiles, and differences were found in vBMD, age, estradiol, testosterone, and erector muscle fat content among the four quartiles. Logistic analyses confirmed that age, estradiol/testosterone ratio, and TNF-α had independent effects on BMAC in all quartiles. In addition, height was related to higher BMAC quartiles, and glucose was related to lower BMAC quartiles.
Conclusion: Compared to other body fats, BMAC is a unique fat depot. Age, estradiol/testosterone ratio, and TNF-α are all key influencing factors related to BMAC in postmenopausal women. Furthermore, height and glucose levels were related to BMAC in the higher and lower BMAC quartiles, respectively.
Keywords: bone marrow adiposity, postmenopausal women, age, adipokines, sex hormones
Introduction
Bone marrow adipose tissue (MAT) reflects the accumulation of adipocytes embedded within the bone.1 The MAT is a complex and dynamic depot that likely includes both constitutive and regulated cell populations. The MAT and bone are inextricably linked through the differentiation of pluripotent mesenchymal stem cells in the bone marrow. MAT is unique because it is the only tissue in which adipocytes and bone cells are in close juxtaposition.2 MAT accumulation is a normal component of skeletal aging in healthy individuals but is also seen in metabolic diseases, including anorexia nervosa, diabetes, and skeletal unloading.3–5
Because of the physical location (inside the bone) and the low volume of tissue, the bone marrow adipose concentrate (BMAC) is difficult to quantify. In recent years, with the development of noninvasive imaging methods, such as magnetic resonance imaging (MRI) and quantitative computed tomography (QCT), accurate quantification of BMAC has become readily available.6,7 BMAC quantified by MRI has been shown to have an inverse relationship with bone mass content in postmenopausal women, which seems to be a physiological consequence of gonadal deficiency or menopause in the aging process of women.8 Estrogen deficiency due to menopause not only induces bone marrow adiposity but also results in increased subcutaneous and abdominal adiposity.3,9 Several studies have reported that MAT is positively correlated with white adipose tissue (WAT) in women who are overweight/obese, while others have shown no correlation in women who are underweight.10 In addition to aging and estrogen deficiency, some endocrine factors, such as adipokines, participate in the regulation of MAT in rodents.11,12 However, the relationship between MAT deposition and WAT in postmenopausal women and the factors driving the increase in MAT remain unclear.
In the present study, we investigated the relationships between body fat distribution and metabolism indices with BMAC and further explored the influential factors related to MAT deposition in a population of community-dwelling postmenopausal Chinese women.
Patients and Methods
Population
This cross-sectional study was conducted in accordance with the guidelines of the Declaration of Helsinki (as revised in 2013). The study protocol was approved by the Ethics Committee of Beijing Jishuitan Hospital (20151202), and written informed consent was obtained from all participants prior to participation. Volunteers were recruited from participants in the China Action on Spine and Hip study (CASH, Clinical Trials.gov Identifier: NCT01758770).6,10,13
As a subset of the CASH study participants enrolled at the Beijing Jishuitan Hospital, the volunteers in this study were recruited during the first CASH study follow-up visit, the protocol for which has been described in earlier publications.8,13 The participants were evaluated based on the results of a questionnaire, physical examination, and routine blood screening performed by a clinical physician. Participants with the following conditions were excluded: (1) spine or knee disorders due to congenital, tumor, or tuberculosis; (2) a history of spine or knee injury or surgery; (3) other major diseases (such as infection, tumor, rheumatic immune disease, liver dysfunction, renal failure, coronary heart disease, stroke, and mental diseases) or taking bone metabolism-regulating drugs; (4) usage of a heart pacemaker, coronary stent, orthopedic implants, or implanted teeth; or (5) familial hereditary disease.
Quantitative Computed Tomography (QCT) Scans and Measurements
A quantitative CT scan of the lumbar spine was performed for each participant using a Toshiba CT scanner (Aquilion Prime ESX-302A; Toshiba Medical Systems Corporation, Otawara, Japan) with a five-rod calibration phantom (Model 3 phantom; Mindways Inc., Austin, TX, USA) placed beneath the volunteer. The scanning parameters were as follows: 120 kV, 187 mAs, table height of 120 cm, slice thickness of 1 mm, and field of view (FOV) of 500 mm. The scan range was 2 cm above the L1 vertebra to 2 cm below L5. The reconstruction parameters were standard algorithm, 1 mm section thickness and interval, and 400 mm display FOV.
The CT data were transferred to a QCT workstation and analyzed by a trained and qualified radiologist using Mindways QCT PRO software version 4.2. On the three-dimensional (3D) spine module images, an elliptical cylinder region of interest (ROI) was individually placed in the central plane of the L2, L3, and L4 vertebral bodies, and the vBMD values of L2, L3, and L4 were output automatically (Supplementary Figure 1A). The lumbar spine vBMD was calculated as the mean of the vBMD values of L2 to L4.
The method of abdominal adipose tissue measurement has been previously described [8]. Slices at the intervertebral space of L2/L3 were measured in this study. The total fat areas (TFA), visceral fat areas (VFA) and subcutaneous fat areas (SFA) (cm2) were measured semi-automatically using the Mindways Tissue Composition Module.
Chemical Shift Encoding Magnetic Resonance Imaging (CSE-MRI) Scan and Measurements
On the same day as the QCT examination, all participants underwent a multi-echo 3D spoiled gradient-echo sequence mDixon-Quant study using a 3.0-T MRI system with a 32-channel torso body coil (Ingenia; Philips Healthcare, Best, the Netherlands). The mDixon-Quant sequence is a 3D-fast-field echo sequence that uses multiple acquired echoes to generate water, fat, T2*, R2*, and in-phase and opposed-phase images synthesized from water-fat images. The scan parameters of the single breath-hold mDixon-Quant were as follows: repetition time, 9.1 ms; echo time 1, 1.33 ms; six echoes with the echo time shift, 1.3 ms; FOV, 360×330×120 mm3; flip angle, 3°; voxel size, 2.5×2.5×3.0 mm3; sensitivity encoding, 2; the number of signal average, 2; and scan time, 12.5 s.
The CSE-MRI dataset was processed using ISP version 7 software (Philips Healthcare, Best, the Netherlands), and the adipose tissue content was measured on axial proton density fat fraction (PDFF) images. ROIs for marrow fat content measurement were manually drawn in the mid-plane of the L2, L3, and L4 axial images (Supplementary Figure 1B). The BMAC was calculated as the mean values of L2, L3, and L4. The fat content of the psoas major and erector muscles was measured on the same mid-plane L3 image (Supplementary Figure 1C). Liver fat content was calculated as the mean value of measurements in the left lobe, right anterior lobe, and right posterior lobe (Supplementary Figure 1D).
Plasma Measurements and Other Data Collection
For each participant, we performed the following basic anthropometric measurements: weight, height, waist circumference, and hip circumference. Serum levels of adiponectin, leptin, resistin, tumor necrosis factor-α (TNF-α), interleukin 1β (IL-1β), IL-6, human monocyte chemoattractant protein-1 (MCP-1), and plasminogen activator inhibitor-1 (PAI-1) were measured by immunoenzymatic assays using HADCYMAG-61K and MILLIPLEX MAP Human Adipocyte Magnetic Bead Panel-Endocrine Multiplex Assay with a multi-factor detection instrument (MACPIX, LUMINEX). Serum total estradiol concentrations and serum FSH concentrations were measured using an enzyme-linked immunosorbent assay (DRG Estradiol ELISA, EIA-2693; ALPCO FSH ELISA, 11-FSHHU-E01). Total testosterone concentration was determined using a competitive enzyme immunoassay (R&D Testosterone Parameter Assay Kit, KGE010). The fully automatic multifunctional enzyme labeling instrument used was a MULTISKAN MK3 (Thermo Fisher Scientific, San Jose, CA, USA).
Statistical Analyses
SPSS Version 25.0 (download from https://www.ibm.com/support/pages/downloading-ibm-spss-statistics-25) was used for the statistical analyses. Quantitative variables are presented as the mean ± standard deviation (SD). Inter-group comparisons of continuous variables were tested using a t-test and variance analysis.
Spearman’s (non-normal variables) and Pearson’s (normal variable) correlation coefficients were calculated to assess the associations between age, blood biochemical markers (glucose, total cholesterol, triglycerides), fat distribution (waist circumference, hip circumference, height, weight, BMI, TFA, VFA, SFA, VFA/TFA, fat content of psoas major muscle, fat content of erector muscle, and liver fat content), sex hormones (follicle-stimulating hormone (FSH), estradiol, testosterone, and estradiol/testosterone), cytokines (TNF-α, IL-6, IL-1β, PAI-1, adiponectin, leptin, resistin, adiponectin/leptin, adiponectin/resistin, and MCP-1), vBMD, and BMAC. Multivariate linear regression and ridge regression analyses were performed to analyze the effects on BMAC. Ridge regression analysis was used to resolve the collinearity of the independent variables in the linear regression analysis.
Quartiles were created based on BMAC: quartile 1 (< 42.68%, n = 21), quartile 2 (42.68–47.56%, n = 22), quartile 3 (47.56–52.83%, n = 20), and quartile 4 (> 52.83%, n = 23). Comparisons among quartiles were tested using a one-way analysis of variance (ANOVA). Ordinal logistic regression analysis was performed to determine the factors associated with BMAC. Model 1 was adjusted for the patient’s general conditions (age and glucose levels), sex hormone levels, adipokine levels, and fat distribution; Model 2 excluded fat distribution from the independent factors. Multinomial logistic regression was used to explore the influencing factors of the different quartiles. Model 1 was adjusted for general conditions (age and glucose levels), sex hormone levels, adipokine levels, and fat distribution. Model 2 adjusted for general conditions (age, glucose levels, and lipid levels), sex hormone levels, and adipokine levels, without fat distribution. A p-value < 0.05 was considered statistically significant.
Results
Population Characteristics of the Study Population
A total of 336 postmenopausal women were enrolled in the CASH China Study at Beijing Jishuitan Hospital. Participants enrolled in 2018 without contraindications for MRI were selected, and 105 women finally underwent an MRI examination. Nineteen participants were excluded due to abnormal values of routine blood screening (outside the mean ± 3 SD limits), and 86 women were included in the final analysis. The information on the general condition, fat distribution, adipokine levels, sex hormone levels, BMD, and fracture risk of the population are presented in Table 1. The mean age of the study population was 64 years (range: 52–79 years). The average blood glucose (reference range: 4.40–6.10 mmol/L), lipids (reference range: total cholesterol < 5.17 mmol/L, triglyceride < 1.70 mmol/L), waist circumference (reference range for female ≤ 85 cm), BMI (reference range: < 24 kg/cm2), and VFA (> 130 cm2 was considered obese) were all slightly above the normal range.
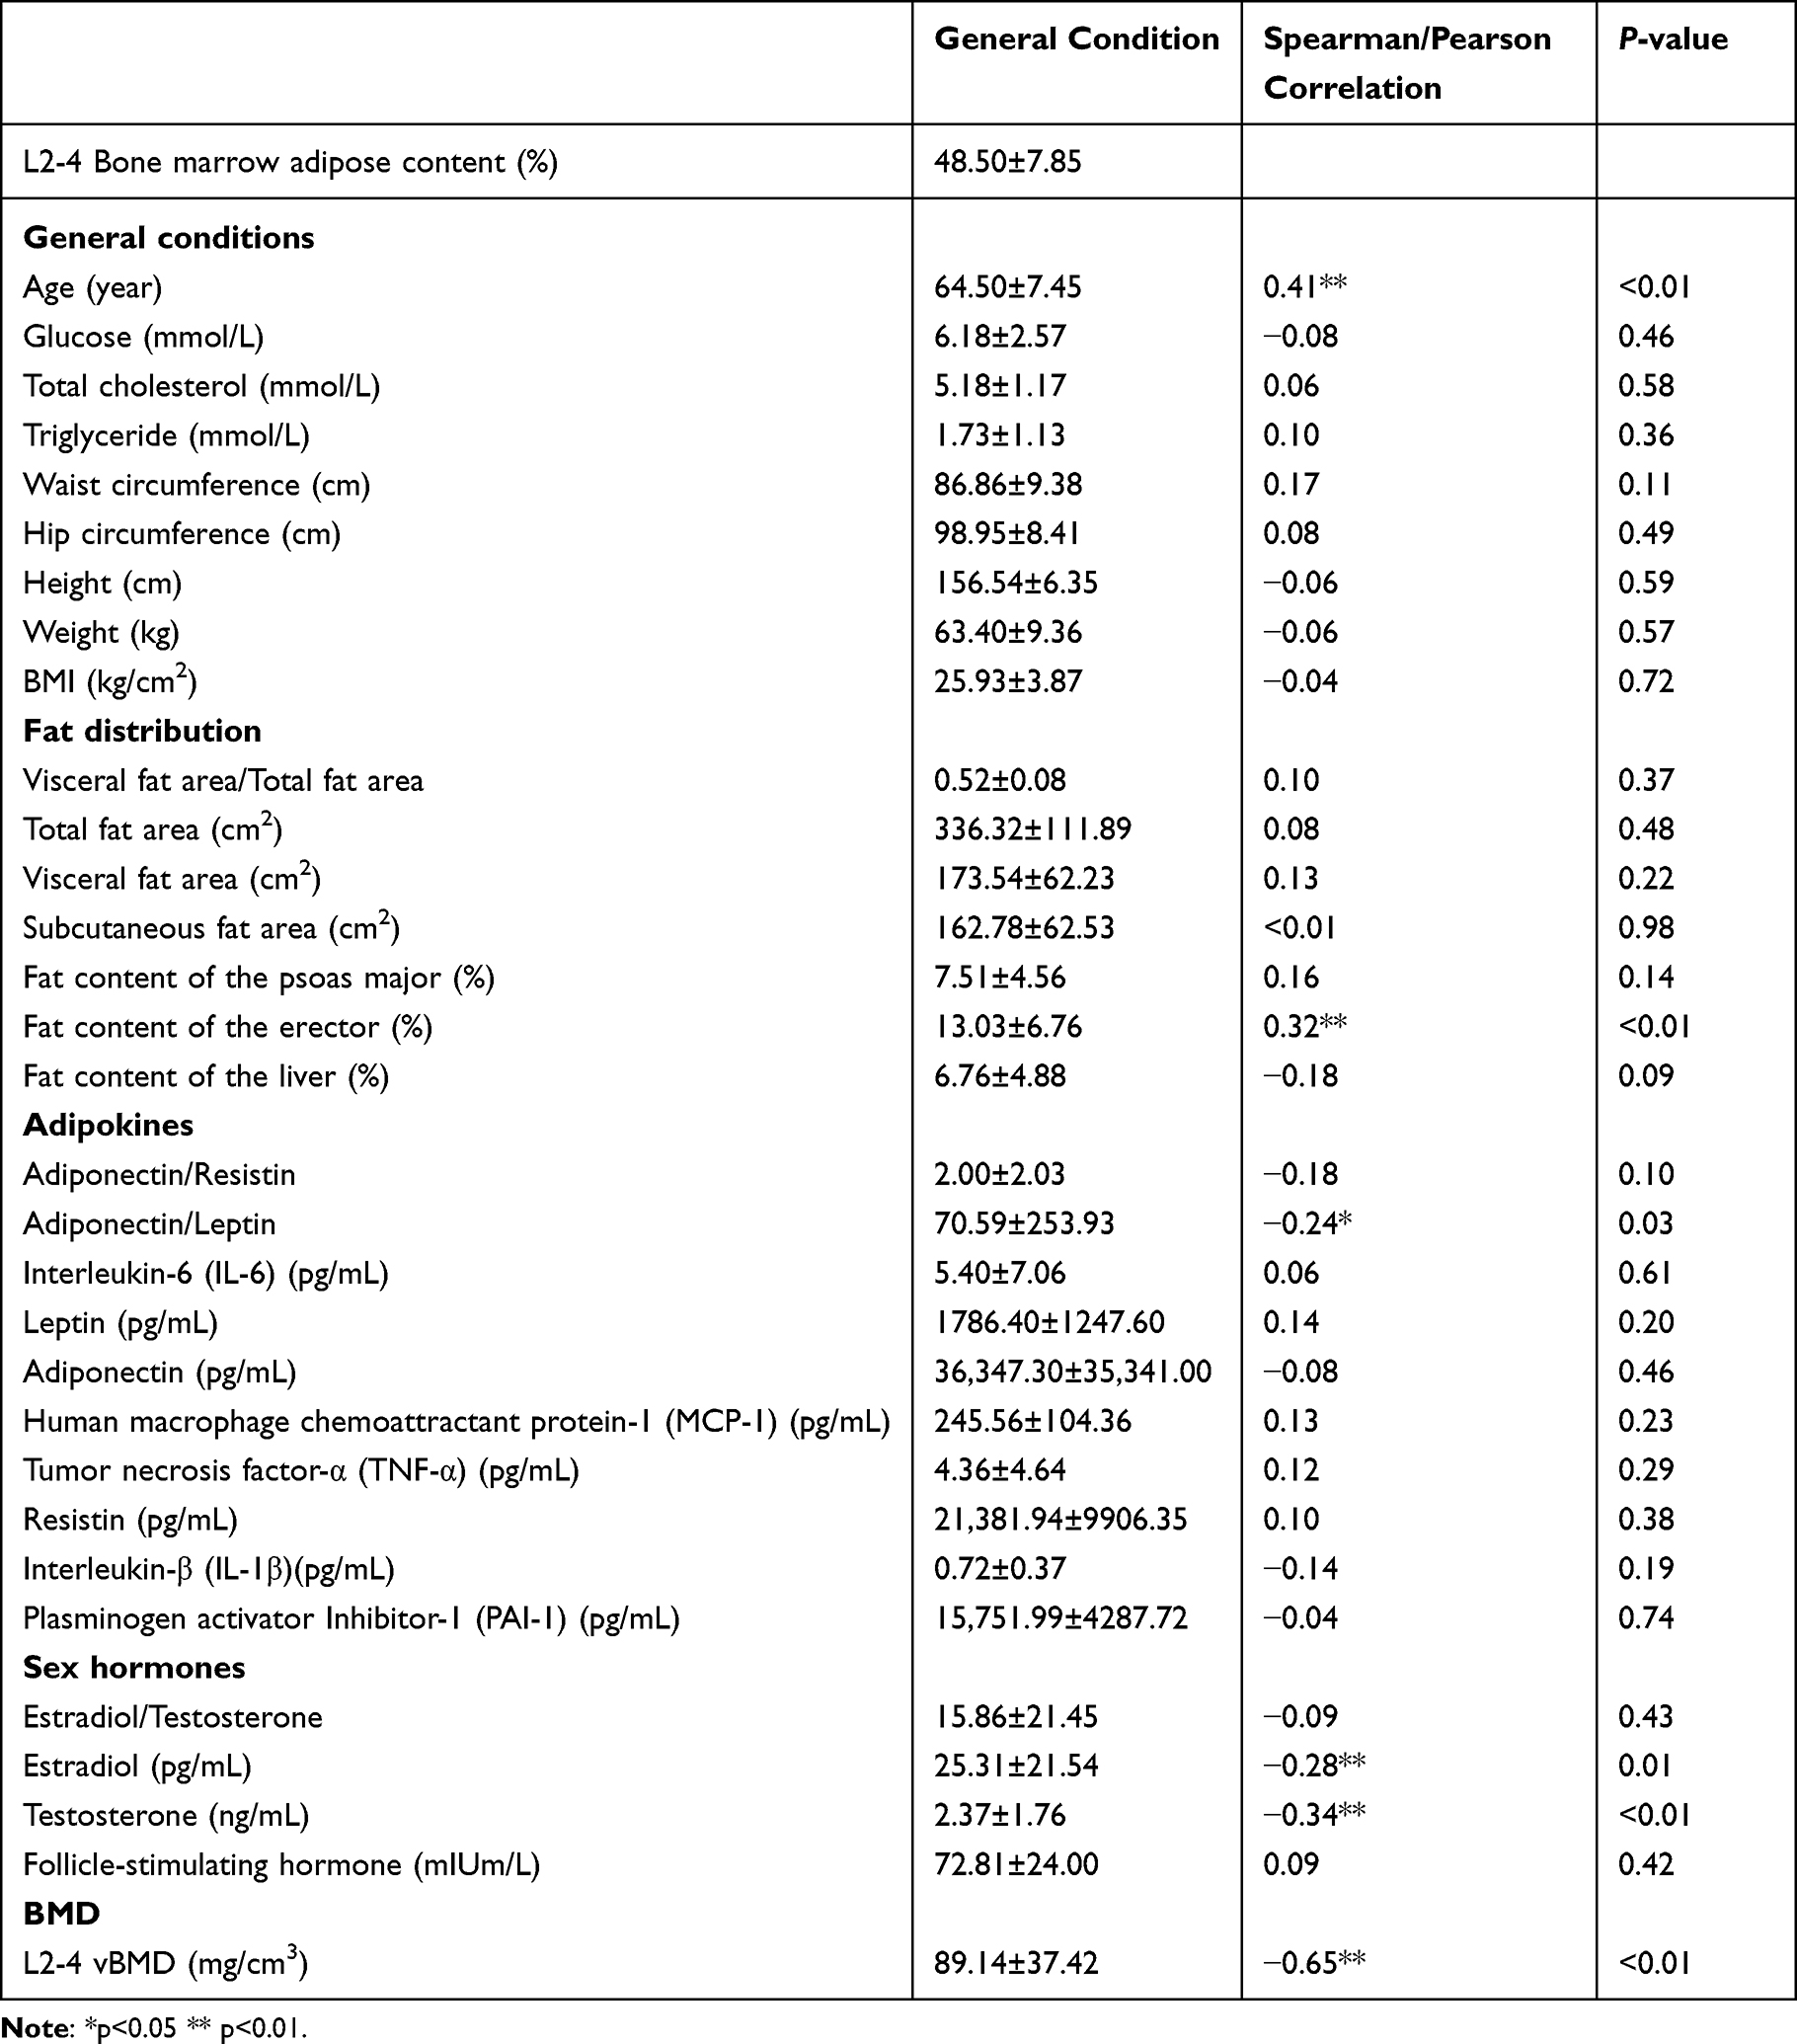 |
Table 1 Correlation Analysis Between BMAC and Different Population Characteristics |
Associations Between Population Characteristics and BMAC
According to the correlation coefficients, BMAC was negatively correlated with L 2–4 vBMD (r = −0.65, p < 0.01), while age and fat content of the erector muscles were positively correlated with BMAC (r = 0.41 and 0.32, respectively, p < 0.01). Adiponectin/leptin (r = −0.24, p < 0.05), estradiol, and testosterone (r = −0.28 and −0.34, respectively, p < 0.01) levels were negatively correlated with BMAC (Table 1). The r values of adiponectin/leptin and estradiol levels were lower than 0.3 and had few explanatory effects.
Assessments of the Influencing Factors by Logistic Analysis
Multivariate linear regression analysis and the ridge trace map did not yield an ideal equation (Supplementary Table 1 and Supplementary Figure 2). Ordinal logistic regression analysis was performed to assess the factors influencing the overall trend (Figure 1). When all indices were substituted in Model 1, age, estradiol levels, and adiponectin/leptin levels were correlated with different levels of BMAC (OR = 1.12, p < 0.01; OR = 1.106, p < 0.05; OR = 0.945, p < 0.05). When all fat distribution indices were deleted in Model 2, only age and estradiol levels were entered (OR = 1.131, p < 0.01; OR = 0.959, p < 0.05). There were no significant differences in the OR values and R2 values between the two equations. The OR of adiponectin/leptin and estradiol levels were too close to 1.00, to give explanatory reasons.
 |
Figure 1 Ordinal logistic analysis. The tree graphs were drawn according to the OR value and 95% CI values of each indicator from the results of Ordinal logistic analysis. Model 1: The model was adjusted for general conditions, sex hormone levels, adipokine levels, inflammatory factor levels, and fat distribution. The OR for age, estradiol levels, and adiponectin/leptin levels were 1.112, 0.942, and 0.989, respectively. Model 2: The model was adjusted for general conditions, sex hormone levels, adipokine levels, and inflammatory factor levels, except for fat distribution. The OR values for age and estradiol level were 1.313 and 0.959, respectively. The predictive accuracy, McFadden R², Cox and Snell R², and Nagelkerke R² values are shown for each model. * p<0.05, and the indicators with differences have been marked with red boxes. |
Comparisons of Population Characteristics Among BMAC Quartiles
The characteristics of the BMAC quartiles are shown in Table 2. From the lowest to the highest quartile of BMAC, the vBMD decreased while the age progressively increased. Compared to the other quartiles, the vBMD was highest in the 1st quartile and lowest in the 4th quartile (p < 0.01). The ages of the participants in the 3rd quartile and 4th quartile were significantly higher than those in the 1st quartile (p < 0.05 and p < 0.01, respectively). The estradiol and testosterone levels decreased among the four quartiles, with significantly higher estradiol levels in the 1st quartile and testosterone levels in the 1st and 2nd quartiles (p < 0.05 and p < 0.01, respectively). The fat content of the erector muscle in the 4th quartile was significantly higher than that in the other three quartiles (p < 0.05 and p < 0.01, respectively).
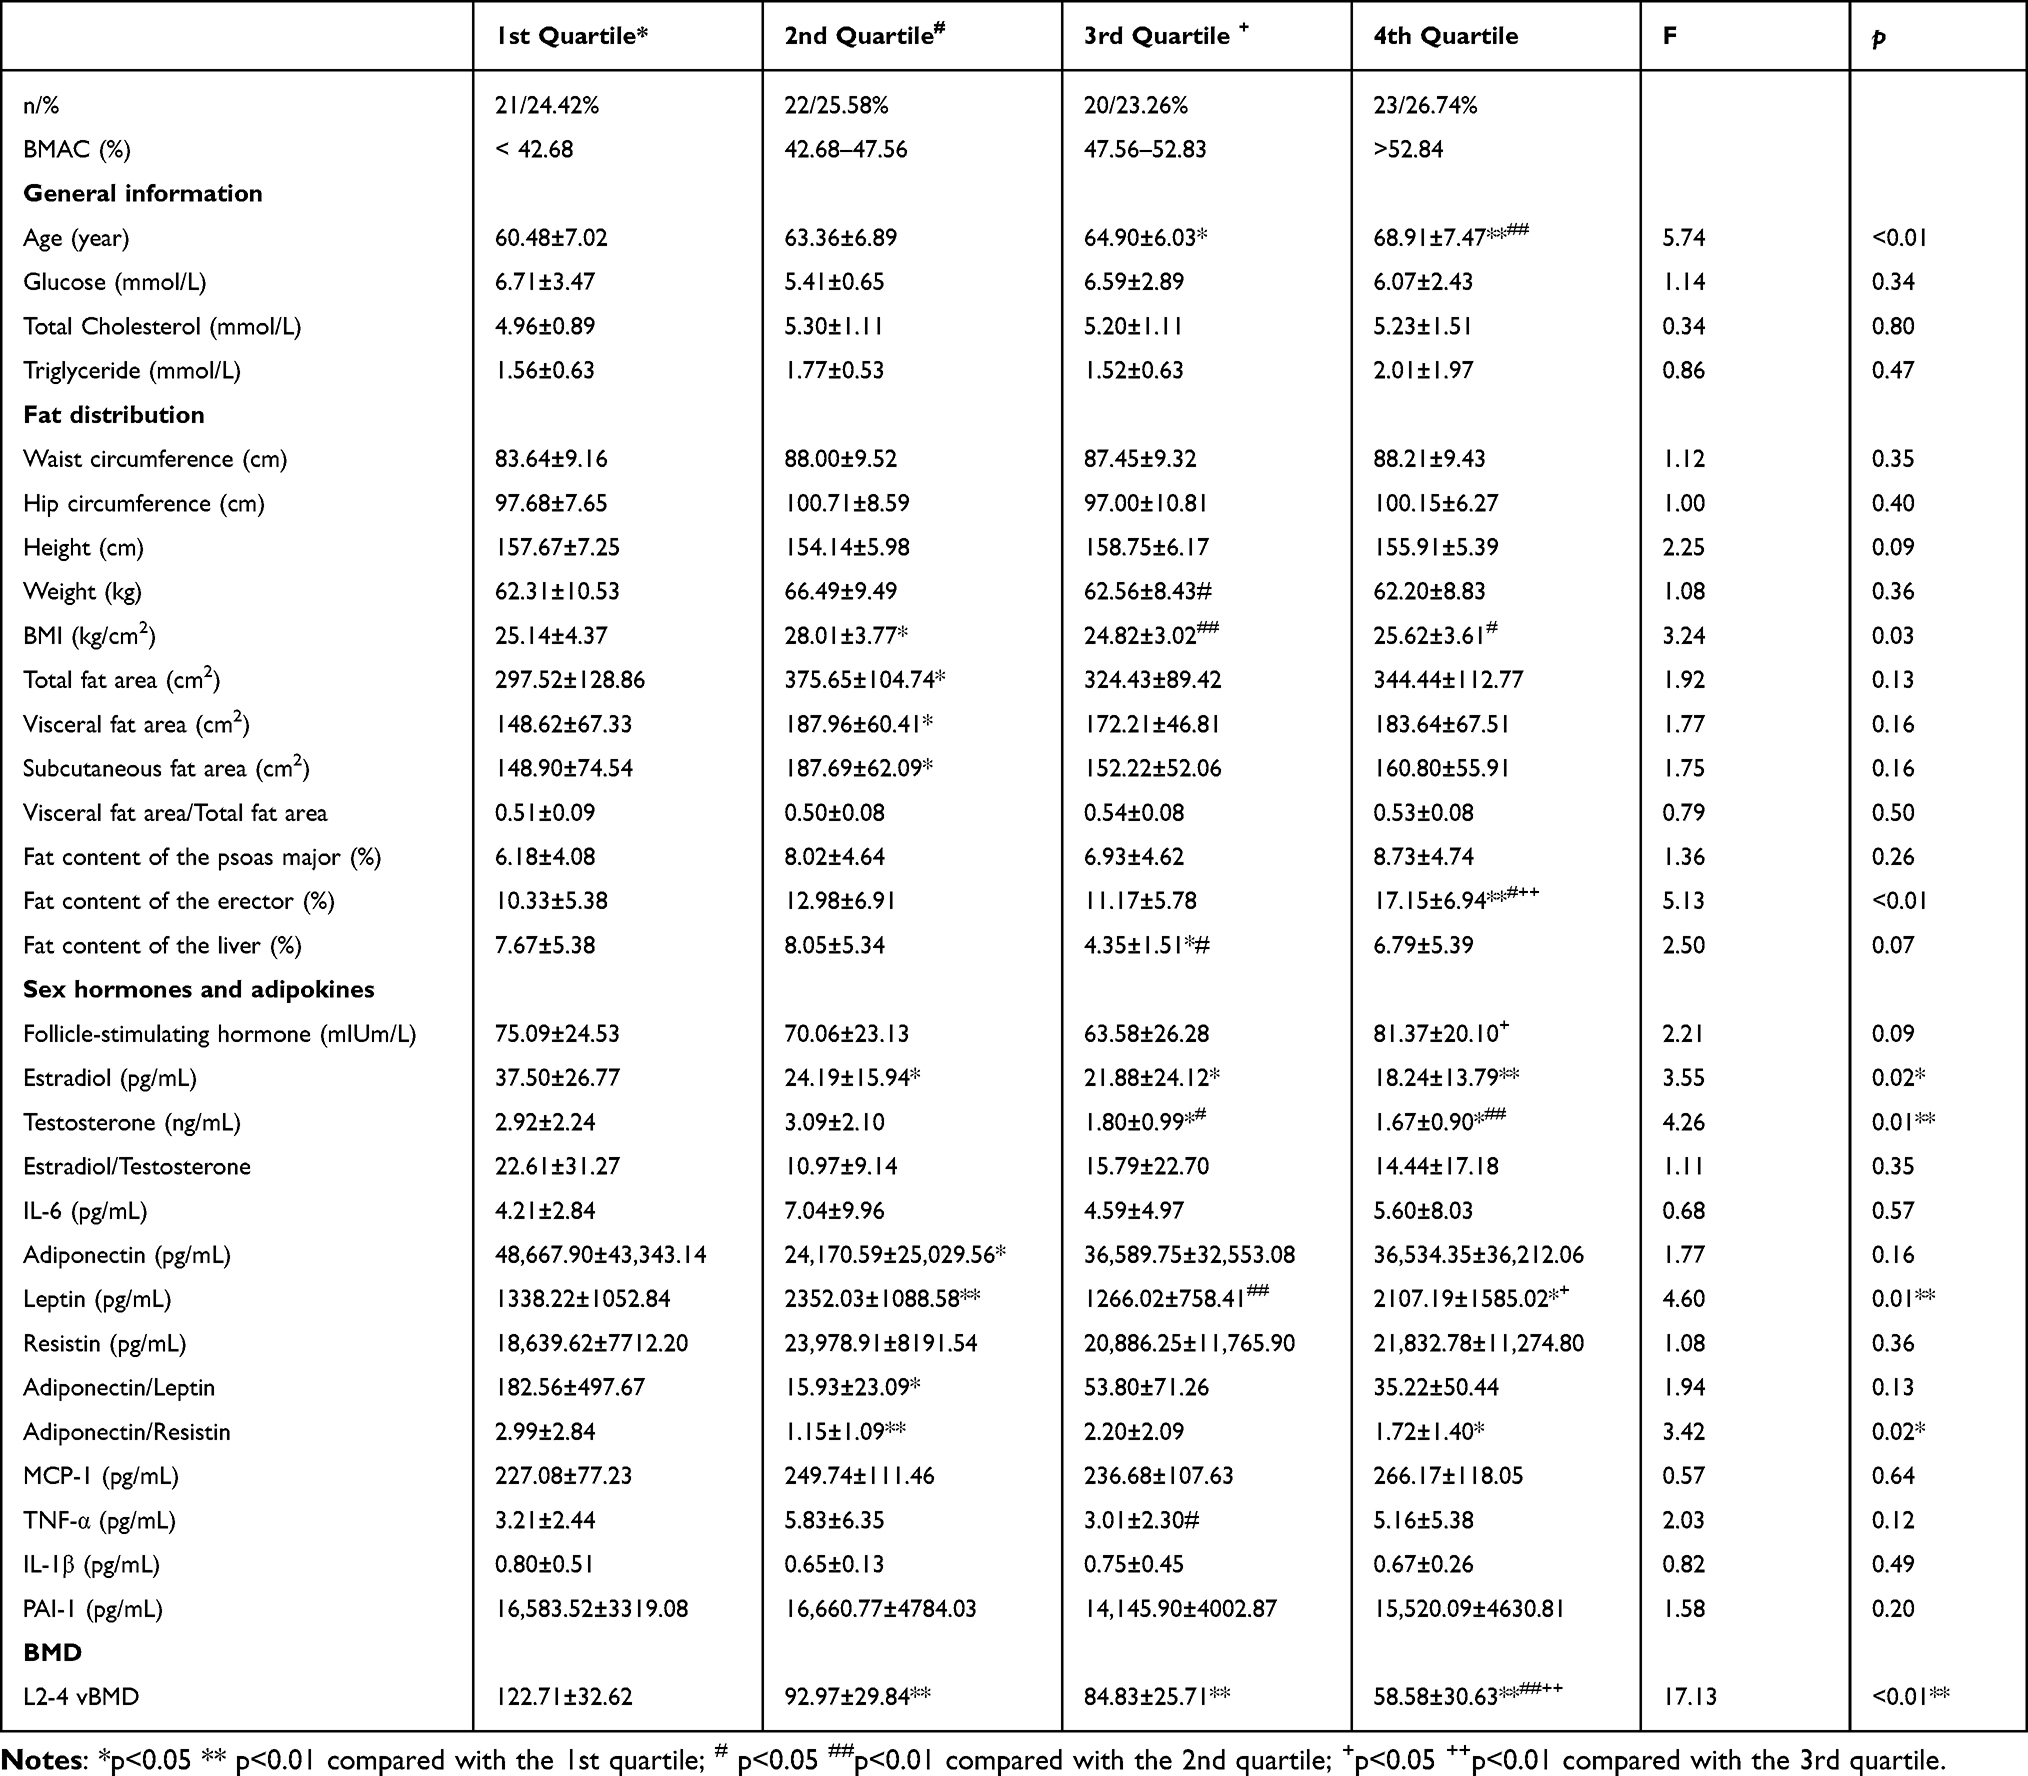 |
Table 2 Comparison of General Information, Fat Distribution, Sex Hormones, Adipokines, and BMD Among BMAC Quartiles |
Comparisons of the Risk Factors Among Different Quartiles by Multinomial Logistics Analysis
Multinomial logistic regression was used to analyze the predictive factors for each BMAC quartile (Figure 2). The body fat distribution indices were substituted into the logistic model in Model 1. Age was the only factor included in all three quartiles, with an increasing OR value of 1.383, 1.511, and 1.605, respectively. In the 3rd quartile, adiponectin/resistin and liver fat content went into the equation with OR values of 5.384 and 0.454, respectively.
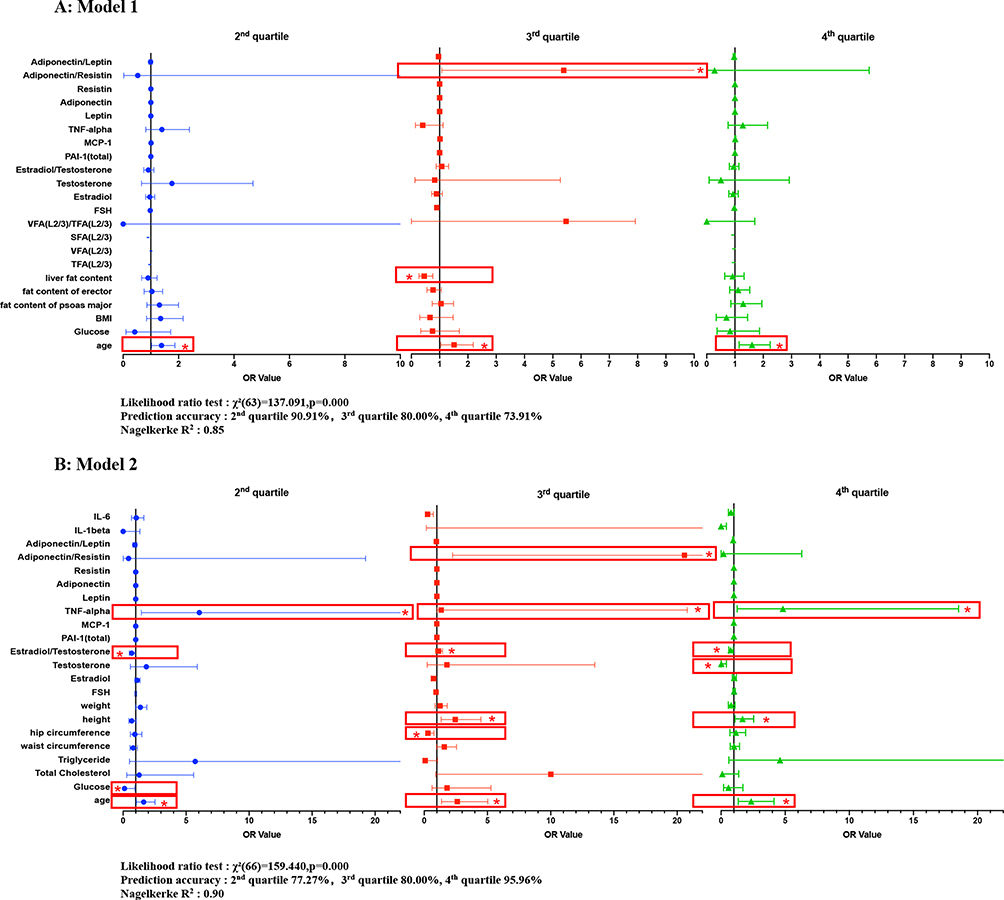 |
Figure 2 Tree graphs of multinomial logistic analysis. The tree graphs were drawn according to the OR value and 95% CI values of each indicator from results of multinomial logistic analysis. (A) Model 1: The model was adjusted for partial general conditions (age and glucose levels), sex hormone levels, adipokine levels, inflammatory factor levels, and fat distribution. In the 2nd and 4th quartiles, only age was included. In the 3rd quartile, age, adiponectin/resistin ratio, and liver fat content were included in the equation. (B) Model 2: The model was adjusted for general conditions (age, glucose levels, and lipid levels) and sex hormone, adipokine, and inflammatory factor levels, except for fat distribution. In the 2nd quartile, age and glucose, estradiol/testosterone, and TNF-α levels were independent predictive factors. In the 3rd quartile, age, Hip circumference, height, estradiol level, and adiponectin/resistin level were included in the equation. In the 4th quartile, age, height, and testosterone, estradiol/testosterone, and TNF-α levels were statistically significant. *p<0.05, and the indicators with differences have been marked with red boxes. |
When fat distributions were removed from Model 2, the predictive effect of the equation reached 90%. The predictive effect of the 4th quartile was 95.65%. Age was still included in all three quartiles, with OR values of 1.633, 2.620, and 2.349, respectively. Estradiol/testosterone (OR = 0.689, 2.454, and 0.753, respectively) and TNF-α (OR = 6.053, 1.338, and 4.818, respectively) levels were also included in all three quartiles. In the 2nd quartile, glucose level was found to be an independent influencing factor, with an OR value of 0.11. In the 3rd quartile, hip circumference, height, and adiponectin/resistin levels were included in the equation, with OR values of 0.292, 2.454, and 20.579, respectively. In the 4th quartile, height and testosterone levels were included in the equation, with OR values of 1.672 and 0.016, respectively.
Discussion
The quantitative assessment of bone adipose tissue is of increasing interest in research on osteoporosis and frailty. Further investigation of BMAC could provide new insights into the pathophysiology and prevention of osteoporosis and frailty. However, factors that regulate bone marrow adipogenesis remain unknown. The present study was designed to analyze the factors that influence BMAC and their effects on BMAC at different levels.
Compared to previous studies, the present investigation offers several advances in technology, design, and discovery. (1) QCT and MRI were performed to measure vBMD and BMAC, respectively, in the L2–L4. Measurements averaged over several vertebrae are more representative and accurate. (2) Regulated marrow adipose tissue is distributed predominantly in the axial skeleton,3,7 meaning it might be more suitable to study the fat content of the spine rather than the long bones, where previous studies usually researched. (3) The predictive effect of the equation was significantly improved when fat distribution was removed. Therefore, as the third largest fat depot, the bone adipose tissue is unique and differs from other fat depots. (4) Multinomial logistic analyses suggested that BMAC at different levels may be influenced by different factors. Age, estradiol/testosterone levels, and TNF-α levels are key factors affecting BMAC, and height and glucose level might relate to BMAC in the higher and lower BMAC quartiles, respectively.
In both logistic analyses, age was the most important independent risk factor for BMAC. Qualitative studies reported changes in BMT in humans since 1882, when Ernest Neumann recognized that aging resulted in trabecular bone loss and that most of the bone marrow consisted of adipose tissue.14 Since then, studies in both rodents and humans have validated that aging is associated with a significant increase in BMAC15 and a concurrent decline in bone mineral density. There is substantial and consistent evidence from clinical studies that aging conditions associated with bone loss are commonly associated with adipose-rich bone marrow.2,16,17 It is believed that the red marrow is progressively replaced by adipocytes, leading to an increase in BMAC in older individuals.18–20
Sex hormones also play a significant role in determining BMAC. Although androgen and estrogen levels both decline after menopause, the estrogen level falls sharply;1,9,19,21 thus, estradiol/testosterone showed a slightly negative effect on the relationship with BMAC in our study. However, testosterone level showed a negative correlation with BMAC in the highest 4th quartile. This finding indicates that low androgen levels could also lead to higher BMAC in menopausal women, and estrogen supplementation alone may not change the BMAC in menopausal women effectively.
Increased BMAC and low-inflammation phenotypes are congruent with Aging.11 Aging with increased BMAC has been shown to have higher CCL2/MCP-1 and COX-2.12 Gasparrini et al22 analyzed cytokines and found 53 proteins upregulated in aging, including IL-1, IL-6, and PAI-1. In another study, Cawthorn et al23 found that a higher level of circulating adiponectin correlated with an increase in BMAC in a caloric restriction mouse model. Resistin also plays a role in bone remodeling.24 Breznik et al25 further reported that TNF-α, but not hyperinsulinemia or hyperglycemia, was a key driver of obesity-induced monocytosis. Horowitz et al3 suggested that TNF-α inhibits hematopoietic cell proliferation. Our study confirmed that, among the above adipokines, TNF-α had a significant positive relationship with BMAC at all levels, independent of fat distribution. Thus, it could serve as potential therapeutic targets for future studies.
Previous epidemiological studies have demonstrated that higher BMI and body weight are associated with higher BMAC.26–28 Vogt et al29 reported a significant correlation between weight loss and BMAC loss in 29 obese patients with diabetes. However, in a study reported by Kim et al,30 no BMAC loss was detected six months after gastric bypass surgery in 30 obese women with or without diabetes, with a mean weight loss of 27.3±6.8 kg. Height has also been evaluated in recent studies because height is highly associated with whole-body bone size.31 Our study confirmed that there was no significant correlation among weight, BMI, and BMAC, using either linear or logistic regression. Height was an important positive factor in the two higher BMAC quartiles after removing independent of fat distribution.
Several reports have shown that elevated BMAC is associated with several metabolic conditions, including diabetes, obesity, and, paradoxically, anorexia nervosa.32,33 However, results are often inconsistent among different study populations. In the present study, we investigated the effects of glucose, lipid, and fat distributions on BMAC and demonstrated that only glucose level was a metabolic factor affecting lower BMAC. Therefore, bone adipose tissue differs from fat deposits, which are closely related to systemic metabolic abnormalities.
This study had several limitations. First, the population was retrospectively collected from an earlier study; therefore, some information, such as behavioral factors (smoking, alcohol, and exercise habits), was missing. Second, BMAC was not detected in the hip, which is prone to fragility fractures, and may provide additional information on the regulation of marrow adiposity. Third, because of the cost of performing both MRI and QCT, this study population was relatively small, and investigations in a larger population will be needed in the future.
Conclusion
The marrow adipose tissue is a fat depot distinct from other body fat constituents. Age, sex hormones (estradiol/testosterone), and cytokines (TNF-α) are key factors associated with BMAC in postmenopausal women. In addition, height is related to BMAC in higher BMAC quartiles, whereas glucose level is correlated with BMAC in lower BMAC quartiles.
Data Sharing Statement
The data supporting the findings of this study are available from the corresponding author Xiaoguang Cheng upon reasonable request.
Ethics Approval and Consent to Participate
This cross-sectional study was conducted in accordance with the guidelines of the Declaration of Helsinki (as revised in 2013). The study protocol was approved by the Ethics Committee of Beijing Jishuitan Hospital (20151202), and written informed consent was obtained from all participants prior to participation.
Funding
This work was supported by grants from the Beijing Hospitals Authority Clinical Medicine Development of Special Funding Support (ZYLX202107), the National Natural Science Foundation of China (No. 81971617, 2019), the National Key Research and Development Program of China (No. 2020YFC2004900), the Youth Training Program of Military Medical Science and Technology (20QNPY103), the Translational Medicine Projects of the Chinese People’s Liberation Army General Hospital (2017TM-021), and the High Level Talents “Discipline backbone” Project of Beijing Jishuitan Hospital (XKGG2021123).
Disclosure
The authors declare that the study was conducted in the absence of any commercial or financial relationships that could be construed as potential conflicts of interest.
References
1. Patsch JM, Li X, Baum T, et al. Bone marrow fat composition as a novel imaging biomarker in postmenopausal women with prevalent fragility fractures. J Bone Miner Res. 2013;28(8):1721–1728. doi:10.1002/jbmr.1950
2. Muruganandan S, Govindarajan R, Sinal CJ. Bone marrow adipose tissue and skeletal health. Curr Osteoporos Rep. 2018;16(4):434–442. doi:10.1007/s11914-018-0451-y
3. Horowitz MC, Berry R, Holtrup B, et al. Bone marrow adipocytes. Adipocyte. 2017;6(3):193–204. doi:10.1080/21623945.2017.1367881
4. Bredella MA, Fazeli PK, Miller KK, et al. Increased bone marrow fat in anorexia nervosa. J Clin Endocrinol Metab. 2009;94(6):2129–2136. doi:10.1210/jc.2008-2532
5. Blank RD. Insulin, fat, and bone: multiple interactions lead to complex biology. Transl Res. 2013;161(3):141–144. doi:10.1016/j.trsl.2012.10.009
6. Li K, Zhang Y, Wang L, et al. The protocol for the prospective urban rural epidemiology China action on spine and hip status study. Quant Imaging Med Surg. 2018;8(7):667–672. doi:10.21037/qims.2018.08.07
7. Cheng X, Blake GM, Guo Z, et al. Correction of QCT vBMD using MRI measurements of marrow adipose tissue. Bone. 2019;120:504–511. doi:10.1016/j.bone.2018.12.015
8. Cheng X, Zhang Y, Wang C, et al. The optimal anatomic site for a single slice to estimate the total volume of visceral adipose tissue by using the quantitative computed tomography (QCT) in Chinese population. Eur J Clin Nutr. 2018;72(11):1567–1575. doi:10.1038/s41430-018-0122-1
9. Chen CC, Liu YJ, Lee SP, Yang HT, Chan WP. Gender interactions between vertebral bone mineral density and fat content in the elderly: assessment using fat-water MRI. J Magn Reson Imaging. 2020;51(5):1382–1389. doi:10.1002/jmri.26956
10. Zhang Y, Zhou Z, Wu C, et al. Population-stratified analysis of bone mineral density distribution in cervical and lumbar vertebrae of Chinese from quantitative computed tomography. Korean J Radiol. 2016;17(5):581–589. doi:10.3348/kjr.2016.17.5.581
11. Pangrazzi L, Meryk A, Naismith E, et al. ”Inflamm-aging” influences immune cell survival factors in human bone marrow. Eur J Immunol. 2017;47(3):481–492. doi:10.1002/eji.201646570
12. Hardaway AL, Herroon MK, Rajagurubandara E, Podgorski I. Bone marrow fat: linking adipocyte-induced inflammation with skeletal metastases. Cancer Metastasis Rev. 2014;33(2–3):527–543. doi:10.1007/s10555-013-9484-y
13. Lu Y, Li J, Cheng X, et al. Testosterone level in aging male with different glucose tolerance state and its association with osteocalcin. Aging Male. 2019;22(1):68–73. doi:10.1080/13685538.2018.1481940
14. Nehlin JO, Jafari A, Tencerova M, Kassem M. Aging and lineage allocation changes of bone marrow skeletal (stromal) stem cells. Bone. 2019;123:265–273. doi:10.1016/j.bone.2019.03.041
15. Fazeli PK, Horowitz MC, MacDougald OA, et al. Marrow fat and bone--new perspectives. J Clin Endocrinol Metab. 2013;98(3):935–945. doi:10.1210/jc.2012-3634
16. Morris EV, Edwards CM. Adipokines, adiposity, and bone marrow adipocytes: dangerous accomplices in multiple myeloma. J Cell Physiol. 2018;233(12):9159–9166. doi:10.1002/jcp.26884
17. Chen Q, Shou P, Zheng C, et al. Fate decision of mesenchymal stem cells: adipocytes or osteoblasts? Cell Death Differ. 2016;23(7):1128–1139. doi:10.1038/cdd.2015.168
18. Cheung WH, Shen WY, Dai DL, et al. Evaluation of a multidisciplinary rehabilitation programme for elderly patients with Hip fracture: a prospective cohort study. J Rehabil Med. 2018;50(3):285–291. doi:10.2340/16501977-2310
19. Griffith JF, Yeung DK, Ma HT, Leung JC, Kwok TC, Leung PC. Bone marrow fat content in the elderly: a reversal of sex difference seen in younger subjects. J Magn Reson Imaging. 2012;36(1):225–230. doi:10.1002/jmri.23619
20. Roldan-Valadez E, Pina-Jimenez C, Favila R, Rios C. Gender and age groups interactions in the quantification of bone marrow fat content in lumbar spine using 3T MR spectroscopy: a multivariate analysis of covariance (Mancova). Eur J Radiol. 2013;82(11):e697–702. doi:10.1016/j.ejrad.2013.07.012
21. Toth MJ, Tchernof A, Sites CK, Poehlman ET. Menopause-related changes in body fat distribution. Ann NY Acad Sci. 2000;904:502–506. doi:10.1111/j.1749-6632.2000.tb06506.x
22. Gasparrini M, Rivas D, Elbaz A, Duque G. Differential expression of cytokines in subcutaneous and marrow fat of aging C57BL/6J mice. Exp Gerontol. 2009;44(9):613–618. doi:10.1016/j.exger.2009.05.009
23. Cawthorn WP, Scheller EL, Learman BS, et al. Bone marrow adipose tissue is an endocrine organ that contributes to increased circulating adiponectin during caloric restriction. Cell Metab. 2014;20(2):368–375. doi:10.1016/j.cmet.2014.06.003
24. Tariq S, Tariq S, Khaliq S, Lone KP. Serum resistin levels and related genetic variants are associated with bone mineral density in postmenopausal women. Front Endocrinol. 2022;13:868120. doi:10.3389/fendo.2022.868120
25. Breznik JA, Naidoo A, Foley KP, et al. TNF, but not hyperinsulinemia or hyperglycemia, is a key driver of obesity-induced monocytosis revealing that inflammatory monocytes correlate with insulin in obese male mice. Physiol Rep. 2018;6(23):e13937. doi:10.14814/phy2.13937
26. Wang L, Su Y, Wang Q, et al. Validation of asynchronous quantitative bone densitometry of the spine: accuracy, short-term reproducibility, and a comparison with conventional quantitative computed tomography. Sci Rep. 2017;7(1):6284. doi:10.1038/s41598-017-06608-y
27. Baum T, Yap SP, Karampinos DC, et al. Does vertebral bone marrow fat content correlate with abdominal adipose tissue, lumbar spine bone mineral density, and blood biomarkers in women with type 2 diabetes mellitus? J Magn Reson Imaging. 2012;35(1):117–124. doi:10.1002/jmri.22757
28. Pop LM, Lingvay I, Yuan Q, Li X, Adams-Huet B, Maalouf NM. Impact of pioglitazone on bone mineral density and bone marrow fat content. Osteoporos Int. 2017;28(11):3261–3269. doi:10.1007/s00198-017-4164-3
29. Vogt LJ, Steveling A, Meffert PJ, et al. Magnetic resonance imaging of changes in abdominal compartments in obese diabetics during a low-calorie weight-loss program. PLoS One. 2016;11(4):e0153595. doi:10.1371/journal.pone.0153595
30. Kim TY, Schwartz AV, Li X, et al. Bone marrow fat changes after gastric bypass surgery are associated with loss of bone mass. J Bone Miner Res. 2017;32(11):2239–2247. doi:10.1002/jbmr.3212
31. Park JH, Song YM, Sung J, et al. The association between fat and lean mass and bone mineral density: the healthy twin study. Bone. 2012;50(4):1006–1011. doi:10.1016/j.bone.2012.01.015
32. Sebo ZL, Rendina-Ruedy E, Ables GP, et al. Bone marrow adiposity: basic and clinical implications. Endocr Rev. 2019;40(5):1187–1206. doi:10.1210/er.2018-00138
33. Veldhuis-Vlug AG, Rosen CJ. Clinical implications of bone marrow adiposity. J Intern Med. 2018;283(2):121–139. doi:10.1111/joim.12718
 © 2023 The Author(s). This work is published and licensed by Dove Medical Press Limited. The
full terms of this license are available at https://www.dovepress.com/terms
and incorporate the Creative Commons Attribution
- Non Commercial (unported, 3.0) License.
By accessing the work you hereby accept the Terms. Non-commercial uses of the work are permitted
without any further permission from Dove Medical Press Limited, provided the work is properly
attributed. For permission for commercial use of this work, please see paragraphs 4.2 and 5 of our Terms.
© 2023 The Author(s). This work is published and licensed by Dove Medical Press Limited. The
full terms of this license are available at https://www.dovepress.com/terms
and incorporate the Creative Commons Attribution
- Non Commercial (unported, 3.0) License.
By accessing the work you hereby accept the Terms. Non-commercial uses of the work are permitted
without any further permission from Dove Medical Press Limited, provided the work is properly
attributed. For permission for commercial use of this work, please see paragraphs 4.2 and 5 of our Terms.