Back to Journals » Psychology Research and Behavior Management » Volume 16
Risk Assessment of Passenger Behaviors That Influence Accident Type and Severity in Metro Operation
Authors Lu Y, Zhang Y ![]() , Jiang X, Wang Y
, Jiang X, Wang Y
Received 8 May 2023
Accepted for publication 31 August 2023
Published 7 September 2023 Volume 2023:16 Pages 3697—3715
DOI https://doi.org/10.2147/PRBM.S419194
Checked for plagiarism Yes
Review by Single anonymous peer review
Peer reviewer comments 2
Editor who approved publication: Professor Mei-Chun Cheung
Ying Lu,1– 3 Yi Zhang,1 Xuepeng Jiang,1– 3 Yong Wang1– 3
1School of Resources and Environmental Engineering, Wuhan University of Science and Technology, Wuhan, 430081, People’s Republic of China; 2Hubei Industrial Safety Engineering Technology Research Center, Wuhan University of Science and Technology, Wuhan, 430081, People’s Republic of China; 3Safety and Emergency Research Institute, Wuhan University of Science and Technology, Wuhan, 430081, People’s Republic of China
Correspondence: Yong Wang, Email [email protected]
Background: The unsafe behavior of passengers frequently causes metro operation accidents. This research aims to establish a model for evaluating the risk of unsafe behavior among subway passengers and for assessing the severity of different types of accidents caused by passenger unsafe behavior.
Methods: A risk assessment model that combines the Interaction Matrix (IM) model with a Monte Carlo algorithm was established to quantitatively test the risk of unsafe behavior among passengers. Based on the initial data of 234 cases, the behavioral risks in accidents were simulated, and the resulting risks follow a normal distribution. After analyzing the differences in behavioral risk distribution characteristics, the targeted risk mitigation countermeasures were obtained.
Results: Results showed that there are 12 kinds of unsafe behaviors related to 4 metro operation accident types. Among them, crowded stampede caused by four kinds of passengers’ unsafe behavior has the highest risk mean (μ) of 5.14, followed by escalator injury (4.72), pinched by a shielding barrier (4.42) and fall injury (4.14).
Conclusion: The severity of different types of accidents caused by different unsafe behaviors of passengers was obtained, which can provide a basis for targeted risk mitigation strategies and measures.
Keywords: passenger unsafe behaviors, metro operation safety, interaction matrix model, IM model, Monte Carlo algorithm, risk mitigation
Introduction
As a modern mode of advantageous transportation with large capacity, high speed, low pollution and energy saving, metro is being constructed in many cities of China.1,2 The increased metro lines also bring new challenges and demands for reliable and safe metro operation.3,4 Report showed that there were 1023 metro operation incidents with delays exceeding 5 min in China in 2020, which resulted in casualties and serious property losses.5
Among risk factors such as human factors, equipment factors, management factors and environmental factors of metro operation, accidents caused by passengers’ unsafe behavior account for the highest proportion, due to the lack of safety awareness, less traffic safety training, as well as the metro riding rules are not as strict and explicit as traffic regulations in China.6–8 Moreover, metro passengers’ unsafe behaviors are diverse such as going on boarding even after the door-close alarm sounded,2 irregular behavior on escalators1,9 and pushing each other.10 And the accidents caused by them are uncertain, for instance, some behaviors induce escalator injuries, some lead to fall injury, some have relations to pinched by the shielding barrier, and some even to crowded stampede.11 It can be seen that there are diverse unsafe behaviors that cause various metro operation accidents, which increases the difficulty of risk management. Considering the growing proportion of passengers’ unsafe behaviors and their grave consequences in metro operation, there is an urgent need to examine the passengers’ unsafe behaviors risk that affect accident type and severity of metro operation for improving the pertinence and effectiveness of risk mitigation countermeasures. Risk assessment of unsafe behavior is a significant approach to identify risk source and reduce injuries.12 The risk of unsafe behavior consists of the possibility of behavior and the severity of consequence that caused by the behavior. In order to quantitatively explore the risk of passengers’ unsafe behaviors, it is necessary to understand the uncertainty of behavioral risk, find out the effect of each passenger's unsafe behavior on the accident type and severity of metro operation.13 The selection of comprehensive passengers' unsafe behaviors and the choice of appropriate analytical methods are two important considerations for establishing an accurate risk assessment model to study each passenger's unsafe behavior related to different metro accident types and risk levels.
In regard to the selection of passenger’s unsafe behaviors, previous studies mainly focus on one or some types, lacking of comprehensive analysis. Unsafe behaviors in metro escalator were the most widely concerned. For instance, Liu et al used statistical data to focus on analyzing three prominent unsafe behaviors of passengers that have a significant impact on subway operation safety. They are passenger intrusion into restricted areas, passengers carrying prohibited items on board, and passengers smoking inside the station.14 However, they only conducted qualitative analysis on these three types of behaviors, did not have quantitative analysis of the risk level of these three behaviors, lacked quantitative standards for the degree of accident risk caused by unsafe behaviors and did not fully consider unsafe behaviors. Wang et al constructed a disordered multi-classification logistic regression model to analyze 894 escalator accidents in Beijing subway from 2016 to 2018. The results showed that wet and slippery steps, crowding and unsafe escalator behaviors occur frequently were the main factors leading to the accidents.15 Xing et al constructed a Bayesian network structure based on expert knowledge and Dempster-Shafer evidence theory and further improved it based on conditional independence testing. Then, using 950 escalator-related damages, the expectation maximization (EM) algorithm was used to estimate the posterior probability of the Bayesian network and determine the risk factors affecting the safety of escalators in subway stations.16 However, they only focus on the unsafe behavior and risks of passengers on escalators, the unsafe behavior of passengers on escalators is just one type of passengers’ unsafe behaviors. There are many other unsafe behaviors that run through the entire process of passengers taking the subway, such as pushing and shoving each other when entering the subway, running quickly inside the subway station and so on. In summary, existing literature only focuses on one or several aspects of unsafe behavior among subway passengers, without comprehensively analyzing the unsafe behavior of passengers throughout the entire subway ride. The risk behaviors that are most likely to cause metro operation accidents are not clear, which means we need to find a suitable method to systematically analyze the entire process of passengers taking the subway.
Interaction Matrix (IM) is a systematic method to analyze risk factors, which has been developed rapidly in the field of risk management.17 The IM model takes work breakdown structure (WBS) and Risk Breakdown Structure (RBS) as the framework. The risk identification process is mainly divided into four steps, which contains WBS analysis, RBS analysis, coupling interaction analysis and final correction and optimization. Zhang et al combined IM model with an ideal point method to establish a risk assessment model on water inrush risk of coal seam floor,18 which verifies the systematisms and advances of IM model in identification of risk factors. Therefore, using IM model can better find the passengers' unsafe behaviors more comprehensively and accurately.
Meanwhile, as a qualitative model, the IM model has disadvantages in the quantifiable analysis of behavior risk and their influence on the consequences of metro operation accidents. Considering the complexity of consequences caused by multiple passengers’ unsafe behaviors, non-linear models have attracted more attention to measure the interactions between unsafe behaviors and severity of consequences in recent years.15,19,20 For instance, Xie et al used ISM-DEMATEL to explore the relationship among escalators, passengers and environment in subway station.18 In 2020, Wang et al analyzed 40 typical metro operation accidents, which were divided into four levels according to the severity of consequence including high, medium, low and insurance accidents. The conditional configurations among passengers’ unsafe behaviors and the four levels of consequence were studied by using Fuzzy Set Qualitative Comparative Analysis (fsQCA). Results showed that there are 12 types of conditional configurations, which were finally classified into weak safety awareness type, lack of supervision type and other influence type to put forward risk management countermeasures.15 Li et al conducted a Bayesian network analysis of 950 subway escalator accidents in terms of occurrence probability and severity. It was found that standing instability was the most likely factor to induce accidents, and among the types of injuries caused to passengers, head and neck injuries were more serious.19
Although these non-linear models have important superiority in revealing the relevance of passengers’ unsafe behaviors and accident consequences,4,15,19,20 a low prediction of accident risk may appear, as they did not consider the effect of different behaviors on the accident type and severity of metro operation. Moreover, due to the uncertainty of behavior occurrence and its consequence, behavioral risk is not a certain value but obeys a certain distribution in statistical significance, which is always omitted. These may lead to potential differences in behavioral risk that cannot be captured, thus reducing the accuracy of preventive measures. Therefore, general deterministic risk assessment methods, which are usually used to study the overall risk of unsafe behavior in the entire accident data set, are not applicable to dealing with the uncertainty of behavioral risk.
The Monte Carlo algorithm, as a numerical calculation method based on probability and statistics theory, can effectively resolve the uncertainty in risk assessment in the form of probability distribution. By simulating real environments with thousands of repetitive random numbers, it can better reveal the statistical distribution of uncertain phenomena based on a priori probability and risk function.21 Therefore, the Monte Carlo algorithm, combined with a multidimensional data set containing comprehensive passengers’ unsafe behaviors and their consequences, could provide more powerful insights than applying a general deterministic risk assessment model to accurately measure the risk of each type of behavior related to different accident consequences.
In this study, the Interaction Matrix (IM) model and Monte Carlo algorithm are first combined to quantitatively reveal the risk of passengers’ unsafe behaviors related to different accident types and severity of metro operation. Specifically, based on a comprehensive data set of 234 metro operation accidents caused by passengers’ unsafe behaviors, a behavioral risk function was established to support the statistical simulation analysis of Monte Carlo algorithm by splitting the entire data into several homogeneous groups, which accurately revealed the uncertainty of various behavioral risks. This analysis could help us quantitatively understand the high-risk unsafe behaviors associated with high incidence of severe casualties in metro operation. The results will provide useful insights for solving the risk mitigation problems on metro passengers safety management, which can provide a basis for safe metro operation.
Materials
Through sorting out the cases of metro operation accidents caused by passengers’ unsafe behavior published by the local emergency management departments and safety management web pages in China, a total of 234 cases from the years of 2002 to 2020 were used as the materials. Each case has a relatively detailed description of the accident time, location, process and direct causes. Some of these cases contain more detailed information such as indirect causes and people responsible for the accident. The 234 cases include 61 escalator injuries, 56 pinched by shielding barrier, 59 crowded stampedes in metro station (including near miss) and 58 fall injuries, which match the types of metro operation accident caused by passengers’ unsafe behavior. A brief description of partial accidents (2010–2020) is shown in Appendix A.
Methodology
The workflow of the proposed approach consists of four key steps, as shown in Figure 1, including identifying unsafe behavior and the related accident based on IM model, establishing a Monte Carlo model based on the constructor function of behavioral risk that will consider both the identified behavior and the consequence caused by the behavior, quantifying the behavioral risk distribution characteristics and putting forward risk mitigation strategies according to the behavioral risk characteristics.
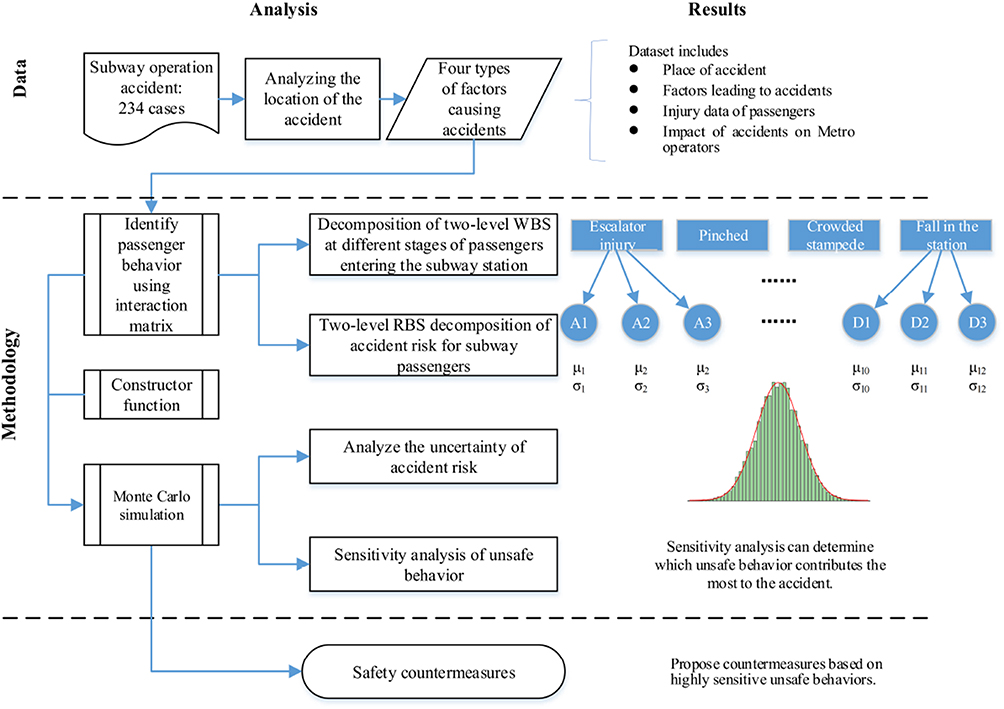 |
Figure 1 The key process of the methodological flow. |
Identify Unsafe Behavior and the Related Accident Using IM Model
Establish a Passenger Unsafe Behavior Analysis System Based on WBS-RBS
In order to identify the risk of unsafe behavior of subway passengers comprehensively, the IM model was used to carry out a 2-level risk identification based on WBS-RBS.15
- Work breakdown structure. According to the WBS decomposition principle, the sequence of passengers taking the subway is decomposed, 1-level WBS is divided into four stages: escalator, subway station, waiting area and carriage. The stages are decomposed to 2-level WBS, and the decomposition results of 2-level WBS are shown in Table 1.
- Risk breakdown structure. According to the RBS risk decomposition principle, the risk source of subway operation is decomposed into two levels of risk, and the first level of RBS is classified into human factors, physical factors, environmental factors and management factors according to the characteristics of subway operation accidents; combined with the characteristics of the first-level decomposition, determine potentially all risk factors construct a 2-level RBS, and the decomposition results of the 2-level RBS are shown in Table 2.
- Coupling interaction analysis. Decompose the WBS work as horizontal and the RBS risk as vertical and establish a risk decomposition coupling interaction matrix. Example: W13 interacts with R13 and R22 to generate unsafe behavior of “performing other tasks” and so on traverses the entire “risk decomposition coupling interaction matrix” to obtain the second-level decomposition coupling analysis of WBS-RBS as shown in Table 3.
- Correction and optimization. On the basis of the initial analysis constructed by WBS-RBS, the initial risk factors were judged, supplemented and revised in combination with the opinions and suggestions of experts in urban rail transit operation and management and the professional experience of subway security personnel, subway crew and so on. Only the human factor was considered, and the factors of objects, rings, and pipes are not considered so as to obtain the unsafe behavior of passengers, as shown in Table 4.
 |
Table 1 Decomposition of Two-Level WBS at Different Stages of Passengers Entering the Subway Station |
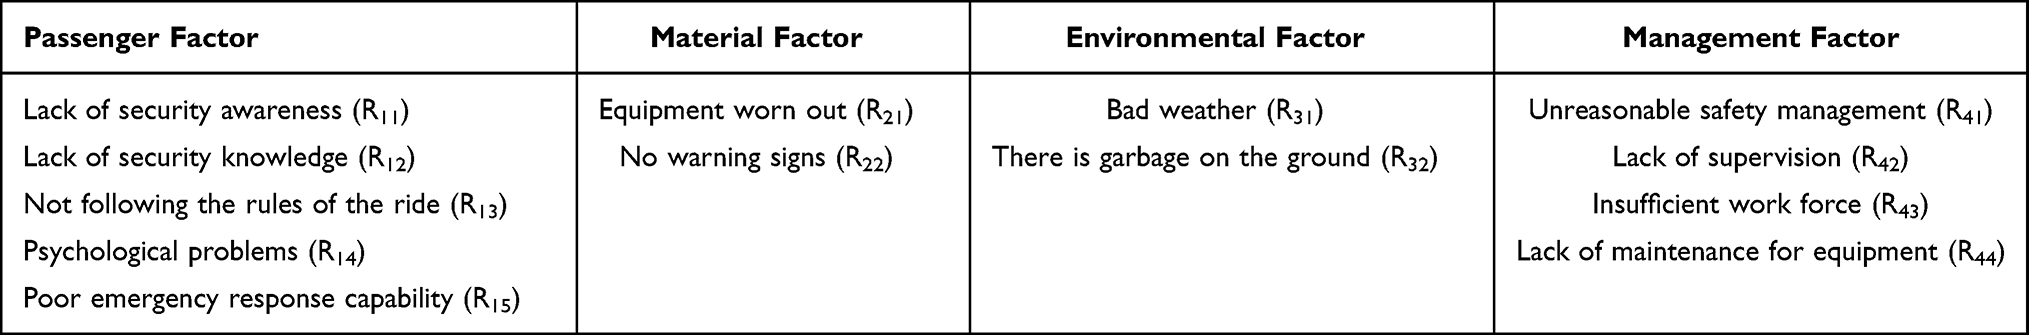 |
Table 2 Two-Level RBS Decomposition of Accident Risk for Subway Passengers |
 |
Table 3 Two Level Decomposition Coupling of WBS-RBS |
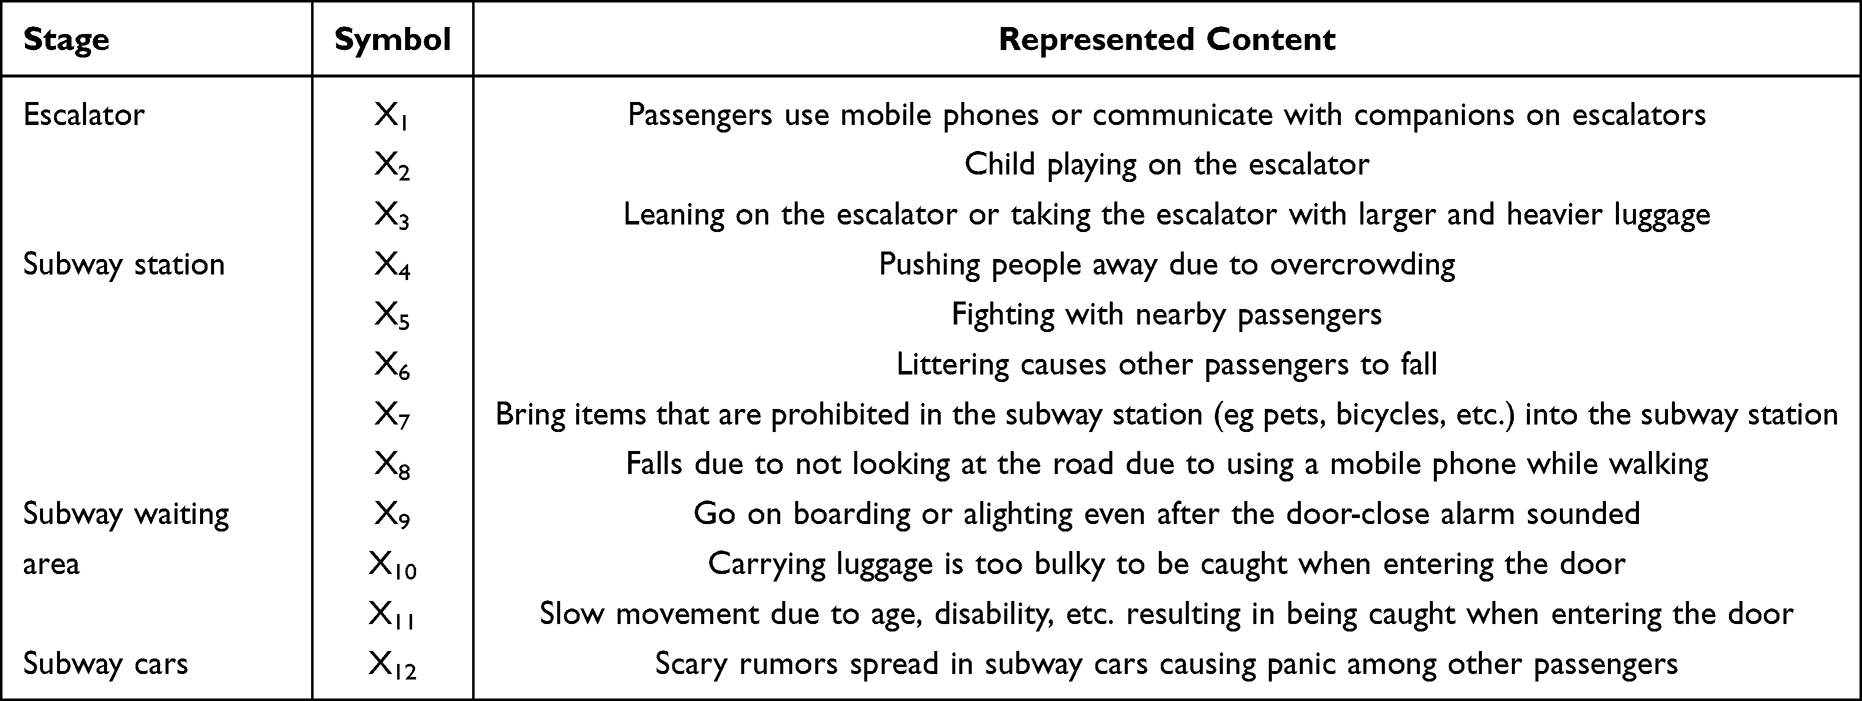 |
Table 4 Risk Factor System of Unsafe Behavior of Subway Passengers |
Identification of Accident Type Related to Unsafe Behavior
Referring to the results in Table 4, the collected accident cases can be divided into four accident types including escalator injury, pinched by a shielding barrier, crowded stampede and fall injury in the station. The related unsafe behaviors were divided into 12 categories. This study uses a Monte Carlo method to analyze sample data of passenger unsafe behavior and accident injury type. Thus, the key to construct a valid data set is to identify the possible accident types and behaviors for clarifying the structure of the data set based on the actual cases.22,23
Among these types of accidents, escalator injury is the most studied.24–27 The unsafe behaviors that lead to escalator injuries were divided into performing other tasks, children making trouble and irregular behavior on escalators.28 When they push each other, fights and spread rumors are more likely to cause crowded stampedes.29 As for pinched by a shielding barrier and a fall injury in the station, few studies have focused on behaviors that cause such injuries. Through analyzing the causative factors of collected cases, we found that going on boarding or alighting even after the door-close alarm sounded, moving slowly and carrying large baggage were the most behavioral factors of pinched by a shielding barrier, and taking prohibited things such as pets, paying no attention to the ground and littering were contributed to fall injury in the station. All the behaviors and relevant accident types were categorized and numbered, as shown in Table 5.
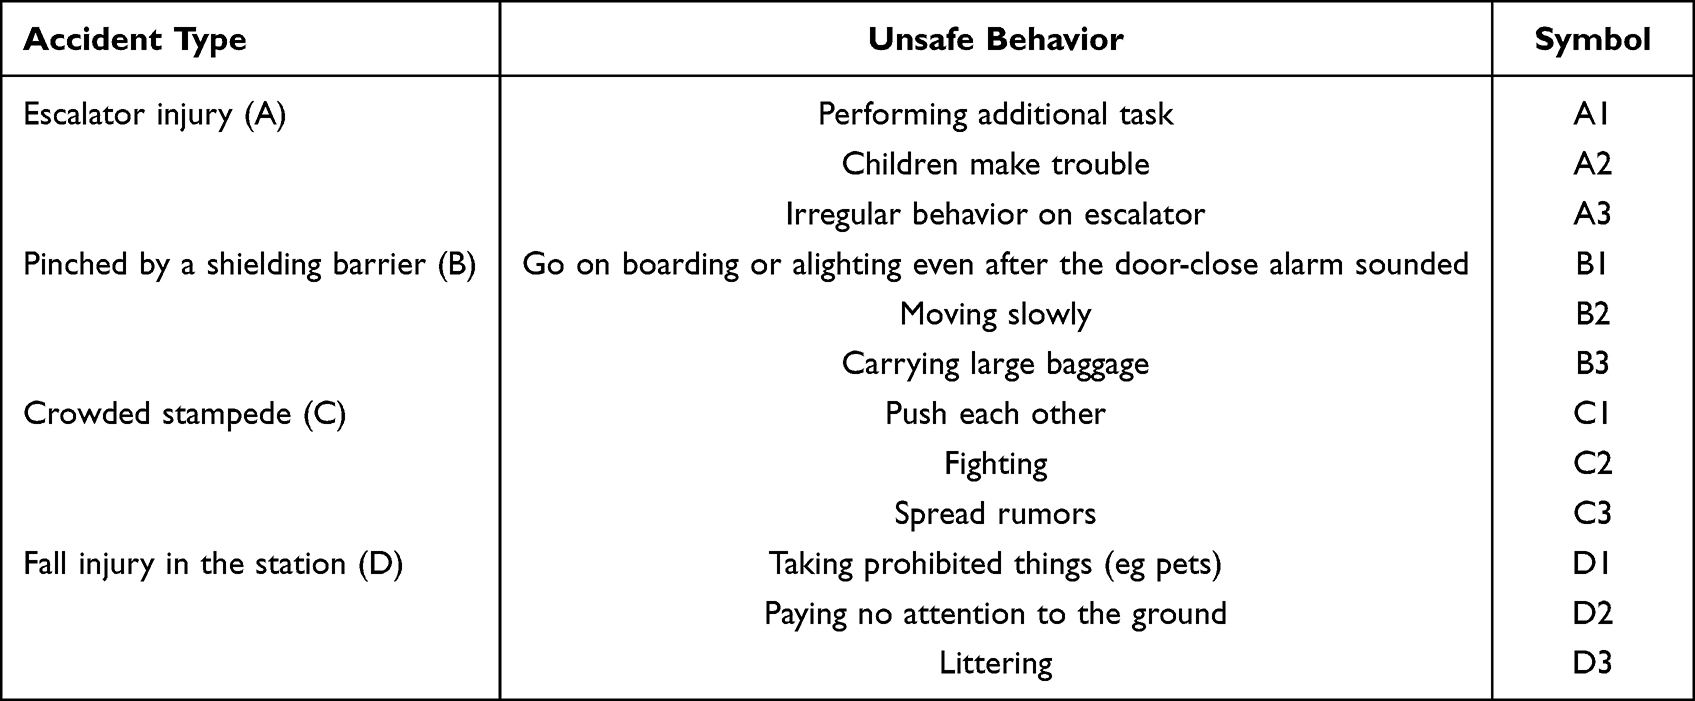 |
Table 5 Categories of Unsafe Behaviors and Relevant Accident Types |
Establishing Monte Carlo Model for Behavioral Risk
Classification of Accident Severity
In order to quantitatively analyze the risk levels caused by different passengers’ unsafe behaviors, it is necessary to classify the severity of the accident to illustrate the relationship between unsafe behaviors and the different consequences. According to the Chinese official document “Emergency Plan for National Urban Rail Transit Operation Emergencies”, operational emergencies are classified into four levels, which are I (catastrophic, more than 30 deaths, or more than 100 seriously injured, or more than 100 million RMB of direct economic loss), II (destructive, 10–30 deaths, or 50–100 seriously injured, or 50–100 million RMB of direct economic loss, or metro operation delay for more than 24 hr), III (severe, 3–10 deaths, or 10–50 seriously injured, or 10–50 million RMB of direct economic loss, or 6–24-hr delay), and IV (ordinary, less than 3 deaths, or less than 10 seriously injured, or 0.5–10 million RMB of direct economic loss, or 2–6-hr delay).
However, most accidents caused by passengers’ unsafe behaviors are near accidents or ordinary operational emergencies. Therefore, scholars have proposed some relatively more detailed classifications to focus on the impact of unsafe behaviors on metro shutdown time and casualties.30,31 For instance, literature divided subway operation accidents into high-impact accident, medium-impact accident, low-impact accident and near-missing accident. Take low-impact accident as an example, 1–2 injuries or less than 1-hr delay will be classified as this level of accident. By comparing the classification of previous studies, combined with our research needs, the metro operation incidents caused by passengers are divided into five levels in this study, as shown in Table 6. In addition, different degrees of severity were assigned to corresponding values so that the consequences can be quantified for the structured data set.
 |
Table 6 Classification of Accident Severity Levels |
According to Table 5 and Table 6, the 234 metro operation accidents can be transformed into a structured data set, which could count and characterize the metro operation accidents caused by different passengers’ unsafe behaviors through a unified symbolic and quantitative expression. For example, on November 24, 2019, a man at Zhifang Street Station of Fuzhou Metro Line 7 made a phone call while riding on the escalator and fell down, and hit a passenger behind him. Both were slightly injured. According to Table 5, the accident was classified as an escalator injury, and the unsafe behavior involved in the accident was performing additional task (A1). According to Table 6 and Table 2 people were slightly injured in the accident, and no one was seriously injured or killed. The subway does not stop. Therefore, the accident severity level is level IV, and the quantitative score is 4. The structured data set provides a good basis for Monte Carlo algorithm to establish an accurate risk assessment model to study each passenger's unsafe behavior related to different metro accident types and risk levels.
Establish Constructor Function of Behavioral Risk
Because risk is a function of the possibility and consequence, only considering the frequency of behavior in the accident samples cannot accurately reflect the risk. Considering both the possibility of behaviors and the consequences caused by the behaviors contributed to a certain type of accident, a risk-based function is constructed as a mathematical model for Monte Carlo simulation as shown in Equation 1. It can be seen from Table 5 that each type of accident can be caused by multiple unsafe behaviors. The risk of this accident is a comprehensive measure of the probability and consequences of the various unsafe behaviors.

In formula (1), there are n categories of passengers’ unsafe behaviors that could induce the same type of accident. R represents the total behavioral risk of this accident. R represents the probability of the i-th unsafe behavior. Si represents the loss caused by the i-th unsafe behavior.
Determine the Probability Distribution of Accident Severity Caused by Unsafe Behavior
The unsafe behaviors under each accident type are independent and obey their respective probability distributions. According to formula (1), the probability of unsafe behavior Pi is determined by the frequency at which the behavior contributed to the accident in the data set, which is a fixed value. Taking the escalator injury (A) as an example, there are 61 escalator injuries in the data set with a total number of 234. In addition, these escalator injuries are induced by three categories of unsafe behavior marked as A1 to A3 (Table 5). A2 occurred 17 times, so the probability of A2 was PA2=17/61=0.28.
As for Si, it is a random variable. That is because there are multiple categories of unsafe behaviors that lead to the same type of accident, and even the same category of unsafe behavior, the consequences caused by it are different in each case. In other words, the accident losses caused by the same category of unsafe behavior are random. Taking unsafe behavior A2 as an example, according to the classification of the quantified value of accident losses in Table 7, the quantified value of each accident is determined, and there are 17 quantified risk values in total. By performing a goodness-of-fit test including Chi-square, Kolmogorov–Smirnov, and Anderson-Darling for these risk values accident parameters, the risk values best fit the normal distribution with μ=4.8 and σ=1.22.
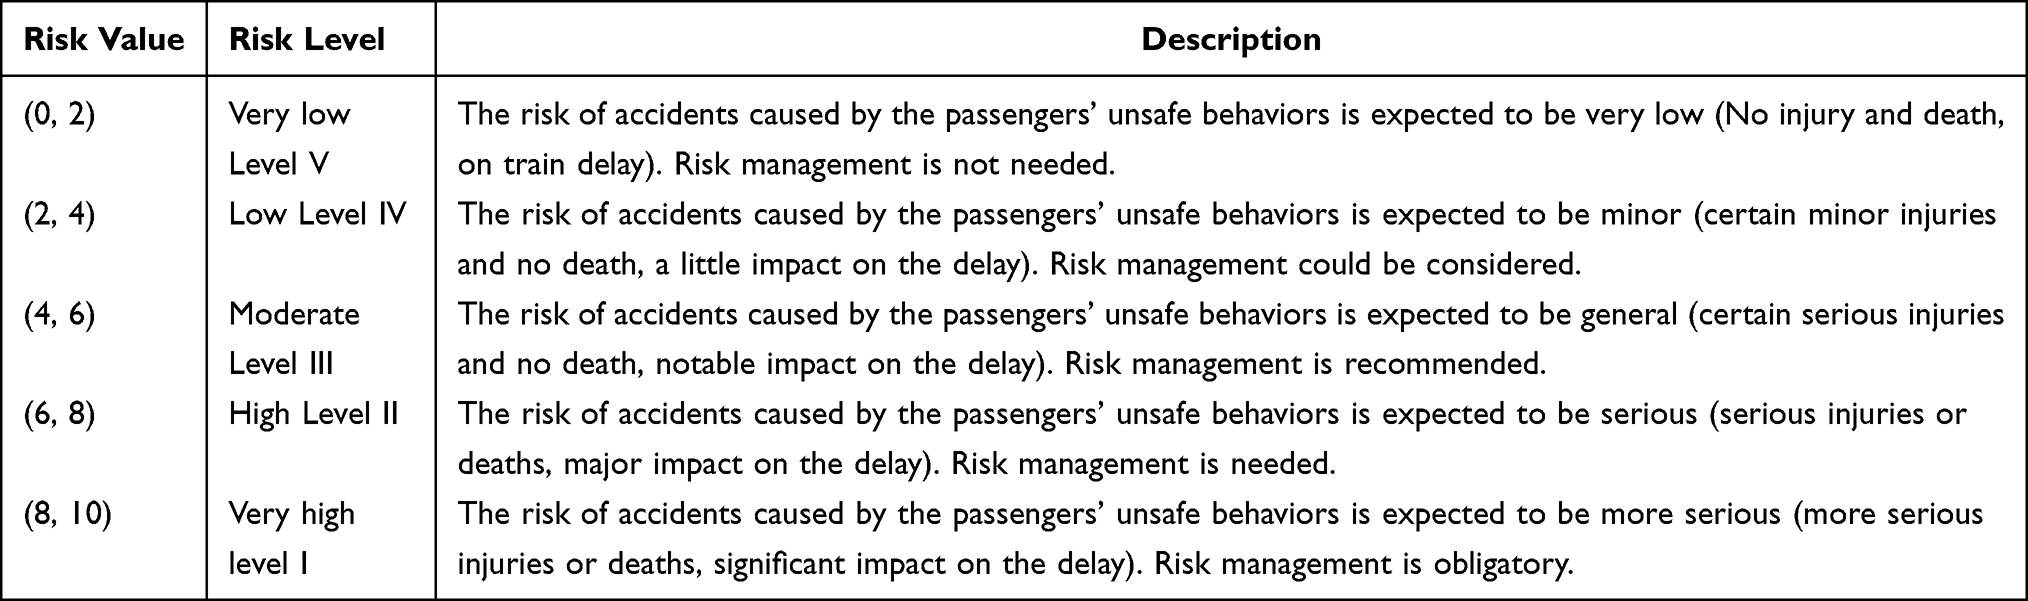 |
Table 7 The Classification of the Behavioral Risk Related to Metro Operation Accident |
As a function of Pi and Si, the behavioral risk of this accident R is also a random variable, which has the properties of uncertainty. In addition, since the accident severity was classified into five levels in Table 6 and the sum of Pi is 1, the value of R theoretically varies between 0 and 10, which is consistent with the classification of Table 6. Thus, the risk levels include five degrees, which are Level V (0, 2), Level IV (2, 4), Level III (4, 6), Level II (6, 8) and level I (8, 10), from the lowest to the highest, as shown in Table 7.
Monte Carlo Simulation from the Priori Probability Distribution
After determining the probability of unsafe behaviors and the probability distribution of accident losses caused by them, we could generate random numbers and conduct sampling by Monte Carlo algorithm. A series of random numbers generated by sampling are used as the sampling input of the system for numerical simulation experiments. A large number of simulation experiment values will be obtained. Since the behavioral risk function is composed of various random variables from the probability of the unsafe behaviors and the probability distribution of accident losses, the simulation results of behavioral risk will also obey various probability distributions. This is the process to realize Monte Carlo simulations to establish an accurate risk assessment model to study each passenger's unsafe behavior related to different metro accident types and risk levels.
The probability distribution of common random variables is generally divided into two categories. One is discrete distribution (binomial distribution, position distribution, etc.), and the other is continuous distribution (uniform distribution, exponential distribution, normal distribution, etc.). The random numbers of each random variable obey a specific probability distribution. The parameter estimation method of normal distribution used in this paper is introduced below.
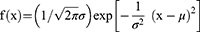
The normal distribution, denoted as N (μ, σ2), is the distribution of a continuous random variable with two parameters μ and σ2. The first parameter μ is the mean value of the random variable, and the second parameter σ2 is the variance of this random variable. The density function of the random variable X is f(X) as shown in formula (2).
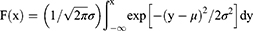
Its probability distribution function is shown in formula (3).
The maximum likelihood of μ is estimated as 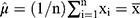
The maximum likelihood of σ2 is estimated as 
However, due to 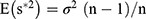 , the sample variance
  is not an unbiased estimate of the population variance σ2. The following corrections (see formula (4)) are made to
  .
.

Finally, the Monte Carlo simulation was carried out through the Oracle Crystal Ball 11.1, based on the constructed behavioral risk function and the a priori probability distribution obtained from the structured data set. The number of experiments was set to 10,000, with a confidence of 95%. When the sampling is sufficient, the simulation results are statistically processed to calculate the statistical characteristic parameters of behavioral risk under each accident type.
In addition, sensitivity analysis of each unsafe behavior was conducted to measure the contribution of each behavior to accident risk. Sensitivity analysis is a method of analyzing uncertainty in the economic evaluation of investment projects. Applied to the risk assessment of unsafe behavior, it refers to an uncertainty analysis method that studies the impact of relevant parameters in the risk assessment of unsafe behavior from the perspective of quantitative analysis. Under the influence of uncertainties such as the category of unsafe behavior, the value of behavioral risk may mislead decision-making. Therefore, it is necessary to further conduct a sensitivity analysis on the various unsafe behaviors that cause behavioral risks.
Results
Probability Distribution of Unsafe Behavior and Accident Severity
Based on the structured data set, the probability distribution of each unsafe behavior caused by accident types and losses was analyzed by splitting the entire data into several homogeneous groups. By performing a goodness-of-fit test including Chi-square, Kolmogorov–Smirnov, and Anderson-Darling for each type of accident, the severity of accident best fits the normal distribution. The detailed results are shown in Table 8.
 |
Table 8 Probability Distribution of Unsafe Behaviors and Consequences |
It was found that the probability distribution of accident severity caused by each unsafe behavior generally obeys the normal distribution. The obtained frequencies and the probability distributions of each behavior will be used to provide initial parameters for the following Monte Carlo modeling.
Behavioral Risk of Each Type of Accident
According to the Monte Carlo simulation, the probability distributions of the behavioral risks for the four types of metro operation accident caused by the 12 categories of passengers’ unsafe behaviors were obtained as shown in Figure 2. The total behavioral risk of each type of accident obeys the normal distribution. The mean values of risk are between (4, 6). Among them, the mean value of crowded stampede was the highest at 5.14, and fall injury in the station was the lowest at 4.14, indicating the differences of accident severity caused by multiple unsafe behaviors. The variance of pinched by a shielding barrier is the highest at 1.29, followed by crowded stampede of 1.08. The variance of the escalator injury and the fall injury in the station are 0.60 and 0.59, which are much lower than the previous two accidents, indicating the differences of behavioral risk fluctuations related to each type of accident.
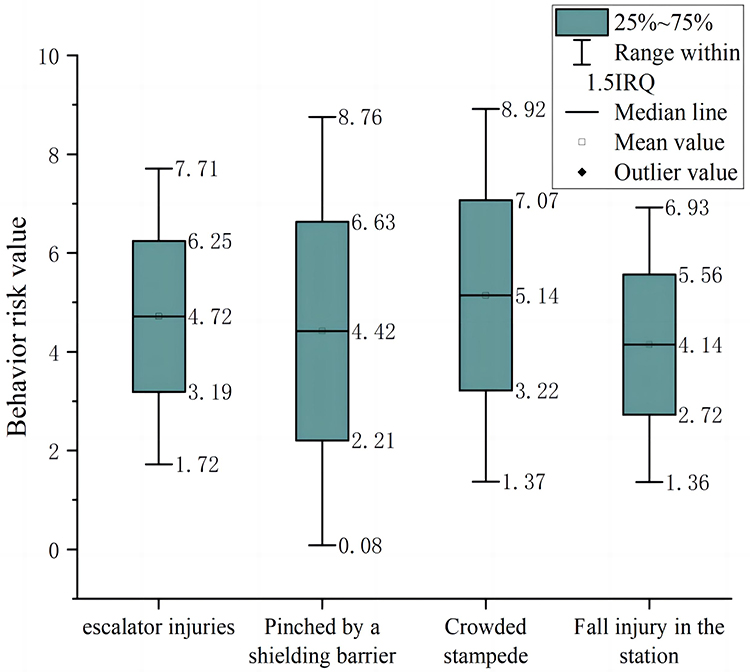 |
Figure 2 Probability distribution of behavioral risk for each accident type. |
In regard to the risk levels of each type of accident, a box plot is drawn in Figure 3. The results of risk levels related to each type of accident are not invariant values, but a series of values that reflect the possible risk levels of each accident. Among the highest values of the total behavioral risk, the crowded stampede was at 8.92, followed by pinched by a shielding barrier at 8.76, and both of them reached the level I range (8, 10). While escalator injury and fall injury are 7.17 and 6.93, which reached the level II range (6, 8). Among the lowest values, pinched by a shielding barrier is only 0.08, followed by a fall injury in the station at 1.36, crowded stampede at 1.37 and escalator injury at 1.72. These values all belong to the lowest risk-level range of Level V (0, 2).
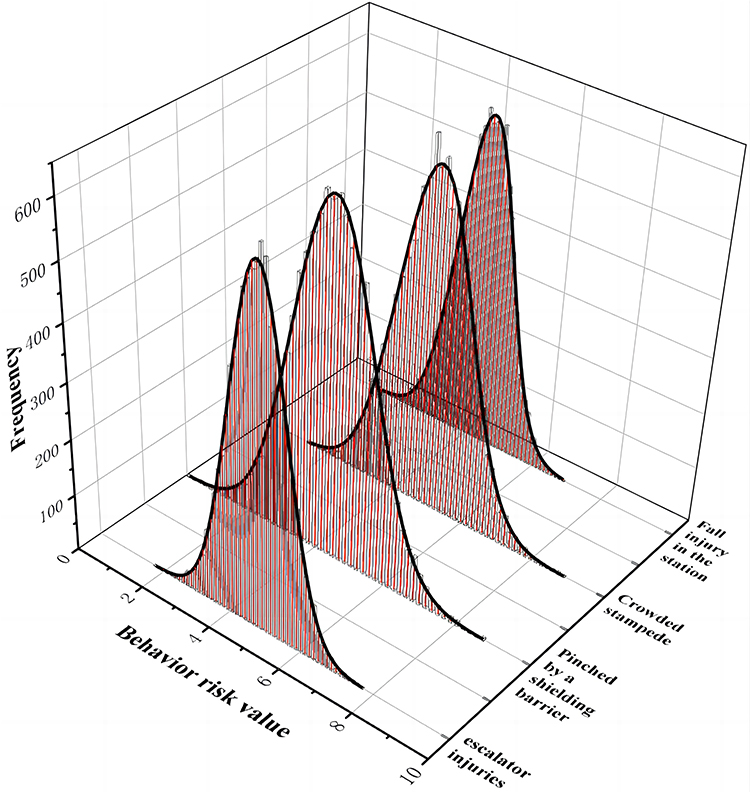 |
Figure 3 Box diagram of behavioral risk for each accident type. |
The cumulative probability of the total behavioral risk for each accident type is shown in Figure 4. It shows that there are obvious differences among the four accident types in each risk-level interval. In the interval (0, 2), the cumulative probabilities of the escalator injury, pinched by a shielding barrier, crowded stampede, and fall injury in the station are 0% to 0.04%, 0% to 2.10%, 0% to 0.21%, and 0% to 0.27%. In the interval (2, 4), the cumulative probabilities of these four accident types are 0.04% to 18.59%, 2.10% to 39.65%, 0.21% to 20.84%, and 0.33% to 40.92%. In the interval (4,6), the increases are 18.59% to 94.82%, 39.65% to 92.95%, 20.84% to 86.79% and 40.92% to 99.21%. When the cumulative probability reaches 100%, the total behavioral risk values of these 4 types of accidents are 7.65, 8.71, 8.82, and 6.85.
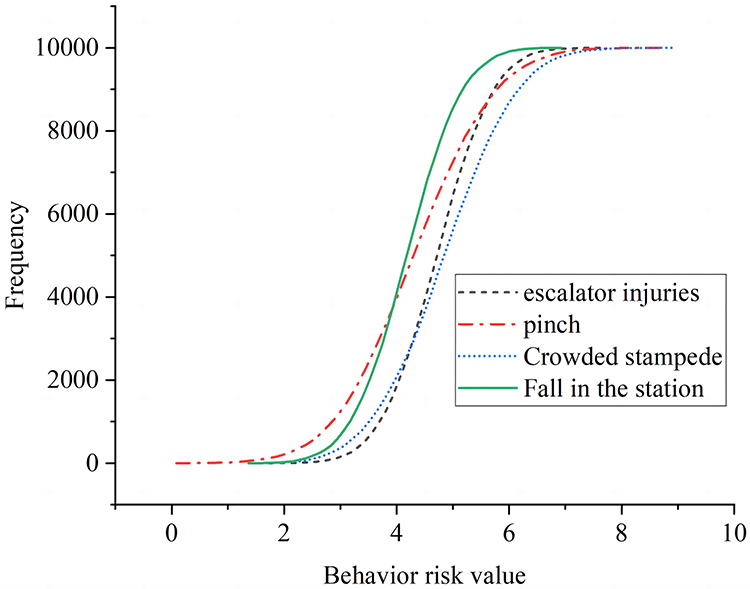 |
Figure 4 Cumulative probability of behavioral risk for each accident type. |
Sensitivity Analysis of Unsafe Behaviors to Each Accident Type
Spearman rank correlation coefficient method was used for sensitivity analysis to measure the influence of each unsafe behavior contributed to the total behavioral risk of each accident.32 The greater the sensitivity, the greater the impact of passengers’ unsafe behavior on the type of accident. The results of sensitivity analysis are shown in Figure 5.
 |
Figure 5 Sensitivity analysis of unsafe behaviors. |
Among the unsafe behaviors related to escalator injury, irregular behavior on escalators (A3) has the highest sensitivity of 59.3%, which is manifested that passenger did not grasp the handrails, did not pay attention to the stairs and so on. The sensitivity of performing additional tasks (A1) is 21.8%, as passengers carry luggage, play with mobile phones or communicate with others while taking the escalator. The sensitivity of children make trouble (A2) is 18.9%, and the main performances include children pressing the emergency button induced other passengers to fall down or children fall down by themselves due to disporting on the escalator.
As for pinched by a shielding barrier, going on board or alighting even after the door-closed alarm sounded has the highest sensitivity of 76.3%, indicating that this category of behavior contributes the most to being pinched when the metro shielding barrier is about to close. The sensitivity of carrying large baggage (B3) is 13.8%, due to it taking too much time to carry the baggage when getting on and off the train. The sensitivity of moving slowly (B2) is 9.9%, mainly happens to socially vulnerable groups such as elderly and disabled group being pinched and injured due to their inconvenient movement.
Among the unsafe behaviors related to crowded stampede in metro operation, the sensitivity of pushing each other (C1) is highest at 70.1%, mainly happens during the peak passenger flow for getting on and off the train in time. While spread of rumors (C3) is 22.5%, as spreading false news such as fires and terrorist attacks causing panic among passengers. The sensitivity of fighting (C2) is lowest at 7.3%, as sometimes a big fight is caused by a small friction.
About the fall injury in the station, the sensitivity of paying no attention to the ground (D2) is at 53.4%, due to using a mobile phone or other situations while walking. Taking prohibited things (D1) is at 27.4%, mainly refers to passengers bringing items such bicycles, pets and so on resulting in instability and fall. The sensitivity of littering (D3) is 19.2%, due to discarded garbage such as banana peelings causing other passengers to fall.
Discussion
Differences of Behavioral Risk Characteristics Related to Different Accident Types
From the obtained probability distributions of behavioral risks, we found that although the total behavioral risk of each accident type obeys normal distribution, there are differences in the parameter values of the distributions. Parameter values are the outcomes of statistical calculation from the 10,000 numerical simulation experiments, which quantitatively reflect the impact of behavioral uncertainty on the consequences of accidents. The reason for the differences is related to the uncertainty of both the behavior occurrence and consequence,14 which is first revealed by Monte Carlo simulation in the studies.
In terms of means (μ) seen in Figure 2, crowded stampede is the highest at 5.14, followed by escalator injury (4.72), pinched by a shielding barrier (4.42) and fall injury (4.14). The mean values are all in the range of (4, 6), indicating that the average risk degrees of each type of accident caused by the passengers’ unsafe behaviors are Moderate (level III).
However, it was found that although the average risks of the four accidents are at the same level, the highest risks are different. The highest value of crowded stampede (8.92) and pinched by a shielding barrier (8.76) reached the level I (Figure 3), while escalator injury (7.17) and fall injury (6.93) only reached level II (Figure 3). This shows that crowded stampede and pinched by a shielding barrier are more likely to lead to serious consequences than escalator injury and fall injury in the station.
This is also confirmed by the results of variance (σ2). The variances of pinched by a shielding barrier (1.29) and crowded stampede (1.08) are much higher than escalator injury (0.60) and fall injury (0.59), revealing the differences in the volatility of risks related to different accident types. The high volatility of crowded stampede is due to the consequence that this accident could be large or small. We also found an interesting phenomenon that the variance of pinched by a shielding barrier is higher than crowded stampede, which deviated from our original cognition. The expiration of this phenomenon may cost more time to recover from delay, which increases the severity of the consequence of pinched by a shielding barrier.
The cumulative probability of the four accident types shows little difference in the risk interval (0, 2). However, in the interval (2, 4), the cumulative probability of fall injury increases from 0.33% to 40.92%, and in (4, 6) from 40.92% to 99.21%, which indicates that the risk of fall injury accidents in the station is mostly in level V (low) or level III (moderate). Different from the fall injury, the cumulative probability of escalator injury increases from 18.59% to 94.82% only in the interval (4, 6). It could be interpreted that although the unsafe behaviors of the two accident types related to paying no attention to the stairs (A3) or ground (D2), the consequences on the escalator are more serious than on the ground.4 Therefore, the risk of escalator injury in level III (moderate) is much higher than the fall injury. At the end of the interval (4, 6), the cumulative probability of pinched by a shielding barrier and crowded stampede are 92.95% and 86.79%, which is also consistent with previous analysis of means and variances. It is concluded that there are differences in the probabilities in different risk levels of the four metro operation accidents caused by the multiple passengers’ unsafe behaviors, which should not be omitted for improving the pertinence of the risk mitigation countermeasures in metro operation.
Risk Mitigation Implications
In practical implications, the most recommended risk control measures of unsafe behaviors for metro safety interventions are to implement safety education,15,18 revise the metro safety regulation to increase the punishment of unsafe riding behaviors15,29 and split-flow during the peak period of metro traffic.33 However, these countermeasures treat all behaviors equally and do not consider both the risk characteristics of each accident and the contributions of each behavior to the accident types and risk levels, thus unable to provide more precise guidance for the targeted countermeasures.
Risk Mitigation Strategies Based on the Behavioral Risk Characteristics
From the macro perspective, risk mitigation strategy could be divided into three stages, which are pre-prevention, in-process control and emergency afterwards, according to the accident development process.34 Although countermeasures at all stages need to be considered for each accident type, some of them should be given priority according to the characteristics of the behavioral risks. Among pre-prevention measures, safety education is a prevalent finding in studies of passengers behavior correction,12,15,18 which is suggested firstly for the four accident types. The other risk mitigation strategies for different accident types are analyzed as below, and the comparison is shown schematically in Figure 6.
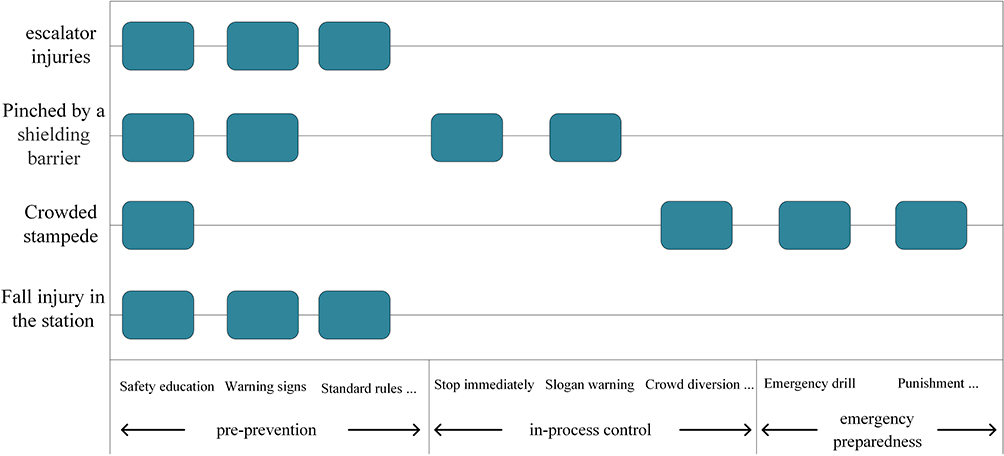 |
Figure 6 Risk mitigation strategy for each accident type. |
Since the total behavioral risk of escalator injury is concentrated in the interval (4, 6) (Figure 4), we called it “High frequency in medium risk” accident. The consequences of this accident are not particularly serious, but the frequency is supposed to be very high, which is consistent with the conclusion,35–37 thus the risk mitigation strategy should be focused on prevention in advance. Because the cumulative probability of crowded stampede is the highest in the interval (6, 10) (Figure 4), and its highest value of the total behavioral risk is at 8.92, we called it “Relative high frequency in high risk.” It is more likely to have serious consequences than other accidents, which may require more adequate emergency resources such as first medical aid deal with crush asphyxia or fracture, crowd evacuation, multi-authority co-operation, traffic evacuation outside the subway station and so on.38 The risk mitigation strategy should be focused on both prevention and emergency preparedness of this accident type. Although the highest risk value of pinched by a shielding barrier is at 8.76 (Figure 3), the cumulative probability is mainly concentrated in the interval (2, 6) (Figure 4), indicating that the severity of its consequence is widely distributed. We called it “Possible frequency in all risk.” Pre-prevention and in-process control measures are recommended for this type of accident. The risk of fall injury accidents is mostly in level V (low) and level III (moderate) (Figure 4), which was called “High frequency in relative low risk.” Preventive measures should be given priority when making risk mitigation decisions.
Safety Countermeasures for the Most High-Risk Behaviors
From the micro perspective, well-directed countermeasures for the high-risk behaviors under the corresponding risk strategy are very necessary for improving the capacity of risk prevention and response while saving resources. It was found that irregular behavior on escalator (A3), going on boarding or alighting even after the door-close alarm sounded (B1), pushing each other (C1) and paying no attention to the ground (D2) have the greatest impact on the total behavioral risks of each accident type (Figure 5). These four behaviors are supposed to be given priority. The other eight categories of behaviors have a relatively low effect on behavioral risks but should not be ignored.
According to the results of sensitivity analysis, irregular behavior on escalator (A3) has the greatest impact on the total behavioral risk of escalator injury. Studies have shown that 50% of passengers did not grab the handrails when riding on the escalator.9 In addition, Chi et al believed that the escalator injury was mainly caused by performing additional tasks,11 and 13% of 3270 people are slippery while carrying luggage on escalators, which is consistent with the sensitivity of behavior A1 in this study. We also found that children make trouble (A2) is contributed of 18.9% of escalator injury in metro operation. Warning signs and loudspeakers are suggested to be set around the escalator to remind passengers to pay attention to the most likely behaviors. This paper is in favor of revising the metro safety regulation to increase the punishment of irregular behaviors,17 as it has the highest sensitivity. It is also suggested that dynamic public service advertisements of metro safety regulation on the electronic screens in metro stations and the train carriages will play a better preventive effect than advertising board.
Among the unsafe behaviors that lead to stampede accidents, pushing each other (C1) has the greatest impact, followed by spreading rumors (C3) and fighting (C2). Wang analyzed the causative factors of metro stampedes and found that collision of crowd has the largest weight of 0.54, followed by passengers running suddenly of 0.15 and quarrel of 0.11.12,13 The ranking of the most causative factors is consistent with this study. The difference is that this study focused more on behaviors, which is more pre-test than causative factors. For instance, pushing each other (C1) may cause the conflict of crowd-flow and spreading rumors (C3) may lead passengers suddenly to run. Because the most influential behavior C1 mainly happens during peak times, the control of the maximum number of passengers allowed to enter the station as well as guide passengers through movable barriers are recommended among preventive measures.39–41 Emergency drill for stampede is also suggested, as it is an effective means to find out the problems of emergency preparedness, such as insufficient emergency resources, uncoordinated command, poor evacuation route and so on.
The total behavioral risk of pinched injury is mainly caused by passengers going on boarding or alighting even after the door-close alarm sounded (B1). Scholars have acknowledged the importance of arranging for staff to be on duty for the PSD and train doors of the metro operator.42 The elderly, children and passengers with luggage should be given the focus attention. Staff on duty can also help correct unsafe behaviors of other passengers in a timely manner.4 However, we found that even if there are staff on duty, serious accidents may still occur due to the uncertainty of staff’s ability to control the incident in-process. A typical case occurred recently in January 22, 2022 at Shanghai Metro Line 15 in China.43 In this case, the staff found an old woman was caught by the PSD in time, but his follow operational errors caused the old woman’s death. The accident process is shown in Figure 7. The three illustrations in Figure 7 represent the following from top to bottom: The subway staff pressed the emergency stop button, the staff pressed the manual stop button on the PSD. Staff attempted to pull the trapped person out of the PSD. If measures are taken in this order, passengers can be rescued. Conversely, if an attempt is made to pull out passengers first without sequentially braking the subway and closing the PSD, it can lead to an accident. In this case, due to the incorrect sequence of operations, the staff involved in this event caused a tragedy to occur. The case reflects the impact of the uncertainty of staff’s ability on the incident control in-process, which did not get enough attention before. It is suggested to carry out special education and emergency drill on pinched by a shielding barrier accident for staff on duty, which would help prevent and control this accident to reduce the total behavioral risk.
 |
Figure 7 The sequence in which employees take safety measures and their consequences. |
As the “High frequency in relative low risk” accident, fall injury in the station mainly happened by slipping due to water or other objects (eg banana peel) on the ground while walking without paying attention to the surroundings. Scholars12,15 proposed that the metro operator organize an efficient cleaning team and set up regulations to keep the ground clean. Strengthen security check to make sure passengers bring no prohibited items into the station is also believed to be effective.12,15 The author added that some special preventive measures should be considered in the rainy and snowy weather, such as increasing the frequency of ground cleaning, setting up anti-slip mats when necessary and so on.
To sum up, there are various passengers’ unsafe behaviors that lead to different metro operation accidents. Due to the uncertainty of both the behavior occurrence and the consequences caused by them, the total behavioral risks of the accidents exhibited different characteristics. When making risk mitigation decisions, we should consider both the risk characteristics of each accident and the contributions of each behavior to the accident types and risk levels for improving the science and pertinence of countermeasures.
Conclusions
In recent years, the research objects of passengers’ unsafe behaviors are mainly focused on the influencing factors leading to the behavior before it occurs, while they have not solved the relations of the behavior to the consequences or risks once it occurs. Thus, management experience with strong industry restrictions is not fully applicable to the metro operation with a high interrupted risk of passengers’ unsafe behaviors. In fact, due to the uncertainty of both behavior occurrence and its consequences, the high frequency of unsafe behavior does not mean that the accident caused by it is serious, which increased the challenges of risk mitigation in metro safety operation. Based on WBS-RBS, this study conducted 2-level risk identification, dealt with 234 subway operation accidents, and used Monte Carlo method to quantitatively analyze the passenger unsafe behavior risks related to different accident types and consequence severity.
The results revealed that although total behavioral risk of each accident type obeys normal distribution with means between (4, 6) in the Moderate risk level, the highest values of crowded stampede were at 8.92, followed by pinched by a shielding barrier at 8.76, and both of them reached the Very High risk level (8, 10). While escalator injury and fall injury are 7.17 and 6.93, which only reached the level II (6, 8). Besides, the variances of pinched by a shielding barrier (1.29) and crowded stampede (1.08) are much higher than escalator injury (0.60) and fall injury (0.59). Among the 12 categories of passengers’ unsafe behaviors, the top four contributors that resulted in the behavioral risks of the four accident types were irregular behavior on the escalator, go on boarding even after the door-close alarm sounded, push each other, and pay no attention to the ground. It was concluded that due to the uncertainty of the behavior occurrence and its consequences, there are differences of the probabilities in different risk levels of different accidents caused by the various passengers’ unsafe behaviors, which should not be omitted when making safety decisions for improving the pertinence and accuracy of countermeasures.
Targeted risk mitigation strategies and measures were clarified based on the behavioral risk characteristics in this study. Through the uses of the structured data set and the Monte Carlo algorithm, the accuracy of the judgment of the probability distribution in different risk degrees is improved, which can provide a basis for targeted risk mitigation strategies and measures. However, the detailed description and statistics of metro operation accidents caused by various passengers’ unsafe behaviors are still lacking at present. Although the author collected as many cases as possible, the A-D tested statistical parameters of the priori probabilities of the 12 category behaviors may have slight changes as the number of samples would be increasing in the future. It is suggested at last that both the detailed statistical work of metro operation accident and the research on the complexity of various unsafe behaviors and their relations to accident risk need to be strengthened in the future.
Data Accessibility
We confirm that all accessed data comply with relevant national data protection and privacy regulations and maintain the confidentiality of the subject data.
The datasets generated and/or analyzed during the current research process are derived from search engines and news reports, and the websites are as follows:
https://author.baidu.com/home?from=bjh_articleandapp_id=1572884549994693
https://author.baidu.com/home?from=bjh_articleandapp_id=1680604191501278
https://ctdsbepaper.hubeidaily.net/pc/column/202204/10/node_A01.html
https://ctdsbepaper.hubeidaily.net/pc/column/202204/10/node_A01.html
https://view.inews.qq.com/media/5215397?tbkt=D&uid=
Ethics
This study does not require review and approval from an institutional review board or ethics committee, because the data for this study were obtained from open web access, so we did not have to obtain informed consent.
Author Contributions
All authors made a significant contribution to the work reported, whether that is in the conception, study design, execution, acquisition of data, analysis and interpretation, or in all these areas; took part in drafting, revising or critically reviewing the article; gave final approval of the version to be published; have agreed on the journal to which the article has been submitted; and agree to be accountable for all aspects of the work.
Funding
General Project of National Natural Science Foundation of China (51874213); Natural Science Foundation of Hubei Province Youth Project (2018CFB186); Hubei Provincial Emergency Management Department Work Safety Special Project (KJZX201907011).
Disclosure
The authors report no financial and personal relationships with people or organizations that can inappropriately influence the work, there is no professional or other personal interest of any nature or kind in any product, service and/or company that could be construed as influencing the position presented in this work.
References
1. Xing Y, Dissanayake S, Lu J, Long S, Lou Y. An analysis of escalator-related injuries in metro stations in China, 2013–2015. Accid Anal Prev. 2017;122:332–341. doi:10.1016/j.aap.2017.10.007
2. Li Q, Song L, List GF, Deng Y, Zhou Z, Liu P. A new approach to understand metro operation safety by exploring metro operation hazard network (mohn). Saf Sci. 2017;93:50–61. doi:10.1016/j.ssci.2016.10.010
3. Xin W, Qiming L, Jingfeng Y. Critical path identification of subway operation delay events caused by abnormal passenger behavior. China Saf Sci J. 2014;09:152–158. doi:10.16265/j.cnki.issn1003-3033.2014.09.022
4. Wang K, Dong S. Research on cloud model for safety evaluation of rail transit vehicle system. China Saf Sci J. 2019;29(9):6. doi:10.16265/j.cnki.issn1003-3033.2019.09.008
5. Urban Rail Transit. Statistical and analysis report of urban rail transit in 2020. Available from: http://www.360doc.com/content/20/0510/15/1769761_911375257.shtml.
6. Bai SM, Sun HS, Zhao YC. Study of the safety evaluation of urban subway operation based on extenics. Adv Mat Res. 2014;919–921:878–882. doi:10.4028/www.scientific.net/AMR.919-921.878
7. Zhao JX, Wu DD, Wang MM. Subway operation safety evaluation based on iahp-entropy weight method. Inter for Energy Environ Sci Mater. 2018;5–10. doi:10.2991/ifeesm-17.2018.10
8. Wang Z, Huang S, Wang J, Sulaj D, Kuang A. Risk factors affecting crash injury severity for different groups of e-bike riders: a classification tree-based logistic regression model. J Safety Res. 2020;76:3. doi:10.1016/j.jsr.2020.12.009
9. Chi CF, Chang TC, Tsou CL. In-depth investigation of escalator riding accidents in heavy capacity MRT stations. Accid Anal Prev. 2006;38(4):662–670. doi:10.1016/j.aap.2005.12.010
10. Qi-quan W. Evaluation of emergency linkage system for subway congestion and stampede accident based on hierarchical correlation coefficient method. China Saf Sci J. 2018;06:70–75. doi:10.11731/j.issn.1673-193x.2018.06.011
11. Qiquan W. Research on subway congestion and stampede accident risk based on weighted correlation algorithm. China Saf Sci J. 2013;05:94–100. doi:10.16265/j.cnki.issn1003-3033.2013.05.007.CNKI:SUN:ZAQK.0.2013-05-018
12. Tong R, Li H, Zhang B, Yang X, Ma X. Modeling of unsafe behavior risk assessment: a case study of Chinese furniture manufacturers. Saf Sci. 2021;136(3):105157. doi:10.1016/j.ssci.2020.105157
13. Ruipeng T, Xiaofei M. Risk assessment of unsafe behavior of furniture manufacturing workers based on Monte Carlo method. China Saf Sci J. 2018;07:187–192. doi:10.1016/j.ssci.2020.105157
14. Yan L, Tong W. Analysis of passenger factors in the risk of subway operation accidents.
15. Xie K, Liu Z. Factors influencing escalator-related incidents in China: a systematic analysis using ism-dematel method. Int J Environ Res Public Health. 2019;16(14):2478. doi:10.3390/ijerph16142478
16. Xing Y, Chen S, Zhu S, et al. Analysis factors that influence escalator-related injuries in metro stations based on bayesian networks: a case study in China. Int J Environ Res Public Health. 2020;17(2):481. doi:10.3390/ijerph17020481
17. Wang QK, Zhu K, Wang JW, et al. Review on knowledge visualization of engineering project risk management literature. China Saf Sci J. 2021;31(7):15–23.
18. Zhang GD, Xue YG, Bai CH, et al. Risk assessment of floor water inrush in coal mines based on MFIM-TOPSIS variable weight model. J Cent South Univ. 2021;28(8):2360–2374. doi:10.1007/s11771-021-4775-x
19. Rubing W, Xin W, Peng M, Dezhi L, Xiang W. fsQCA on the correlation between passenger unsafe behavior and subway accidents. China Saf Sci J. 2020;07:152–158. doi:10.16265/j.cnki.issn1003
20. Li H, Wang Y, Xing Y, Zhao X, Wang K. Contributing factors affecting the severity of metro escalator injuries in the Guangzhou metro, China. Int J Environ Res Public Health. 2021;18(2):651. doi:10.3390/ijerph18020651
21. Zhongji X. Monte Carlo Method. Shanghai: Shanghai Science and Technology Press; 1985.
22. Belhumeur PN, Hespanha JP, Kriegman DJ. Eigenfaces vs. Fisherfaces: recognition using class specific linear projection. IEEE Trans Pattern Anal Mach Intell. 1997;19(7):711–720. doi:10.1109/34.598228
23. Cho J, Kim Y, Kim J, Park J, Kim DS. Realistic estimation of human error probability through monte carlo thermal-hydraulic simulation. Reliab Eng Syst Saf. 2020;193:
24. Zhao Y, Lu T, Li M, Tian L. The self-slowing behavioral mechanism of pedestrians under normal and emergency conditions. Phys Lett A. 2017;381(37):3149–3160. doi:10.1016/j.physleta.2017.08.014
25. Lian L, Mai X, Song W, Richard Y, Rui Y, Jin S. Pedestrian merging behavior analysis: an experimental study. Fire Saf J. 2017;91:918–925. doi:10.1016/j.firesaf.2017.04.015
26. Xie K, Mei Y, Gui P, Liu Y. Early-warning analysis of crowd stampede in metro station commercial area based on internet of things. Multimed Tools Appl. 2018;78:30141–30157. doi:10.1007/s11042-018-6982-5
27. Almeida MMD, Schreeb JV. Human stampedes: an updated review of current literature. Prehosp Disaster Med. 2019. doi:10.1017/S1049023X18001073
28. Shiwakoti N, Tay R, Stasinopoulos P, Woolley PJ. Likely behaviours of passengers under emergency evacuation in train station. Saf Sci. 2017;91:40–48. doi:10.1016/j.ssci.2016.07.017
29. Schminke L, Jeger V, Evangelopoulos D, Zimmerman H, Exadaktylos A. Riding the escalator: how dangerous is it really? West J Emerg Med. 2013;14(2):141–145. PMID: 23599850; PMCID: PMC3628462. doi:10.5811/westjem.2012.12.13346
30. Office of the State Council. National emergency plan for urban rail transit operation emergencies. Available from: http://www.gov.cn/zhengce/content/2015-05/14/content_9751.htm.
31. Jian S, Yang Y. Research on emergency system of urban rail transit. Urban Rail Transit Res. 2009;09:7–9. doi:10.3969/j.issn.1007-869X.2009.09.003
32. Xingyou Z, Holt JB, Shumei Y, Hua L, Greenlund KJ, Croft JB. Validation of multilevel regression and poststratification methodology for small area estimation of health indicators from the behavioral risk factor surveillance system. Am J Epidemiol. 2015;2:127. doi:10.1093/aje/kwv002
33. Ca A, Raa B. Human behavior modeling for simulating evacuation of buildings during emergencies. Physica a Stat Mech Appl. 2019;528. doi:10.1016/j.physa.2019.121432
34. Jian R, Wmg A, Yby B. Emergency evacuation risk assessment and mitigation strategy for a toxic gas leak in an underground space: the case of a subway station in Guangzhou, China - ScienceDirect. Saf Sci. 2020;134. doi:10.1016/j.ssci.2020.105039
35. Alhadhira A, Molloy MS, Casasola M, Sarin RR, Ciottone GR. Use of dimensional analysis in the x-, y-, and z-axis to predict occurrence of injury in human stampede. Disaster Med Public Health Prep. 2019;14(2):1–8. doi:10.1017/dmp.2019.47
36. Jiao Z, Lei H, Zong H, Cai Y, Zhong Z. Potential escalator-related injury identification and prevention based on multi-module integrated system for public health. Mach Vis Appl. 2022;33(2):1–12. doi:10.1007/s00138-022-01273-2
37. Cirilli A, Schera L. Escalator injuries in the pediatric population: a case study. J Pediatr Surg Nurs. 2018;7(3):105–106. doi:10.1097/JPS.0000000000000186
38. Koski A, Kouvonen A, Nordquist H. Preparedness for mass gatherings: planning elements identified through the Delphi process. Int J Disaster Risk Reduct. 2021;61:102368. doi:10.1016/j.ijdrr.2021.102368
39. Santos-Reyes J, Olmos-Pe?A S. Analysis of the ‘news divine’ stampede disaster. Saf Sci. 2017;91:11–23. doi:10.1016/j.ssci.2016.07.014
40. Illiyas FT, Mani SK, Pradeepkumar AP, Mohan K. Human stampedes during religious festivals: a comparative review of mass gathering emergencies in India. Int J Disaster Risk Reduct. 2013;5:10–18. doi:10.1016/j.ijdrr.2013.09.003
41. Alkhadim M, Gidado K, Painting N. Perceived crowd safety in large space buildings: the confirmatory factor analysis of perceived risk variables. J Eng Proj Prod Manag. 2018;8(1):22–39. doi:10.1016/j.ssci.2018.04.021
42. He L, Liang Q, Fang S. Challenges and innovative solutions in urban rail transit network operations and management: China’s Guangzhou metro experience. Urban Rail Transit. 2016;2(1):33–45. doi:10.1007/s40864-016-0036-y
43. Shanghai passenger tragically died after being trapped in subway screen door; 2022. Available from: https://new.qq.com/omn/20220217/20220217A06N7X00.html.
 © 2023 The Author(s). This work is published and licensed by Dove Medical Press Limited. The
full terms of this license are available at https://www.dovepress.com/terms
and incorporate the Creative Commons Attribution
- Non Commercial (unported, 3.0) License.
By accessing the work you hereby accept the Terms. Non-commercial uses of the work are permitted
without any further permission from Dove Medical Press Limited, provided the work is properly
attributed. For permission for commercial use of this work, please see paragraphs 4.2 and 5 of our Terms.
© 2023 The Author(s). This work is published and licensed by Dove Medical Press Limited. The
full terms of this license are available at https://www.dovepress.com/terms
and incorporate the Creative Commons Attribution
- Non Commercial (unported, 3.0) License.
By accessing the work you hereby accept the Terms. Non-commercial uses of the work are permitted
without any further permission from Dove Medical Press Limited, provided the work is properly
attributed. For permission for commercial use of this work, please see paragraphs 4.2 and 5 of our Terms.