")
Back to Journals » Diabetes, Metabolic Syndrome and Obesity » Volume 13
Resting Whole Body Energy Metabolism in Class 3 Obesity; from Preserved Insulin Sensitivity to Overt Type 2 Diabetes
Authors Manzoni G, Oltolini A, Perra S, Muraca E , Ciardullo S , Pizzi M , Castoldi G , Lattuada G , Pizzi P, Perseghin G
Received 22 August 2019
Accepted for publication 22 January 2020
Published 24 February 2020 Volume 2020:13 Pages 489—497
DOI https://doi.org/10.2147/DMSO.S228229
Checked for plagiarism Yes
Review by Single anonymous peer review
Peer reviewer comments 3
Editor who approved publication: Dr Konstantinos Tziomalos
Giuseppina Manzoni,1 Alice Oltolini,1 Silvia Perra,1 Emanuele Muraca,1 Stefano Ciardullo,1,2 Mattia Pizzi,3 Giovanna Castoldi,2 Guido Lattuada,1 Pietro Pizzi,3 Gianluca Perseghin1,2
1Department of Medicine and Rehabilitation, Policlinico di Monza, Monza, Italy; 2Department of Medicine and Surgery, Università Degli Studi di Milano Bicocca, Monza, Italy; 3Centre for Obesity Research, Policlinico di Monza, Monza, Italy
Correspondence: Gianluca Perseghin
Department of Medicine and Rehabilitation, Policlinico di Monza, Via Modigliani 10, Monza, MB 20900, Italy
Tel +39 039 281 0430
Email [email protected]
Context: Insulin resistance and diabetes may influence separately or in combination whole body energy metabolism.
Objective: To assess the impact of insulin resistance and/or overt type 2 diabetes on resting energy expenditure (REE) in class 3 obese individuals.
Design and Setting: Retrospective, cross-sectional analysis of a set of data about individuals attending the outpatients service of a single center of bariatric surgery between January 2015 and December 2017.
Patients: We screened 382 patients in which abnormal thyroid function was excluded, and segregated them in three groups of subjects: patients with type 2 diabetes (T2DM; n=70), non-diabetic insulin-resistant patients with HOMA-IR ≥ 3 (n=236), non-diabetic insulin-sensitive patients with HOMA-IR < 3 (n=75).
Main Outcome Measure: Resting energy expenditure (REE), body composition and insulin resistance assessed using indirect calorimetry, bioimpedance and HOMA-IR.
Results: Non-diabetic insulin-sensitive patients resulted to be younger, with lower BMI and higher prevalence of female subjects; meanwhile, non-diabetic but insulin-resistant patients and T2DM patients were not different in terms of anthropometric parameters. REE was higher in T2DM than in non-diabetic insulin-resistant and insulin-sensitive individuals when expressed as percent of the predicted REE (based on Harris Benedict equation) (p< 0.0001) or when adjusted for kg of free fat mass (p< 0.0001) and was found to be higher also in insulin-resistant vs insulin-sensitive patients (p< 0.001). The respiratory quotient was different between groups (0.87± 0.11, 0.86± 0.12 and 0.91± 0.14 in T2DM, insulin-resistant and insulin-sensitive patients, respectively; p< 0.03). Regression analysis confirmed that HOMA-IR was independently associated with the REE (R2=0.110, p< 0.001).
Conclusion: Class 3 obese patients with normal insulin sensitivity are characterized by reduced fasting REE in comparison to insulin-resistant obese patients and obese patients with short duration of diabetes supporting the hypothesis that down-regulation of nutrients’ oxidative disposal may represent an adaptation of energy metabolism in obese individuals with preserved insulin sensitivity.
Keywords: indirect calorimetry, insulin resistance, energy expenditure, bariatric surgery, respiratory quotient
Introduction
Overweight and obese individuals present a typical set of cardio-metabolic complications, including diabetes, hypertension, dyslipidaemia and insulin resistance most often in association with visceral adiposity.1 Not all obese individuals develop these deleterious features2,3 and it is a matter of debate whether this phenotype could bear important prognostic implications which may determine a different approach in handling, in a clinical setting, these subjects.4 In addition, obese individuals with preserved insulin sensitivity may be considered a model for better understanding of the pathogenesis of insulin resistance.5 For this reason, much research has been devoted to understand the underlying mechanisms that provide protection from the manifestation of the unfavorable metabolic abnormalities of the insulin-resistance syndrome.5–7 Based on epidemiologic evidence, it was proposed that favorable metabolic profile could be related to the ability to adapt to the excessive calorie intake avoiding re-esterification of energy within ectopic sites, and in particular the liver.8 Under this line of thinking Fabbrini et al9 demonstrated using mechanistic studies that obese but insulin-sensitive individuals are able to promptly stimulate several biological pathways and genes related to lipid synthesis in the adipose tissue under the condition of experimental overfeeding protecting them from the weight gain–induced metabolic deleterious abnormalities. Whether these individuals are able to trigger adaptive mechanisms modulating also substrates oxidative disposal remains unknown and our work represents an effort in this direction. Therefore, to test this working hypothesis we analyzed in a retrospective fashion the resting energy expenditure (REE) of class 3 obese individuals in the waiting list for bariatric surgery in relation to the severity of their insulin resistance and glucose tolerance state.
Materials and Methods
During the period January 1, 2015–December 31, 2017, 546 obese patients were screened at Policlinico di Monza to establish an indication to an intervention of bariatric surgery. Screening procedures were performed following an internal protocol inspired by the recommendations of the Società Italiana di Chirurgia dell’Obesità e delle Malattie Metaboliche (SICOB),10 consisting of visits with an expert endocrinologist and eventually a diabetologist, meetings with dietitians, and psychologist (alone and/or in educational groups), blood tests and questionnaires related to habitual physical activity, nutritional habits and psychologic profiling. The protocol also included the assessment of REE using indirect calorimetry following and overnight fast period and body composition using BIA as a routine assessment. Criteria of exclusion from the analysis were considered conditions with a potential recognized impact on the REE such as thyroid disease. Also, patients evaluated for a re-do surgical procedure (all patients with gastric banding and under evaluation for a potential intervention of sleeve-gastrectomy or mini-gastric by-pass) were excluded for the same reasons. Finally, 36 patients were excluded because of missing data or indirect calorimetry, BIA and laboratory testing performed elsewhere (Figure 1).
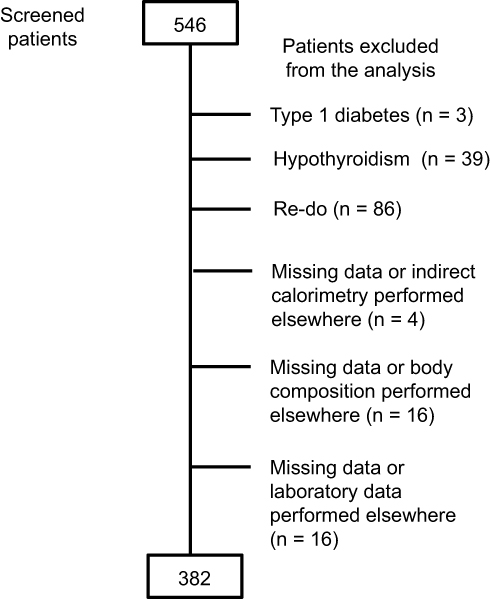 |
Figure 1 Diagram of the flow of participants. Notes: In total, 546 obese patients were screened to establish the indication for bariatric surgery and were originally considered for the analysis. Patients with type 1 diabetes, hypothyroidism (known and accidentally discovered during the screening procedures) as well as patients with a previous intervention of bariatric surgery (gastric banding) were excluded because of the potential impact on resting energy expenditure. Thirty-six patients were excluded because of missing data or indirect calorimetry, BIA and laboratory testing performed elsewhere. |
Study Subjects
The retrospective analysis reported in this work included therefore 382 patients with BMI > 40 kg/m2 or BMI > 35 kg/m2 and an obesity-related complication (type 2 diabetes, hypertension, sleep apnea syndrome, acid reflux disease, arthropathy) who were segregated in patients with T2DM (n=70) and, depending on the calculated HOMA-IR, in insulin-sensitive obese patients (HOMA-IR < 3; n=75) and insulin-resistant obese patients (HOMA-IR ≥ 3; n=237). The threshold value of HOMA-IR higher than 3.0 was chosen because it was reported to identify the highest quartile among populations without diabetes.11 Clinical features of these individuals are summarized in Table 1. The protocol was approved by the Comitato Etico della Provincia di Monza e Brianza. Patients gave informed written consent after explanation of the purpose of the collection and analysis of the set of data.
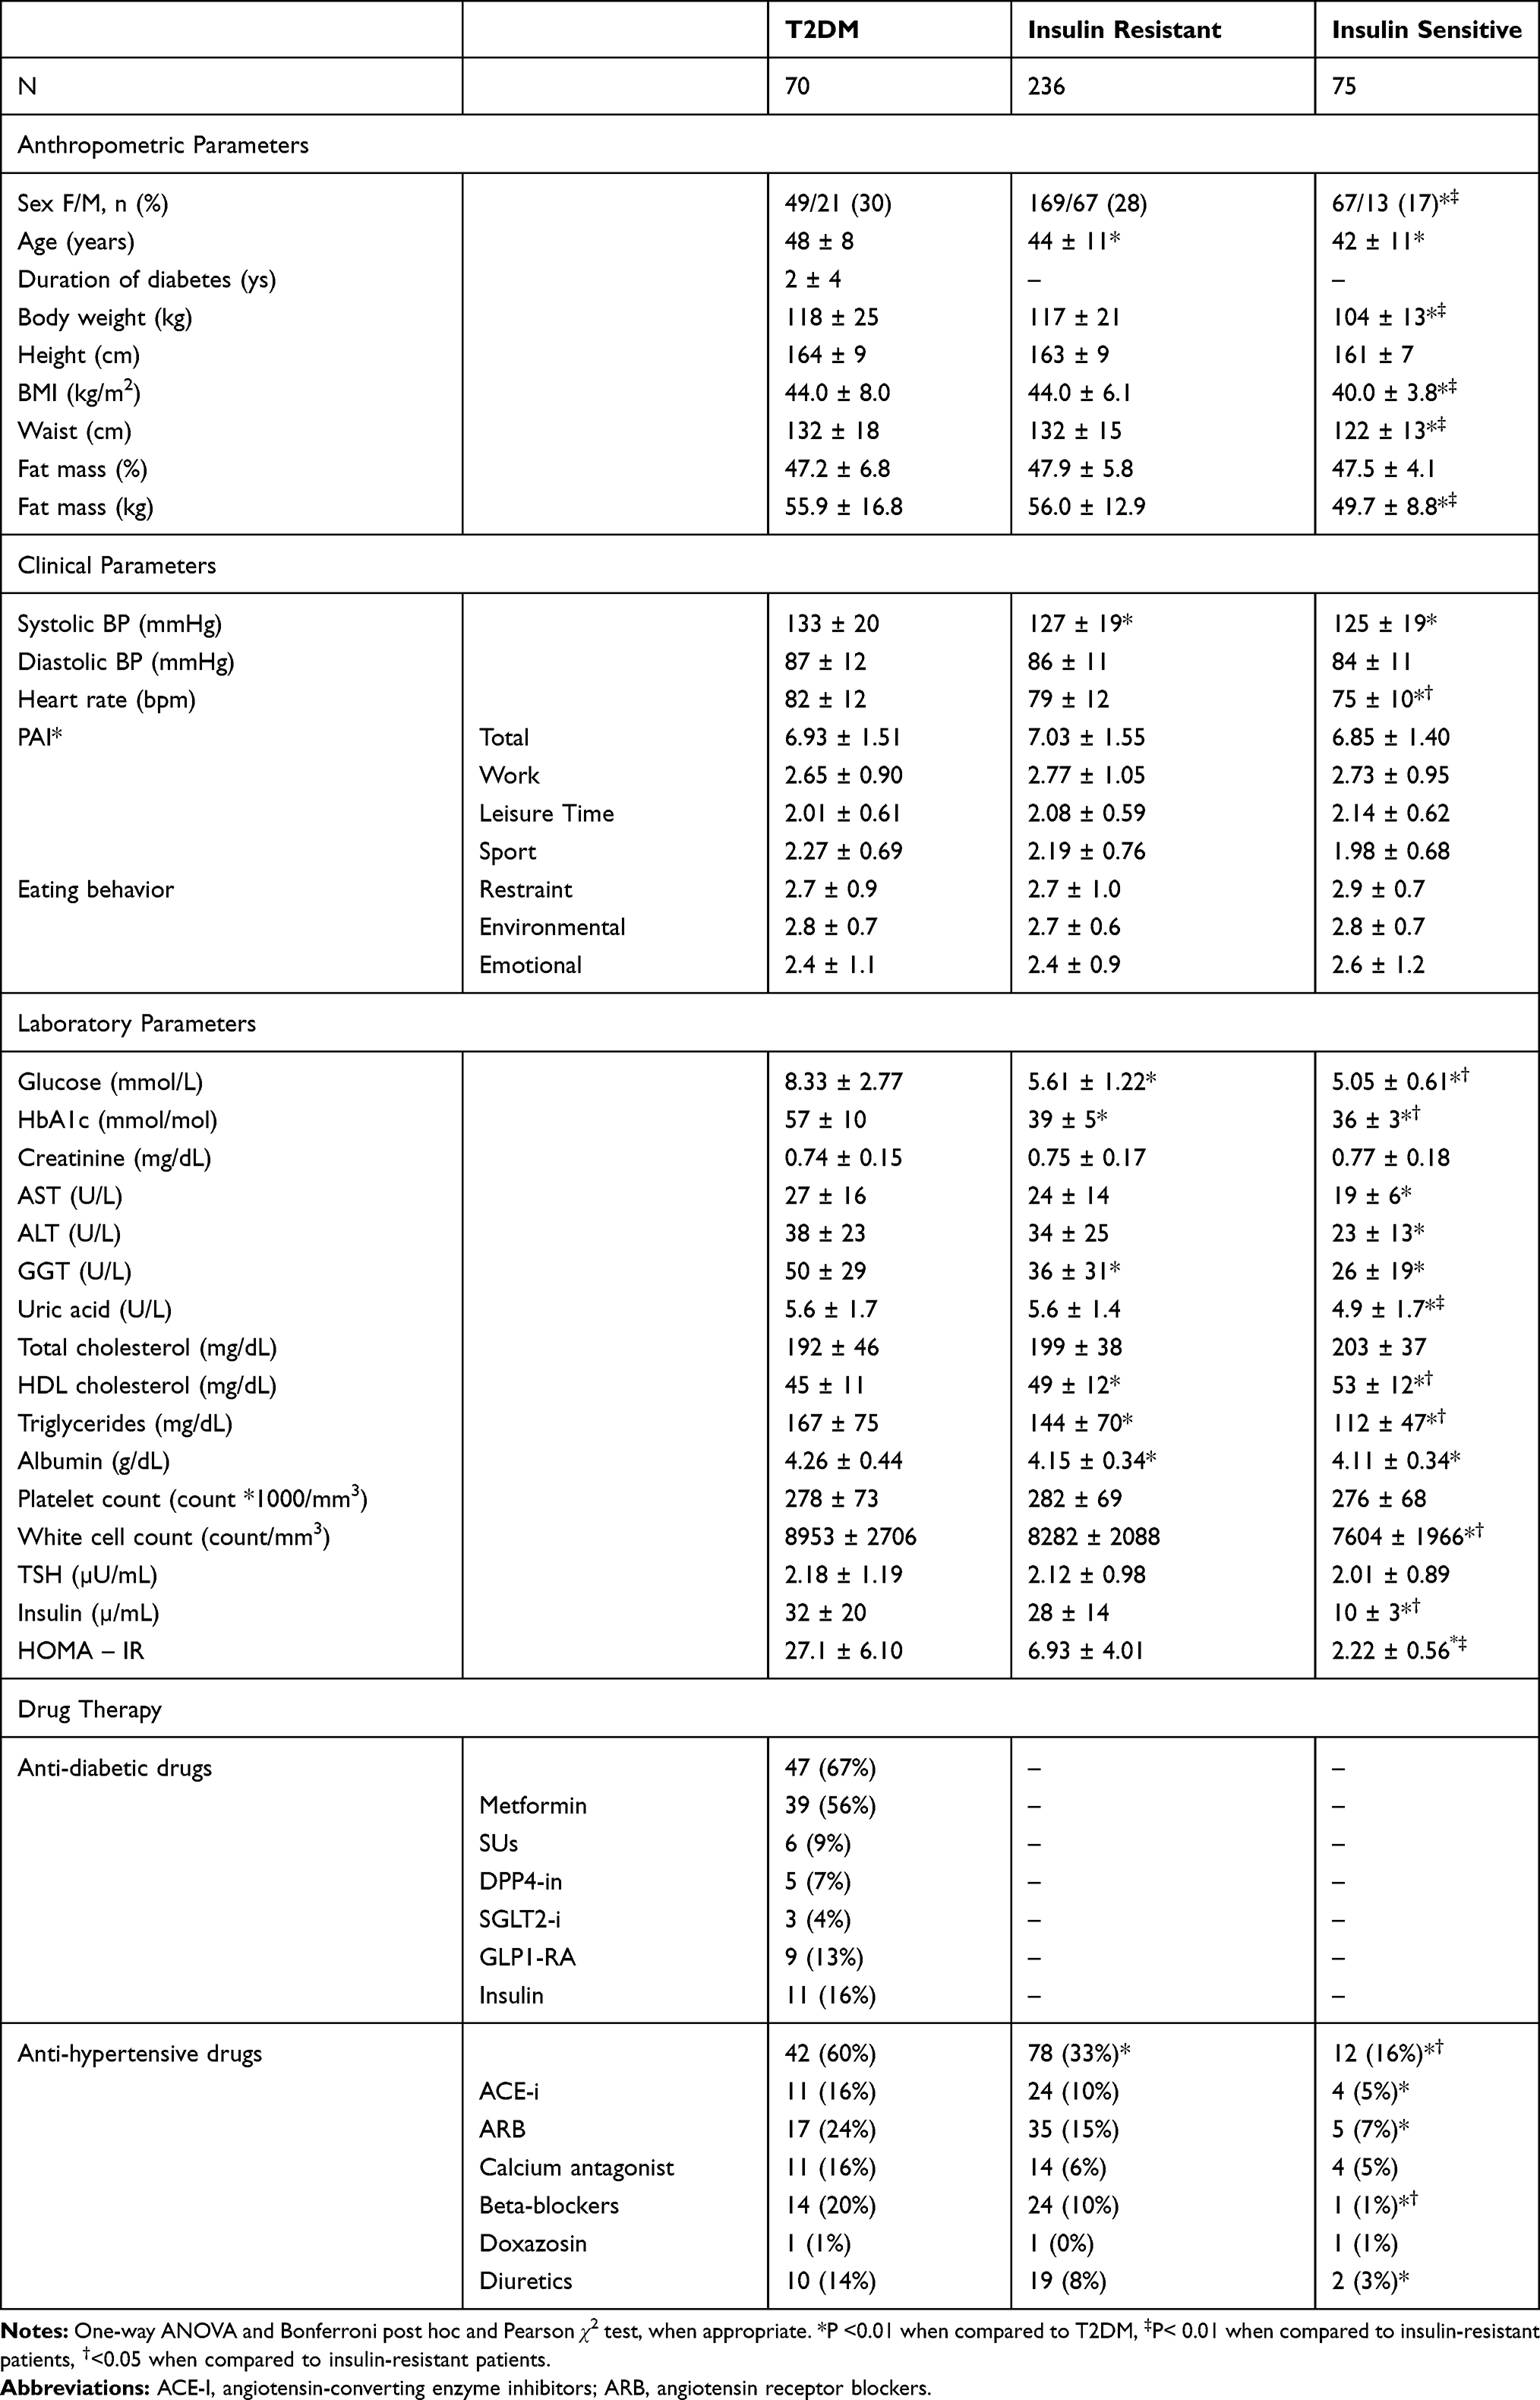 |
Table 1 Anthropometric, Clinical and Laboratory Features of Study Subjects |
Analytical Assessments
Body weight (kg), height (cm), waist circumference (cm), family history of metabolic diseases, and personal history of previous diseases were established at screening visits. Diabetes was defined as an active anti-hyperglycemic drug therapy or the finding of Hemoglobin A1c > 6.5% at the screening visit. Heart rate and blood pressure were also recorded at rest conditions. Blood samples and 24 hr urine collection were obtained to assess the nutritional status, thyroid, adrenal, liver, and kidney function along with the lipid profile, fasting plasma glucose and insulin, hemoglobin A1c.
Habitual Physical Activity and Nutritional Habits
Questionnaires related to habitual physical activity12,13 and eating behavior (Dutch Eating Behavior Questionnaire DEBQ)14 were obtained.
Indirect Calorimetry
Patients were instructed to consume an iso-caloric diet containing at least 250 g of carbohydrates and 70–90 g protein per day and to abstain from exercise activity for 3 days before recording REE. These subjects were admitted to the Outpatient Service of the Department of Medicine and Rehabilitation at Policlinico di Monza at 07:30–08:00 am after a 10-hr overnight fast period and the following procedures were performed.
After lying quietly for 30 min, REE was measured by continuous indirect calorimetry with a ventilated hood system (Sensor Medics 2900, Metabolic Measurement Cart) performed for 45 min as previously described.15 The mean coefficient of variation (CV) within the session for both O2 (1.6±0.2%) and CO2 (1.9±0.3%) measurements were below 2% with ranges of 0.3–4.8% and 0.4–5.6% for VO2 and VCO2, respectively.
Body Composition
An estimate of body fat mass was obtained after the overnight fasting period using leg-to-leg TANITA SC-240 MA Body Composition Analyzer (TANITA, Japan). Patients were asked to stand on the Body Composition Analyzer with bare feet, remove all the accessories, and make sure there was no metal in the body. Body composition was measured by the prediction equations of the manufacturer within the Analyzer.
Calculations
BMI was calculated as weight in kilograms divided by the square of height in meters. REE was calculated by the Weir’s standard equation16 from the oxygen consumption rate and the carbon dioxide production rate measured by means of indirect calorimetry (excluding the first 10 min of data acquisition). Predicted REE was calculated using the Harris-Benedict equations.17 HOMA-IR was calculated as previously described.18
Statistical Analysis
Data are expressed as means±1 standard deviation for continuous variables or as numbers and percentages for categorical variables. Analysis was performed using the SPSS software (version 20.0; SPSS, Chicago, IL). Normal distribution was assessed by the d’Agostino D-normality test19 and skewed data were properly transformed before the analysis (cardiac frequency, HDL-cholesterol, triglycerides, insulin, HOMA-IR, DEBQ emotional, RQ, TSH, REE per Kg free fat mass). Levene’s test was performed to assess the equality of variance. A comparison of variables between groups was performed using One-Way ANOVA and Bonferroni post hoc test. Categorical variable was compared using Pearson χ2 test. To control for possible effects of other continuous variables, ANCOVA was performed, in addition, the relationship between REE and HOMA-IR was examined by two-tailed Pearson’s correlation coefficients; partial correlation was used to examine these relationships independently of age, sex, BMI and PAI. To ascertain how important the relative contribution of these variables was to predict REE in our population, we used stepwise regression analysis (using F ratio-to-remove of 4 and F ratio-to-enter of 3.996). A p-value of 0.05 was considered to be significant.
Results
Anthropometric and Metabolic Features
The prevalence of preserved insulin sensitivity in this cohort of class 3 obese patients was 13.7%. Anthropometric and laboratory characteristics of the study subjects are summarized in Table 1. The prevalence of female subjects was higher among insulin-sensitive than in insulin-resistant and T2DM patients (Table 1) and insulin-sensitive patients were younger and with lower BMI, waist circumference and body fat content even if percent body fat was not different between groups (Table 1). In patients with diabetes, the duration of the disease was rather short (Table 1); 47 patients (67%) were on anti-hyperglycemic drug treatment (Table 1), 7 were engaged with a life-style intervention program only and 16 received the diagnosis of diabetes during the screening procedures. Estimates of total physical activity were not different between groups (Table 1) as well as parameters related to eating behavior. Systolic blood pressure, but not diastolic blood pressure, was higher in patients with type 2 diabetes when compared to both insulin-resistant and insulin-sensitive patients in spite of a higher proportion of patients taking anti-hypertensive drug therapy (60% vs 33% and 16%, respectively; Table 1). Heart rate was higher in T2DM in comparison with the two non-diabetic subgroups and higher in insulin-resistant than in insulin-sensitive patients (P < 0.05; Table 1). Biochemical parameters related to glucose metabolism were different between groups: T2DM patients had higher fasting plasma glucose and HbA1c. Lipid profile was also different with higher levels of serum triglycerides and lower levels of HDL-cholesterol in patients with T2DM when compared to both insulin-resistant and insulin-sensitive patients (Table 1) in spite of a higher proportion of patients undergoing anti-lipid drugs (26% vs 7% and 3%, respectively) and in turn, these parameters were also different in the two non-diabetic subgroups (Table 1). Non-classical biomarkers of the metabolic syndrome such as uric acid, white cell count and liver function tests (AST, ALT and GGT) were higher in T2DM patients when compared to the two non-diabetic subgroups, and GGT and white cells count were higher in insulin-resistant in comparison with insulin-sensitive patients (Table 1). Renal function was preserved in all study subjects and serum creatinine was not different between groups. TSH as a marker of thyroid function was not different between groups. Fasting plasma insulin and HOMA-IR were higher in T2DM than in the two non-diabetic subgroups of patients and they were lower in insulin-sensitive patients by definition (segregation based on pre-established HOMA-IR) when compared with insulin-resistant patients (Table 1).
Whole Body Energy Metabolism
REE
T2DM patients had higher absolute REE (1960±444 Kcal/day) when compared to both insulin-resistant (1836±402 Kcal/day; p<0.0001) and insulin-sensitive patients (1558±223 Kcal/day; p<0.0001) and the insulin-resistant individuals had higher REE when compared to the insulin-sensitive subjects (p<0.001). Due to the lower BMI observed in the insulin-sensitive subjects, REE was adjusted for the Kg of free fat mass and the difference between groups remained highly significant (32.2±4.5, 30.3±3.7 and 28.9±3.3 Kcal/kg of free fat mass/day in T2DM, insulin-resistant and insulin-sensitive patients, respectively; P<0.0001) (Figure 2 left panel). In addition, due to the lower proportion of male individuals within the insulin-sensitive patents and their younger age, REE was also adjusted for the predicted REE calculated using the Harris-Benedict equation which is based on sex, age, body mass, height and ethnic group confirming the difference among groups (99±11%, 93±12% and 88±8% in T2DM, insulin-resistant and insulin-sensitive subjects, respectively; P<0.0001) (Figure 2 right panel).
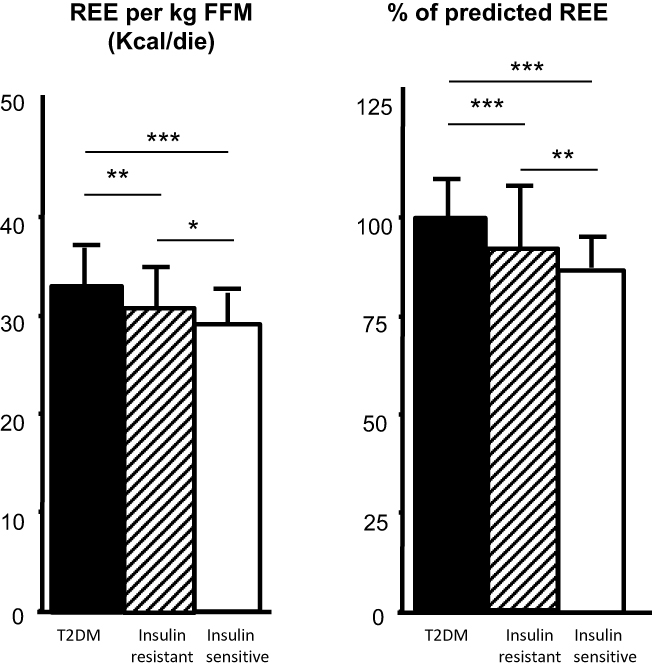 |
Figure 2 Resting energy expenditure (REE). Notes: REE is expressed as corrected by kg of free fat mass (FFM) (left panel) and as relative percent value when compared to the predicted value according to Harris Benedict equation (right panel). *P < 0.05; **P < 0.001; ***P < 0.0001; one-way ANOVA and Bonferroni post hoc. |
REE, Correlation and Regression Analysis
To further test the hypothesis that the REE was associated with insulin resistance, we performed correlation analysis, adjusted correlation analysis and stepwise regression analysis controlling for age, BMI, estimated level of physical activity and sex showing that REE adjusted for the Kg of free fat mass was independently associated with HOMA-IR (Table 2). It was reported that there is a seasonal (summer vs winter) variation in REE20 which was confirmed in our set of data (30.2±3.4, 28.7±3.2, 30.1±4.1, 30.6±3.5 Kcal/kg free fat mass/day, respectively, in spring, summer, autumn and winter; P<0.05). Therefore, we controlled whether the proportions of patients were unbalanced by seasonality and found there was no difference in summer (18%, 22%, 18%; P=0.87) and in winter (20%, 22%, 20%; P=0.91) in patients with T2DM, in insulin-resistant obese subjects and in insulin-sensitive obese subjects, respectively. In spite of the lack of difference in seasonality distribution the correlation analysis was performed also controlling for a season-related categorical variable (spring, summer, autumn and winter) but no impact could be detected.
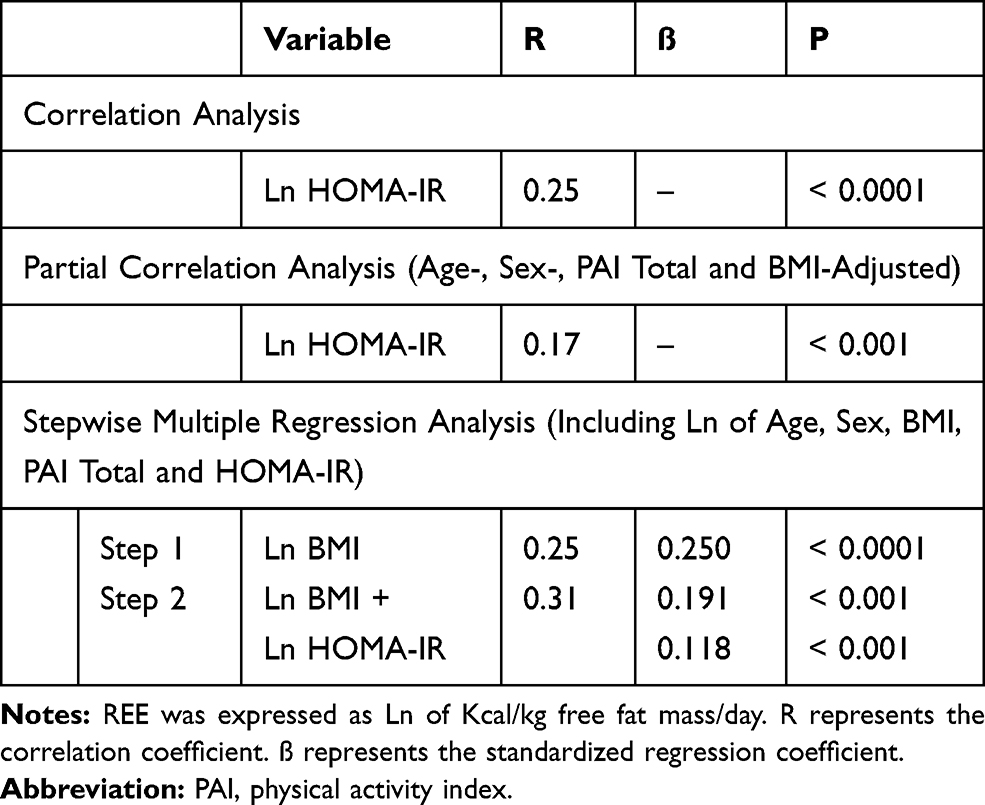 |
Table 2 Results of the Correlation and Multiple Regression Analysis Between REE and HOMA-IR |
Respiratory Quotient
Patients with T2DM (0.87±0.11) and insulin-resistance (0.86±0.12) had significantly lower RQ when compared with insulin-sensitive subjects (0.91±0.14; P < 0.03). No correlation could be detected between the RQ and HOMA-IR.
Discussion
The reason why a proportion of obese individuals are not characterized by the typical obesity-related unfavorable metabolic profile remains obscure.8 In this work, we wanted to test the hypothesis whether the long-lasting, chronic excessive calorie intake in our severely obese patients could be associated with a different whole body energy metabolism in those with preservation of insulin sensitivity, when compared to those with insulin-resistance and overt T2DM. We confirmed this hypothesis detecting a reduced fasting REE in patients with preserved insulin sensitivity in comparison with the insulin-resistant counterpart and T2DM patients (Figure 2) which was further supported by the independent direct relationship between fasting REE and HOMA-IR (Table 2).
Our cross-sectional observation is in agreement with data generated during longitudinal studies showing that class 3 obese patients with normal insulin sensitivity more promptly stimulated anabolic pathways, and in particular the lipid synthesis at the level of the adipose tissue when overfed for a short period of time when compared to insulin-resistant obese subjects.9 Our data add on these findings suggesting that an additional feature of the preservation of insulin sensitivity is to rely less on catabolic pathways of substrates disposal. In fact, subjects with normal insulin sensitivity showed not only lower REE rates but also relatively lower lipid, when compared to carbohydrate, oxidative disposal as reflected by the higher RQ. Our interpretation of the results is that the reduced REE should be considered a secondary finding in individuals with preserved insulin sensitivity, potentially related to a more efficient removing of fatty acids and also glucose from the circulation and sequestration within anabolic pathways and in parallel a reduction of the availability of these substrates for the oxidative disposal.21 By contrast, in insulin-resistant patients and in T2DM patients, in whom the storage of energy substrates within the adipose tissue is limited, a spillover of substrate flux towards non-adipose organs takes place, and the oxidative disposal is enhanced.
Whether the observed difference in energy metabolism may have a potential clinical relevance is difficult to be stated at this stage but it may be of help in explaining the reported different responses to dietary intervention in these individuals in terms of insulin sensitivity.22 Similarly, extrapolation of our findings to explain the controversial23,24 better CVD prognosis of subjects with preserved insulin sensitivity is not feasible, but if we speculate that the adaptation of energy metabolism and lipid disposal detected at the whole body system was taking place also at the level of the heart, this event could be an effective mechanism to protect against mitochondrial respiratory chain dysfunction and in turn excessive ROS production and oxidative stress.25 Following this line of thinking a recent work performed in a population of Indonesian patients with T2DM reported that body composition and overall estimated REE using BIA were strongly associated with and contributed considerably to the presence and severity of diabetic retinopathy independent of other systemic factors including diabetes duration, blood pressure, diabetes medication, and other diabetes complications.26
Limitations of the present work are the cross-sectional and retrospective nature of the analysis, the assessment of body composition using BIA methodology and the lack of knowledge for food preference. First, the retrospective analysis is the reason why the three groups of subjects resulted to be different in terms of some anthropometric parameters (sex, age and BMI; Table 1) with potential impact on energy metabolism; to minimize this potential bias we applied the appropriate adjustments for these differences in the multivariate analysis confirming the hypothesized association between REE and HOMA-IR (Table 2). Second, the original choice to assess body composition in these patients in waiting list for bariatric surgery using BIA was linked to the willingness of using non-invasive techniques; the whole body DXA scan, considered to be the golden standard technique, was avoided due to the fact that the high BMI of study subjects made unsuitable the single scan assessment with a low-dose x-ray exposition. BIA within this range of BMI is not sufficient enough to guarantee maximal sensitivity in estimating free fat mass but we believe this potential bias is to be considered balanced between study groups. Third, while habitual physical activity and eating behavior were recorded using a questionnaire, quantitative data about diet composition were not obtained; this may be a limit under the view of the idea that high dietary carbohydrate content may promote calorie deposition in adipose tissue, exacerbate hunger, and lower energy expenditure.27 It should be also emphasized that patients with T2DM had a rather short duration of the disease (Table 1), but this finding was expected because it reflects the indications for bariatric surgery in patients with diabetes, which are stronger in these patients because they have the higher chance to obtain remission, in contrast to patients with longer duration of the disease. In spite of this selection bias, our view that insulin resistance rather than overt diabetes is the main determinant of the described metabolic adaptation, is confirmed.
The strength of the study, in contrast, is the large sample size of a unique sample of adults with severe obesity recruited with homogeneous criteria in which indirect calorimetry was properly performed and with a tight control of the variables with a potential impact on REE.
Conclusion
Obesity is certainly an etiologically heterogeneous disorder in which multiple pathogenic factors are involved, but insulin resistance plays a pivotal role in the mechanisms of adaptation/mal-adaptation to overfeeding. In particular, our work demonstrated that preservation of insulin sensitivity in severely obese individuals was associated with lower REE supporting the view that down-regulation of nutrients’ oxidative disposal, when supported by efficient anabolic processes, may be a feature reflecting an appropriate adaptation of energy metabolism contributing to the maintenance of a decent metabolic profile in obese individuals. Since it was recently recognized that the condition of normal insulin sensitivity in obese patients is not stable and crystalized, but a large proportion of individuals convert to an insulin-resistant state over time across all BMI categories,24 longitudinal studies will be necessary to understand the reciprocal interactions between these metabolic features and whether the observed adaptation of REE could be a distinctive feature also in individuals with less severe degree of obesity.
Abbreviations
BIA, bioimpedance; HOMA-IR, homeostatic model assessment insulin resistance; REE, resting energy expenditure; RQ, respiratory quotient; T2DM, type 2 diabetes mellitus.
Acknowledgments
This work was supported by an Investigative Initiated Study Grant by Kellogg. G.L. was supported by a liberal donation by Angela Musazzi and Mario Stellato family.
Disclosure
The authors report no conflicts of interest in this work.
References
1. Despres JP, Lemieux I. Abdominal obesity and metabolic syndrome. Nature. 2006;444:881–887. doi:10.1038/nature05488
2. Sims EAH. Characterization of the syndromes of obesity. In: Brodoff BN, Bleicher SJ, editors. Diabetes Mellitus and Obesity. Baltimore, MD: Williams & Wilkins; 1982:219–226.
3. Andres R. Effect of obesity on total mortality. Int J Obes. 1980;4:381–386.
4. Samocha-Bonet D, Dixit VD, Kahn CR, et al. Metabolically healthy and unhealthy obese – the 2013 stock conference report. Obes Rev. 2014;15:697–708. doi:10.1111/obr.2014.15.issue-9
5. Stefan N, Häring HU, Hu FB, Schulze MB. Metabolically healthy obesity: epidemiology, mechanisms, and clinical implications. Lancet Diabetes Endocrinol. 2013;1:152–162. doi:10.1016/S2213-8587(13)70062-7
6. Primeau V, Coderre L, Karelis AD, et al. Characterizing the profile of obese patients who are metabolically healthy. Int J Obes (Lond). 2011;35:971–981. doi:10.1038/ijo.2010.216
7. Samocha-Bonet D, Chisholm DJ, Tonks K, Campbell LV, Greenfield JR. Insulin-sensitive obesity in humans – a ‘favorable fat’ phenotype? Trends Endocrinol Metab. 2012;23:116–124. doi:10.1016/j.tem.2011.12.005
8. Stefan N, Kantartzis K, Machann J, et al. Identification and characterization of metabolically benign obesity in humans. Arch Intern Med. 2008;168:1609–1616. doi:10.1001/archinte.168.15.1609
9. Fabbrini E, Yoshino J, Yoshino M, et al. Metabolically normal obese people are protected from adverse effects following weight gain. J Clin Invest. 2015;125:787–795. doi:10.1172/JCI78425
10. Società Italiana di Chirurgia dell’Obesità e delle Malattie Metaboliche Chapter 3. 2016;29–34.
11. Ascaso JF, Pardo S, Real JT, Lorente RI, Priego A, Carmena R. Diagnosing insulin resistance by simple quantitative methods in subjects with normal glucose metabolism. Diabetes Care. 2003;26:3320–3325. doi:10.2337/diacare.26.12.3320
12. Baecke JAH, Burema J, Frijters JER. A short questionnaire for the measurement of habitual physical activity in epidemiological studies. Am J Clin Nutr. 1982;36:936–942. doi:10.1093/ajcn/36.5.936
13. Perseghin G, Lattuada G, De Cobelli F, et al. Habitual physical activity is associated with the intra-hepatic fat content in humans. Diabetes Care. 2007;30:683–688. doi:10.2337/dc06-2032
14. van Strien T, Frijters JER, Bergers GPA, Defares PB. The dutch eating behavior questionnaire (DEBQ) assessment of restrained, emotional and external eating behavior. Int J Eat Disord. 1986;5:295–315. doi:10.1002/1098-108X(198602)5:2<295::AID-EAT2260050209>3.0.CO;2-T
15. Perseghin G, Lattuada G, De Cobelli F, et al. Reduced intrahepatic fat content is associated with increased whole-body lipid oxidation in patients with type 1 diabetes. Diabetologia. 2005;48:2615–2621. doi:10.1007/s00125-005-0014-5
16. Weir JB. New methods for calculating metabolic rate with special reference to protein metabolism. J Physiol (Lond). 1949;109:1–9. doi:10.1113/jphysiol.1949.sp004363
17. Al-Domi A, Al-Shorman A. Validation of resting metabolic rate equations in obese and non-obese young healthy adults. Clin Nutr ESPEN. 2018;26:91–96. doi:10.1016/j.clnesp.2018.04.008
18. Matthews DR, Hosker JP, Rudenski AS, Naylor BA, Treacher DF, Turner RC. Homeostasis model assessment: insulin resistance and β-cell function from fasting plasma glucose and insulin concentrations in man. Diabetologia. 1995;28:412–419. doi:10.1007/BF00280883
19. D’ Agostino RB. An omnibus test of normality for moderate and large size samples. Biometrika. 1971;58:341–348. doi:10.1093/biomet/58.2.341
20. Pham DD, Lee JH, Hong KH, Jung YJ, Kim SJ, Leem CH. Seasonal effects on resting energy expenditure are dependent on age and percent body fat. Clin Nutr. 2019;28:
21. Virtue S, Vidal-Puig A. Adipose tissue expandability, lipotoxicity and the metabolic syndrome–an allostatic perspective. Biochim Biophys Acta. 2010;1801:338–349. doi:10.1016/j.bbalip.2009.12.006
22. Karelis AD, Messier V, Brochu M, Rabasa-Lhoret R. Metabolically healthy but obese women: effect of an energy-restricted diet. Diabetologia. 2008;51:1752–1754. doi:10.1007/s00125-008-1038-4
23. Calori G, Lattuada G, Piemonti L, et al. Prevalence, metabolic features and prognosis of metabolically-healthy obese Italian individuals: the Cremona Study. Diabetes Care. 2011;34:210–215. doi:10.2337/dc10-0665
24. Eckel N, Li Y, Kuxhaus O, Stefan N, Hu FB, Schulze MB. Transition from metabolic healthy to unhealthy phenotypes and association with cardiovascular disease risk across BMI categories in 90 257 women (the Nurses’ Health Study): 30 year follow-up from a prospective cohort study. Lancet Diabetes Endocrinol. 2018;6:714–724. doi:10.1016/S2213-8587(18)30137-2
25. Kim HK, Nilius B, Kim N, Ko KS, Rhee BD, Han J. Cardiac response to oxidative stress induced by mitochondrial dysfunction. Rev Physiol Biochem Pharmacol. 2016;170:101–127.
26. Sasongko MB, Widyaputri F, Sulistyoningrum DC, et al. Estimated resting metabolic rate and body composition measures are strongly associated with diabetic retinopathy in Indonesian adults with type 2 diabetes. Diabetes Care. 2018;41:2377–2384. doi:10.2337/dc18-1074
27. Ludwig DS, Ebbeling CB. The carbohydrate-insulin model of obesity beyond “calories in, calories out”. JAMA Intern Med. 2018;178:1098–1103. doi:10.1001/jamainternmed.2018.2933
 © 2020 The Author(s). This work is published and licensed by Dove Medical Press Limited. The full terms of this license are available at https://www.dovepress.com/terms.php and incorporate the Creative Commons Attribution - Non Commercial (unported, v3.0) License.
By accessing the work you hereby accept the Terms. Non-commercial uses of the work are permitted without any further permission from Dove Medical Press Limited, provided the work is properly attributed. For permission for commercial use of this work, please see paragraphs 4.2 and 5 of our Terms.
© 2020 The Author(s). This work is published and licensed by Dove Medical Press Limited. The full terms of this license are available at https://www.dovepress.com/terms.php and incorporate the Creative Commons Attribution - Non Commercial (unported, v3.0) License.
By accessing the work you hereby accept the Terms. Non-commercial uses of the work are permitted without any further permission from Dove Medical Press Limited, provided the work is properly attributed. For permission for commercial use of this work, please see paragraphs 4.2 and 5 of our Terms.