Back to Journals » Diabetes, Metabolic Syndrome and Obesity » Volume 17
Relationships Between the Apolipoprotein Levels and Sarcopenia in Inpatients with Type 2 Diabetes Mellitus: A Cross-Sectional Study
Authors Sun Y, Liu BW, Zhang X, Yin FZ ![]()
Received 25 January 2024
Accepted for publication 10 May 2024
Published 20 May 2024 Volume 2024:17 Pages 2085—2094
DOI https://doi.org/10.2147/DMSO.S461324
Checked for plagiarism Yes
Review by Single anonymous peer review
Peer reviewer comments 2
Editor who approved publication: Dr Konstantinos Tziomalos
Yang Sun,1,2 Bo-Wei Liu,2 Xin Zhang,2 Fu-Zai Yin2
1Hebei Medical University, Shijiazhuang, Hebei, People’s Republic of China; 2Department of Endocrinology, First Hospital of Qinhuangdao, Qinhuangdao, Hebei, People’s Republic of China
Correspondence: Fu-Zai Yin, Email [email protected]
Background: Apolipoprotein (Apo) may be associated with sarcopenia in elderly inpatients with type 2 diabetes mellitus (T2DM), but fewer studies are available. In this study, we explored the association of ApoA1, ApoB, and ApoB/ApoA1 with sarcopenia and compared the predictive role of Apo indicators for sarcopenia in an elderly T2DM.
Objective: To investigate the relationships between the Apo and sarcopenia in elderly inpatients with T2DM.
Methods: This study included 253 inpatients with T2DM (mean age of 70.11± 5.44 years, 32.8% male). The inpatients were divided into the sarcopenic group (n = 100) and non-sarcopenic group (n = 153). The associations among the Apo and sarcopenia were assessed using multivariate analyses.
Results: Inpatients in the sarcopenia group showed lower ApoA1 levels than those in the non-sarcopenia group (1.25± 0.21 vs 1.36± 0.20 g/L, P < 0.05) and showed higher ApoB/ApoA1 and ApoB levels than those in the non-sarcopenia group (0.82± 0.27 vs 0.69± 0.19 g/L, P < 0.05;1.00± 0.32 vs 0.93± 0.24 g/L, P < 0.05, respectively). After adjusting for age and BMI, the logistic regression model indicated that ApoA1 was a protective factor for elderly inpatients with T2DM sarcopenia.(OR =0.079,95% CI: 0.021~0.306, P < 0.05);ApoB and AopB/AopA1 were risk factors for elderly inpatients with T2DM sarcopenia.(OR =3.578,95% CI:1.318~9.715, P < 0.05;OR =16.440,95% CI:4.437~60.427, P < 0.05, respectively). AopB/AopA1 provided an AUC value of 0.765 in elderly men.(95% CI: 0.665~0.866, P< 0.05).
Conclusion: ApoA1, AopB, and AopB/AopA1 are associated with sarcopenia in elderly inpatients with T2DM, and AopB/AopA1 may be a potential predictor of sarcopenia in elderly men with T2DM.
Keywords: type 2 diabetes mellitus, sarcopenia, Apolipoprotein A1, Apolipoprotein B, Apolipoprotein B/A1
Sarcopenia is defined as the age-related loss of skeletal muscle mass and function.1 With increasing global aging, sarcopenia is rapidly increasing among people over 65 years of age.2 Sarcopenia can pose a serious threat to the physical health of older adults and can lead to old age, disability, hospitalization and even death.3–5 The etiology of sarcopenia is complex and involves various factors such as muscle wasting, changes in endocrine function, chronic illnesses, inflammation, insulin resistance, and inadequate nutrition.6
Several studies have indicated a potential correlation between dyslipidemia and sarcopenia.7,8 Dysregulation of lipid metabolism is intricately linked to muscle physiology and metabolism, ultimately resulting in muscle pathology and dysfunction.9 Dyslipidemia may exacerbate sarcopenia by promoting fat accumulation within muscle fibers, impairing mitochondrial function, and inducing oxidative stress, abnormal insulin signaling, and an inflammatory cascade.10 It has been reported that the decline in proximal leg strength among individuals with T2DM may be linked to diabetic peripheral neuropathy, while the decrease in distal leg strength is attributed to the accumulation of intramuscular fat.11 Furthermore, a study conducted on elderly inpatients in China revealed that elevated levels of total cholesterol (TC), triglycerides (TG), and low-density lipoprotein cholesterol (LDL-C) could serve as potential risk factors for sarcopenia in this population.12 Park found a negative correlation between grip strength and levels of TC, TG, and LDL-C in middle-aged and older adults, while high-density lipoprotein cholesterol (HDL-C) showed a positive correlation.13 Apo play a crucial role in regulating lipid metabolism by stabilizing lipoprotein structure, facilitating lipid transport, enhancing immunogenicity of lipoproteins, and modulating levels of different lipoproteins.14 ApoA1 and ApoB are two of the most clinically significant Apo. ApoA1, the main structural protein of HDL-C, plays a crucial role in cholesterol efflux and cellular cholesterol homeostasis.15 ApoB is the predominant protein constituent of LDL-C and serves as a marker for LDL-C levels.16
In recent years, there has been a growing focus on the role of Apo in cardiovascular disease, specifically the AopB/AopA1 has demonstrated notable advantage in predicting the risk of atherosclerotic cardiovascular disease.15,17,18 It is apparent that Apo are closely linked to atherosclerosis, and the chronic inflammatory state associated with T2DM is also a contributing factor to atherosclerosis and sarcopenia. Because the diagnostic evaluation of sarcopenia is relatively complex, whereas Apo testing is easier in the T2DM population, and whether Apo can be used as a predictor of sarcopenia has not been reported, we designed the present study.
Objects and Methods
Study Objects
From October 2021 to December 2022, 253 patients with T2DM were admitted to the Department of Endocrinology of the First Hospital of Qinhuangdao. The mean age was (70.11±5.44) years, and the sample included 83 elderly men and 170 elderly women. The inclusion criteria were as follows: (1) clear diagnosis of T2DM; (2) gave informed consent and voluntary participated in this study; and (3) over 60 years of age (range <80 years). The exclusion criteria were as follows: (1) patients with acute cerebrovascular disease, acute gastrointestinal bleeding, acute renal failure, severe liver function abnormalities, or a history of severe physical damage; (2) Use of lipid-affecting medications other than moderate-intensity doses of statin (regardless of type) within 6 months; (3) patients with diabetic ketoacidosis or diabetic hypertonic hyperglycemic syndrome; (4) patients with severe bone and joint disease or neuromuscular disease affecting daily activities; (5) patients with malignant tumors (unable to live or work normally); and (6) patients with acute infectious diseases.
Research Methodology
Clinical Information
Information on each participant, including their height, weight, systolic blood pressure, diastolic blood pressure, history of smoking, history of alcohol consumption, diabetes duration, History of cerebral infarction, and History of coronary heart disease, was collected by trained and certified investigators using standard technical methods. The body mass index (BMI) was calculated as BMI = weight (kg) / height (m2).
All subjects were instructed to fast for 8–12 h, and 5 mL of venous blood was drawn in the morning of the following day on an empty stomach. The blood was used to analyze TC, TG, HDL-C, LDL-C, ApoA1, ApoB, blood uric acid (UA), glycated hemoglobin (HbA1c), and fasting blood glucose (FBG). LDL-C/HDL-C and ApoB/ApoA1 ratio was calculated. Blood lipids were determined by an enzymatic method using a Hitachi 7170A fully automated biochemical analyzer. HbA1c was determined using a glycosylated hemoglobin assay kit (Microparticle Chromatography, YZB/NOR 4287–2010, AxisShiold PoCAS). FBG was determined using the glucose oxidase method.
The whole-body skeletal muscle mass index (SMI) was measured by dual-energy X-ray bone densitometry (DXA, MEDILINK SARL, France). The grip strength of each hand was measured using a JAMAR (Performance health supply, inc, Cedarburg, WI, USA) electronic grip strength meter; Take two measurements in each hand and the maximum value is recorded as the grip strength. The subject was instructed to perform a 6-m walk test at a natural pace, and the gait speed (m/s) was calculated by dividing 6 m by the time required to complete the walk test.
Diagnostic Criteria for Sarcopenia
The Asian Working Group on Sarcopenia (AWGS) 2019 diagnostic criteria for sarcopenia were used: SMI < 7.0 kg/m2 for males and SMI < 5.4 kg/m2 for females; grip strength < 28 kg for males and < 18 kg for females; and gait speed < 1.0 m/s.
Statistical Methods
Data were organized and analyzed using SPSS 23.0 software. The normally distributed measurement data were expressed as mean ± standard deviation (x ± s), and t-test was used for comparison between groups. Count data were expressed as the number of cases (percentage), and the chi-square test was used for comparison between groups. Binary logistic regression was used to analyze the correlations between sarcopenia and age, BMI, ApoA1, ApoB and ApoB/ApoA1. The receiver-operating characteristic (ROC) curves were drawn and values of area undercurve (AUC) were estimated. Differences were considered statistically significant at P<0.05.
Results
Characteristics of the Study Participants
A total of 253 inpatients with T2DM were included in this study, including 170 elderly women and 83 elderly men, with an overall mean age of (70.11±5.44) years. The prevalence of sarcopenia in the total population was 39.5% (35.3% in elderly women and 48.2% in elderly men). In the total population, Compared with the non-sarcopenia group, the age, ApoB, ApoB/ApoA1, LDL-C/HDL-C levels and coronary heart disease detection rate of the sarcopenia group were significantly higher (P<0.05), while the BMI and ApoA1 levels were significantly lower (P<0.05);In the elderly women, Compared with the non-sarcopenia group, the age, ApoB/ApoA1 levels and coronary heart disease detection rate of the sarcopenia group were significantly higher (P<0.05), while the BMI and ApoA1 levels were significantly lower (P<0.05);In the elderly men, Compared with the non-sarcopenia group, the ApoB, ApoB/ApoA1and LDL-C/HDL-C levels of the sarcopenia group were significantly higher (P<0.05), while the ApoA1 levels were significantly lower (P<0.05) (Table 1)
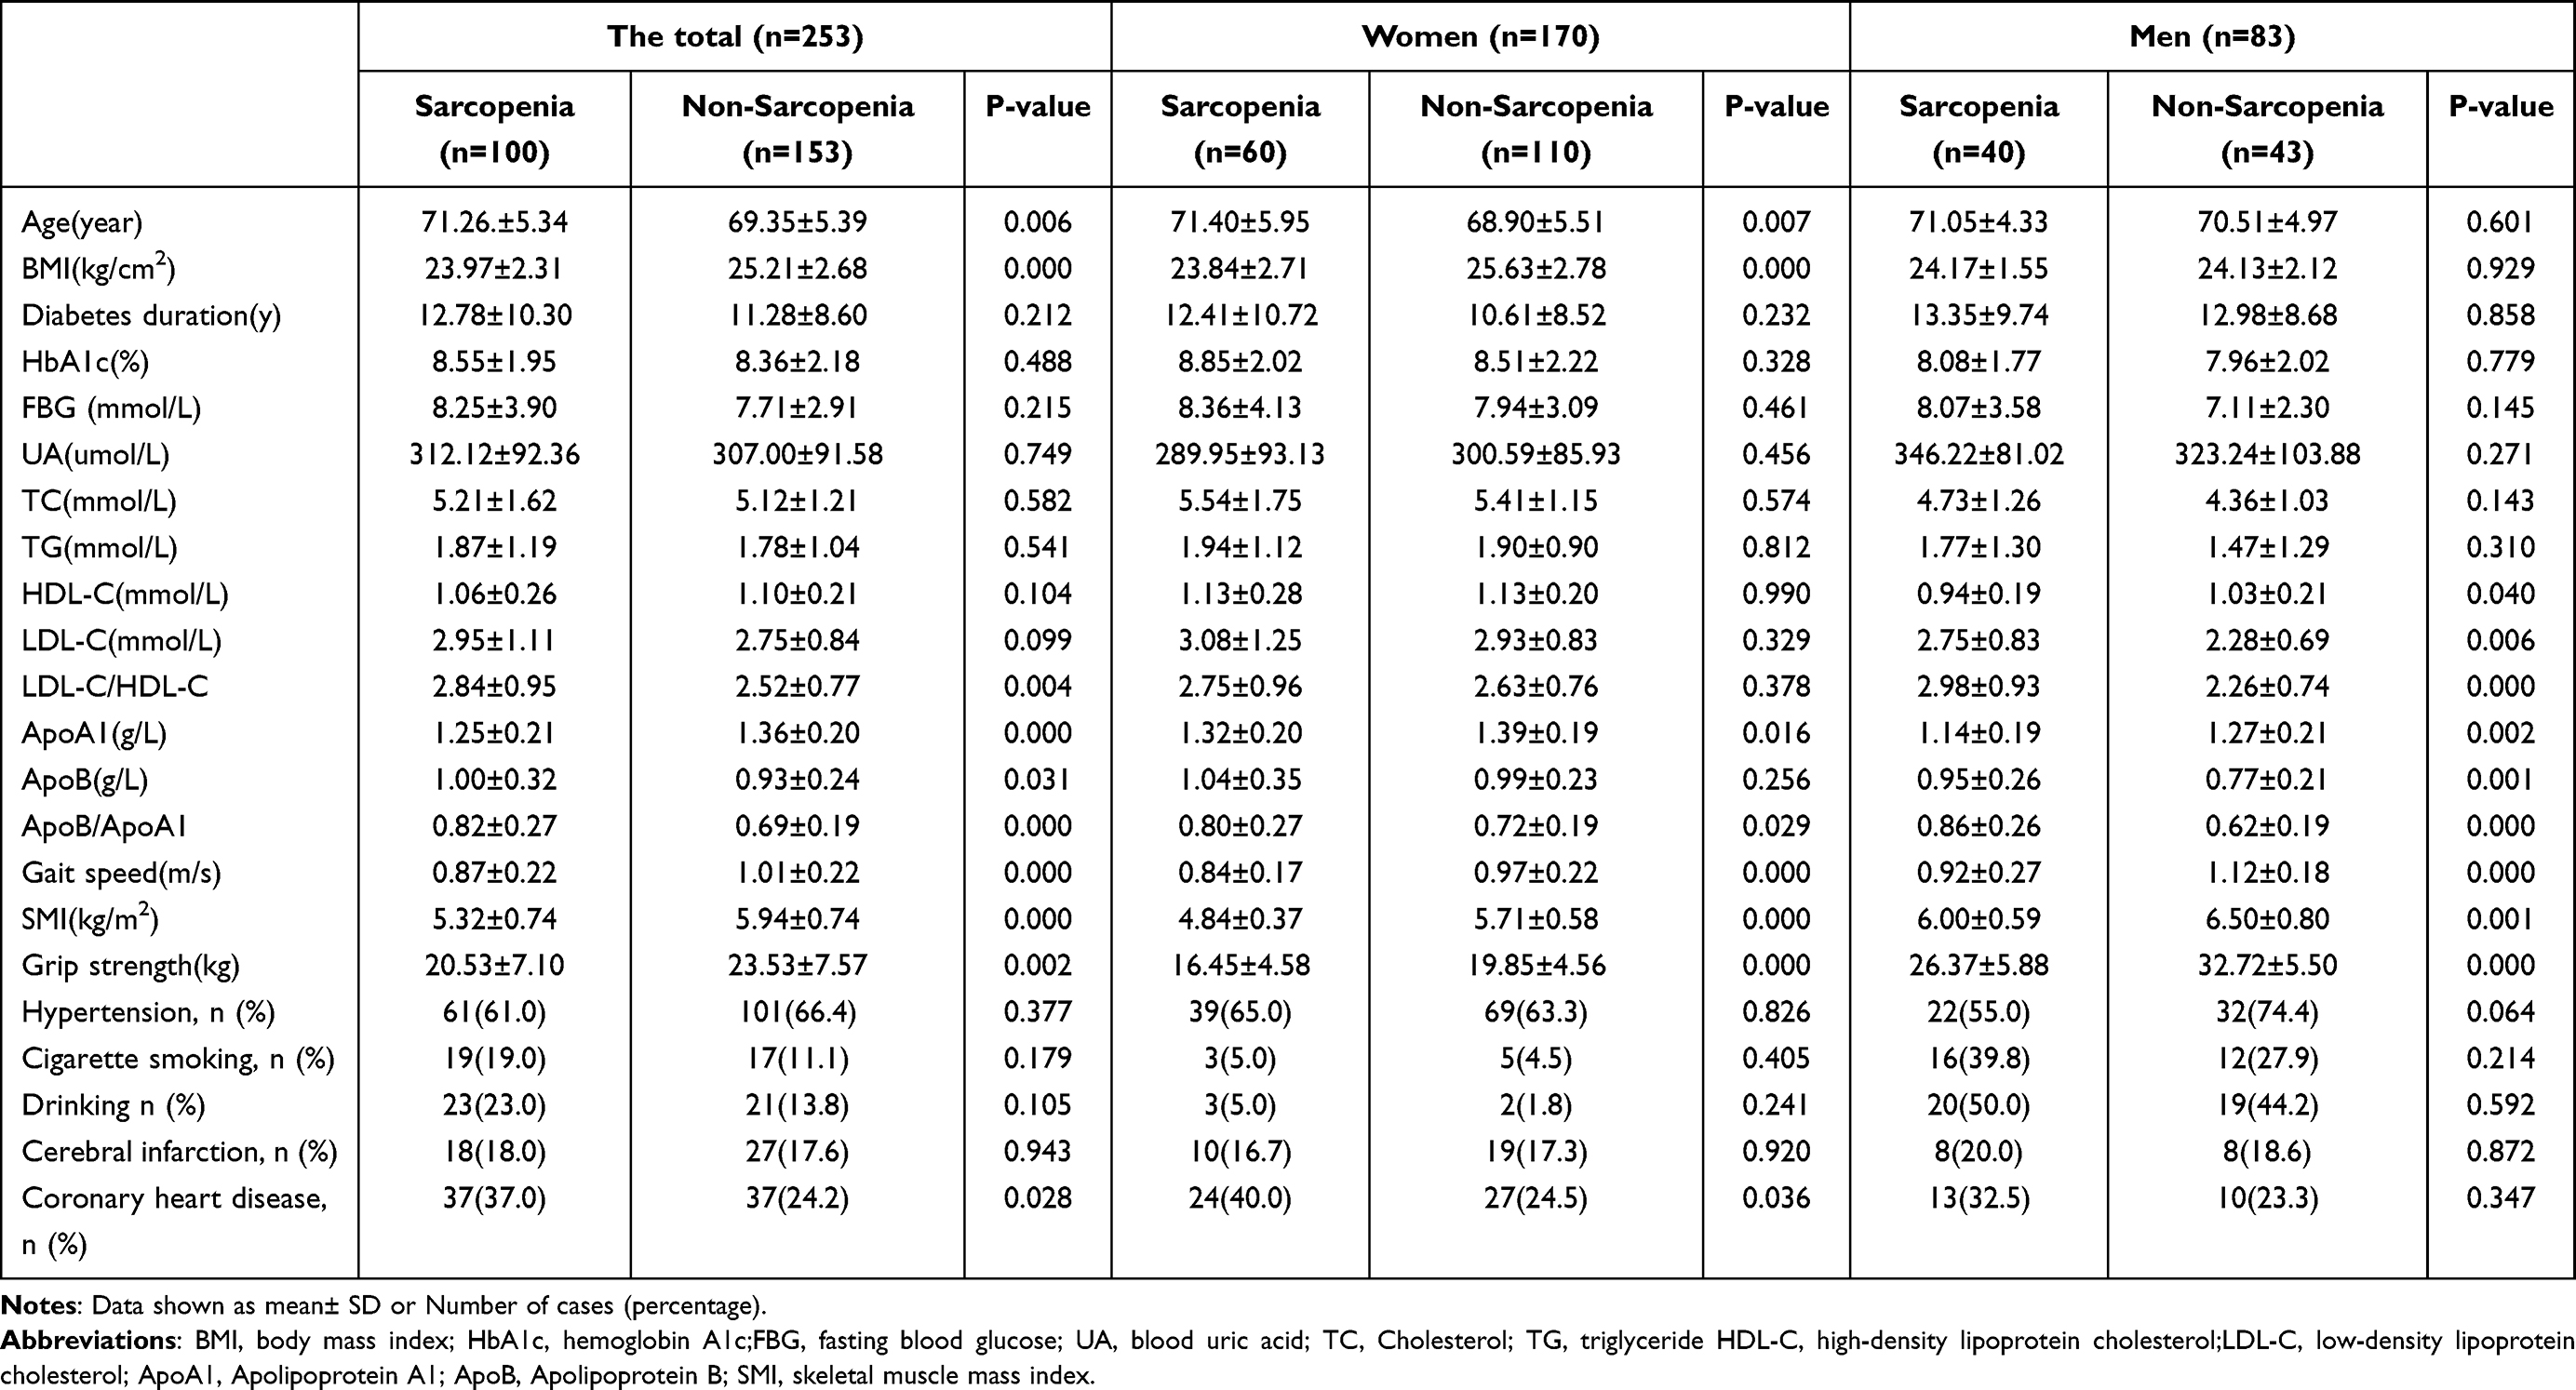 |
Table 1 Baseline Characters and Differences Between Sarcopenia Group and Non- Sarcopenia Group |
Relationships Between the ApoA1, ApoB, and ApoB/ApoA1 Levels and the Detection Rate of Sarcopenia
ApoA1, ApoB, and ApoB/ApoA1 were dichotomized according to the collected data. The detection rate of sarcopenia was significantly higher in the low ApoA1 groups than in the high ApoA1 groups.(49.6% vs 28.3%, χ2= 11.963, P= 0.001), while the detection rate of sarcopenia was significantly higher in the low ApoB/ApoA1 groups than in the high ApoB/ApoA1 groups.(47.2% vs 32.3%, χ2= 5.828, P= 0.016). No significant difference was seen in the detection rate of sarcopenia in the ApoB dichotomous subgroups.(40.7% vs 38.5%, χ2= 0.127, P= 0.772) (Figure 1)
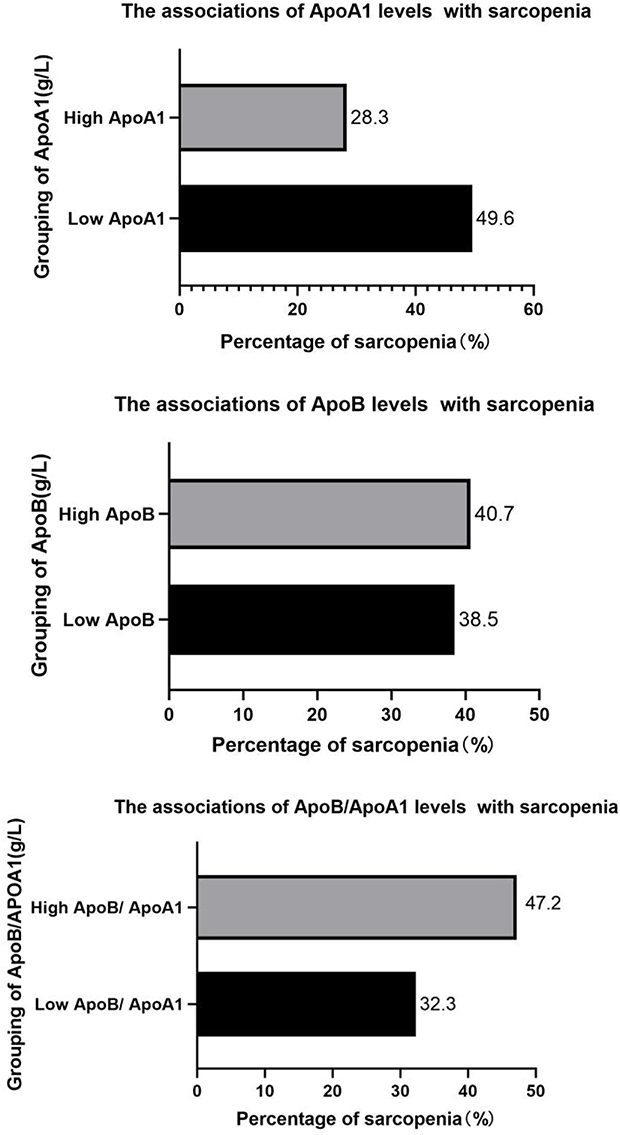 |
Figure 1 The percentage of patients with sarcopenia according to ApoA1, ApoB, and ApoB/ApoA dichotomous levels. Notes: High AopA1 was defined as ≥1.30g/L, Low AopA1was defined as <1.30g/L; High AopB was defined as ≥0.93g/L, Low AopB was defined as <0.93g/L; High AopB/AopA1 was defined as ≥0.72g/L, Low AopB/AopA1 was defined as <0.72 g/L. |
Logistic Regression Analysis of Sarcopenia and ApoA1, ApoB, and ApoB/ApoA1
In the analysis of logistic regression, sarcopenia was used as the dependent variable and serum ApoA1, ApoB, and ApoB/ApoA1 levels were used as the independent variables. After adjusting for age and BMI, ApoA1 as a protective factor for elderly women and elderly men inpatients with T2DM sarcopenia (OR=0.140,95% CI:0.023~0.841, P=0.032;OR=0.028,95% CI:0.002~0.343, P=0.005, respectively). AopB as a risk factor for elderly men inpatients with T2DM sarcopenia (OR =33.250,95% CI:3.440~321.362, P =0.002), AopB/AopA1 as a risk factor for elderly women and elderly men inpatients with T2DM sarcopenia. (OR =5.852,95% CI:1.187~28.842, P =0.030;OR=160.855, 95% CI:11.296~2290.506, P=0.000, respectively) (Table 2)
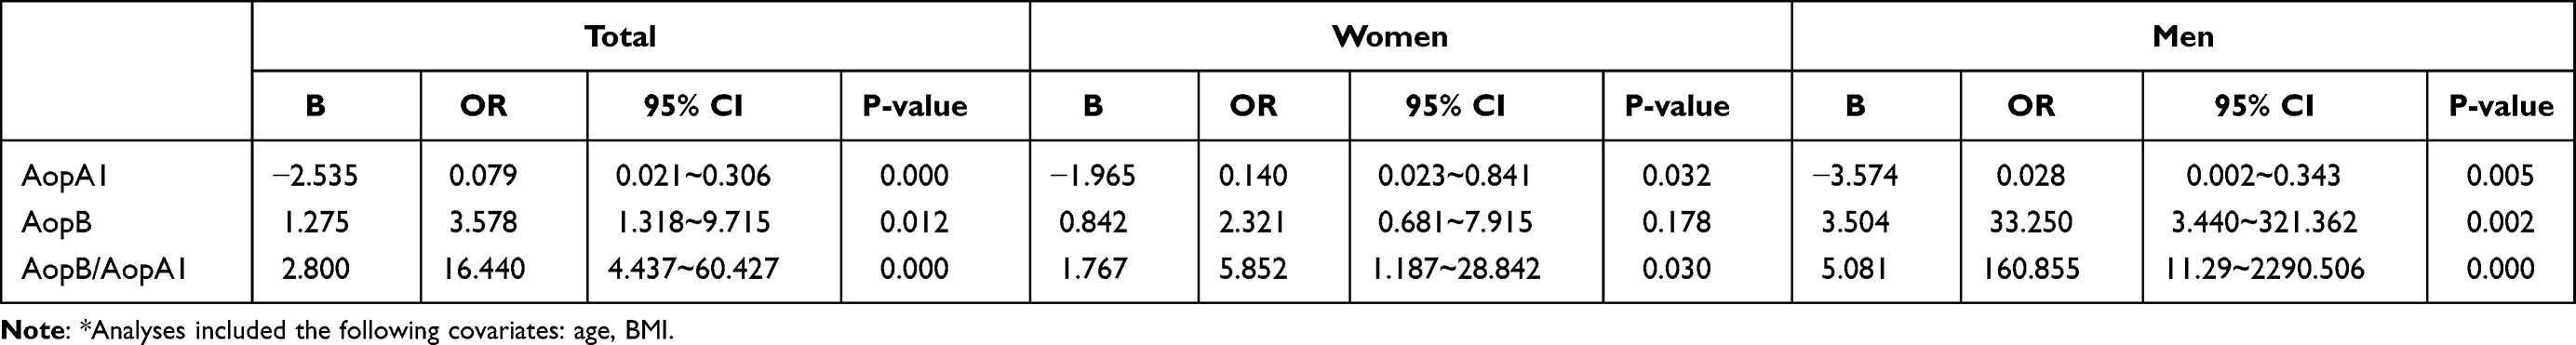 |
Table 2 Binary Logistic Regression Analysis of Influencing Factors of Sarcopenia* |
ROC Curve Analysis of Apolipoproteins Levels and Various Lipid Parameters in the Diagnosis of Sarcopenia
AopB/AopA1levels for predicting sarcopenia has an AUC value greater than ApoA1, ApoB levels, and other lipid parameters. AopB/AopA1 levels predicted AUC values of 0.629 (95% CI: 0.557~0.700), 0.554 (95% CI: 0.459~0.649), and 0.765 (95% CI: 0.665~0.866) for sarcopenia in elderly inpatients, elderly women inpatients, and elderly men inpatients, respectively (Table 3 and Figure 2)
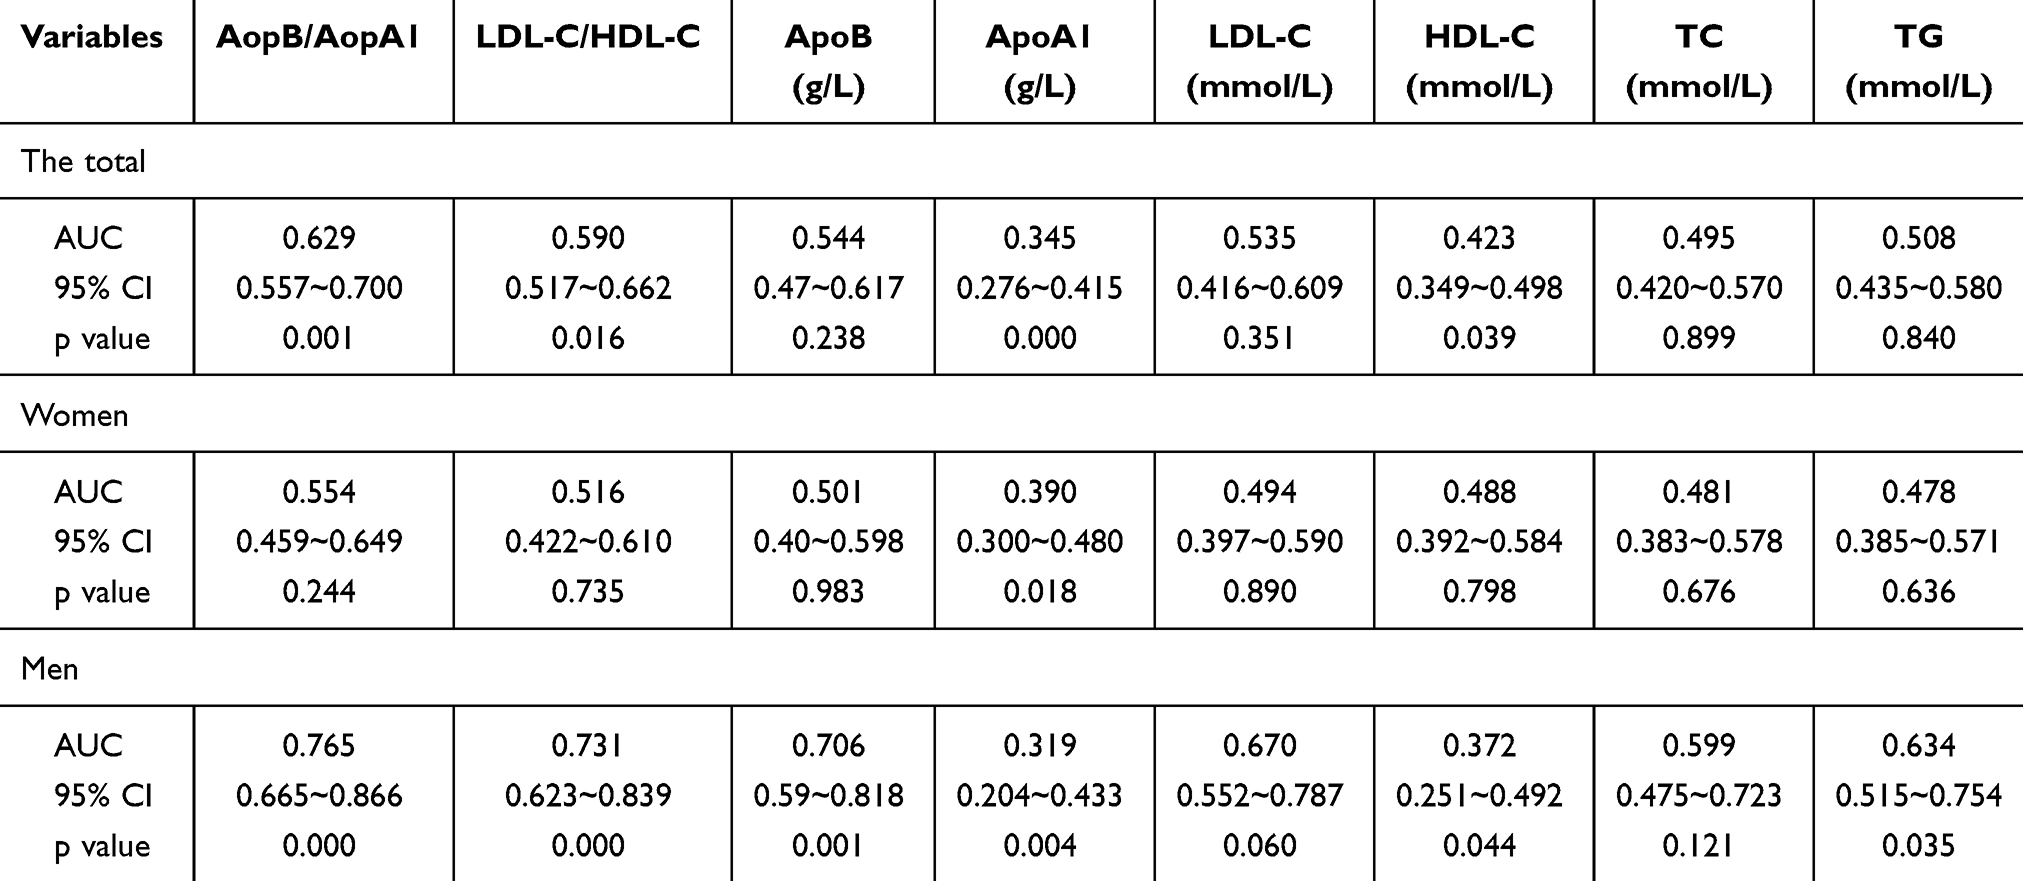 |
Table 3 The ROC Curves Parameters for Apolipoprotein and Various Lipid Parameters in Predicting Sarcopenia |
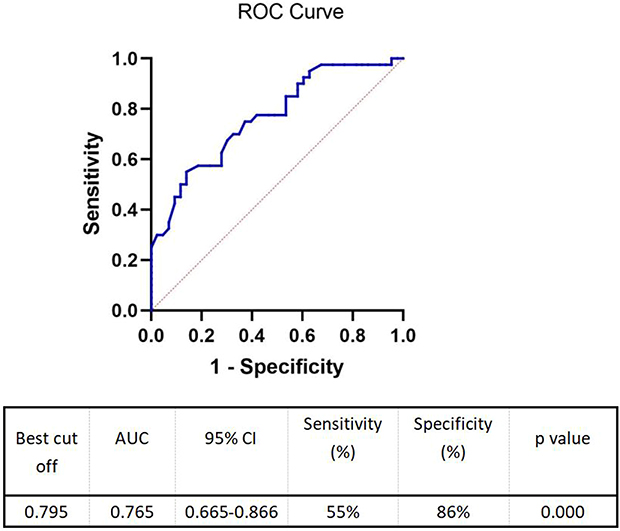 |
Figure 2 Receiver operating characteristic (ROC) curve subjects in the male sarcopenia group versus the non-sarcopenia group. AUC area under the curve, AopB/AopA1. |
Discussion
The prevalence of sarcopenia in elderly inpatients with T2DM in our study was 39.5%, with a prevalence of sarcopenia in 48.8% of elderly male inpatients and 35.3% of elderly female inpatients. Perkisas conducted a study which revealed that the prevalence of sarcopenia among the elderly can vary significantly, ranging from 17% to 62%.19 This fluctuation is attributed to differences in the populations studied, living conditions, and the assessment tools and methodologies utilized. Subsequent studies, such as that by Cruz-Jentoft have shown a prevalence of sarcopenia in older adults living in the community to range from 1% to 29%.20 Additionally, a study conducted in China on sarcopenia among elderly individuals residing in nursing homes found that the prevalence of sarcopenia was 32.8%, with rates as high as 68% among men.21 Moreover, older adults diagnosed with T2DM may experience a 55% elevated risk of developing sarcopenia.22 Factors such as insulin resistance and heightened levels of advanced glycosylation end-products in individuals with T2DM contribute to an increased susceptibility to microvascular and macrovascular complications, potentially disrupting cellular function and resulting in cellular demise.23 These complications can ultimately impact muscle mass and function, ultimately leading to sarcopenia. Additionally, our research revealed a lower prevalence of sarcopenia in females (35.3%) compared to males (48.2%). This is consistent with some previous studies,21,24,25 however, there are still some studies that have presented opposite results,26,27 and others that have found no significant association between gender and the prevalence of sarcopenia.28,29
Apo, a key functional protein involved in lipid metabolism, has shown a significant association with sarcopenia. Additionally, emerging evidence suggests that lipid metabolism may play a crucial role in the regulation of skeletal muscle mass and function.30 Yang ‘s meta-analysis revealed a significant association between LDL-C, TG, HDL-C, and TG with sarcopenia.8 Le ‘s study illustrated that short-term high-fat feeding in mice led to increased muscle atrophy and catabolism, resulting in decreased muscle mass and function compared to a previous period.31 Furthermore, an analysis of the Korean National Health and Nutrition Examination Survey identified elevated levels of LDL-C and TC in individuals with lower muscle mass.32 In addition, during the aging process, the decline in muscle function and mobility in the elderly is closely related to the redistribution of adipose tissue and the infiltration of lipids into the skeletal muscle.33 This study identified a strong correlation between AopA1 and ApoB with the onset of sarcopenia. AopA1, a primary Apo responsible for transporting HDL-C in vivo and possessing anti-inflammatory and immunomodulatory properties,34 plays a crucial role in the conversion of myoglycogen within skeletal muscle cells. Additionally, AopA1 enhances both insulin-dependent and insulin-independent glucose metabolism in skeletal muscle, thereby increasing skeletal muscle myoglycogen levels.35 This elevation in myoglycogen content impacts the energy supply to skeletal muscle and subsequently influences muscle function.36 Tikkanen observed a positive correlation between elevated serum levels of ApoA1 and the proportion of slow muscle fibers in the skeletal muscle of middle-aged men. Higher concentrations of ApoA1 were associated with a greater percentage of slow muscle fibers.37 The onset of sarcopenia is intricately linked to inflammatory markers, and ApoA1 has been shown to mitigate the production of inflammatory factors to a certain extent.38 ApoB serves as the primary Apo responsible for transporting LDL-C in vivo and is a crucial biomarker for the detection of hyperlipidemia. Shono N observed a negative association between ApoB levels and the quantity of capillaries surrounding skeletal muscle type IIx fibers in males, with higher serum ApoB levels correlating with a decreased number of capillaries surrounding these fibers.39 Previous research has indicated that the ApoB/ApoA1 ratio may provide a more accurate reflection of the severity of acute coronary syndromes compared to traditional lipid parameters in patients with this condition.15 In the current study, ApoB/ApoA1 predicted sarcopenia with a greater AUC value than other lipid parameters, mainly in older men, with an AUC area of 0.765 and an optimal theoretical threshold of 0.795. However, this result is not perfect, which may be related to the small sample size and single-sample nature of our study. Therefore, prospective studies with large sample sizes are still needed to further explore.
In this study, the DXA method was used to provide a more reliable assessment of muscle mass, and the AWGS-2019 criteria were chosen to define sarcopenia. However, this study has some limitations. First, since this was a cross-sectional study, it was not possible to determine causality. Second, the sample size of this study was relatively small and single-center, and the findings need to be validated in multiple centers. Third, other confounding factors such as total calorie intake and use of antidiabetic drugs were not completely excluded from the model.
In conclusion, the levels of Apo have been found to be correlated with the onset of sarcopenia in elderly inpatients diagnosed with T2DM. Moreover, AopB/AopA1 may be a potential predictor of sarcopenia in elderly men with T2DM. Therefore, elderly T2DM inpatients should be monitored for changes in their Apo levels while controlling their lipid levels, thus enhancing the prevention of sarcopenia.
Data Sharing Statement
The database is owned by all data collectors and is not publicly available.
Ethics Statement
All procedures involving human participants followed the ethical standards of the Helsinki Declaration of Ethical Principles, and the studies involving human participants were reviewed and approved by Ethics Committee of Qinhuangdao First Hospital. Written informed consent to participate in this study was provided by the patient.
Disclosure
The authors declare no conflicts of interest in this work.
References
1. Chen LK, Woo J, Assantachai P, et al. Asian Working Group for Sarcopenia: 2019 consensus update on sarcopenia diagnosis and treatment. J Am Med Dir Assoc. 2020;21(3):300–307.e2. doi:10.1016/j.jamda.2019.12.012
2. Hong S, Choi WH. Clinical and physiopathological mecha-nism of sarcopenia. Korean J Med. 2012;83:444–454. doi:10.3904/kjm.2012.83.4.444
3. Janssen I, Shepard DS, Katzmarzyk PT, Roubenoff R. The healthcare costs of sarcopenia in the United States. J Am Geriatr Soc. 2004;52(1):80–85. doi:10.1111/j.1532-5415.2004.52014.x
4. Gale CR, Martyn CN, Cooper C, Sayer AA. Grip strength, body composition, and mortality. Int J Epidemiol. 2007;36(1):228–235. doi:10.1093/ije/dyl224
5. Janssen I, Heymsfield SB, Ross R. Low relative skeletal muscle mass (sarcopenia) in older persons is associated with functional impairment and physical disability. J Am Geriatr Soc. 2002;50(5):889–896. doi:10.1046/j.1532-5415.2002.50216.x
6. Fielding RA, Vellas B, Evans WJ, et al. Sarcopenia: an undiagnosed condition in older adults. Current consensus definition: prevalence, etiology, and consequences. International working group on sarcopenia. J Am Med Dir Assoc. 2011;12(4):249–256. doi:10.1016/j.jamda.2011.01.003
7. Gong H, Liu Y, Lyu X, Dong L, Zhang X. Lipoprotein subfractions in patients with sarcopenia and their relevance to skeletal muscle mass and function. Exp Gerontol. 2022;159:111668. doi:10.1016/j.exger.2021.111668
8. Du Y, Oh C, No J. Associations between sarcopenia and metabolic risk factors: a systematic review and meta-analysis. J Obes Metab Syndr. 2018;27(3):175–185. doi:10.7570/jomes.2018.27.3.175
9. Hirschfeld HP, Kinsella R, Duque G. Osteosarcopenia: where bone, muscle, and fat collide. Osteoporos Int. 2017;28(10):2781–2790. doi:10.1007/s00198-017-4151-8
10. Dong Ni YU, Li Xin GUO. Effects of fat deposition in skeletal muscle on muscle function and metabolism. Int J Endocrinol Metabol. 2022;4(2):134–137.
11. Almurdhi MM, Reeves ND, Bowling FL, Boulton AJ, Jeziorska M, Malik RA. Reduced Lower-limb muscle strength and volume in patients with type 2 diabetes in relation to neuropathy, intramuscular fat, and vitamin D levels. Diabetes Care. 2016;39(3):441–447. doi:10.2337/dc15-0995
12. Jiang Y, Xu B, Zhang K, et al. The association of lipid metabolism and sarcopenia among older patients: a cross-sectional study. Sci Rep. 2023;13(1):17538. doi:10.1038/s41598-023-44704-4
13. Park D, Lee DC, Kim Y. Relationship between relative grip strength and serum total cholesterol, high-density lipoprotein cholesterol, low-density lipoprotein cholesterol, and triglyceride levels in Korean middle-aged or older adults: a panel regression model. Metab Syndr Relat Disord. 2022;20(9):517–523. doi:10.1089/met.2022.0027
14. Mahley RW, Innerarity TL, Rall SC, Weisgraber KH. Plasma lipoproteins: apolipoprotein structure and function. J Lipid Res. 1984;25(12):1277–1294. doi:10.1016/S0022-2275(20)34443-6
15. Yaseen RI, El-Leboudy MH, El-Deeb HM. The relation between ApoB/ApoA-1 ratio and the severity of coronary artery disease in patients with acute coronary syndrome. Egypt Heart J. 2021;73(1):24. doi:10.1186/s43044-021-00150-z
16. Sierra-Johnson J, Fisher RM, Romero-Corral A, et al. Concentration of apolipoprotein B is comparable with the apolipoprotein B/apolipoprotein A-I ratio and better than routine clinical lipid measurements in predicting coronary heart disease mortality: findings from a multi-ethnic US population. Eur Heart J. 2009;30(6):710–717. doi:10.1093/eurheartj/ehn347
17. Liu Y, Jia SD, Yuan DS, et al. Apolipoprotein B/A-I ratio predicts lesion severity and clinical outcomes in diabetic patients with acute coronary syndrome. Circ J. 2020;84(7):1132–1139. doi:10.1253/circj.CJ-19-1097
18. Holme I, Aastveit AH, Jungner I, Walldius G. Relationships between lipoprotein components and risk of myocardial infarction: age, gender and short versus longer follow-up periods in the Apolipoprotein MOrtality RISk study (AMORIS). J Intern Med. 2008;264(1):30–38. doi:10.1111/j.1365-2796.2008.01925.x
19. Perkisas S, De Cock AM, Vandewoude M, Verhoeven V. Prevalence of sarcopenia and 9-year mortality in nursing home residents. Aging Clin Exp Res. 2019;31(7):951–959. doi:10.1007/s40520-018-1038-2
20. Cruz-Jentoft AJ, Landi F, Schneider SM, et al. Prevalence of and interventions for sarcopenia in ageing adults: a systematic review. Report of the International Sarcopenia Initiative (EWGSOP and IWGS). Age Ageing. 2014;43(6):748–759. doi:10.1093/ageing/afu115
21. Landi F, Liperoti R, Fusco D, et al. Prevalence and risk factors of sarcopenia among nursing home older residents. J Gerontol a Biol Sci Med Sci. 2012;67(1):48–55. doi:10.1093/gerona/glr035
22. Anagnostis P, Gkekas NK, Achilla C, et al. Type 2 diabetes mellitus is associated with increased risk of sarcopenia: a systematic review and meta-analysis. Calcif Tissue Int. 2020;107(5):453–463. doi:10.1007/s00223-020-00742-y
23. Nowotny K, Jung T, Höhn A, Weber D, Grune T. Advanced glycation end products and oxidative stress in type 2 diabetes mellitus. Biomolecules. 2015;5(1):194–222. doi:10.3390/biom5010194
24. Hai S, Cao L, Wang H, et al. Association between sarcopenia and nutritional status and physical activity among community-dwelling Chinese adults aged 60 years and older. Geriatr Gerontol Int. 2017;17(11):1959–1966. doi:10.1111/ggi.13001
25. Chen Q, Hao Q, Ding Y, Dong B. The association between sarcopenia and prealbumin levels among elderly Chinese inpatients. J Nutr Health Aging. 2019;23(2):122–127. doi:10.1007/s12603-018-1130-5
26. Kim TN, Park MS, Yang SJ, et al. Prevalence and determinant factors of sarcopenia in patients with type 2 diabetes: the Korean Sarcopenic Obesity Study (KSOS). Diabetes Care. 2010;33(7):1497–1499. doi:10.2337/dc09-2310
27. Han P, Kang L, Guo Q, et al. Prevalence and factors associated with sarcopenia in suburb-dwelling older Chinese using the asian working group for sarcopenia definition. J Gerontol a Biol Sci Med Sci. 2016;71(4):529–535. doi:10.1093/gerona/glv108
28. Tanimoto Y, Watanabe M, Sun W, et al. Association between sarcopenia and higher-level functional capacity in daily living in community-dwelling elderly subjects in Japan. Arch Gerontol Geriatr. 2012;55(2):e9–13. doi:10.1016/j.archger.2012.06.015
29. Bastiaanse LP, Hilgenkamp TI, Echteld MA, Evenhuis HM. Prevalence and associated factors of sarcopenia in older adults with intellectual disabilities. Res Dev Disabil. 2012;33(6):2004–2012. doi:10.1016/j.ridd.2012.06.002
30. Lipina C, Hundal HS. Lipid modulation of skeletal muscle mass and function. J Cachexia Sarcopenia Muscle. 2017;8(2):190–201. doi:10.1002/jcsm.12144
31. Le NH, Kim CS, Park T, et al. Quercetin protects against obesity-induced skeletal muscle inflammation and atrophy. Mediators Inflamm. 2014;2014:834294. doi:10.1155/2014/834294
32. Lee JH, Lee HS, Cho AR, Lee YJ, Kwon YJ. Relationship between muscle mass index and LDL cholesterol target levels: analysis of two studies of the Korean population. Atherosclerosis. 2021;325:1–7. doi:10.1016/j.atherosclerosis.2021.01.016
33. Xu Z, You W, Chen W, et al. Single-RNA sequencing and lipidomics reveal cell and lipid dynamics of fat infiltration in skeletal muscle. J Cachexia, Sarcopenia Muscle. 2021;12(1):109–129. doi:10.1002/jcsm.12643
34. Cochran BJ, Ong KL, Manandhar B, Rye KA. APOA1: a protein with multiple therapeutic functions. Curr Atheroscler Rep. 2021;23(3):11. doi:10.1007/s11883-021-00906-7
35. Tang S, Tabet F, Cochran BJ, et al. Apolipoprotein A-I enhances insulin-dependent and insulin-independent glucose uptake by skeletal muscle. Sci Rep. 2019;9(1):1350. doi:10.1038/s41598-018-38014-3
36. Ivy JL. Muscle glycogen synthesis before and after exercise. Sports Med. 1991;11(1):6–19. doi:10.2165/00007256-199111010-00002
37. Tikkanen HO, Härkönen M, Näveri H, et al. Relationship of skeletal muscle fiber type to serum high density lipoprotein cholesterol and apolipoprotein A-I levels. Atherosclerosis. 1991;90(1):49–57. doi:10.1016/0021-9150(91)90243-V
38. Tang C, Houston BA, Storey C, LeBoeuf RC. Both STAT3 activation and cholesterol efflux contribute to the anti-inflammatory effect of apoA-I/ABCA1 interaction in macrophages. J Lipid Res. 2016;57(5):848–857. doi:10.1194/jlr.M065797
39. Shono N, Mizuno M, Nishida H, et al. Decreased skeletal muscle capillary density is related to higher serum levels of low-density lipoprotein cholesterol and apolipoprotein B in men. Metabolism. 1999;48(10):1267–1271. doi:10.1016/S0026-0495(99)90266-4
 © 2024 The Author(s). This work is published and licensed by Dove Medical Press Limited. The
full terms of this license are available at https://www.dovepress.com/terms
and incorporate the Creative Commons Attribution
- Non Commercial (unported, 3.0) License.
By accessing the work you hereby accept the Terms. Non-commercial uses of the work are permitted
without any further permission from Dove Medical Press Limited, provided the work is properly
attributed. For permission for commercial use of this work, please see paragraphs 4.2 and 5 of our Terms.
© 2024 The Author(s). This work is published and licensed by Dove Medical Press Limited. The
full terms of this license are available at https://www.dovepress.com/terms
and incorporate the Creative Commons Attribution
- Non Commercial (unported, 3.0) License.
By accessing the work you hereby accept the Terms. Non-commercial uses of the work are permitted
without any further permission from Dove Medical Press Limited, provided the work is properly
attributed. For permission for commercial use of this work, please see paragraphs 4.2 and 5 of our Terms.