")
Back to Journals » International Journal of General Medicine » Volume 16
Relationship Between the Expression of PD-1 and CTLA-4 on T Lymphocytes and the Severity and Prognosis of Sepsis
Authors Wang L , Zhang Z, Chen X, Yu F , Huang H, Shen X, Tan Y, Wu Q
Received 24 December 2022
Accepted for publication 3 April 2023
Published 25 April 2023 Volume 2023:16 Pages 1513—1525
DOI https://doi.org/10.2147/IJGM.S402586
Checked for plagiarism Yes
Review by Single anonymous peer review
Peer reviewer comments 2
Editor who approved publication: Dr Scott Fraser
Lang Wang,1,2,* Zhiqi Zhang,1,3,* Xingxiang Chen,1 Fang Yu,4 Hai Huang,4 Xue Shen,4 Yujie Tan,4 Qingqing Wu4
1Department of Microbiology and Immunology, School of Clinical Laboratory Science, Guizhou Medical University, Guiyang, People’s Republic of China; 2Hunan University of Medicine, Huaihua, People’s Republic of China; 3Taian City Central Hospital Affiliated to Qingdao University, Taian, People’s Republic of China; 4Center of Clinical Laboratory, the Affiliated Hospital of Guizhou Medical University, Guiyang, People’s Republic of China
*These authors contributed equally to this work
Correspondence: Qingqing Wu, Center of Clinical Laboratory, the Affiliated Hospital of Guizhou Medical University, Guiyang, People’s Republic of China, Email [email protected]
Purpose: The study aimed to investigate the relationship between the expression of PD-1 and CTLA-4 on the surface of peripheral blood T lymphocyte subsets in patients with sepsis and the severity and prognosis of the disease.
Patients and Methods: The study included patients with sepsis who were admitted to the intensive care unit. The expression of PD-1 and CTLA-4 on T lymphocyte subsets was detected by flow cytometry, and the severity of sepsis was assessed using the SOFA score.
Results: The expression of PD-1 on CD4+T cells, PD-1 on Tregs, and CTLA-4 on Tregs increased with the severity of the disease (P< 0.05). Multivariate logistic regression analysis showed that PD-1 expression on CD4+T cells, CTLA-4 expression on Tregs, and the SOFA score were independent risk factors for 28-day mortality in patients with sepsis (P< 0.05). The area under the curve of the SOFA score combined with the expression of PD-1 on CD4+T cells and CTLA-4 on Treg cells was significantly higher than any single indicator (P< 0.05). Patients with high expression of PD-1 on CD4+T cells (> 31.25%) and CTLA-4 on Tregs (> 12.64%) had a lower 28-day survival rate (P< 0.05).
Conclusion: The increased expression of PD-1 and CTLA-4 on CD4+T cells and Tregs is significantly associated with the severity and prognosis of sepsis patients. The combination of the SOFA score and the expression of PD-1 on CD4+T cells and CTLA-4 on Tregs can further improve the prognostic predictive value. These findings may be promising biomarkers for prognostic assessment, risk stratification, and identification of immunosuppression in patients with sepsis.
Keywords: sepsis, T lymphocyte subsets, programmed cell death receptor-1, cytotoxic T lymphocyte antigen-4, prognosis
Introduction
Sepsis is a life-threatening organ dysfunction caused by a dysregulated host response to infection.1 Approximately 48.9 million patients develop sepsis worldwide every year, resulting in approximately 11 million deaths. Sepsis has become an important cause of death in the intensive care unit (ICU).2 Although progress has been made in elucidating the pathogenesis of sepsis and developing medical treatments, the incidence and mortality rates of sepsis remain high. Many studies have shown that sepsis is characterized by not only an early massive inflammatory response but also a concurrent immunosuppressive state. This state may continue after the initial onset of sepsis, reducing the body’s ability to clear pathogens and causing secondary infections, leading to further aggravation of the patient’s condition and death.3,4 However, some studies suggest that some patients with sepsis do not have an early massive inflammatory response but exhibit immunosuppression.5 In addition, an increasing number of studies have confirmed that immunosuppression is the key cause of increased mortality in patients with sepsis.6,7 Discovering biomarkers that can be used to identify early immunosuppression or effectively evaluate disease prognosis and developing timely targeted treatment measures to improve the immunosuppression status and prognosis of patients constitute new research directions for further reducing the mortality rate of sepsis.
T lymphocyte exhaustion is one of the important characteristics of immunosuppression. This process involves many factors, and molecules that inhibit T lymphocytes are important mediators of this process.8,9 Programmed cell death 1 (PD-1) and cytotoxic T lymphocyte antigen 4 (CTLA-4) are important inhibitory molecules in the activation of antigen-specific T cells. They can bind to ligands on antigen-presenting cells (APCs) and inhibit the immune response mediated by effector T cells.10,11 Preclinical studies have shown that higher expression levels of CTLA-4 and PD-1 on CD4+ T cells, CD8+ T cells and regulatory T cells (Tregs) are observed in the spleens of septic mice compared to controls. These changes are accompanied by T-cell apoptosis, death and exhaustion.12,13 Clinical studies also suggest that high expression of PD-1 on T cells in patients with sepsis is significantly associated with decreased T-cell proliferation and increased nosocomial secondary infection.14–16 Additionally, increased expression of CTLA-4 on T lymphocytes was found to be associated with T-cell exhaustion, resulting in an immunosuppressed state in patients.17 Therefore, the inhibitory molecules PD-1 and CTLA-4 are considered to play a key role in the immunosuppressive stage of sepsis. They can participate in immune regulation in sepsis by regulating the function of T lymphocytes.18,19
Despite the growing evidence that suggests the involvement of PD-1 and CTLA-4 in the immunosuppressive state of sepsis, the relationship between their expression on T cells in septic patients and disease severity and prognosis is not well studied. Previous studies have focused on relatively simple sepsis-related indicators, and there has been no detailed and systematic evaluation of their significance for the prognosis of sepsis. Therefore, this study aims to assess the expression levels of PD-1 and CTLA-4 on the surface of peripheral blood T lymphocytes in septic patients, analyze their relationship with T lymphocyte apoptosis, patient conditions, and prognosis, and explore reliable biomarkers to provide references for risk stratification, early diagnosis, treatment, and prognostic evaluation of sepsis.
Materials and Methods
Study Population
According to the diagnostic criteria for sepsis defined by the American Society of Critical Care Medicine and the European Society of Critical Care Medicine in 2016,1 fifty-six patients with sepsis who fulfill the diagnostic criteria of sepsis or septic shock at presentation to the Intensive Care Unit (ICU) of the Affiliated Hospital of Guizhou Medical University from October 2020 to September 2021 and 20 healthy individuals who were matched for sex and age in the physical examination center of our hospital were selected as the research subjects. None of the healthy subjects had any recent history of infection, disease affecting immune system homeostasis, and abnormalities in routine laboratory examinations. All patients with sepsis after enrollment were followed up for 28 days, and their outcomes were recorded within 28 days. Inclusion criteria for research objects: (1) The age is between 18 and 80 years old; (2) Comply with the diagnostic criteria for sepsis in the latest International Consensus on Sepsis and Septic Shock (Sepsis-3) proposed by the International Society of Critical Illness in 2016 [1], that is, severe infection in the body leading to organ dysfunction and sequential organ failure.When the score (SOFA) is≥2, sepsis can be diagnosed; Despite adequate fluid resuscitation or vasopressor medication on the basis of sepsis, hypotension persists, requiring vasopressin to maintain mean arterial pressure MAP65≥65 mmHg, and despite sufficient volume resuscitation, serum lactate levels are>2Mmol/L, according to these criteria, can be diagnosed as septic shock.The exclusion criteria were as follows: (1) patients with malignant tumors, hematological diseases and autoimmune diseases; (2) patients with HIV infection or other immunodeficiency diseases; (3) patients receiving organ transplantation; (4) pregnant patients and patients who recently received immunosuppressive therapy; (5) patients with incomplete clinical data; and patients with non septic causes of death, such as cardiogenic shock, severe cardiovascular disease, and acute myocardial infarction.This study is in line with the Helsinki Declaration and its subsequent amendments. This study was reviewed and approved by the Ethics Committee of the Affiliated Hospital of Guizhou Medical University, and all patients or relatives signed informed consent forms(Approval Number:2,021,583).
Collection of Clinical Data
Basic data, such as sex, age, location of the primary infection, complications and etiological identification results within 24 hours after the diagnosis of sepsis, as well as absolute lymphocyte count and procalcitonin (PCT), interleukin-6 (IL-6) and C-reactive protein (CRP) level data, were collected. The clinicians calculated acute physiology and chronic health evaluation II (APACHE II) and sepsis-related organ failure assessment (SOFA) scores within 24 hours after the patients were enrolled according to the relevant clinical and demographic data.
Blood Collection and Processing
Written informed consent was obtained from the patient or family member. Peripheral venous blood was collected within 24 hours after a patient was diagnosed with sepsis, and 3 mL of peripheral venous blood was collected from the healthy controls during the same period. The blood samples were placed in an anticoagulant tube containing dipotassium ethylenediaminetetraacetic acid (EDTA) and processed within 4 hours of collection. Peripheral blood mononuclear cells (PBMCs) were isolated by density gradient separation. PBMCs were washed two times in phosphate-buffered saline (PBS), and the cells were resuspended for subsequent experiments.
Analysis of the Proportions of T-Cell Subsets and the Expression of PD-1 and CTLA-4 on T Cells
Antibodies for flow cytometry were purchased from BioLegend (USA) or BD Biosciences (USA). The cells were stained with monoclonal antibodies and isotype controls according to the manufacturer’s recommendation. The following antibodies were used: PerCP-Cy5.5-labeled anti-human CD3, FITC-labeled anti-human CD4, APC-Cy7-labeled anti-human CD8, APC-labeled anti-human CD25, PE-labeled anti-human CD127, BV421-labeled anti-human CD152 (CTLA-4), and PE-Cy7-labeled anti-human CD279 (PD-1). An IgG 2a isotype control antibody was also used. Then, 100 μL of the prepared cell suspension (approximately 1×10⁶ cells) was added to the corresponding flow tube. All samples were run on a FACS CantoTM II flow cytometer (BD Biosciences, USA), and the data were further analyzed using FACS Diva software (BD Biosciences). Viable lymphocytes were gated by forward angle scatter (FSC) and side angle scatter (SSC), and T lymphocyte subsets were further identified by CD3, CD4 and CD8 immunostaining. Regulatory T cells were identified as CD4+CD127low and CD25+CD127low cells. At least 50,000 lymphocytes were analyzed from each sample. The results are expressed as the percentage of PD-1-expressing T lymphocytes relative to total PD-1+T lymphocytes and the percentage of CTLA-4-expressing T lymphocytes relative to total CTLA-4+ T lymphocytes.
Analysis of the Apoptosis Rate of T Lymphocyte Subsets
Cell suspensions (100 μL, approximately 1×10⁶ cells) were incubated for 15 min with Percp-Cy5.5-labeled anti-human CD3, BV510-labeled anti-human CD4 and APC-Cy7-labeled anti-human CD8. The cells were washed twice with PBS buffer, and the supernatant was discarded. The cells were then resuspended in 200 µL of 1× Binding Buffer. The cells were double stained with FITC-labeled annexin V and PE-labeled propidium iodide (PI) and incubated at room temperature for 20 min in the dark. All samples were run on a FACS CantoTM II flow cytometer (BD Biosciences) within 1 hour, and the data were further analyzed using FACS Diva software (BD Biosciences). Lymphocytes were gated by FSC and SSC, and T lymphocyte subsets were further identified by CD3, CD4 and CD8 immunostaining. The results are expressed as the percentage of each cell population positive for annexin-V and negative for PI, and the percentage of each apoptotic group was statistically analyzed.
Statistical Analysis
All data were analyzed using SPSS 25.0 software. Measurement data that were normally distributed are presented as the mean ± standard deviation (x±s), and the independent sample t test was used for comparison between groups; count data are presented as cases or percentages, and comparisons were performed by the x2 test. Nonnormally distributed measurement data are presented as the median (interquartile range) [M(QR)], and the Mann–Whitney U-test was performed for comparisons. The Pearson correlation test was used for correlation analysis. Binary logistic regression analysis was used to identify variables associated with poor 28-day prognosis in patients with sepsis. Receiver operating characteristic (ROC) curves were used to analyze the predictive value of different indicators of patient prognosis. The variables were stratified using the cutoff value determined by the ROC curve, a Kaplan-Meier survival curve was established, and the Log rank test was used to analyze the 28-day survival rate of patients. P<0.05 was considered statistically significant.
Results
Baseline Characteristics of Septic Patients
According to the inclusion and exclusion criteria of this study, 48 patients with sepsis were enrolled, including 27 males and 21 females, with an average age of 65.98±13.07 years (Supplementary Figure 1). During the same period, 20 healthy people who were matched for sex and age were included, including 11 males and 9 females, with an average age of 64.50±8.32 years. The sex and age of the septic patients were not significantly different from those of the healthy controls (P>0.05). Among the 48 septic patients, 25 patients tested positive for pathogenic bacteria (52.08%), and 14 patients had positive blood cultures (29.17%). The septic patients included 36 survivors and 12 nonsurvivors, and the 28-day mortality was 25% (Supplementary Figure 1). The most common primary infection site was the lung (41.67%), followed by the urinary system and abdominal cavity. Cardiovascular system diseases were the most common underlying diseases (60.42%). A total of 35 strains of pathogenic bacteria were detected in 48 patients with sepsis, the most common of which was gram-negative bacilli (54.29%). The PCT, IL-6, SOFA and APACHE II scores of nonsurvivors of sepsis were significantly higher than those of survivors (P<0.05). No significant differences were observed between sepsis survivors and nonsurvivors with respect to sex, age, CRP, positive blood culture, positive bacteriology, number of comorbidities, primary infection site, type of pathogen infection, or underlying diseases (P>0.05) (Supplementary Table 1).
Comparison of T Lymphocyte Subsets
In this study, flow cytometry was used to determine the percentages of CD3+ T cells, CD4+ T cells, CD8+ T cells and CD4+CD25+CD127low regulatory T cells in the peripheral blood of septic patients and healthy subjects. Compared with those in the healthy controls, the percentages of CD3+ T and CD4+ T cells in septic patients were significantly reduced (P<0.05), and the percentage of Treg cells was significantly increased (P<0.001) (Supplementary Table 2). Regarding the 28-day prognosis in septic patients, compared with survivors, the percentage of CD4+ T cells in nonsurvivors was significantly decreased (P<0.05), and the percentage of Tregs was significantly increased (P<0.01). There was no significant difference in the percentage of CD8+ T cells between the two groups (P>0.05) (Supplementary Figure 2).
Comparison of the Apoptosis Rates of T Lymphocyte Subsets
In this study, CD4+ T-cell apoptosis and CD8+ T-cell apoptosis in the peripheral blood of sepsis patients and healthy controls were evaluated by flow cytometry. The results showed that compared with those in the healthy controls, the ratios of apoptotic CD4+ T cells and CD8+ T cells in sepsis patients were significantly increased (P<0.001) (Supplementary Figure 3).
Comparison of the Expression of PD-1 and CTLA-4 on T Lymphocyte Subsets
The expression of PD-1 and CTLA-4 on T cells in the peripheral blood was determined within 24 hours from enrollment of patients with sepsis. The expression of PD-1 and CTLA-4 on CD4+ T cells, CD8+ T cells and Tregs in septic patients were significantly increased compared with that in healthy controls (P<0.01) (Figures 1 and 2). As the disease progressed, the expression of PD-1 and CTLA-4 on CD4+ T cells and Tregs was significantly higher in patients presented with septic shock compared to those presented with sepsis (P<0.05) (Figure 3). Interestingly, when we analyzed septic patients with different prognoses, the expression levels of PD-1 and CTLA-4 on CD4+ T cells and Tregs in nonsurvivors of sepsis were significantly higher than those in survivors (P<0.05); however, there was no significant difference in the expression of PD-1 in CD8+ T cells between the two groups (Figure 3).
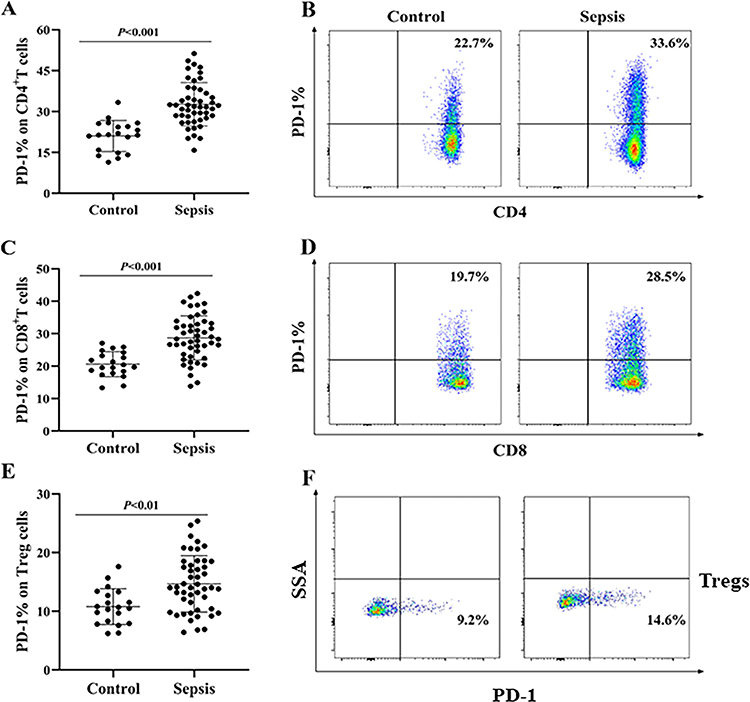 |
Figure 1 Comparison of the expression of PD-1 on T lymphocyte subsets in patients with sepsis and healthy individuals. (A, C and E) Representative dot plot of the comparison of PD-1 expression on CD4+ T cells, CD8+ T cells and Tregs in septic patients and healthy individuals. (B, D and F) Typical flow chart of the differences in PD-1 expression on the surface of CD4+ T cells, CD8+ T cells and Tregs between septic patients and healthy individuals. The data were obtained from 48 patients with sepsis (48 data points) and 20 healthy individuals (20 data points), each of which represents a single individual. P<0.05 indicates a statistically significant difference. |
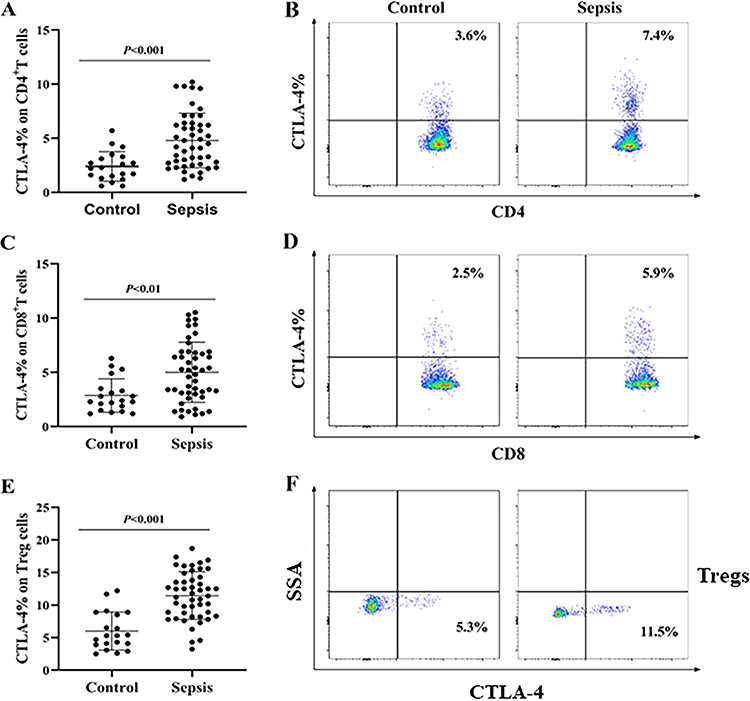 |
Figure 2 Comparison of the expression levels of CTLA-4 on T lymphocyte subsets in patients with sepsis and healthy individuals. (A, C and E) Representative dot plot of the comparison of CTLA-4 expression on CD4+ T cells, CD8+ T cells and Tregs in septic patients and healthy individuals. (B, D and F) Typical flow chart of the differences in CTLA-4 expression on the surface of CD4+ T cells, CD8+ T cells and Tregs between septic patients and healthy individuals. The data were obtained from 48 patients with sepsis (48 data points) and 20 healthy individuals (20 data points), each of which represents a single individual. P<0.05 indicates a statistically significant difference. |
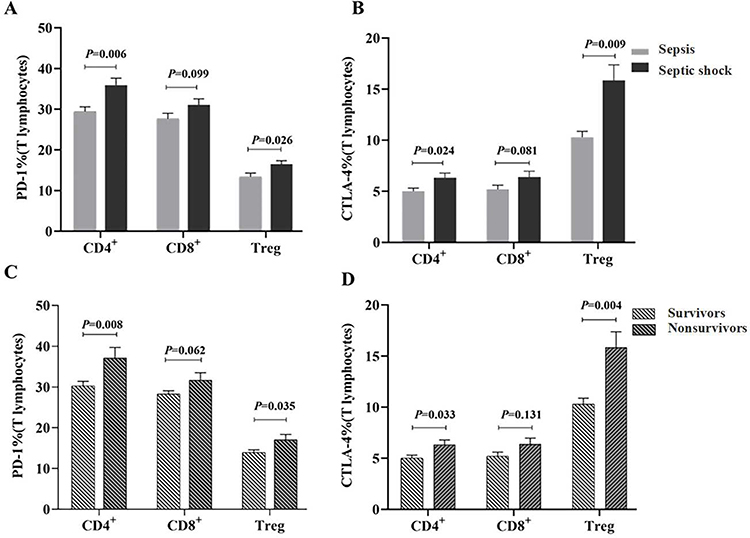 |
Figure 3 The expression of PD-1 and CTLA-4 on T lymphocyte subsets in patients with sepsis. (A and B) The percentage of PD-1 and CTLA-4 on CD4+ T cells, CD8+ T cells and Tregs in sepsis (n=29) and septic shock (n=19). (C and D) The percentages of PD-1 and CTLA-4 on CD4+ T cells, CD8+ T cells and Tregs in survivors (n=36) and nonsurvivors (n=12). |
Correlation Analysis of PD-1 and CTLA-4 Expression in T Lymphocyte Subsets with Apoptosis and SOFA and APACHE II Scores in Septic Patients
Pearson correlation analysis showed that the percentages of CD4+ T cells and Tregs expressing PD-1 and the percentages of Tregs expressing CTLA-4 were positively correlated with the APACHE II and SOFA scores in septic patients (P<0.05) (Table 1). Studies have shown that apoptosis of T lymphocytes is crucial in the pathophysiology of sepsis and that a decrease in the number of lymphocytes is related to an increase in the rate of lymphocyte apoptosis, which leads to impaired immunity in patients.20,21 The potential role of PD-1 and CTLA-4 expressed on T cells in lymphocyte apoptosis and the relationship between PD-1 and CTLA-4 expression on T cells and lymphocyte apoptosis were further clarified. We studied the relationship between the expression of PD-1 and CTLA-4 on T lymphocyte subsets and T-cell apoptosis. The results showed that the percentage of CD4+Annexin V+ cells (the CD4+ T-cell apoptosis rate) was positively correlated with the expression of PD-1 on CD4+ T cells and Treg cells and the expression of CTLA-4 on Tregs (P<0.05). The percentage of CD8+Annexin V+ cells (the CD8+ T-cell apoptosis rate) was positively correlated with the expression of PD-1 on CD4+ T cells and the expression of CTLA-4 on Tregs (Table 2).
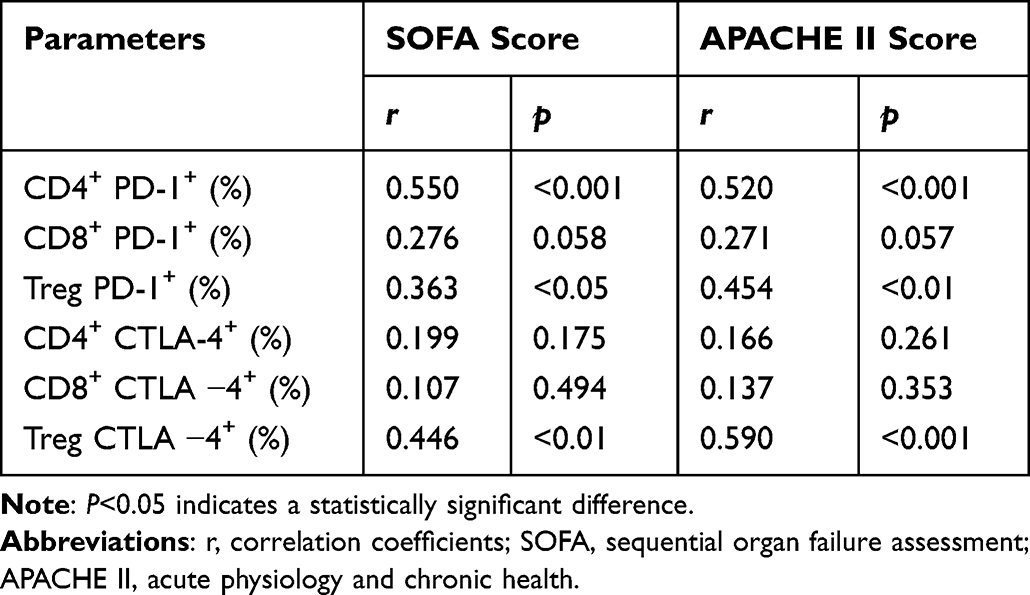 |
Table 1 Correlation Analysis of SOFA Score, APACHE II Score and Expression of PD-1 and CTLA-4 in T Lymphocyte Subsets in Septic Patients |
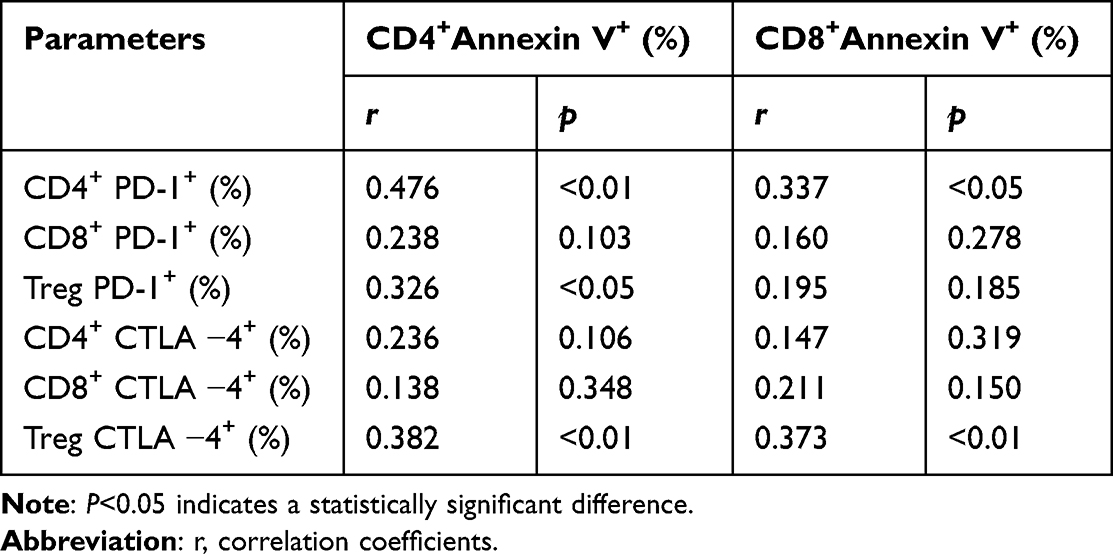 |
Table 2 Correlation Between Apoptosis of T-Cell Subsets and PD-1 and CTLA-4 Expression in Patients with Sepsis |
Independent Risk Factors for 28-Day Prognosis in Patients with Sepsis
To further clarify the relationship between the expression levels of each index and the 28-day prognosis of patients with sepsis, we used multivariate logistic regression to analyze the independent risk factors for 28-day mortality of patients with sepsis. First, we screened out the parameters that were significantly different in the univariate analysis between sepsis survivors and nonsurvivors (P<0.05). Then, to ensure the stability of the regression parameters, the parameters that significantly differed were diagnosed by multicollinearity (Supplementary Table 3). The 28-day prognosis of patients with sepsis was taken as the dependent variable (assignment: 0=survivors, 1=nonsurvivors) after the colinear indicators in the Supplementary Table 3 (percentage of CD4+ T cells and Tregs) were excluded. PCT, IL-6, ALC, CD4+ PD-1+, CD4+ CTLA-4+, Treg PD-1+, Treg CTLA-4+, SOFA score and APACHE II score in septic patients were used as independent variables and were included in the multivariate logistic regression model after excluding the influence of confounding factors such as sex, age, underlying diseases, and primary infection site. The results showed that the SOFA score (OR=4.267, P<0.05), PD-1+ CD4+ T cells (OR=1.205, P<0.05) and CTLA-4+ Tregs (OR=1.325, P<0.05) were independent risk factors for poor prognosis (Table 3).
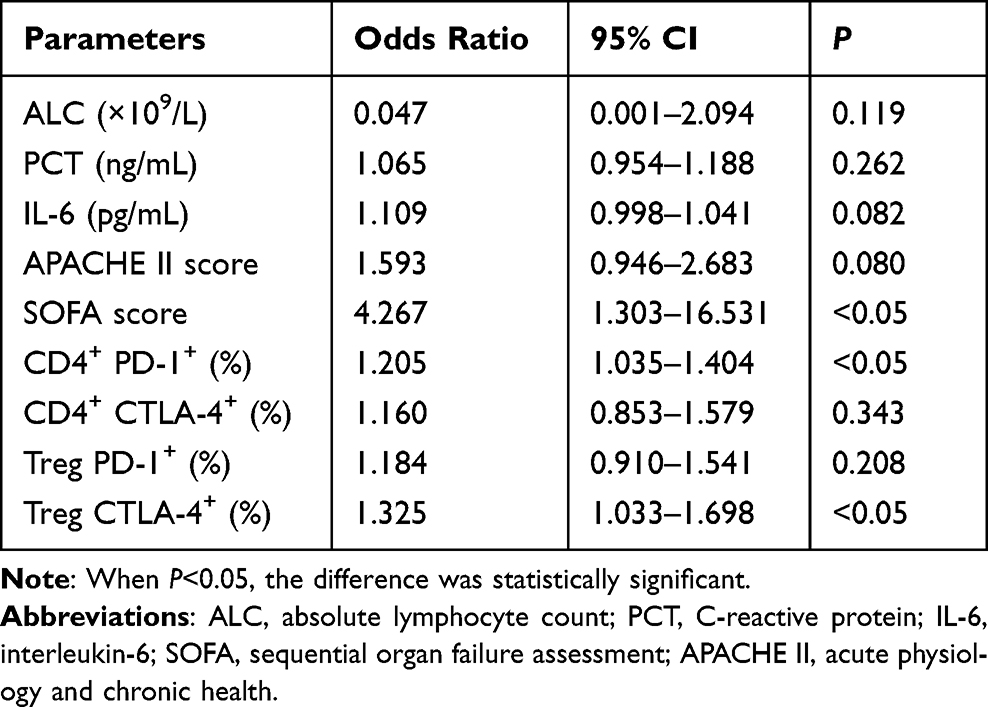 |
Table 3 Multivariate Logistic Analysis of 28-Day Prognosis in Patients with Sepsis |
Predictive Value of Independent Risk Factors for 28-Day Prognosis in Patients with Sepsis
ROC curve analysis showed that the SOFA score, PD-1 expression on CD4+ T cells and CTLA-4 expression on Tregs predicted the 28-day prognosis of patients with sepsis. The areas under the ROC curve (AUCs) were 0.767 (95% CI=0.631–0.904), 0.756 (95% CI=0.767–0.895), and 0.747 (95% CI=0.604–0.889), respectively, and had certain predictive value for the 28-day prognosis of septic patients (P<0.01). When the expression of PD-1 on CD4+ T cells was combined with the SOFA score, the AUC was 0.822 (95% CI=0.685–0.959), sensitivity was 83.3%, and specificity was 77.8%. When the expression of CTLA-4 on Tregs was combined with the SOFA score, the AUC was 0.813 (95% CI=0.693–0.931), sensitivity was 91.7%, and specificity was 69.4%. This study revealed that the predictive value of the SOFA score combined with CD4+ T-cell PD-1 and Treg cell CTLA-4 expression was significantly higher than that of any single indicator (P<0.001) and had higher sensitivity (Table 4 and Figure 4).
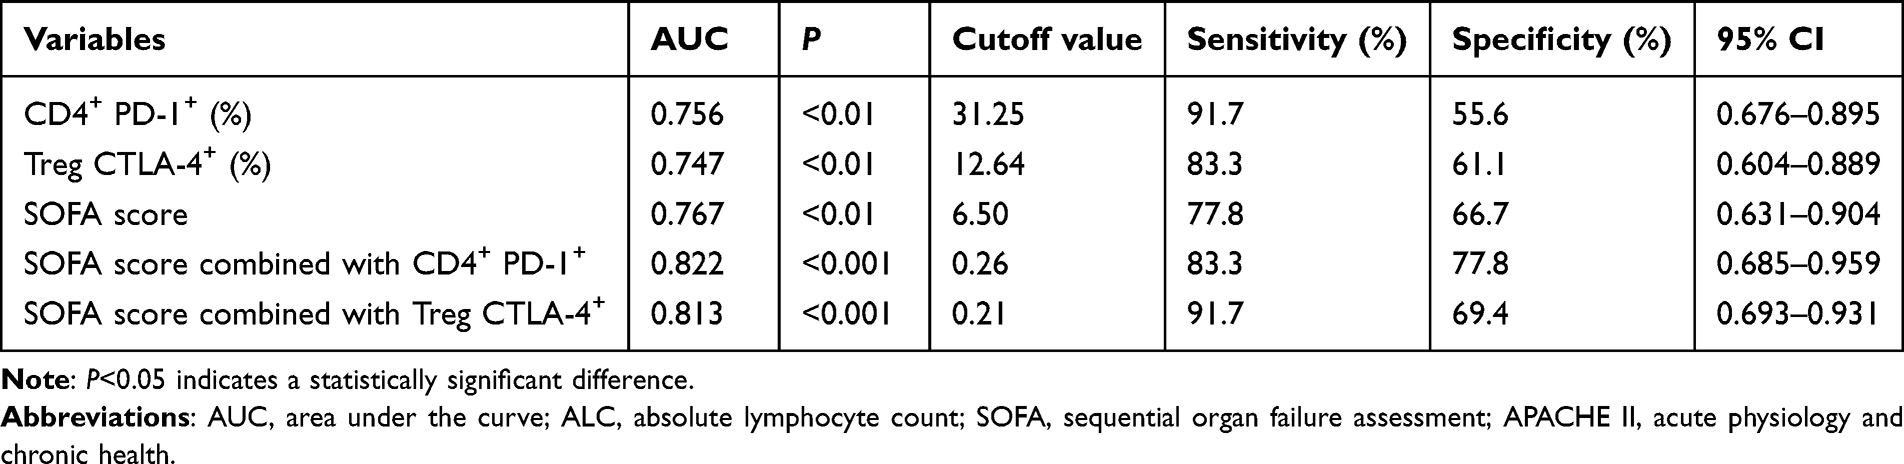 |
Table 4 Predictive Value of Different Indices in Predicting the 28-Day Prognosis of Patients with Sepsis |
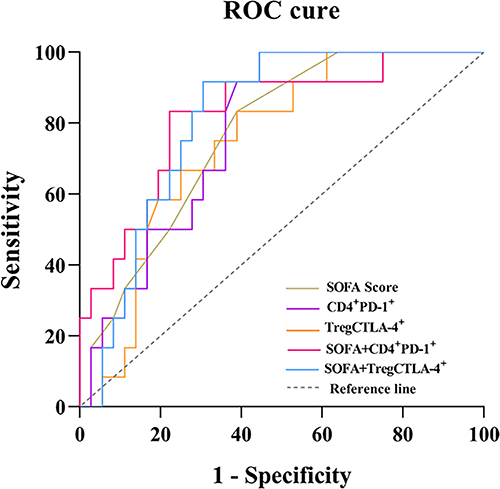 |
Figure 4 ROC curve analysis of different indices predicting 28-day prognosis in patients with sepsis. Abbreviations: SOFA, sequential organ failure assessment; APACHE II, acute physiology and chronic health. AUC, area under the curve. Notes: SOFA (AUC=0.767, P<0.01); CD4+PD-1+ (AUC=0.756, P<0.01); TregCTLA-4+ (AUC=0.747, P<0.01); SOFA and CD4+PD-1+ combined detection (AUC=0.822, P<0.001); SOFA and TregCTLA-4+ combined detection (AUC=0.813, P<0.001). |
Analysis of the 28-Day Survival Rate of Septic Patients
The cutoff value determined by the above ROC curve analysis was used to stratify the expression levels of CD4+ T-cell PD-1 and Treg cell CTLA-4 in septic patients, and the Kaplan-Meier survival curve was then established. The Log rank test was used for the analysis of the 28-day survival rate of patients with sepsis. Kaplan-Meier curve analysis showed that a higher percentage of PD-1+ CD4+ T cells (>31.25%) in septic patients was associated with a higher mortality at 28 days compared with a lower percentage of PD-1+ CD4+ T cells (≤31.25%) (Figure 5). Additionally, we found that, compared with a lower percentage of CTLA-4+ Tregs (≤12.64%), a higher percentage of CTLA-4+ Tregs (>12.64%) in septic patients was associated with a higher mortality at 28 days (Figure 5).
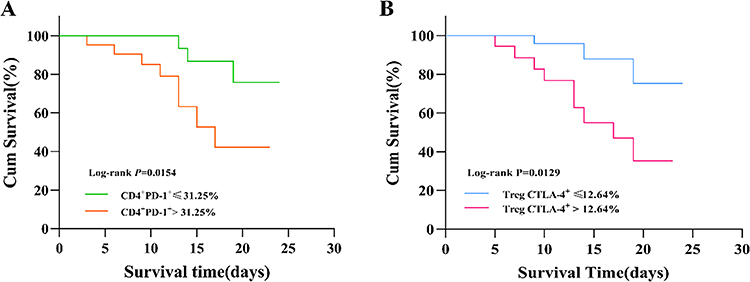 |
Figure 5 Twenty-eight-day survival curves of septic patients. (A) Twenty-eight-day survival curves of patients with different expression levels of PD-1 on CD4+ T cells. A percentage of PD-1+ CD4+ T cells >31.25% was associated with a higher mortality at 28 days compared with lower levels. (B) Twenty-eight-day survival curves of patients with different expression levels of CTLA-4 on Tregs. A percentage of PD-1+ Tregs >12.64% was associated with a higher mortality at 28 days compared with lower levels. |
Discussion
The pathogenesis of sepsis is a complex process involving multiple factors, such as imbalance of the inflammatory response, immune dysfunction and coagulation dysfunction.22,23 In particular, the immune function of the body plays a crucial role in the occurrence and development of sepsis, and it is also one of the hotspots of current research on the pathogenesis of sepsis.24,25 Numerous studies have shown that immunosuppression is the main cause of secondary infection and high mortality in patients with sepsis.6,7,26 There are many mechanisms of immunosuppression, including T lymphocyte depletion, which mainly leads to T lymphocyte dysfunction, dysregulation of cytokine secretion, decreased proliferation ability, and increased apoptosis. The main characteristic of T-cell exhaustion is the overexpression of various inhibitory molecules, such as PD-1, CTLA-4, and Tim-3, which mediate the process of T lymphocyte depletion.27,28 It is also a major driver of immune response impairment and reduced antimicrobial capacity in patients. Targeting immunosuppression may be a new strategy for the treatment of sepsis.
T lymphocytes, which mainly include CD4+ T cells and CD8+ T-cell subsets, are the main effector cells that mediate cellular immune responses and play an important role in eliminating infectious pathogens from the body.29 Both PD-1 and CTLA-4 are important inhibitory molecules on the surface of T lymphocytes, and they act by competitively inhibiting the binding of receptors and their ligands to generate inhibitory signals to inhibit the proliferation and activation of T lymphocytes.10,11 In sepsis, these inhibitory molecules are considered the main cause of T lymphocyte exhaustion, and their expression levels indicate the degree of immunosuppression in the body.6,28 Currently, there are few studies on the correlation between PD-1 and CTLA-4 expression and the condition and prognosis of septic patients. In this study, it was found that the expression of PD-1 and CTLA-4 on CD4+ T cells, CD8+ T cells and Tregs was significantly increased in patients with sepsis compared with healthy controls, which was similar to the results of previous studies.13–16 We speculate that the inflammatory response and persistent antigenic stimulation may enhance the expression of PD-1 and CTLA-4 in patients with sepsis, leading to immune dysfunction. Our study also showed that with the progression of sepsis, the expression of PD-1 and CTLA-4 on CD4+ T cells and Tregs was significantly higher in patients with septic shock than in patients with sepsis. The expression of PD-1 on CD4+ T and Treg cells and the expression of CTLA-4 on Treg cells were positively correlated with the SOFA and APACHE II scores. SOFA and APACHE II are routine scoring systems used for critically ill patients, and SOFA and APACHE II scores are related to disease severity and prognosis.21,30 Therefore, this study suggests that as the expression levels of PD-1 and CTLA-4 in T lymphocyte subsets are gradually increased, the patient’s condition is gradually aggravated and organ failure is also more serious. In addition, regarding the 28-day prognosis of septic patients, we observed that the expression of PD-1 and CTLA-4 on CD4+ T cells and Tregs in nonsurvivors of sepsis was significantly higher than that in survivors.The above research results all suggest that the expression of the T lymphocyte subsets PD-1 and CTLA-4 may be involved in the immunosuppressive process of sepsis, and there may be a synergistic effect with each other. The severity of organ damage is related to poor prognosis, and it may also be an effective indicator to reflect disease severity and organ failure degree in patients with sepsis. It is worth noting that this study revealed that the expression levels of PD-1 and CTLA-4 on CD8+ T cells were not significantly different between septic patients with different disease severities and prognoses, nor were they independent risk factors for death within 28 days in septic patients. Therefore, the expression of PD-1 and CTLA-4 in CD8+ T cells may not be an important indicator for the condition and prognosis of patients with sepsis.
It is well known that sepsis progresses rapidly and that delays in diagnosis or treatment lead to exacerbation of the disease, severe immunosuppression, and eventually increased mortality.31 Therefore, finding reliable biomarkers is crucial for the early diagnosis, treatment, risk stratification and prognostic assessment of sepsis.32,33 Through univariate and multivariate logistic regression analyses, we showed that the SOFA score, PD-1 expression on CD4+ T cells and CTLA-4 expression on Tregs were independent risk factors affecting the prognosis of patients at 28 days. Further ROC curve analysis showed that the expression of PD-1 on CD4+ T cells and the expression of CTLA-4 on Tregs had a certain predictive value for the 28-day mortality of patients and that the 28-day mortality of patients with enhanced PD-1 expression on CD4+ T cells and CTLA-4 expression on Tregs was higher, and the survival rate was decreased. Therefore, this study suggests that PD-1 expression on CD4+ T cells and CTLA-4 expression on Tregs may be effective markers for risk stratification and prognostic assessment in patients with sepsis. Studies have shown that the analysis of IL-6 and PCT expression can aid in the timely and accurate diagnosis and treatment of sepsis, and IL-6 and PCT are currently the most commonly used clinical markers for the diagnosis and management of sepsis.34–36 However, we observed that IL-6 and PCT levels were not independent risk factors for patient prognosis, nor could they predict 28-day mortality in sepsis patients (data not shown). One of the reasons for this discrepancy may be the insufficient sample size of this study. Taken together, these results suggest that the expression of PD-1 and CTLA-4 on T cells may predict prognosis in septic patients earlier than conventional sepsis markers such as IL-6 and PCT. Of course, more research is needed to prove this conclusion.
Currently, there are no absolutely sensitive and specific biomarkers, and the combination of multiple indicators can allow clinicians to harness the advantages of each and provide more comprehensive patient and disease information in the clinic.37 Consistently, we found another interesting result: the expression of PD-1 on CD4+ T cells or the expression of CTLA-4 on Treg cells, when used in combination with the SOFA score, was significantly better at predicting 28-day mortality than any single indicator and had improved sensitivity and specificity for the assessment of sepsis prognosis. While SOFA score items include the blood system, circulatory system, respiratory system, liver and kidney function and other related clinical evaluation indicators,1 there is a lack of relevant indicators for immune system evaluation. The results of this study combined with those of previous studies14–16,28 show that the expression of PD-1 and CTLA-4 on T lymphocytes can reflect the immune status of the body to a certain extent. Therefore, the results of this study suggest that the expression of PD-1 on CD4+ T cells and CTLA-4 on regulatory T cells improves the predictive ability of the clinical critical care scoring system in evaluating the prognosis of patients with sepsis and can better help clinicians evaluate the prognosis of septic patients.
It is worth noting that the inhibitory molecules PD-1 and CTLA-4 are also highly expressed in tumors. When PD-1 and CTLA-4 are targeted, the antitumor immunity of T cells is enhanced, and the median survival of patients is prolonged.38,39 Interest in sepsis has greatly increased due to the similar immunosuppression status of septic patients and tumor patients. In addition, we also observed an increase in the apoptosis rate of T lymphocytes in patients with sepsis and found that the expression of PD-1 on CD4+T and Treg cells and the expression of CTLA-4 on Treg cells were positively correlated with the apoptosis rate of T lymphocytes. The high expression of PD-1 and CTLA-4 on T cells may inhibit lymphocyte function and induce their apoptosis. In animal studies, the application of anti-PD-1 and anti-CTLA-4 antibodies has been shown to reduce sepsis-induced apoptosis, reverse sepsis-induced immunosuppression and improve survival.12,13,40 Clinical studies have also demonstrated that anti-PD-1 antibodies can reduce apoptosis and improve the ability of CD8+ T lymphocytes to secrete IFN-γ and IL-2 in patients with sepsis.41 Based on the above studies, we know that PD-1 and CTLA-4 are important molecules involved in mediating immunosuppression in sepsis and play an important regulatory role in the immune system in sepsis. The high expression of PD-1 and CTLA-4 in T lymphocyte subsets in patients with sepsis may reduce the proportion of T lymphocytes and increase apoptosis, leading to immune dysfunction and immunosuppression. Therefore, it is possible to improve the immune function of patients and prevent the occurrence of immunosuppression by inhibiting the apoptosis of lymphocytes during sepsis. This suggests that PD-1 and CTLA-4 may be new directions and potential targets for sepsis immunotherapy, which warrants further study.
Our study had several limitations. First, it was limited to a single center, and more importantly, we formulated strict inclusion and exclusion criteria, excluding patients with some underlying diseases and drug treatment history that may affect the patient’s immunity, resulting in fewer included cases. However, the relationship between the expression of the inhibitory molecules PD-1 and CTLA-4 and the severity and prognosis of sepsis may be more accurately reflected in these non-immunocompromised patients. Second, we only collected clinical samples within 24 hours after diagnosis, and we cannot guarantee whether the expression of PD-1 and CTLA-4 changes with the progression of the disease and whether the dynamic changes in the indicators have better predictive value for the evaluation of prognosis, which is worth further research confirmation. Third, due to the different flow cytometry instruments used in different laboratories, there may be differences in the index thresholds for patient risk stratification and prognosis assessment. It is necessary to establish a standard protocol in different laboratories. Therefore, in future clinical research, to further explore the immunosuppressive mechanism in patients with sepsis and draw a wider and more accurate clinically significant conclusion, a multicenter, prospective study with a larger sample size is needed.
Conclusion
This study showed that the expression of PD-1 on CD4+T cells and CTLA-4 on Tregs is an independent risk factor affecting the 28-day prognosis of patients with sepsis, and its expression level is closely related to the severity and prognosis of patients with sepsis. We found that the combined detection of SOFA score and the expression of CTLA-4 on CD4+T cells PD-1 and Tregs can further improve the predictive value of prognosis in patients with sepsis. Therefore, this study suggests that the expression of CD4+T cell PD-1 and Treg cell CTLA-4 may be effective biomarkers for prognosis evaluation, risk stratification and recognition of immunosuppression in patients with sepsis.
Data Sharing Statement
The datasets used to support the findings of this study are available from the first author and corresponding authors on reasonable request.
Ethics Approval and Consent to Participate
This study was performed in line with the principles of the Declaration of Helsinki. Approval was granted by the Ethics Committee of the Affiliated Hospital of Guizhou Medical University. Written informed consent was obtained from the patients or, if not possible, from their relative as designed by ethic committee.
Acknowledgments
The authors thank the subjects for their participation in this study and the staff of the hospital for their help in collecting and recording the data.
Funding
This work was supported by the Natural Science Project of Guizhou Province (Grant No. ZK-2022-441) and Doctoral Research Startup Fund in 2021 (Grant No. gyfybsky-2021-47).
Disclosure
The author(s) declared no potential conflicts of interest with respect to the research, authorship and/or publication of this article.
References
1. Singer M, Deutschman CS, Seymour CW. The third international consensus definitions for sepsis and septic shock (Sepsis-3). JAMA. 2016;315(8):801–810. doi:10.1001/jama.2016.0287
2. Rudd KE, Johnson SC, Agesa KM, et al. Global, regional, and national sepsis incidence and mortality, 1990-2017: analysis for the Global Burden of Disease Study. Lancet. 2020;395(10219):200–211.
3. Mira JC, Gentile LF, Mathias BJ, et al. Sepsis pathophysiology, chronic critical illness, and persistent inflammation-immunosuppression and catabolism syndrome. Crit Care Med. 2017;45(2):253–262.
4. Angus DC, Opal S. Immunosuppression and Secondary Infection in Sepsis: part, Not All, of the Story. JAMA. 2016;315(14):1457–1459.
5. Shankar-Hari M, Harrison DA, Rubenfeld GD, et al. Epidemiology of sepsis and septic shock in critical care units: comparison between sepsis-2 and sepsis-3 populations using a national critical care database. Br J Anaesth. 2017;119(4):626–636.
6. Patil NK, Bohannon JK, Sherwood ER. Immunotherapy: a promising approach to reverse sepsis-induced immunosuppression. Pharmacol Res. 2016;111:688–702.
7. Shin J, Jin M. Potential Immunotherapeutics for Immunosuppression in Sepsis. Biomol Ther (Seoul). 2017;25(6):569–577.
8. Wherry EJ, Kurachi M. Molecular and cellular insights into T cell exhaustion. Nat Rev Immunol. 2015;15(8):486–499.
9. Pauken KE, Wherry EJ. Snap Shot: t Cell Exhaustion. Cell. 2015;163(4):1038.
10. Wakeley ME, Gray CC, Monaghan SF, et al. Check point inhibitors and their role in immunosuppression in sepsis. Crit Care Clin. 2020;36(1):69–88.
11. McBride MA, Patil TK, Bohannon JK, et al. Immune Checkpoints: novel Therapeutic Targets to Attenuate Sepsis-Induced Immunosuppression. Front Immunol. 2021;11:624272.
12. Inoue S, Bo L, Bian J, et al. Dose-dependent effect of anti-CTLA-4 on survival in sepsis. Shock. 2011;36(1):38–44.
13. Brahmamdam P, Inoue S, Unsinger J, et al. Delayed administration of anti-PD-1 antibody reverses immune dysfunction and improves survival during sepsis. J Leukoc Biol. 2010;88(2):233–240.
14. Choi YJ, Kim SB, Kim JH, et al. Impaired polyfunctionality of CD8+ T cells in severe sepsis patients with human cytomegalovirus reactivation. Exp Mol Med. 2017;49(9):e382.
15. Liu Q, An L, Qi Z, et al. Increased Expression of Programmed Cell Death-1 in Regulatory T Cells of Patients with Severe Sepsis and Septic Shock: an Observational Clinical Study. Scand J Immunol. 2017;86(5):408–417.
16. Zhang Y, Li J, Lou J, et al. Upregulation of programmed death-1 on T cells and programmed death ligand-1 on monocytes in septic shock patients. Crit Care. 2011;15(1):R70.
17. Boomer JS, Shuherk-Shaffer J, Hotchkiss RS, et al. A prospective analysis of lymphocyte phenotype and function over the course of acute sepsis. Crit Care. 2012;16(3):R112.
18. Fallon EA, Biron-Girard BM, Chung CS, et al. A novel role for coinhibitory receptors/checkpoint proteins in the immunopathology of sepsis. J Leukoc Biol. 2018;1:543.
19. Rudick CP, Cornell DL, Agrawal DK. Single versus combined immunoregulatory approach using PD-1 and CTLA-4 modulators in controlling sepsis. Expert Rev Clin Immunol. 2017;13(9):907–919.
20. Atmatzidis S, Koutelidakis IM, Chatzimavroudis G, et al. Detrimental effect of apoptosis of lymphocytes at an early time point of experimental abdominal sepsis. BMC Infect Dis. 2011;20(11):321.
21. Karakike E, Kyriazopoulou E, Tsangaris I, et al. The early change of SOFA score as a prognostic marker of 28-day sepsis mortality: analysis through a derivation and a validation cohort. Crit Care. 2019;23(1):387.
22. Green JM. Essentials of sepsis management. Surg Clin North Am. 2015;95(2):355–365.
23. Larsen JB, Laursen MA, Hvas CL, et al. Reduced Mannose-Binding Lectin-Associated Serine Protease (MASP)-1 is Associated with Disturbed Coagulation in Septic Shock. Thromb Haemost. 2019;119(6):952–961.
24. Hotchkiss RS, Monneret G, Payen D. Sepsis-induced immunosuppression: from cellular dysfunctions to immunotherapy. Nat Rev Immunol. 2013;13(12):862–874.
25. Delano MJ, Ward PA. The immune system’s role in sepsis progression, resolution, and long-term outcome. Immunol Rev. 2016;274(1):330–353.
26. Hotchkiss RS, Coopersmith CM, McDunn JE, et al. The sepsis seesaw: tilting toward immunosuppression. Nat Med. 2009;15(5):496–497.
27. Boomer JS, Green JM, Hotchkiss RS. The changing immune system in sepsis: is individualized immuno-modulatory therapy the answer? Virulence. 2014;5(1):45–56.
28. Boomer JS, To K, Chang KC, et al. Immunosuppression in patients who die of sepsis and multiple organ failure. JAMA. 2011;306(23):2594–2605.
29. Williams MA, Bevan MJ. Effector and memory CTL differentiation. Annu Rev Immunol. 2007;25:171–192.
30. Gharebaghi N, Valizade Hasanloei MA, Medizadeh Khalifani A, et al. Neutrophil-to-lymphocyte ratio in patients with gram-negative sepsis admitted to intensive care unit. Anaesthesiol Intensive Ther. 2019;51(1):11–16.
31. Martin-Loeches I, Forster R, Prina-Mello A. Intensive care medicine in 2050: nanotechnology. Emerging technologies and approaches and their impact on critical care. Intensive Care Med. 2018;44(8):1299–1301.
32. Ventetuolo CE, Levy MM. Biomarkers: diagnosis and risk assessment in sepsis. Clin Chest Med. 2008;29(4):591–603, vii.
33. Vincent JL, Beumier M. Diagnostic and prognostic markers in sepsis. Expert Rev Anti Infect Ther. 2013;11(3):265–275.
34. Song J, Park DW, Moon S, et al. Diagnostic and prognostic value of interleukin-6, pentraxin 3, and procalcitonin levels among sepsis and septic shock patients: a prospective controlled study according to the Sepsis-3 definitions. BMC Infect Dis. 2019;19(1):968.
35. Jekarl DW, Lee SY, Lee J, et al. Procalcitonin as a diagnostic marker and IL-6 as a prognostic marker for sepsis. Diagn Microbiol Infect Dis. 2013;75(4):342–347.
36. Li Q, Gong X. Clinical significance of the detection of procalcitonin and C-reactive protein in the intensive care unit. Exp Ther Med. 2018;15(5):4265–4270.
37. Candel FJ, Borges M, Belda S, et al. Current aspects in sepsis approach. Turning things around. Rev Esp Quimioter. 2018;31(4):298–315.
38. Postow MA, Chesney J, Pavlick AC, et al. Nivolumab and ipilimumab versus ipilimumab in untreated melanoma. N Eng J Med. 2015;372(21):2006.
39. Wolchok JD, Chiarion-Sileni V, Gonzalez R, et al. Overall survival with combined nivolumab and ipilimumab in advanced melanoma. N Eng J Med. 2015;372(21):2006–2017.
40. Chang KC, Burnham CA, Compton SM, et al. Blockade of the negative co-stimulatory molecules PD-1 and CTLA-4 improves survival in primary and secondary fungal sepsis. Crit Care. 2013;17(3):R85.
41. Danahy DB, Kurup SP, Winborn CS, et al. Sepsis-Induced state of immunoparalysis is defined by diminished cd8 T cell-mediated antitumor immunity. J Immunol. 2019;203(3):725–735.
 © 2023 The Author(s). This work is published and licensed by Dove Medical Press Limited. The full terms of this license are available at https://www.dovepress.com/terms.php and incorporate the Creative Commons Attribution - Non Commercial (unported, v3.0) License.
By accessing the work you hereby accept the Terms. Non-commercial uses of the work are permitted without any further permission from Dove Medical Press Limited, provided the work is properly attributed. For permission for commercial use of this work, please see paragraphs 4.2 and 5 of our Terms.
© 2023 The Author(s). This work is published and licensed by Dove Medical Press Limited. The full terms of this license are available at https://www.dovepress.com/terms.php and incorporate the Creative Commons Attribution - Non Commercial (unported, v3.0) License.
By accessing the work you hereby accept the Terms. Non-commercial uses of the work are permitted without any further permission from Dove Medical Press Limited, provided the work is properly attributed. For permission for commercial use of this work, please see paragraphs 4.2 and 5 of our Terms.