Back to Journals » Diabetes, Metabolic Syndrome and Obesity » Volume 15
Relationship Between Serum Vitamin D and Perirenal Fat Thickness in Patients with Metabolic Syndrome in Community
Authors Zhang HX ![]() , Zhai L, Gao Z, Yuan J
, Zhai L, Gao Z, Yuan J ![]()
Received 19 April 2022
Accepted for publication 16 July 2022
Published 23 July 2022 Volume 2022:15 Pages 2149—2156
DOI https://doi.org/10.2147/DMSO.S371445
Checked for plagiarism Yes
Review by Single anonymous peer review
Peer reviewer comments 2
Editor who approved publication: Prof. Dr. Juei-Tang Cheng
Hong-Xia Zhang,1 Lu Zhai,1 Zhixiang Gao,2 Jie Yuan3
1Department of Endocrinology, Shanxi Provincial People’s Hospital, Taiyuan, People’ s Republic of China; 2Department of Ultrasonography, Shanxi Provincial People’s Hospital, Taiyuan, People’ s Republic of China; 3Department of Radiology, Shanxi Provincial People’s Hospital, Taiyuan, People’ s Republic of China
Correspondence: Jie Yuan, Tel +86 13834164698, Email [email protected]
Background: Visceral obesity is independently associated with hypovitaminosis D. Perirenal fat is a visceral fat type active in performing endocrine functions. However, the relationship between perirenal fat thickness (PrFT) and serum 25-hydroxy vitamin D [25(OH)D] is unclear. The aim of this study is to investigate the relationship between serum 25(OH)D and PrFT in patients with metabolic syndrome (MS) in the community.
Methods: From May to September 2020, 332 MS subjects in Qinfengyuan and Dongfang communities in Taiyuan City, China were enrolled in an MS survey. All the participants completed the questionnaire survey and physical examination, and their fasting blood samples were collected for biochemical examination. Abdominal ultrasonography was performed to measure the perirenal fat thickness.
Results: The mean serum 25(OH)D level for the 332 MS subjects was 13.5 ng/mL, the proportions of vitamin D deficiency [serum 25(OH)D < 20 ng/mL] and insufficiency [serum 25(OH)D = 20– 29.9 ng/mL] were 60.8% (202) and 24.4% (81), respectively. Among the hypovitaminosis D [serum 25(OH)D < 30 ng/mL] subjects, the prevalence of abdominal obesity (waist circumference ≥ 90cm for men and ≥ 80cm for women) is 61.1%. Pearson correlation analysis showed that lg25(OH)D was significantly and negatively associated with body mass index (BMI), waist circumference (W), total cholesterol (TC), low density lipoprotein cholesterol (LDL-C), insulin resistance index (HOMA-IR), uric acid (UA)) and PrFT (all P< 0.05), and positively correlated with high-density lipoprotein cholesterol (HDL-C) (P< 0.05). Multivariate analysis showed that PrFT and HOMA-IR were independently correlated with 25(OH)D.
Conclusion: In screening MS patients, approximately 85% of the community MS patients in Taiyuan had hypovitaminosis D; in which 3/5 is abdominal obesity. PrFT is an independent risk factor for hypovitaminosis D in MS subjects.
Keywords: metabolic syndrome, 25(OH)D, hypovitaminosis D, perirenal fat thickness
Introduction
With the significant economic development in the past few decades in China, the lifestyles of Chinese people have changed extensively. Consequently, the prevalence of metabolic syndrome (MS) is 24.2% in Chinese adults, and MS has become a severe public health problem.1 It is considered an independent risk factor for cardiovascular disease.2 Studies have shown that the four MS components may be interconnected through common pathophysiological processes. These processes mainly include insulin resistance, visceral obesity, atherosclerotic dyslipidemia, and hypertension.3
Vitamin D is a fat-soluble steroid hormone in the human body. Vitamin D helps regulate bone and calcium metabolism in the body, and it is closely related to insulin resistance, immunity, anti-inflammation, and anti-fibrosis.4 Studies have shown that hypovitaminosis D is associated with MS, obesity, cardiovascular disease, and other chronic inflammatory diseases.5–8 Visceral obesity is independently associated with hypovitaminosis D.9,10 The magnetic resonance imaging (MRI) is the“platinum standard” for measurement of visceral obesity. However, MRI is expensive and not generally available.11 Perirenal fat is a type of visceral fat surrounding the kidneys, and it is more active than the typical visceral fat in performing endocrine functions. Recent studies suggest that perirenal fat thickness (PrFT) measured by ultrasonography showed excellent consistency compared with MRI and can serve as a simple and reliable imaging indicator of visceral obesity in the metabolic syndrome; And perirenal fat was significantly associated with the levels of gamma-glutamyl transferase, fasting plasma glucose, waist circumference, and metabolic syndrome.12,13 However, the relationship between PrFT and vitamin D status is unclear. Therefore, the aim of this study is to investigate the relationship between PrFT and serum 25-hydroxy vitamin D [25(OH)D] in MS patients.
Subjects and Methods
Subjects
Participants of the study were 932 residents aged 18–70 in Qinfengyuan and Dongfang Community in Taiyuan City, China and the epidemiological investigation of metabolic syndrome was conducted from May to September 2020. A total of 847 residents responsed (response rate 90.9%) and 823 cases had complete data. According to the the National Cholesterol Education Program Adult Treatment Panel III (NCEP/ATP-III)14 and modified based on the Asia–Pacific criteria of metabolic syndrome,15 a total of 389 cases of metabolic syndrome were diagnosed; The exclusion criteria were as follows: (1) taking vitamin D and calcium tablets in the past three months, (2) severe liver and kidney dysfunctions, cardiovascular and cerebrovascular diseases, hypothyroidism, and hyperthyroidism, (3) pregnancy, and (4) a history of severe diseases, such as malignant tumors. Finally, 332 MS subjects were included in the analysis (Figure 1).
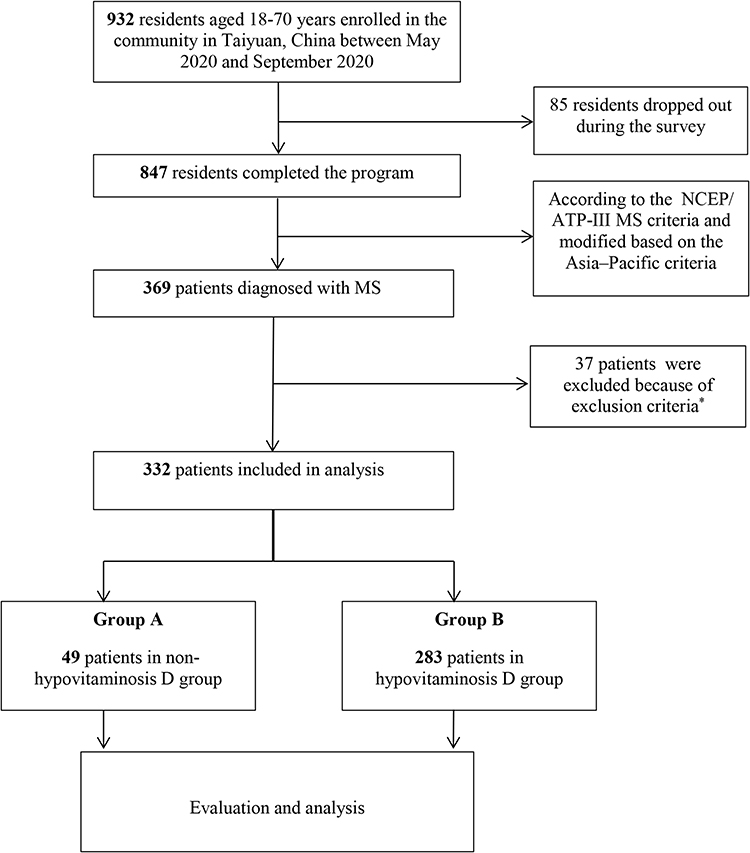 |
Figure 1 Flow chart of participants in MS survey. Notes: *Exclusion criteria: (1) taking vitamin D and calcium tablets in the past three months, (2) severe liver and kidney dysfunctions, cardiovascular and cerebrovascular diseases, hypothyroidism, and hyperthyroidism, (3) pregnancy, and (4) a history of severe diseases, such as malignant tumors. |
All subjects signed the written informed consents. The study protocol conformed to the ethical guidelines of the 1975 Declaration of Helsinki and was approved by the Ethics Committee of Shanxi Provincial People’s Hospital (2019024).
Methods
All the participants completed the following steps.
(1) Questionnaire survey: Details such as the age, sex, medical history, current medications, and family history were provided.
(2) General physical examination: The height, weight, waist circumference (W), hip circumference (H) and blood pressure of each participant were measured, and the body mass index (BMI) was calculated as weight/height squared (kg/m2). A trained technician obtained the systolic and diastolic blood pressures after each participant rested for 10 minutes.
(3) Biochemical indicators: After fasting for eight hours overnight, blood samples were collected to determine the fasting plasma glucose (FPG), liver and kidney functions, uric acid, blood lipids (Beckman AU5800 automatic biochemical analyzer), glycated hemoglobin (HbA1c, Japan Arkray HA-8160 glycosylated hemoglobin analyzer), fasting plasma insulin, and 25(OH)D (Roche Cobas E601 automatic chemiluminescence analyzer). The insulin resistance index (HOMA-IR) was calculated as FPG (mmol/L) × Fins (μU/mL) /22.5.
(4) PrFT: The PrFT was measured blindly by the same ultrasound specialist using the same ultrasound machine (Hitachi Hi Vision Preirus) according to standard operating procedures. Each patient laid down in the right lateral position, and the probe was placed perpendicular to the skin on the side of the abdomen. First, the long and wide diameters of the left kidney were measured to determine the maximum longitudinal section. Then the fat below the lower pole of the left kidney on the maximum longitudinal section is the perirenal fat of the lower pole of the left kidney (Figure 2). Minimal pressure was applied to the probe to prevent compression of the fat layer.
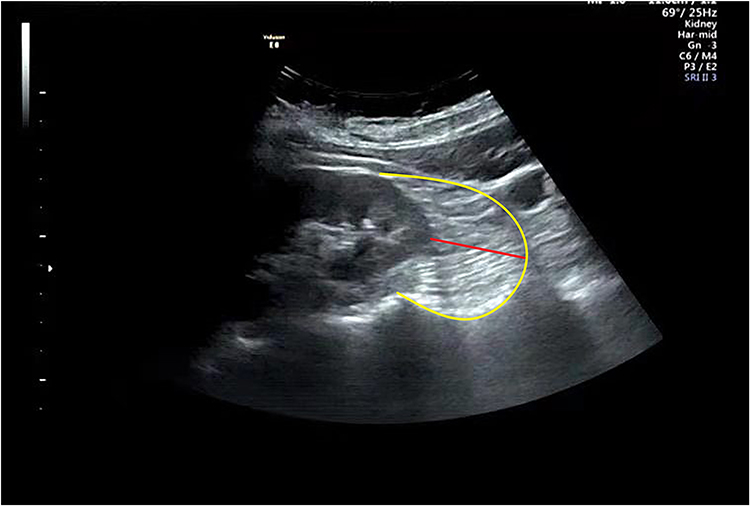 |
Figure 2 Echocardiographic perirenal fat thickness. The perirenal fat located between the surface of the kidney and the yellow curve. The perirenal fat thickness is marked by the red line. |
(5) Diagnostic criteria: The MS was defined according to the National Cholesterol Education Program Adult Treatment Panel III (NCEP/ATP-III)14 and modified based on the Asia–Pacific criteria.15 MS can be diagnosed when a participant satisfies three or more of the following five criteria: (1) blood pressure ≥ 130/85 mmHg or the use of antihypertensive medications; (2) serum triglycerides (TG) level ≥ 1.7 mmol/L or ongoing treatment for elevated TG; (3) serum high-density lipoprotein (HDL-C) < 1.0 mmol/L in men and < 1.3 mmol/L in women, or ongoing treatment for low HDL-C; (4) Fasting plasma glucose (FPG) ≥ 6.1 mmol/L, or the use of antihyglycemia medications; (5) BMI ≥ 25 kg/m2 or a waist circumference ≥ 90 cm for men and 80 cm for women. Vitamin D deficiency was defined as serum 25(OH)D < 20 ng/mL, vitamin D insufficiency was serum 25(OH)D = 20–29.9 ng/mL, and vitamin D sufficiency was defined as serum 25(OH)D ≥ 30 ng/mL.16 Hypovitaminosis D was defined as 25(OH)D < 30 ng/mL.
Statistical Analysis
SPSS (SPSS Inc., Chicago, IL; Version 17) software was used to analyze the data. The Kolmogorov–Smirnov test was applied to check the normality of the data. Continuous variables with nomal distribution were expressed as  ± s and compared using the t-test between groups. Continuous data with skewed distribution were presented as median (interquartile range) and Mann–Whitney test was used to test the difference between groups. Categorical variables were expressed as rates and compared using the χ2 test. Pearson correlation analysis was used for the correlation analysis. A multivariate model was constructed using multiple stepwise regression analysis based on 25(OH)D (the dependent variable) and univariate significance variables. Data with skewed distributions were logarithmically transformed before the analysis. Significance was adopted at p < 0.05.
Results
General Characteristics of All Subjects
The average 25(OH)D level of the 332 MS patients was 13.5 ng/mL, and the proportions of vitamin D deficiency and insufficiency were 60.8% (202) and 24.4% (81), respectively. Among the hypovitaminosis D subjects, the prevalence of abdominal obesity (waist circumference ≥ 90cm for men and ≥ 80cm for women) is 61.1% (173/283).
Based on hypovitaminosis D, the MS patients were divided into the non-hypovitaminosis D group (Group A) and hypovitaminosis D group (Group B). The demographic and biochemical parameters of the two groups were shown in Table 1. Compared to the non-hypovitaminosis D group, the perirenal fat thickness (PrFT), total cholesterol (TC), low-density lipoprotein cholesterol (LDL-C), waist (W), insulin resistance index (HOMA-IR), and uric acid (UA) in hypovitaminosis D group (all p < 0.05) significantly increased.
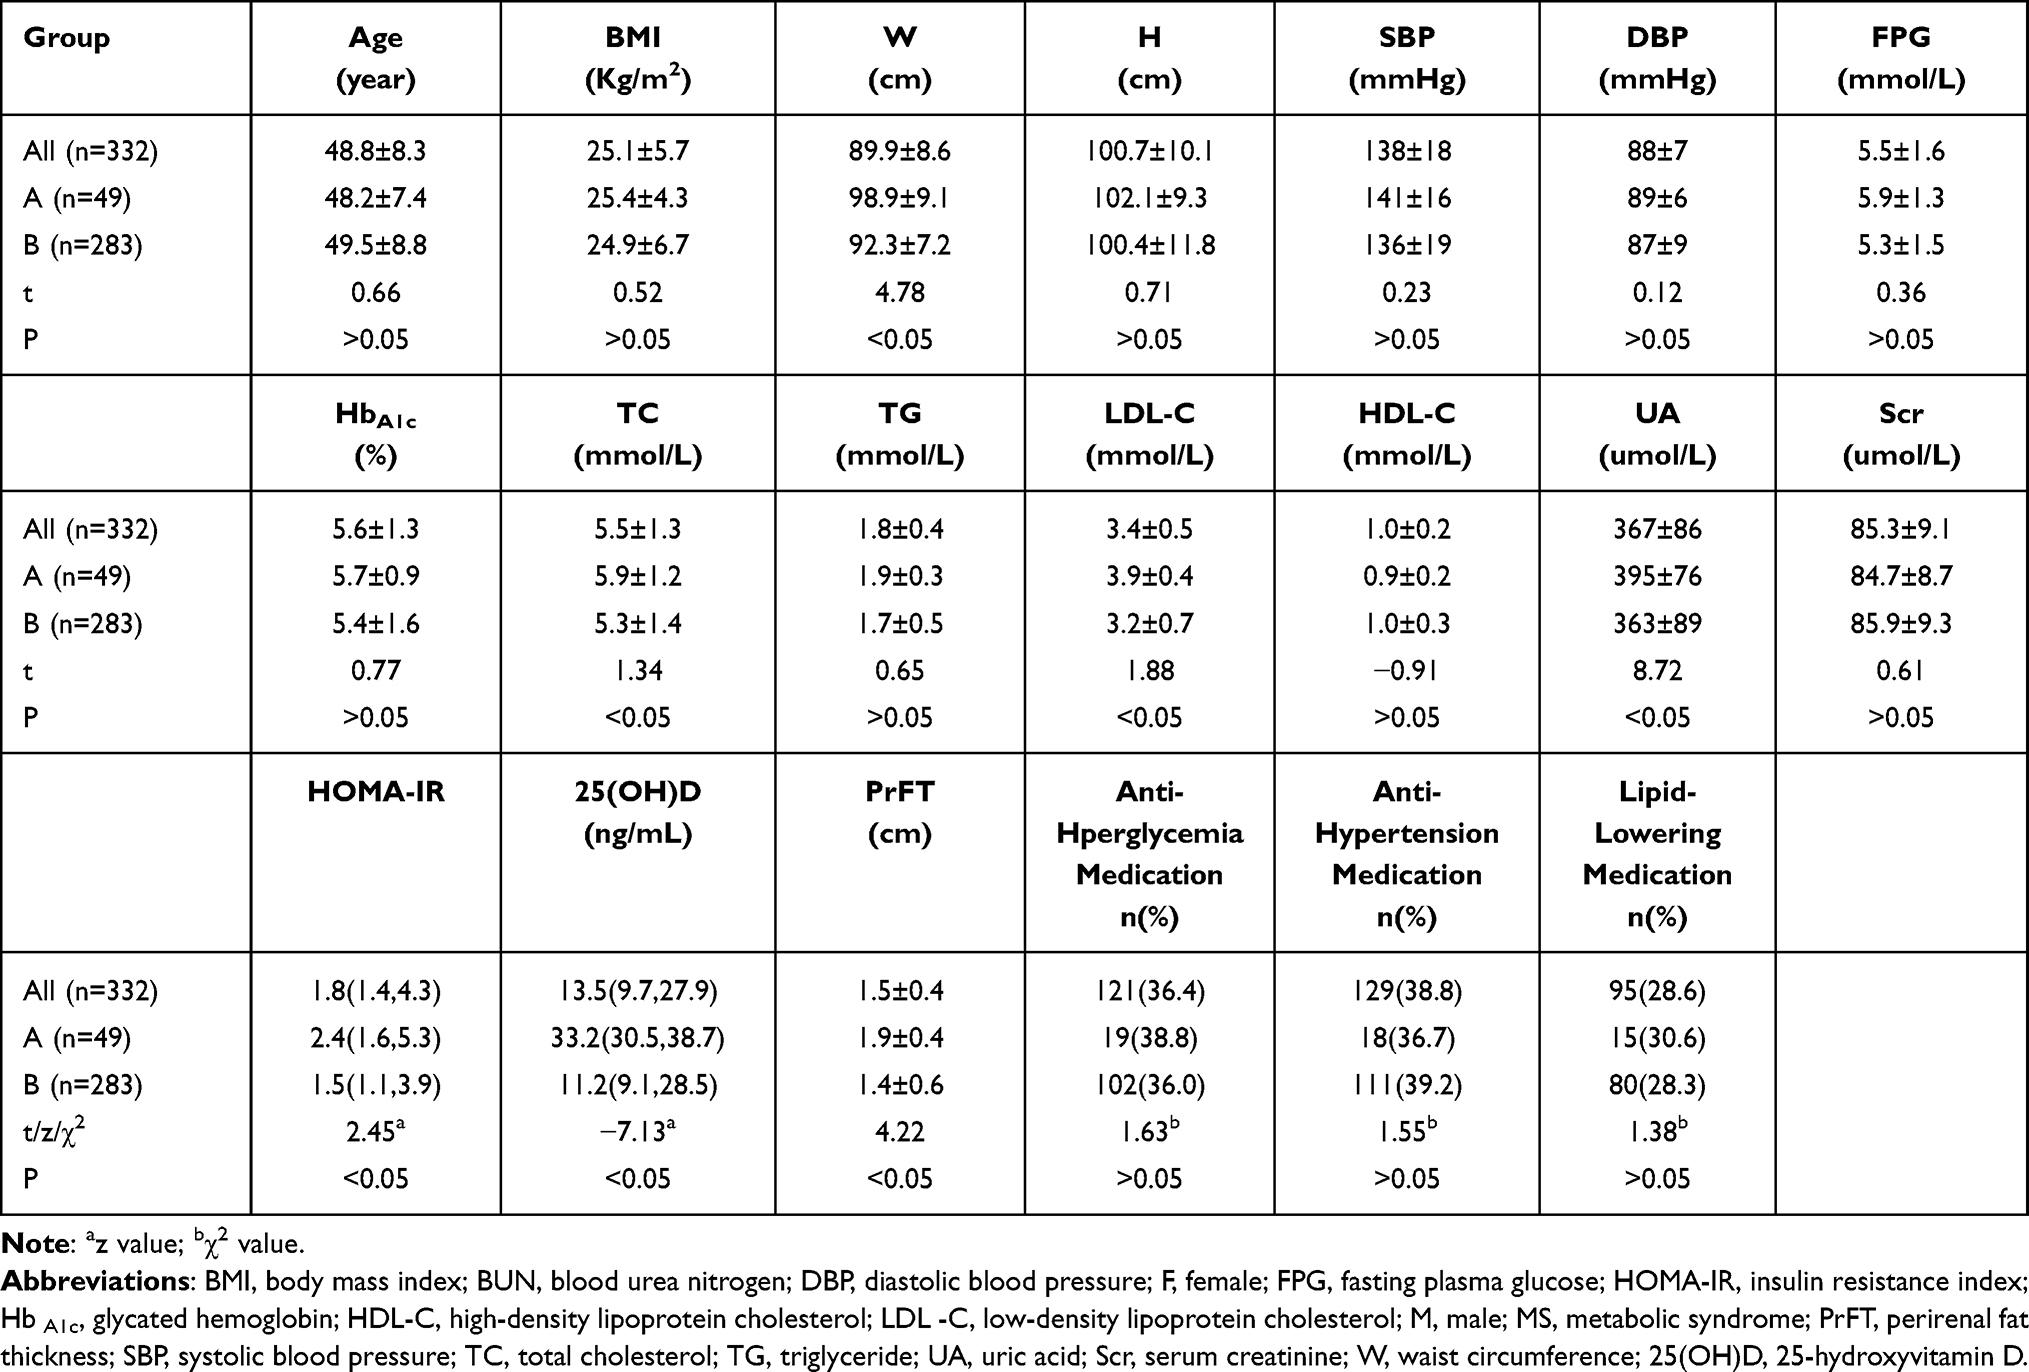 |
Table 1 General Characteristics of All Participants |
Correlation Analysis of 25(OH)D and Other Variables
Table 2 lists the correlation between 25(OH)D and other variables in the MS participants. The 25(OH)D level was significantly and negatively correlated with the BMI (r = −0.23, p < 0.001), W (r = −0.37, p < 0.001), TC (r = −0.22, p = 0.01), LDL-C (r = −0.19, p = 0.02), PrFT (r = −0.29, p<0.001), HOMA-IR (r = −0.31, p < 0.001), and UA (r = −0.14, p = 0.01). However, the 25(OH)D level significantly and positively correlated with HDL-C (r = 0.12, p = 0.04).
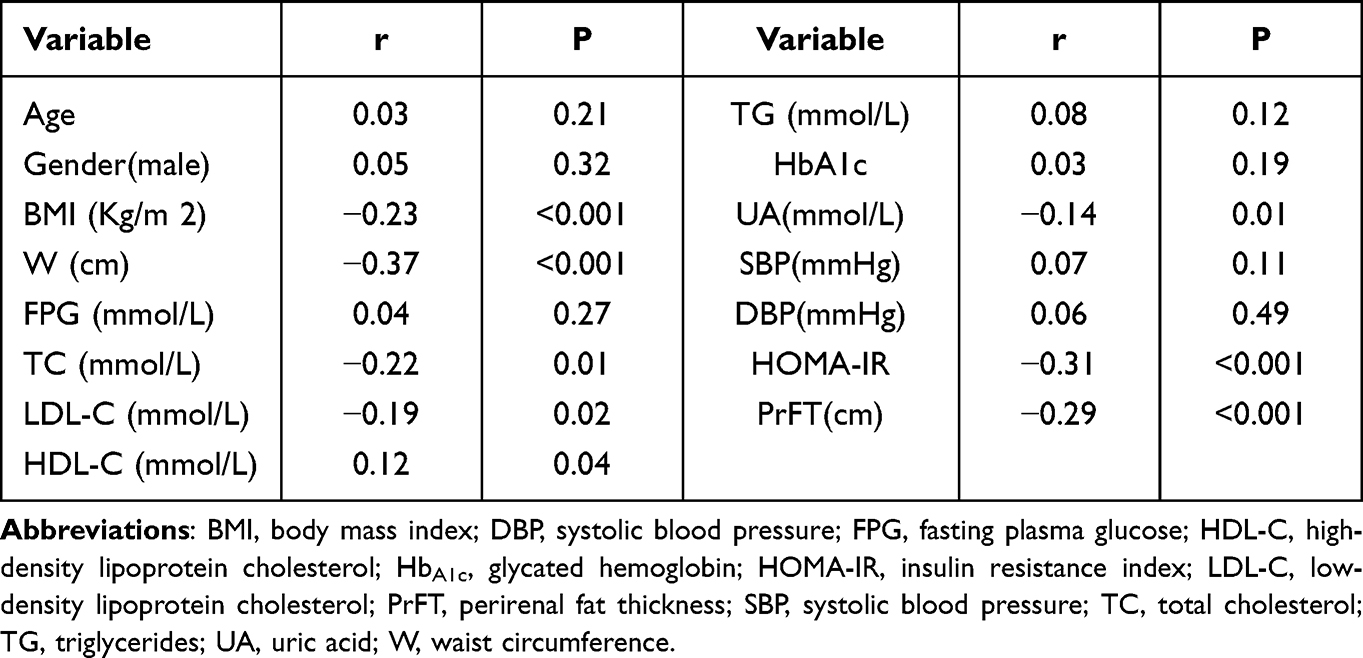 |
Table 2 Correlation Analysis of 25(OH)D and Other Variables |
Multivariate Analysis
25(OH)D was selected as the dependent variable, and BMI, W, TC, LDL-C, HOMA-IR, PrFT, and UA were adopted as univariate significance variables. Multiple linear regression showed that the PrFT and HOMA-IR were independently and negatively correlated with 25(OH)D after adjusting other confounding variables, such as age, sex, TC, LDL-C, UA, BMI, and W (Table 3).
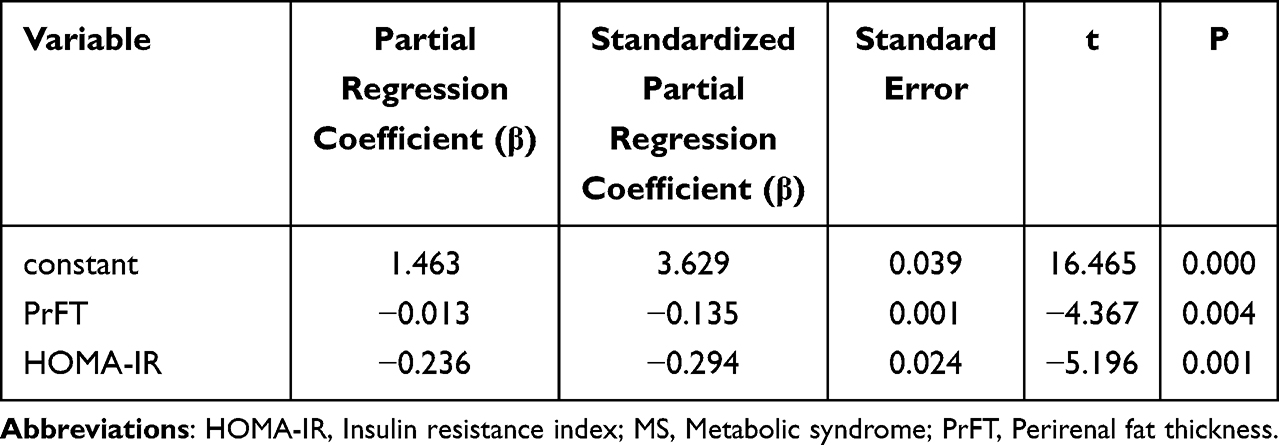 |
Table 3 Multiple Stepwise Regression Between 25(OH)D and Related Variables |
Discussion
Vitamin D deficiency or insufficiency is a global problem, particularly in China, because of several factors, such as China’s vast territory, significant climatic differences, and various lifestyles.17 According to a recent study of Yu, the prevalence of vitamin D deficiency and vitamin D insufficiency in China was 50.9% and 38.7%, respectively.18 In this study, the proportion of vitamin D deficiency and insufficiency were 60.8% and 24.4%, in which 3/5 is abdominal obesity. So MS patients are more likely to be vitamin D deficient. As sunshine is still the most important source of vitamin D, Taiyuan is located in the northern part of Shanxi Province in China. Its weather is cold throughout the year, and the outdoor ultraviolet exposure time is relatively short. In addition, patients with MS are more likely to be overweight and obese than patients without MS. Abdominal obesity is independently associated with low 25(OH)D levels;9,10 This behavior may be related to the dissolution of a large amount of vitamin D in the adipose tissue.19 Further, sequestration into adipose tissue, limited sunlight exposure, and decreased vitamin D synthesis in the adipose tissue and liver also contribute to low vitamin D in obesity.19 At the same time, studies indicate that weight loss has little effect on improving serum vitamin D; vitamin D supplementation is also not associated with weight loss. More research is needed to explore the relationship between vitamin D and adiposity.20
Regarding visceral fat assessment, techniques such as ultrasound, computed tomography (CT), and magnetic resonance imaging (MRI) can precisely quantify body fat and differentiate subcutaneous fat and visceral fat. The MRI is the “platinum standard” for diagnosing abdominal obesity,11 but it is time-consuming and expensive. CT can precisely distinguish the adipose tissue from other surrounding tissues, but it releases ionizing radiation and is radioactive to the body; thus, CT is unsuitable for large-scale applications. Generally, ultrasonography is simple, rapid, effective, low-cost, has no side effects, and is reproducible; hence, it is preferred for measuring perirenal fat. Kawasaki et al21 measured PrFT using ultrasonography and observed a good correlation with CT-assessed fat thickness, indicating that the ultrasound is as effective as CT for measuring PrFT. In this study, the PrFT of the lower pole of the left kidney was selected as an index to evaluate the perirenal fat content. Anatomically, the upper part of the right kidney is adjacent to the liver, the lower pole of the right kidney is easily disturbed by intestinal gas in the abdominal cavity, and the perirenal fat is not displayed completely. Therefore, it is preferable and convenient to measure the PrFT at the lower pole of the left kidney.
The fat accumulation characteristics of the Chinese population are low BMIs, and fat distribution tends to accumulate in the abdomen, which manifests as intra-abdominal obesity.22 Several studies have suggested that intra-abdominal fat accumulation is an independent risk factor for Type-2 diabetes, hypertension, and coronary heart disease.5,23 Perirenal fat is a visceral fat type that anatomically has a complete system of blood supply, lymphatic drainage, and innervation system.23 Histologically, perirenal fat is mainly composed of dormant brown adipose tissues24 and more active than the typical visceral fat in the energy metabolism and secretion of adipokines.25 Perirenal fat exhibits a high activity of synthesizing adipokines, which are released into the systemic circulation as vasoactive substances or cardiovascular regulators.26 In this study, PrFT was independently associated with 25(OH)D deficiency, further clarifying the relationship between visceral obesity and the 25(OH)D level.
This study has shown that insulin resistance is an independent risk factor for vitamin D deficiency, consistent with previous studies.27,28 Possible reasons are as follows: (1) Low serum vitamin D can increase the parathyroid hormone feedback, and elevated parathyroid hormone can affect insulin sensitivity by regulating the free calcium-ion concentration in insulin target organs. (2) Insufficient vitamin D weakens insulin sensitivity by decreasing the expression of insulin receptors.
Limitations existed in this study. This study was cross-sectional, as it could not prove the cause and effect of the relationship between serum vitamin D and perirenal fat. In addition, the sample size of this study was relatively small. Hence, it is necessary to expand the sample size and conduct further prospective studies to investigate the specific mechanism.
Conclusions
In screening MS patients, approximately 85% of patients with MS in Taiyuan had vitamin D deficiency and insufficiency, in which 3/5 is abdominal obesity. PrFT is an independent risk factor for vitamin D deficiency and insufficiency in MS patients.
Data Sharing Statement
Data used during the study are available from the corresponding author by request.
Funding
Shanxi Provincial Natural Science Foundation (20210302124372).
Disclosure
All authors declared no conflict of interest in this work.
References
1. Song QB, Zhao Y, Liu YQ, Zhang J, Xin SJ, Dong GH. Sex difference in the prevalence of metabolic syndrome and cardiovascular-related risk factors in urban adults from 33 communities of China: the CHPSNE study. Diabetes Vasc Dis Res. 2015;12(3):189–198. doi:10.1177/14791-64114562410
2. Eckel RH, Grundy SM, Zimmet PZ. The metabolic syndrome. Lancet. 2005;365(9468):1415–1428. doi:10.1016/S0140-6736(05)66378-7
3. Huang PL. A comprehensive definition for metabolic syndrome. Dis Model Mech. 2009;2(56):231–237. doi:10.1242/dmm.001180
4. Yin K, Agrawal DK. Vitamin D and inflammatory diseases. J Inflamm Res. 2014;7:69–87. doi:10.2147/JIR.S63898
5. Wang H, Chen W, Li D, et al. Vitamin D and chronic diseases. Aging Dis. 2017;8(3):346–353. doi:10.14336/AD.2016.1021
6. Roksandic Milenkovic M, Klisic A, Ceriman V, et al. Oxidative stress and inflammation parameters-novel biomarkers for idiopathic pulmonary fibrosis. Eur Rev Med Pharmacol Sci. 2022;26(3):927–934. doi:10.26355/eurrev_202202_28002
7. Cojic M, Kocic R, Klisic A, et al. A novel mechanism of vitamin D anti-inflammatory/ antioxidative potential in type 2 diabetic patients on metformin therapy. Arch Med Sci. 2020;16(5):1004–1012. doi:10.5114/aoms.2020.92832
8. Ganji V, Tangpricha V, Zhang X. Serum vitamin D concentration ≥75 nmol/L is related to decreased cardiometabolic and inflammatory biomarkers, metabolic syndrome, and diabetes; and increased cardiorespiratory fitness in US adults. Nutrients. 2020;12(3):730. doi:10.3390/nu12030730
9. Hongxia Z, Jie Y, Yexin H, Jinkang S. Correlation between serum vitamin D and abdominal obesity in non-diabetic community population. Chin J Clin Nutr. 2015;8(23):226–230. doi:10.3969/j.issn.1005-9202.2014.07.048
10. Ren Z, Zhao A, Wang Y, et al. Association of serum 25‐hydroxy vitamin D with obesity‐related indices in Chinese adults: a cross-sectional study. Food Sci Nutr. 2021;9(4):2260–2268. doi:10.1002/fsn3.2201
11. Gong W, Ren H, Tong H, et al. A comparison of ultrasound and magnetic resonance imaging to assess visceral fat in the metabolic syndrome. Asia Pac J Clin Nutr. 2007;16(Suppl 1):339–345. doi:10.6133/apjcn.2007.16.s1.64
12. Guo XL, Tu M, Chen Y, Wang W. Perirenal fat thickness: a surrogate marker for metabolic syndrome in Chinese newly diagnosed type 2 diabetes. Front Endocrinol. 2022;13:850334. doi:10.3389/fendo.2022.850334
13. Roever L, Resende ES, Veloso FC, et al. Perirenal fat and association with metabolic risk factors: the Uberlândia Heart Study. Medicine. 2015;94(38):e1105. doi:10.1097/MD.0000000000001105
14. Executive Summary of the third report of The National Cholesterol Education Program (NCEP). Expert panel on detection, evaluation, and treatment of high blood cholesterol in adults (Adult Treatment Panel III). JAMA. 2001;285(19):2486–2497. doi:10.1001/jama.285.19.2486.
15. Garvey WT, Mechanick JI, Brett EM, et al. American Association of Clinical Endocrinologists and American College of Endocrinology comprehensive clinical practice guidelines for medical care of patients with obesity. Endocr Pract. 2016;22(Suppl 3):1–203. doi:10.4158/EP161365.GL
16. Thacher TD, Clarke BL. Vitamin D insufficiency. Mayo Clin Proc. 2011;86(1):50–60. doi:10.4065/mcp.2010.0567
17. Yongqiang Z, Dezeng T, Yongqin G. Serum vitamin D levels and related research in obese patients with hyperlipidemia. Chin J Pract Diagn Treat. 2012;26(12):1231–1233.
18. Yu S, Fang H, Han J, et al. The high prevalence of hypovitaminosis D in China: a multicenter vitamin D status survey. Medicine. 2015;94(8):e585. doi:10.1097/MD.0000000000000585
19. Drincic AT, Armas LA, Van Diest EE, et al. Volumetric dilution, rather than sequestration best explains the low vitamin D status of obesity. Obesity. 2012;20(7):1444–1448. doi:10.1038/oby.2011.404
20. Karampela I, Sakelliou A, Vallianou N, et al. Vitamin D and obesity: current evidence and controversies. Curr Obes Rep. 2021;10(2):162–180. doi:10.1007/s13679-021-00433-1
21. Kawasaki S, Aoki K, Hasegawa O, et al. Sonographic evaluation of visceral fat by measuring para- and perirenal fat[J]. J Clin Ultrasound. 2008;36(3):129–133. doi:10.1002/jcu.20426
22. Xinyu S, Weiping J. Intra-abdominal fat and metabolic syndrome. Chin J Endocrinol Metabol. 2004;20(3):279–282. doi:10.3760/j.issn:1000-6699.2004.03.03914
23. Kim JH, Han EH, Jin ZW, et al. Fetal topographical anatomy of the upper abdominal lymphatics: its specific features in comparison with other abdominopelvic regions. Anat Rec. 2012;295(1):91–104. doi:10.1002/ar.21527
24. Jespersen NZ, Feizi A, Andersen ES, et al. Heterogeneity in the perirenal region of humans suggests presence of dormant brown adipose tussue that contains brown precursor cells. Mol Metabol. 2019;24:30–43. doi:10.1016/j.molmet.2019.03.005
25. Liu BX, Sun W, Kong XQ. Perirenal fat: a unique fat pad and potential target for cardiovascular disease. Angiology. 2019;2019(7):584–593. doi:10.1177/0003319718799967
26. Mattu HS, Randeva HS. Role of adipokines in cardiovascular disease. J Endocrinol. 2013;216(1):T17–36. doi:10.1530/JOE-12-0232
27. Rafiq S, Jeppesen PB. Vitamin D deficiency is inversely associated with homeostatic model assessment of insulin resistance. Nutrients. 2021;13(12):4358. doi:10.3390/nu13124358
28. Rafiq S, Jeppesen PB. Insulin resistance is inversely associated with the status of vitamin D in both diabetic and non-diabetic populations. Nutrients. 2021;13(6):1742. doi:10.3390/nu13061742
 © 2022 The Author(s). This work is published and licensed by Dove Medical Press Limited. The
full terms of this license are available at https://www.dovepress.com/terms
and incorporate the Creative Commons Attribution
- Non Commercial (unported, 3.0) License.
By accessing the work you hereby accept the Terms. Non-commercial uses of the work are permitted
without any further permission from Dove Medical Press Limited, provided the work is properly
attributed. For permission for commercial use of this work, please see paragraphs 4.2 and 5 of our Terms.
© 2022 The Author(s). This work is published and licensed by Dove Medical Press Limited. The
full terms of this license are available at https://www.dovepress.com/terms
and incorporate the Creative Commons Attribution
- Non Commercial (unported, 3.0) License.
By accessing the work you hereby accept the Terms. Non-commercial uses of the work are permitted
without any further permission from Dove Medical Press Limited, provided the work is properly
attributed. For permission for commercial use of this work, please see paragraphs 4.2 and 5 of our Terms.
Recommended articles
Overcoming Infections Including COVID-19, by Maintaining Circulating 25(OH)D Concentrations Above 50 ng/mL
Wimalawansa SJ
Pathology and Laboratory Medicine International 2022, 14:37-60
Published Date: 16 December 2022