")
Back to Journals » Patient Related Outcome Measures » Volume 7
Rasch analysis of the Western Ontario Osteoarthritis of the Shoulder index – the Danish version
Authors Moeini S, Rasmussen JV, Klausen TW, Brorson S
Received 21 April 2015
Accepted for publication 20 January 2016
Published 14 November 2016 Volume 2016:7 Pages 173—181
DOI https://doi.org/10.2147/PROM.S87048
Checked for plagiarism Yes
Review by Single anonymous peer review
Peer reviewer comments 3
Editor who approved publication: Dr Robert Howland
Sahar Moeini,1 Jeppe V Rasmussen,1 Tobias W Klausen,2 Stig Brorson1
1Department of Orthopedic Surgery, 2Department of Hematology, Herlev Hospital, Herlev, Denmark
Purpose: The Western Ontario Osteoarthritis of the Shoulder (WOOS) index is a disease-specific, patient-reported, 19-question survey that measures the quality of life among patients with osteoarthritis (OA). The purpose of this study was to validate the Danish version of WOOS for OA and fractures (FRs) using modern test theory.
Patients and methods: The study included 1,987 arthroplasties in 1,943 patients that were reported to the Danish Shoulder Arthroplasty Register between 2006 and 2011. These included 847 OA and 1,140 FR cases.
Results: Principal component analysis indicated the unidimensionality of WOOS. The person reliabilities showed a floor-ceiling effect, indicating that a dichotomy was the best fit for the WOOS scale. For OA, WOOS showed good reliability (item and person reliability of 0.98 and 0.76) and good targeting, with a person mean of -0.56 logits. FR also showed good targeting (person mean of -0.08) and good reliability (item and person reliabilities of 1.00 and 0.86, respectively). All WOOS items fit well with the OA sample except items 5 and 6 (pertaining to grinding and the influence of weather). In addition, item 6 showed signs of degrading the scale with an outfit mean square of 2.46. Only item 6 showed a misfit for FR with no sign of scale degradation. The residual principal component analysis confirmed the unidimensionality of FR but not OA. Six items displayed clinically significant differential item functioning between OA and FR.
Conclusion: Rasch analysis showed that WOOS had a good fit with the Rasch model when used as a dichotomous scale for OA and FR. However, the results were valid only when WOOS was divided into two categories with a threshold of 950 (50% of the maximum score). For the use of WOOS in future clinical research, we recommend that a dichotomous score be reported as a measure of clinical failure in OA and FR.
Keywords: shoulder arthroplasty, modern test theory, patient-reported outcome measure, questionnaire, quality of life
Introduction
The Western Ontario Osteoarthritis of the Shoulder (WOOS) index is a patient-reported measure of the quality of life among patients with glenohumeral osteoarthritis (OA).1 It was published in 1998 and is one of a series of disease-specific quality-of-life measurement tools for shoulder pathology. The specificity of WOOS may allow better responsiveness and therefore the detection of smaller clinical differences before and after treatment compared with generic measurement tools, such as the Disabilities of the Arm, Shoulder, and Hand (DASH) questionnaire and the Short Form (36) Health Survey, and nondisease-specific shoulder measurement tools, such as the Constant–Murley Score and the Oxford Shoulder Score.1–3 The original Canadian version has been identified as valid, reliable, and highly responsive through classical test theory and construct validation1,2 and has been recommended for use as the primary outcome in clinical trials of interventions for OA.1
The questionnaire includes 19 questions (Table 1), which are answered by placing a mark on a visual analog scale (VAS) with a point system ranging from 0 to 100. For each question, 100 means the worst score, while zero indicates no decrease in the quality of life. It is usually the WOOS total score that is used as an outcome measure. Thus, it is assumed that WOOS is unidimensional, with an outcome ranging from 0 to 1,900, with 1,900 indicating the worst quality of life. The Danish Shoulder Arthroplasty Registry (DSR) defines a score >950 as clinical failure, whereas a score <950 is regarded as a good outcome.4 WOOS comprises the following four categories: 1) physical symptoms, 2) sports, recreation, and work function, 3) lifestyle function, and 4) emotional function (Table 1).1
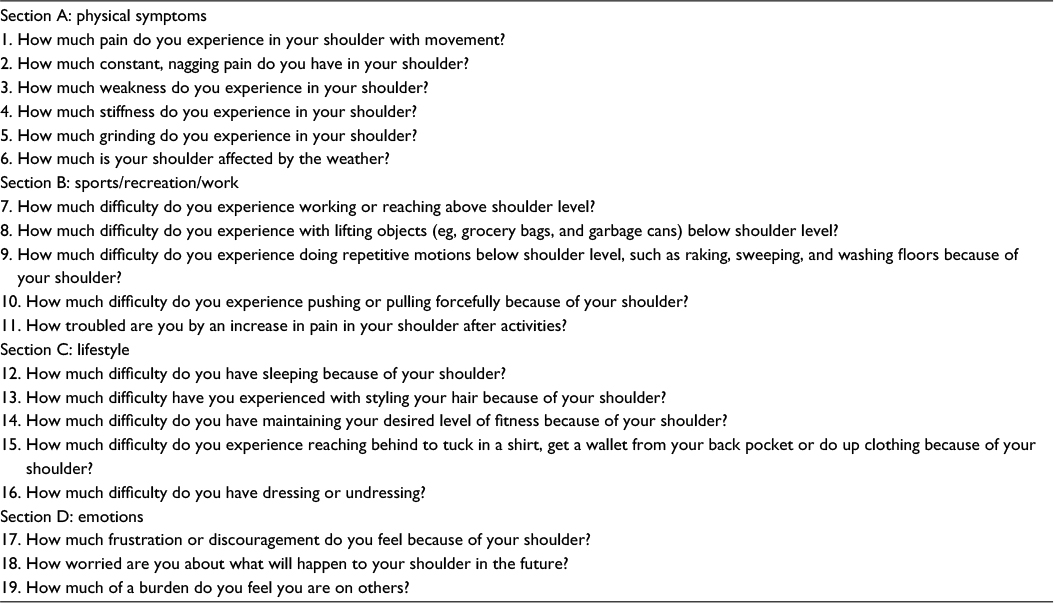 | Table 1 Western Ontario Osteoarthritis of the Shoulder index |
Since 2004, WOOS has been used as a dichotomous scale for clinical evaluation 12 months postoperation in Danish patients treated with shoulder arthroplasty.5 The questionnaire has been translated into Danish according to international guidelines and has the same psychometric properties as the original Canadian version.3 Because DSR uses WOOS for diagnoses other than OA, it is also relevant to test the validity of the questionnaire for fractures (FRs). The purpose of this study was to validate the Danish Version of WOOS for OA and FR using modern test theory.
Patients and methods
Patients
WOOS has been used by DSR since it was established in 2004.5 The first years were regarded as trial period, and the present study used data from 2006 to 2011.
We examined 1,987 arthroplasties in 1,943 patients. This included 1,382 (70%) women. The median age was 70 years (range 25–94 years). The arthroplasties were based on two different diagnoses, namely 847 (42.6%) OA cases and 1,140 (57.4%) FR cases. The study was approved by the Danish Data Protection Agency and written informed patient consent was deemed not relevant (J. no. 2007-58-0015).
Methods
SPSS software Version 22.0 was used for the general statistics and principal component analysis (PCA). We used the statistical analysis software Winsteps Rasch Measurement Version 3.90.0 to perform Rasch analysis.
Principal component analysis
Before performing a Rasch analysis of WOOS, the assumption of unidimensionality was examined using PCA applied to the pooled data for OA and FR. The analysis is illustrated in a scree plot (Figure 1), which shows the distribution of the data variance along 19 uncorrelated contrasts representing potential dimensions of WOOS.6 The first few contrasts in PCA summarize as much of the variability of the data as possible, and the amount of variance in each contrast is measured in eigenvalues (EIs).6
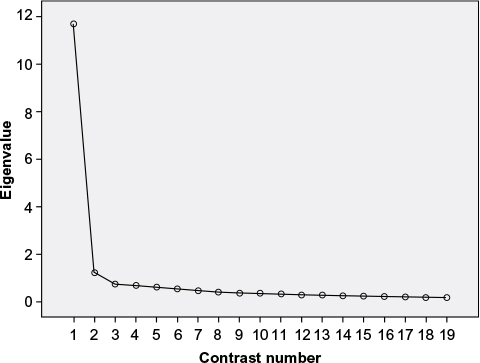 | Figure 1 Scree plot. Notes: The scree plot shows the results of the PCA for the pooled osteoarthritis and fracture data. It illustrates the distribution of eigenvalues among the 19 contrasts. Abbreviation: PCA, principal component analysis. |
Rasch analysis
The items in WOOS are equally weighted and have a common rating scale that is continuous. To perform Rasch analysis, the VAS of the WOOS items is transformed into a discrete scale.7 The appropriate number of intervals for the WOOS items was determined by analyzing the category rating scale based on the OA group. A four-category division was too detailed because all three thresholds were relatively close, at -0.11, -0.09, and 0.20. Furthermore, the person performances did not show a normal distribution; rather, they had a heavy-tailed distribution with patients clustered at the extremes of the scale. Consequently, a division of >2 would be too detailed and results in a disordered threshold. The histograms of the item scores shown in Figure 2 emphasize the tendency toward a floor-ceiling effect. Thus, a dichotomous scale was used for the WOOS items throughout the study. A score between 0 and 50 indicated a good outcome, while a score of 51–100 indicated a bad outcome.
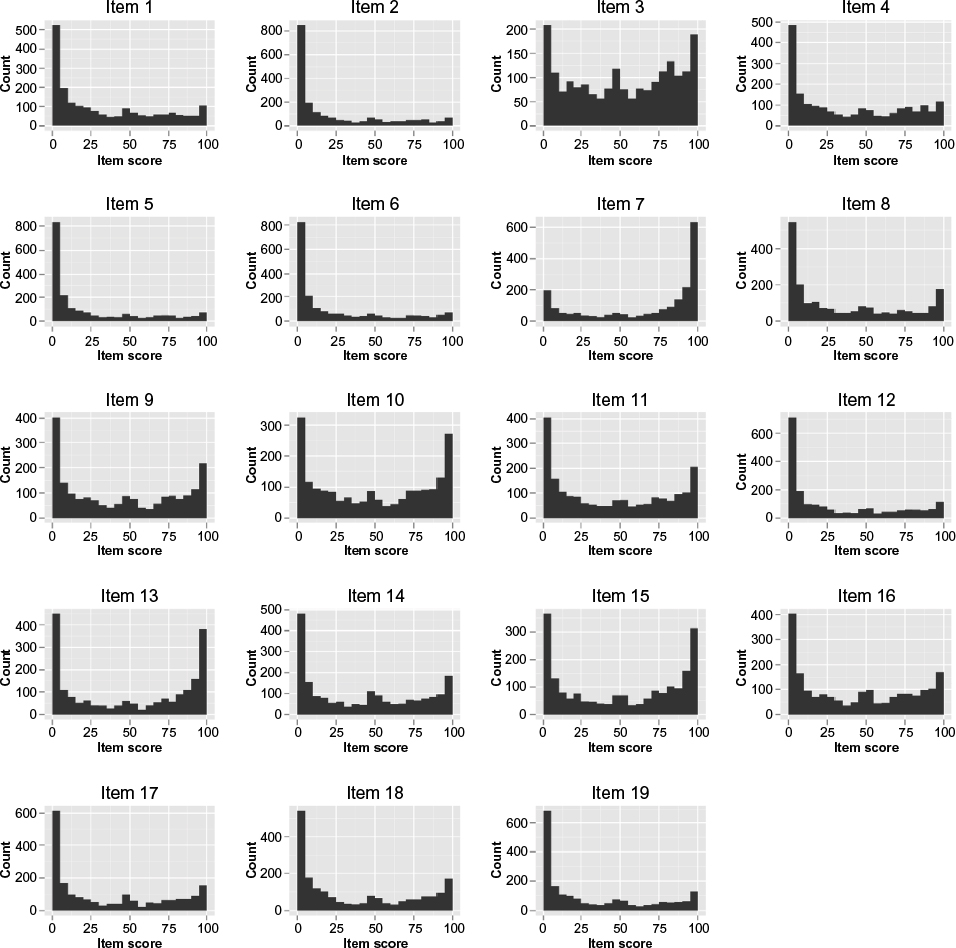 | Figure 2 Histograms of item scores. Notes: The histograms of each item on WOOS depict the distribution of the item scores in the common study population. The counts indicate the number of responses. Abbreviation: WOOS, Western Ontario Osteoarthritis of the Shoulder. |
We validated the questionnaire with Rasch analysis and used rating scale parameterization. The Rasch model investigates the relationship between person performance and item difficulty by placing their measurements on a common logit scale. Logit is the natural logarithm of the odds of success (loge probability of success/probability of failure) and represents the difference between the ability level and the item difficulty.8–10 Wright maps show the measurement of item difficulties and person performances on a common logit scale. Wright maps are useful tools in Rasch analysis to illustrate how well the item difficulties target the person abilities, eg, by comparing the logit ranges of item difficulties and person performances and by comparing the default item mean of zero with the person mean. A person mean close to zero indicates good targeting of the items to the population. The total person mean and the person mean excluding the person extremes can be used to estimate the targeting of WOOS. The logit range of item difficulties indicates the width of the quality of life that is covered by the questionnaire. An interitem separation of <0.15 logits indicates redundancy of the items.8
When undertaking a Rasch analysis, the fit of data to the Rasch model is tested through chi-square fit statistics with mean square (MNSQ) measures.8,11 Item MNSQs show the size of the randomness of the person abilities for each item.12 The expected MNSQ value of 1 indicates that the item in question fits the Rasch model perfectly.9,12 MNSQs <1 indicate overfit, while MNSQs >1 suggest underfit. An overfit occurs in cases with too little variance and indicates overpredictability that does not threaten the unidimensionality. However, it indicates item redundancy or the inability of items to differentiate among patients.13 An underfit indicates unpredictability and suggests that the item belongs to a dimension other than the Rasch dimension.7,9 In this study, we considered the optimal range for the MNSQs to be between 0.6 and 1.4; items with MNSQs outside this range were considered misfits.8,11 Furthermore, items with an MNSQ of >2 show signs of degrading the measurement system.11,13 Infit MNSQ is a weighted measure that considers people with abilities near the item’s difficulty level. Outfit MNSQ is not weighted and is more sensitive to outliers (ie, people far from the item difficulty level).7,9
The reliabilities of the Rasch analysis measure the proportion of variance that is true variance for items and person, respectively. Reliability ranges from 0 to 1, with 1 being the best reliability.14 Person reliability depends on the range of the person’s ability, the length of the test, the number of categories per item, and the sample-item targeting. It is independent of the sample size.
Item reliability depends on the range of item difficulty and the sample size. It is independent of test length. Both person and item reliability are largely uninfluenced by the model fit.15
To examine reliability further, the separation index  and the number of strata ([4×separation index+1]/3) can be found. The separation index and strata examine the number of statistically distinct measures.14 Separation is useful if the persons or items show a normal distribution, and strata are useful if the items or persons are heavy tailed.16 Because of the floor-ceiling effect of persons, strata (calculated using person separation) are used in this study to examine how many levels of the quality of life WOOS is able to identify.17 Item separation is used to verify item hierarchy. If the item separation is <3, it implies that the person sample is not large enough to confirm item hierarchy.15
Differential item functioning (DIF) is assessed using the item difficulties for OA as a baseline measure. Thus, it identifies whether there is a systematic variation in item difficulty between FR and OA.9 When items display DIF sizes with numeric values >0.50, it is indicative of an effect on the outcome.18 DIF sizes < -0.50 or >0.50 are regarded as clinically significant, and t-scores >2 are considered statistically significant. A test for the DIF between diagnoses is highly relevant if WOOS is to be used to evaluate patients with diagnoses other than OA.
Residual PCA
The Rasch analysis is complemented by residual PCA. In this way, any data that cannot be explained by the Rasch dimension is tested to examine whether there is a second dimension of that part of the data.8 The variance is measured in EI and is divided into the variance explained by the Rasch dimension and the unexplained variance.19 In this study, the distribution of unexplained variance (19 EIs in total) was tested along 19 contrasts. The first contrast represents the largest component of the unexplained variance.20 If the strength is equally distributed and each contrast has an EI unit of 1, there is no sign of a second dimension in the unexplained variance.8,9 As suggested by de Haan et al,8 EIs >2 are regarded as a sufficient contrast to indicate a secondary dimension. When a contrast has a strength >2 EIs, the items with the highest positive and negative loadings in the contrast are identified. A few specific items with high loading indicate that the pattern of these items contrasts with the pattern of the rest of the items. This indicates the presence of a second dimension that deviates from the Rasch dimension. An unstructured loading of items in the contrast indicates that the contrast does not reflect a second dimension.20
Results
PCA of WOOS
The first contrast had an EI of 11.69, which explained 61.55% of the variance. The second contrast had an EI of 1.21, explaining 6.37% of the variance. Thus, the first contrast was approximately ten times larger than the second. The rest of the contrasts had EIs <1. The scree plot in Figure 1 shows a clear, steep curve from the first to the second contrast, followed by a rather flat line, indicating that the first contrast was the only main dimension.6 Hence, the PCA showed a tendency toward unidimensionality in WOOS, supporting our assumption. The PCA showed the same tendency when it was applied to OA and FR separately.
Rasch analysis of WOOS in patients with OA
With a dichotomous scale, both categories were well represented (Table 2). There was a default threshold of 0, the observed average measure increased monotonically, and both categories had outfit MNSQs with proximity to 1 (Table 2).
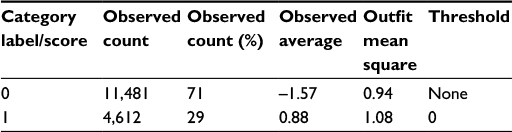 | Table 2 Summary of the category structure of the Danish version of WOOS Abbreviation: WOOS, Western Ontario Osteoarthritis of the Shoulder. |
The Wright map (Figure 3) showed that items 2 and 5 had the highest item difficulties (they were the most difficult questions to endorse), and item 7 had the lowest difficulty. The item difficulties covered a logit range of ~4 (from -2.36 to 1.40), which we considered good. However, it was important to notice the tendency toward item clustering and the substantial gap between item 7 and the rest of the items. Eight groups of items had an inter-item separation of <0.15 (Table 3). Items 6, 7, 11, 15, and 19 were the only items that were separated from the rest. This suggested redundancy in the WOOS items8 and the lack of a strict hierarchy of the item ordering.
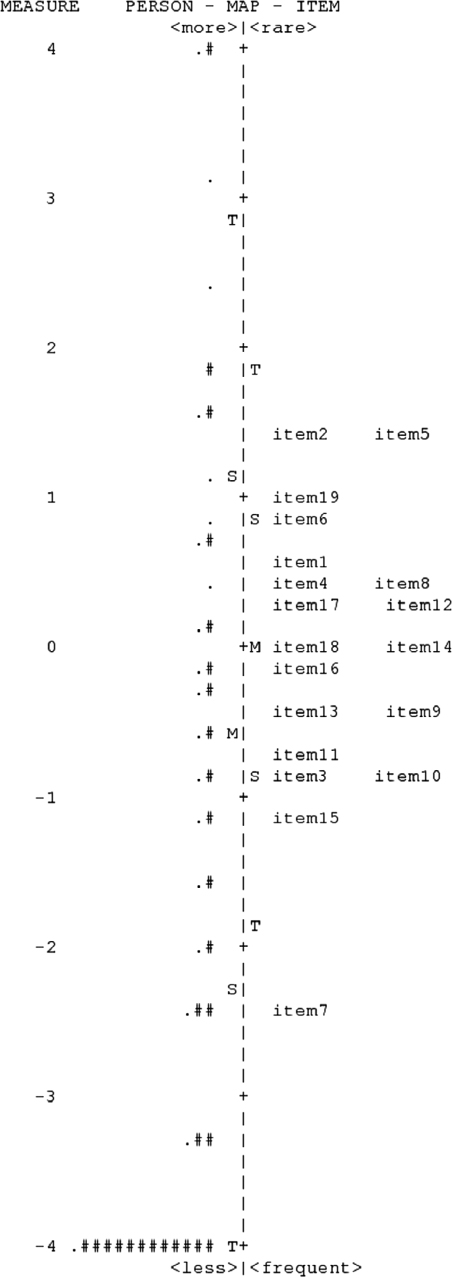 | Figure 3 Wright map of the WOOS scale for osteoarthritis patients. Notes: People (n=847) are shown on the left side, and the 19 items are shown on the right side. Each “#” represents 23 patients, and each “.” represents 1–22 patients. The logit scale represents quality of life. Positive scores indicate bad outcomes, and negative scores indicate good outcomes. The mean item difficulty was defined as zero on the scale. Abbreviation: WOOS, Western Ontario Osteoarthritis of the Shoulder; M, mean; S, one standard deviation; T, two standard deviations. |
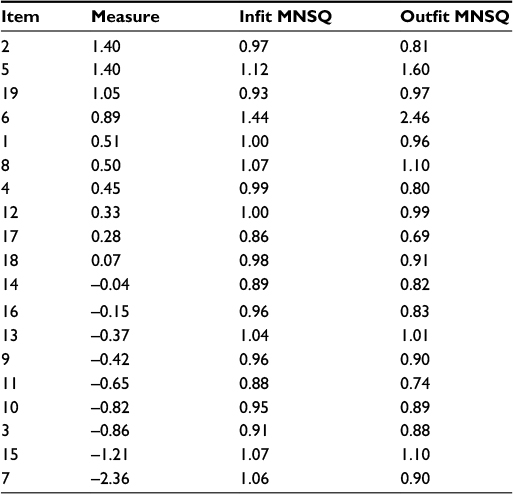 | Table 3 Item statistics for the WOOS for osteoarthritis patients Abbreviations: MNSQ, mean square; WOOS, Western Ontario Osteoarthritis of the Shoulder. |
The person measures ranged from -4.60 to 4.47, and 318 out of 847 had extreme scores (25 were maximum extreme scores). For the nonextreme persons, the mean estimate was -0.56; for all persons, it was -1.81. We relied on the Wright map person estimate of -0.56, which suggested that the items were well targeted for the patients because it was close to the default item mean of 0. The person mean and the map showed that there was a predominance of patients with good outcomes.
All items fitted the Rasch model based on the optimal MNSQ range except item 5, with an outfit MNSQ of 1.60, and item 6, which had an infit MNSQ of 1.44 and an outfit MNSQ of 2.46 (Table 3). This indicated that item 6 degraded the measurement system of WOOS.
The item reliability was 0.98, and the item separation was 7.74. This confirmed the item hierarchy. The person reliability was 0.76, and the person separation index was 1.77, with a stratum of 2.69.
The data showed a total raw variance of 31.7 EI units, and 40.1% of the variance could be explained by the Rasch model. The residual PCA showed that the first contrast of the unexplained variance had 2.1 EI units, the second had 1.7 EI units, and the third had 1.5 EI units, accounting for 6.5%, 5.4%, and 4.7% of the total unexplained variance, respectively. This indicated that the first contrast might contribute to a second dimension. However, the first contrast was not characterized by a few specific items. Items 1, 2, and 13 had the highest loading in the first contrast, but they did not stand out remarkably from the other items.
Rasch analysis of WOOS in patients with FRs
The Rasch analysis showed better reliability for the FR group, with an item reliability of 1.00, an item separation of 15.16, a person reliability of 0.86, and a person separation of 2.49 (strata =3.65). WOOS also had better targeting to FR than for OA. The person mean for nonextreme persons (n=935) was -0.08, compared to -0.53 for the whole FR sample. The item difficulty ranged from -3.95 to 2.11 logits, with the highest difficulty for item 6 and the lowest for item 7. Only item 6 showed misfit, and there was no sign that the scale was degraded (Table 4). Furthermore, the residual PCA of the FR group confirmed unidimensionality, and 46.6% of the total raw variance (35.6 EI units) could be explained by the Rasch model. 1.8 EI units (5.1%) of the unexplained variance belonged to the first contrast, 1.6 EI units (4.5%) to the second contrast, and 1.5 EI units (4.2%) to the third contrast.
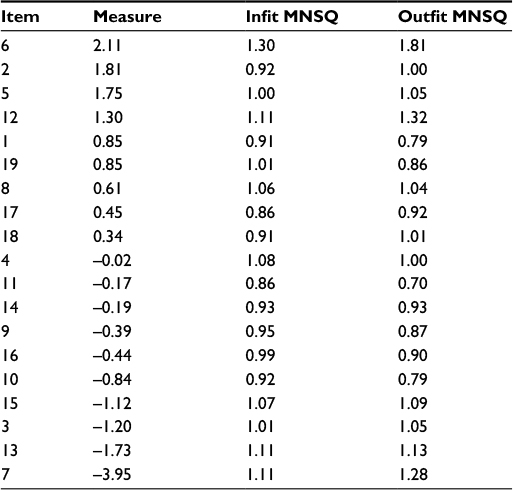 | Table 4 Item statistics for the WOOS for fracture patients Abbreviations: MNSQ, mean square; WOOS, Western Ontario Osteoarthritis of the Shoulder. |
OA and FR roughly followed the same pattern of item difficulty measurement (Figure 4). Six items displayed clinically significant DIFs (Table 5).
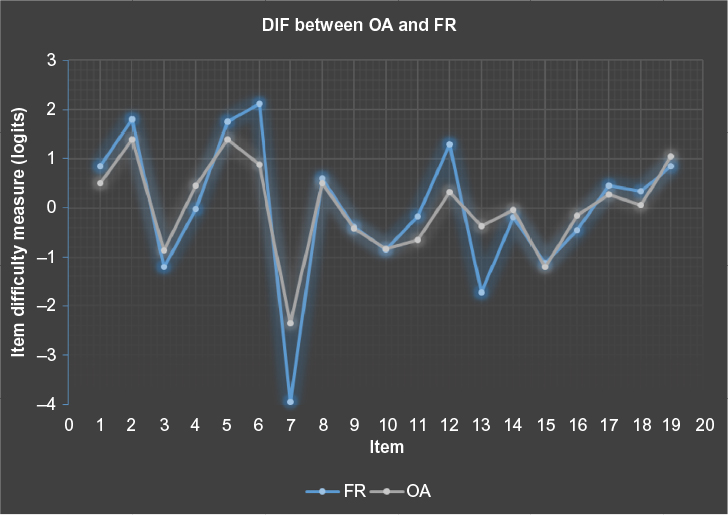 | Figure 4 Differential item functioning plot. Note: These graphs show the item difficulty measures for FR and OA. Abbreviations: DIF, differential item functioning; FR, fracture; OA, osteoarthritis. |
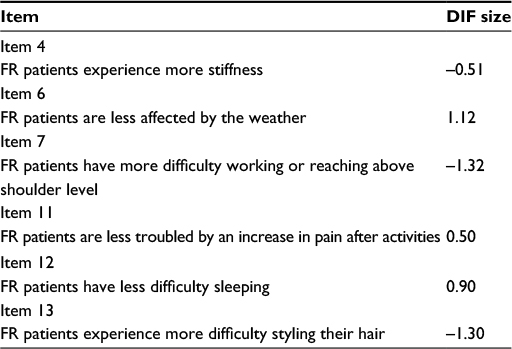 | Table 5 Significant DIF between fracture patients and osteoarthtitis patients Notes: This table shows the item difficulties for FR that differed from the baseline OA item difficulties by a DIF size >0.50 or <–0.50 logits. These values indicate how much FR patients deviate on an item score when compared with OA. The positive DIF sizes indicate high item difficulty, which means that the FR patients had better experiences than the OA sample regarding the specific issues examined in the item. Negative DIF sizes indicate the opposite. All of the DIF sizes listed in the table are considered statistically significant because they have t-scores >2. Abbreviations: DIF, differential item functioning; FR, fracture; OA, osteoarthritis. |
Discussion
Rasch analysis of WOOS in patients with OA
The category rating scale analysis indicated that dichotomy was the best fit for WOOS. Higher divisions showed clustering of thresholds or threshold disorder. Furthermore, the person performances for both OA and FR showed a tendency toward a floor-ceiling effect rather than normal distribution. This indicates that the VAS can be reduced to a dichotomous scale without any crucial loss of information. From a clinical perspective, the use of WOOS by DSR supports the dichotomy of the WOOS scale.4 Still, some information might be unexploited when only two categories are derived from a 1,900-point scale.
Rasmussen et al3 previously validated the use of WOOS as a continuous scale for OA. In this study, we tested and validated the clinical use of WOOS as a dichotomous outcome measure. Rasch analysis showed a good fit with the Rasch model and a good targeting to OA patients, indicating that WOOS can be used for OA when the scale is dichotomous. Thus, for clinical use in the estimation of OA, we conclude that the VAS score can be used as a primary outcome measure and the dichotomous score as a secondary outcome measure, with a score of >950 indicating clinical failure.
The person mean and the configuration of the Wright map indicated that the quality of life was well represented by the WOOS items. However, with respect to the configuration of item difficulty distribution, it might be appropriate to delete redundant items and to enrich the gaps and extremes of the scale with additional items to improve item hierarchy and achieve a greater division of the category rating scale. Further work could be conducted to investigate whether this would be clinically relevant.
The item reliability and separation for OA were good, indicating that our sample size was adequate for the analysis. The person separation results indicated that WOOS can distinguish at least two distinct levels of the quality of life among OA patients.
The residual PCA showed that only the first contrast of unexplained variance was >2 EI units. This indicated the possible existence of a second dimension. However, when the strength of the first contrast was compared with the strength of the Rasch dimension, the Rasch dimension was 15 times larger. Furthermore, none of the WOOS items stood out remarkably in their contribution to the first contrast. This indicates that the WOOS questionnaire can be considered unidimensional. The examination of unidimensionality is an important test of the questionnaire’s validity because WOOS is used as a linear rating scale, with one total score defining the outcome measure.7,9
Rasch analysis of WOOS in patients with FRs
The chi-square fit statistics and the residual PCA indicated that WOOS had a good fit to the Rasch model when it was used for FR. Although WOOS was intended for OA, the questionnaire also showed good targeting of FR. The use of WOOS for FR has not been validated as a VAS but only as a dichotomous scale. Thus, for the clinical use of WOOS for FR, we recommend a dichotomous outcome measure with a threshold score of 950 (50% of the maximum score).
The items had larger interitem separations and less clustering for FR than OA. Thus, WOOS covered a wider range of quality of life and displayed less item redundancy when it was used for FR. The item reliability and separation was better for FR than for OA, and the person separation indicated that WOOS could identify three distinct levels of person performance.
The DIF assessment showed that the FR group experienced more stiffness (item 4), more difficulty working or reaching above shoulder level (item 7), and more difficulty styling their hair (item 13) than the OA group. The OA group was more affected by the weather (item 6), more troubled by increasing pain after activities (item 11), and had more difficulty sleeping (item 12) than the FR group.
Throughout the study, item 6 (regarding the impact of the weather) had the worst fit to the Rasch model. It had the highest MNSQs for both OA and FR and was therefore the most unpredictable item. The reason for this unpredictability could be persons’ difficulty with understanding the question, the difficulty for the patient to categorize the strength of the weather’s impact, or simply the fact that the item measures a dimension of quality of life that is separate from the rest of WOOS. For the purpose of enhancing the unidimensionality of WOOS, we considered whether item 6 should be excluded from the questionnaire. In the Rasch analysis of the Oxford Knee Score, they removed or recoded the misfitting items to improve the model fit.9 To test whether item 6 should be excluded, a further study must be performed to analyze the fit of WOOS to the Rasch model when item 6 is excluded. In this way, the fit of WOOS with and without item 6 can be compared.
It was expected that weather would affect only OA patients and not FR patients. For this reason, it is questionable whether item 6 is representative when WOOS is used for diagnoses other than OA. The higher impact of the weather on OA was confirmed by the DIF assessment.
Item 6 showed better chi-square fit statistics for FR than for OA. The item was the most difficult WOOS question for the FR group. This is in accordance with our assumption that the weather does not affect FR. The high difficulty might somewhat clarify why item 6 does not show signs of degrading the scale when WOOS is used for FR. Because of the high difficulty of the question, the majority of patients are expected to have a low score on item 6. This might give the patients a more stable position on the unidimensional scale of WOOS. Because OA is affected by the weather and OA patients had less difficulty with item 6, the OA patients’ positions on the VAS for item 6 are potentially more fluctuating in relation to the total WOOS score and therefore less predictable than for the FR patients.
Strengths and limitations of the study
One limitation of this study is that, to fit the Rasch model, WOOS was simplified from a continuous to a dichotomous scale. Thus, the results are valid only when WOOS is divided into two categories (preferably with a threshold of 50% of the maximum score).
We validated the use of WOOS as a dichotomous scale for FR. However, it is important to notice that WOOS was originally made for OA. Nevertheless, the study showed that WOOS had a good targeting for FR. WOOS also covered a large range of quality of life and had a person stratus of >3, indicating that the questionnaire is detailed and distinctive enough for use with FR patients.
A strength of this study is the relatively large sample size compared with, eg, the OES-DV (the Dutch version of the Oxford Elbow Score) and the D-OES (the Danish version of the Oxford Elbow Score) studies.8,17 A larger sample size gives the Rasch analysis higher item reliability and provides greater power for identifying misfits.8 This study may be the basis for further studies to perform Rasch analyses of other language versions of WOOS.
Conclusion
Rasch analysis showed that WOOS had a good fit with the Rasch model when used for OA and FR as a dichotomous scale. However, the results are valid only when WOOS is divided into two categories with a threshold of 950 (50% of the maximum score). When WOOS is used for future clinical research, we recommend that a dichotomous score be reported as a measure of clinical failure in OA and FR.
Disclosure
The authors report no conflicts of interest in this work.
References
Lo IK, Griffin S, Kirkley A. The development of a disease-specific quality of life measurement tool for osteoarthritis of the shoulder: the Western Ontario Osteoarthritis of the Shoulder (WOOS) index. Osteoarthritis Cartilage. 2001;9(8):771–778. | ||
Kirkley A, Griffin S, Dainty K. Scoring systems for the functional assessment of the shoulder. Arthroscopy. 2003;19(10):1109–1120. | ||
Rasmussen JV, Jakobsen J, Olsen BS, Brorson S. Translation and validation of the Western Ontario Osteoarthritis of the Shoulder (WOOS) index – the Danish version. Patient Relat Outcome Meas. 2013;4: | ||
sundhed.dk [webpage on the Internet]. Dansk Skulderalloplastik Register Årsrapport 2013; 2014. Available from: https://www.sundhed.dk/content/cms/3/4703_dsr_%C3%A5rsrapport2013_final22052013.pdf. Accessed July 13, 2014. | ||
Rasmussen JV, Jakobsen J, Brorson S, Olsen BS. The Danish Shoulder Arthroplasty Registry: clinical outcome and short-term survival of 2, | ||
Kuiper S, Sklar J [webpage on the Internet]. Introduction to Principal Component Analysis: Stock Market Values. Practicing Statistics: Guided Investigations for the Second Course; 2013. Available from: http://www.pearsonhighered.com/kuiper1einfo/assets/pdf/Kuiper_Ch10.pdf. Accessed August 7, 2015. | ||
Tennant A, Conaghan PG. The Rasch measurement model in rheumatology: what is it and why use it? When should it be applied, and what should one look for in a Rasch paper? Arthritis Rheum. 2007;57(8):1358–1362. | ||
de Haan J, Schep N, Tuinebreijer W, Patka P, den HD. Rasch analysis of the Dutch version of the Oxford elbow score. Patient Relat Outcome Meas. 2011;2:145–149. | ||
Ko Y, Lo NN, Yeo SJ, et al. Rasch analysis of the Oxford Knee Score. Osteoarthritis Cartilage. 2009;17(9):1163–1169. | ||
Wright BD [webpage on the Internet]. “Logits”? Rasch Measurement Transactions; 1993. Available from: http://www.rasch.org/rmt/rmt72e.htm. Accessed July 9, 2014. | ||
Boone WJ, Staver JR, Yale MS, editors. Fit. Rasch Analysis in the Human Sciences. Netherlands: Springer; 2014:159–189. | ||
Linacre JM [webpage on the Internet]. Help for Winsteps Rasch Measurement Software: Misfit Diagnosis: Infit Outfit Mean-Square Standardized. Available from: http://www.winsteps.com/winman/diagnosingmisfit.htm. Accessed August 3, 2015. | ||
Lehman LA, Woodbury M, Velozo CA. Examination of the factor structure of the Disabilities of the Arm, Shoulder, and Hand questionnaire. Am J Occup Ther. 2011;65(2):169–178. | ||
Wright BD [webpage on the Internet]. Reliability and Separation. Rasch Measurement Transactions; 1996. Available from: http://www.rasch.org/rmt/rmt94n.htm. Accessed August 3, 2015. | ||
Linacre JM [webpage on the Internet]. Help for Winsteps Rasch Measurement Software: Reliability and Separation of Measures. Available from: http://www.winsteps.com/winman/reliability.htm. Accessed August 3, 2015. | ||
Wright BD, Masters GN [webpage on the Internet]. Rasch Measurement Transactions: Number of Person or Item Strata: (4*Separation+1)/3; 2002. Available from: http://www.rasch.org/rmt/rmt163f.htm. Accessed August 3, 2015. | ||
Plaschke HC, Jorgensen A, Thillemann TM, Brorson S, Olsen BS. Validation of the Danish version of the Oxford Elbow Score. Dan Med J. | ||
Linacre JM [webpage on the Internet]. Differential Item Functioning DIF Sample Size Nomogram. Rasch Measurement Transactions; 2013. Available from: http://www.rasch.org/rmt/rmt264a.htm. Accessed July 13, 2014. | ||
Linacre JM [webpage on the Internet]. Rasch Measurement Transactions: PCA: Data Variance: Explained, Modeled and Empirical; 2003. Available from: http://www.rasch.org/rmt/rmt173g.htm. Accessed July 10, 2014. | ||
Linacre JM [webpage on the Internet]. Help for Winsteps Rasch Measurement Software: Dimensionality: Contrasts and Variances. Available from: http://www.winsteps.com/winman/principalcomponents.htm. Accessed August 3, 2015. |
 © 2016 The Author(s). This work is published and licensed by Dove Medical Press Limited. The full terms of this license are available at https://www.dovepress.com/terms.php and incorporate the Creative Commons Attribution - Non Commercial (unported, v3.0) License.
By accessing the work you hereby accept the Terms. Non-commercial uses of the work are permitted without any further permission from Dove Medical Press Limited, provided the work is properly attributed. For permission for commercial use of this work, please see paragraphs 4.2 and 5 of our Terms.
© 2016 The Author(s). This work is published and licensed by Dove Medical Press Limited. The full terms of this license are available at https://www.dovepress.com/terms.php and incorporate the Creative Commons Attribution - Non Commercial (unported, v3.0) License.
By accessing the work you hereby accept the Terms. Non-commercial uses of the work are permitted without any further permission from Dove Medical Press Limited, provided the work is properly attributed. For permission for commercial use of this work, please see paragraphs 4.2 and 5 of our Terms.