Back to Journals » Degenerative Neurological and Neuromuscular Disease » Volume 7
Randomized control trial evaluation of a modified Paleolithic dietary intervention in the treatment of relapsing-remitting multiple sclerosis: a pilot study
Authors Irish AK, Erickson CM, Wahls TL ![]() , Snetselaar LG, Darling WG
, Snetselaar LG, Darling WG
Received 11 July 2016
Accepted for publication 8 September 2016
Published 4 January 2017 Volume 2017:7 Pages 1—18
DOI https://doi.org/10.2147/DNND.S116949
Checked for plagiarism Yes
Review by Single anonymous peer review
Peer reviewer comments 2
Editor who approved publication: Dr Thomas Müller
Amanda K Irish,1 Constance M Erickson,1 Terry L Wahls,2,3 Linda G Snetselaar,4 Warren G Darling1
1Motor Control Laboratories, Department of Health and Human Physiology, College of Liberal Arts and Sciences, The University of Iowa, 2Veterans Affairs Medical Center, 3Department of Internal Medicine, Carver College of Medicine, 4Department of Epidemiology, College of Public Health, The University of Iowa, Iowa City, IA, USA
Background/objective: A Paleolithic diet may improve fatigue and quality of life in progressive multiple sclerosis (MS) patients, but past research has evaluated the effects of this dietary intervention in combination with other treatments such as exercise. Thus, the purpose of this pilot study was to evaluate a modified Paleolithic dietary intervention (MPDI) in the treatment of fatigue and other symptoms in relapsing-remitting MS (RRMS).
Methods: We measured the effects of a MPDI in 17 individuals with RRMS. Of 34 subjects randomly assigned to control (maintain usual diet) and intervention (MPDI) groups, nine subjects (one man) completed the control group and eight subjects (one man) completed the MPDI.
Results: Significant improvements were seen in Fatigue Severity Scale score and also in Multiple Sclerosis Quality of Life-54 and time to complete (dominant hand) 9-Hole Peg Test from baseline in MPDI subjects compared to controls. Increased vitamin K serum levels were also observed in MPDI subjects postprotocol compared to controls.
Conclusion: A Paleolithic diet may be useful in the treatment and management of MS, by reducing perceived fatigue, increasing mental and physical quality of life, increasing exercise capacity, and improving hand and leg function. By increasing vitamin K serum levels, the MPDI may also reduce inflammation.
Keywords: diet therapy, nutrition therapy, gluten-free, quality of life, fatigue, complementary medicine, alternative medicine
Introduction
Multiple sclerosis (MS) is a common, disabling, neurologic condition affecting the central nervous system of approximately 400,000 Americans. The etiology is not well understood, but there appears to be an interaction involving both genetic susceptibility and environmental risk factors leading to the activation of myelin-specific autoreactive T cells.1–4 Although it is a complex autoimmune disease, it is clear that nuclear factor κB (NF-κB) plays a major role in the pathogenesis of MS.5 The clinical course, symptoms, and response to therapy are extremely variable in patients (due to variability in the sites of demyelination), and there are as many as seven clinical subtypes associated with chronologic symptom progression.6,7 Of these, the relapsing-remitting MS (RRMS) subtype affects approximately 85% of initially diagnosed patients, and typically progresses to secondary progressive MS. Together, RRMS and secondary progressive MS are the most common subtypes and account for approximately 90% of patients.6
Comprehensive literature exists examining the relationship between modifiable lifestyle and MS progression.8 Currently, most clinicians focus primarily on pharmaceutical intervention; first-line immune-modulating drugs such as β-interferon and glatiramer acetate are prescribed to reduce or prevent future disability with limited benefit and serious side effects.9,10 There have been recent calls for more integrated approaches to treatment, and demand for nondrug intervention is evident through large proportions of people with MS using complementary and alternative medicine in addition to conventional treatments.11,12 It has also been demonstrated that the degree to which people feel they are in control of their illness plays an important role in both mental and physical health status.13–15
Although much research has been conducted regarding individual dietary components, more research is required to assess the effectiveness of dietary “packages” or whole-diet interventions for MS as many nutrients work synergistically. Simply adding one vitamin, mineral, or food at a time may not be as effective as making broad dietary enhancements.16,17 Nature delivers food as nutritional complexes, not isolated nutrients. Furthermore, whole foods containing multiple nutrients may provide better combinations of such nutrients than individual, or complexes of, prefabricated vitamin/mineral supplements.18,19
The typical American diet is known to contain many proinflammatory foods, including refined carbohydrates and saturated fats that contribute to chronic inflammation through the production of inflammatory molecules such as cytokines and eicosanoids.20–22 Activation of the NF-κB signaling pathway is the key component in the inflammatory response and serves as a master genetic switch to initiate expression of inflammatory proteins. Studies have demonstrated that dietary molecules found in the modified Paleolithic dietary intervention (MPDI), such as α-lipoic acid (ALA) and polyphenols, may effectively inhibit the NF-κB pathways, thereby reducing inflammation.23,24 It is therefore hypothesized that dietary modulation of NF-κB could serve as a target to reduce inflammation and decrease cellular injury in persons with chronic disease.21,22,25
Studies have shown an increased prevalence of celiac disease and gluten sensitivity in persons with MS and improvement in neurologic symptoms following adoption of a gluten-free diet.26–29 There is long-standing evidence that cow’s milk consumption has a role in the development of MS, whereas lectins (found in grains and legumes) have an apparently similar contributing mechanism.30–33 In contrast, polyphenols (found in fruits, vegetables, herbs, nuts, tea, red wine, algae, coffee, chocolate, olives, and olive oil), carotenoids (from fruits, vegetables, olives, algae, and seafood), polyunsaturated fatty acids (from nuts, seeds, olive oil, seaweed, and fish), vitamin D (found in mushrooms, fish, and liver), and elements such as selenium (found in nuts, fish, and seafood) and zinc (found in nuts and seeds) have the potential to downregulate the expression of inflammatory molecules, interfere with cell signaling, and counteract oxidative stress processes associated with MS.20,21,34,35 The essential minerals, vitamins B (found in yeast, liver, and vegetables), E (found in nuts, oils, vegetables, and fruits), and K (found in vegetables and liver), as well as the antioxidant and energetic cofactors ALA (found in organ meat, vegetables, and yeast) and ubiquinone (coenzyme Q10; found in meat, fish, vegetables, and olive oil) are involved in mitochondrial metabolism and may provide clinical benefit.36–38 These nutrients may combine to protect brain cells and support the regenerative potential of the brain.36
The Paleolithic (Paleo) diet consists mainly of fish, grass-fed and pasture-raised meats, vegetables, fruits, fungi, roots, and nuts; excludes grains, legumes, and dairy products; and limits refined sugars, starches, processed foods, and oils. In sum, the Paleo diet is relatively high in vitamins B, D, E, and K, polyunsaturated fatty acids, coenzyme Q10, α-lipoic acid, polyphenols, carotenoids, zinc, and selenium, which all support mitochondrial function in addition to myelin growth and repair, further outlining why we find this diet suitable for study.
Previous research has indicated that a Phase I trial of a multimodal lifestyle intervention (modified Paleo diet, nutritional supplementation, exercise, neuromuscular electrical stimulation, and stress reduction) improves perceived fatigue as well as quality of life (QOL) in progressive MS patients.39 To address whether diet alone is effective in reducing fatigue and improving QOL, we studied individuals with RRMS using a randomized controlled clinical trial design. The current pilot study is unique in that it is the first to evaluate an MPDI alone as a treatment for MS. We hypothesized that the MPDI would improve perceived fatigue and QOL as well as cognitive and motor functions.
Methods
Subjects
The study was approved by the UI and VAMC Institutional Review Boards and all participants provided written informed consent (NCT02687919). Nineteen people with neurologist verified (using the 2001 McDonald criteria) RRMS participated in this study (mean age: 36.3±4.7 years).40 All subjects were recruited from The University of Iowa (UI) mass-email system, local databases of the National Multiple Sclerosis Society, from posters and flyers distributed to neurology clinics in the Iowa City/Cedar Rapids, Iowa corridor area (to include the Iowa City Veterans Affairs Medical Center), and by word-of-mouth. Eligible subjects were between the ages of 18–45 years, had stable RRMS (defined as no medication changes within 3 months), were able to walk 25 feet with or without an assistive device, and were on no other “diets” recommended to treat MS (such as Best Bet, Swank, McDougall, MS Recovery, Paleo or modified Paleo, gluten-free, vegetarian, and/or vegan). Subjects were willing to be randomized to diet or “usual care” control groups and to follow a modified Paleo diet (described as nine cups of vegetables and some fruits, meat protein including organ meat, and complete abstinence from products containing gluten [wheat, barley, rye, etc], dairy, potatoes, and legumes [beans, lentils, peanuts, soy, etc]).41 Subjects were computer literate, able to keep Food Logs recording their daily food intake, and stated they were able to accommodate a possible 30% increase in grocery expenses.
Subjects were excluded if they had any of the following: cancer, liver disease, kidney disease, diabetes, active heart disease, heart block or arrhythmias, bleeding disorders, concurrent diuretic use, anticoagulant or antiplatelet use, psychosis or other psychiatric disorders likely to impact ability to comply with study procedures, or any change in prescription medication for mental health problems such as depression or anxiety during the 3 months preceding enrollment. Subjects were also excluded if they did not obtain neurologist verification of their RRMS diagnosis, did not complete a baseline Automated Self-Administered 24-hour dietary recall application (ASA-24), or a 2-week Food Diary before randomization.
Procedure
Subject involvement lasted for 3.5 months. Measurements were taken at baseline and 3 months after beginning the protocol arm. A Food Diary was kept by both intervention and control groups to serve as a 2-week “run-in” task to ensure subjects would complete food documentation during the protocol. The Food Diary is a simple food-recording tool allowing for recording of the type of food and when it was consumed each day. If the Food Diary was completed and neurologist verification of RRMS was received, subjects were randomized into intervention and “usual care” control group arms. Usual care is defined as the typical physician recommendations for MS. Random coin flip was used to determine group assignment for the first five subjects in each group, then subjects were added to each group according to Fatigue Severity Scale (FSS) scores, in order to approximately equalize the groups in terms of mean FSS score. Training for the intervention group consisted of subject orientation to the MPDI and maintenance of the Food Log (Figure S1). The Food Log is a more complex food-recording tool than the Food Diary, which allows for recording how much of each food goal category (such as organ meat or leafy green servings) was consumed each day. The necessity for such a tool was realized in previous studies due to the complex nature of the nutritional intervention.39,41 Training for the control group consisted of reviewing study expectations (maintenance of a normal diet) and maintenance of the Food Diary (Figure S2). Both groups were asked to continue their current MS therapy and/or medications.
Upon commencement of the 3-month diet protocol, all subjects received one short follow-up phone call per week for the first 3 weeks, then every other week thereafter. The purpose of these calls was to provide counseling or assistance when needed and to ensure subjects accurately maintained a Food Log (intervention group) or Food Diary (control group) daily. All subjects were encouraged to contact the research team to receive additional instruction on any aspect of the protocol when needed.
Outcome measures
The primary outcome measure was perceived fatigue using the FSS.42,43 The secondary outcome measures of physical and cognitive function included the following: Multiple Sclerosis Quality of Life (MSQOL)-54 to evaluate QOL,44 Veteran’s Specific Activity Questionnaire (a strong predictor of actual and predicted exercise capacity or Metabolic Equivalent Tasks [METs]),45 MS Functional Composite to evaluate motor (gait [25-Foot Walk {25-FW}], hand [9-Hole Peg Test {9-HPT}]) and cognitive function (Paced Audio Serial Addition Test [PASAT]),46–50 and timed 6-minute walk (6-MW) to measure gait velocity and endurance (performed in a 200-foot hallway that included a short low-grade ramp up and back down at the midpoint).51 These tests and surveys were administered by a trained research assistant who could not be blinded to group assignment (due to subject disclosure) or time of test (baseline vs postprotocol). Other secondary outcome measures included blood serum “measures” of highly sensitive C-reactive protein (hs-CRP, to assess subclinical inflammatory activity),52,53 homocysteine (HCY, implicated in pathogenesis of neurodegenerative disorders),54–58 and vitamins B-1 (thiamine),59,60 B-9 (folate),61,62 B-12 (cobalamin),61,63 and K,64–70 all of which play potentially important roles in oxidative metabolism, inflammation, and immune function. Blood was drawn by a phlebotomist, and serum concentrations were measured in a clinical laboratory that was blinded to group assignment. Adherence to diet was assessed utilizing the ASA-24: a free, web-based tool modeled on the Automated Multiple-Pass Method.71,72 ASA-24 recalls were completed within 3 days of the baseline visit and were scheduled for 1 and 3 months after beginning the protocol arm.
Adherence to the MPDI was determined by complete abstinence from gluten and dairy after baseline ASA-24. This was done by evaluating output from the Individual Foods and Pyramid Equivalents (INFMYPHEI) and the Daily Total Pyramid Equivalents (TNMYPHEI) batched ASA-24 reports. Corrections were made by line item in the INFMYPHEI report to remove corn and rice from grain ounce equivalent totals for individual subjects. When a question of adherence arose due to nonspecification of a food as being gluten or dairy containing (a cookie or milk, for example, in the INFMYPHEI report of a MPDI subject), Food Logs (intervention group) or Food Diaries (control group) were consulted. Subjects were removed from the final analysis if they were not compliant. All but two MPDI subjects who completed the protocol were found to be adherent to their assigned group. Adherence was defined as MPDI group subjects not consuming gluten or dairy products after baseline testing and control subjects continuing to consume such foods in amounts similar to baseline testing. Incorrectly coded entries for food items known not to contain gluten or dairy that were listed as containing one or both of these were removed from the analysis.
Data analysis
To manage dropouts, per-protocol analysis was used as the primary outcome analysis to measure efficacy. We also reported a modified intention-to-treat (ITT) analysis to measure effectiveness of the MPDI (in subjects for whom we have postprotocol data).73,74 The modified ITT analysis includes two subjects who did not adhere to the MPDI protocol. We used STATISTICA for statistical analysis. Group data are described by means and standard error. Data were assessed for normality at baseline using the Kolmogorov–Smirnov test. Demographic information was compared among subjects assigned to each group and those who withdrew from each group using a one-way (four groups – control, assigned controls who withdrew, MPDI, assigned MPDI who withdrew) analysis of variance (ANOVA). We compared baseline and postprotocol outcome measures between patient groups by repeated measures ANOVA. Reported ANOVA results are group × time interactions unless otherwise stated. For individual binary (within and between group) post hoc comparisons (baseline and postprotocol), we used Tukey’s range test (reported as post hoc p-values in the “Results” section). Since this was a pilot study in a relatively small number of subjects, we did not correct for multiple comparisons in the repeated measures ANOVAs of the secondary outcome variables. We considered statistical test results to be significant at a level of p<0.05, but we report all p-values <0.1 as representing potentially important outcomes due to the small number of subjects.
Results
Subjects
Of 82 individuals assessed for eligibility, 34 were randomly assigned to the two groups: 17 were allocated to the MPDI group and 17 to the control group (Figure 1). Baseline demographic and disease characteristics were similar in both study groups (Table 1). There were no differences in age (p=0.88), duration of disease (at the start of study involvement; p=0.26), or education (p=0.47), among enrolled subjects allocated to either group who completed the study or withdrew. Study completion rates were similar across study groups (58.8% for the MPDI group and 52.9% for the control group from allocation to protocol end). Subjects withdrew for a variety of reasons related to difficulty adhering to the study protocol. Three subjects (two from the control group) experienced flare-ups, and so their participation in the study was brought to an end. Four subjects (three from the control group) were lost to follow-up; we do not have reasons for their withdrawal. Subjects who did not complete the posttraining protocol due to flare-ups, loss to follow-up, or voluntary withdrawal are included as withdrawals in Figure 1. No adverse events were reported.
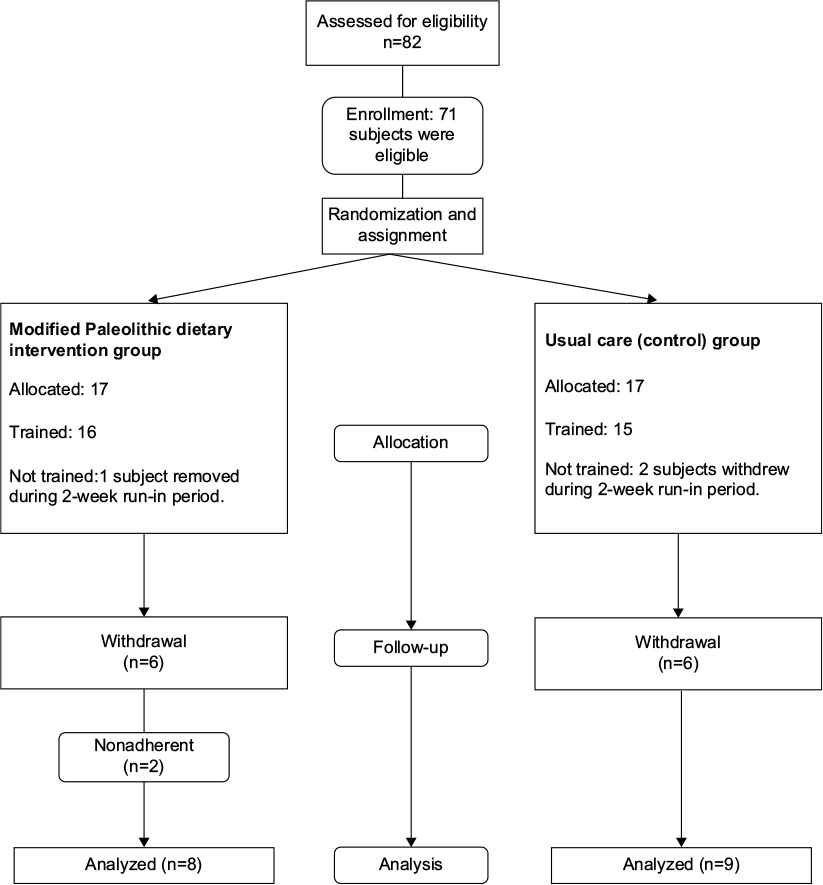 | Figure 1 Study flowchart. Notes: Eighty-two individuals were screened for eligibility using a simple phone script. Seventy-one individuals were found eligible to participate; of these, thirty-one consented and completed baseline study measurements. Seventeen individuals were allocated to the MPDI, sixteen trained, and ten completed all study procedures. Two subjects were removed from the analysis due to nonadherence to the MPDI. Seventeen individuals were allocated to the control group, fifteen trained, and nine completed all study procedures. |
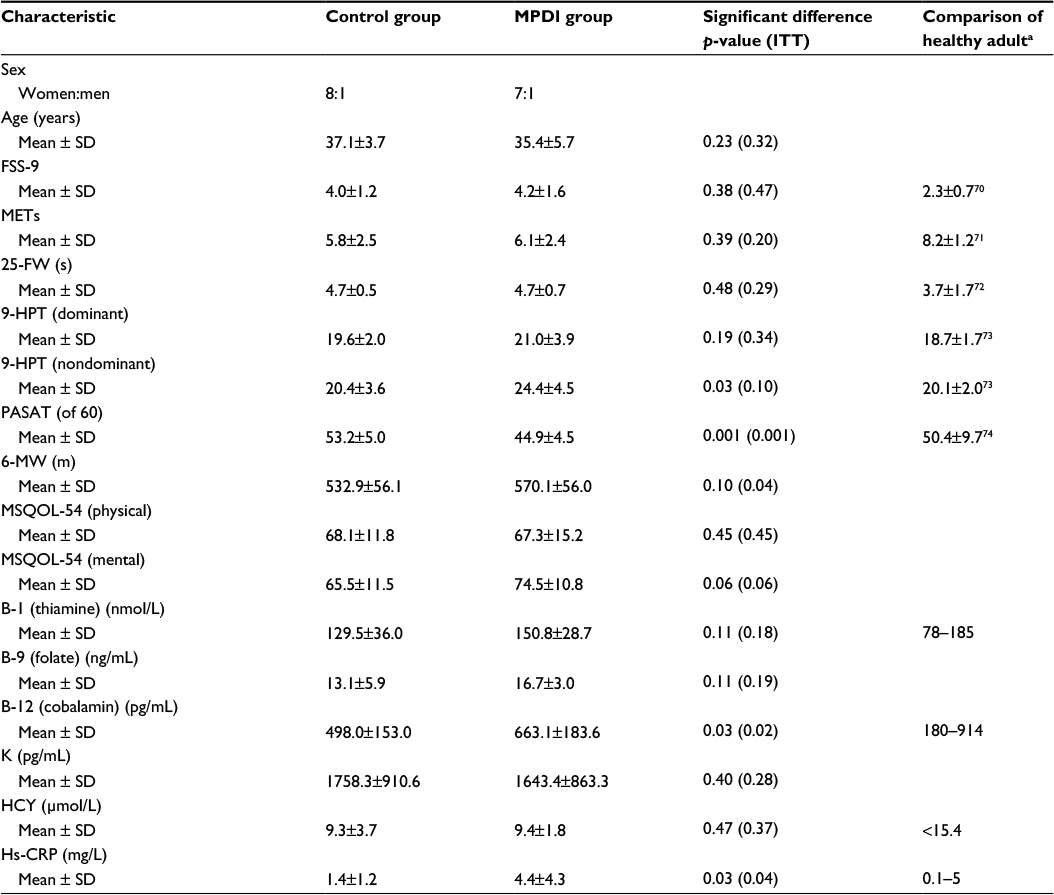 | Table 1 Baseline characteristics of subjects in control and MPDI groups Notes: aNormative laboratory values are specific for methodologies/instrumentation; between laboratories, values can differ; values were obtained from provided citations or (for serum measures) our testing facility. Abbreviations: MPDI, modified Paleolithic dietary intervention; ITT, intention-to-treat; SD, standard deviation; FSS, Fatigue Severity Scale; METs, Metabolic Equivalent Tasks; 25-FW, 25-Foot Walk; 6-MW, 6-minute walk; PASAT, Paced Audio Serial Addition Test; 9-HPT, 9-Hole Peg Test; Hs-CRP, high-sensitivity C-reactive protein; HCY, homocysteine; MSQOL, Multiple Sclerosis Quality of Life. |
Subjects who withdrew from the study differed from subjects who completed the study protocol. Control subjects who withdrew performed more poorly on average for 9-HPT (both dominant and nondominant hands, t-test: p=0.01), PASAT (p=0.02), and 25-FW (p=0.07). However, these subjects had higher average vitamin B-12 serum levels (p=0.04) than control subjects completing the protocol. Subjects assigned to the MPDI who withdrew early had lower HCY (p=0.02) and faster average time to complete the nondominant 9-HPT (p=0.05) than those who completed and adhered to the study protocol.
There were significant differences between subjects in the control group vs those in the MPDI group at baseline for nondominant 9-HPT, PASAT, vitamin B-12, and hs-CRP (Table 1, p<0.05). There were also differences between subjects in the control and MPDI groups for MSQOL mental (MSQOL-M) (Table 1, 0.05>p<0.1). For all other measures, there were no significant differences between groups at baseline. Average scores for FSS, METs, 25-FW, and 9-HPT (for both hands) were slightly worse for usual care controls and MPDI subjects compared to those of comparison healthy adults. This was expected due to the low disability experienced by individuals diagnosed with RRMS who participated in this study (Table 1).
Adherence
As determined from ASA-24 and daily Food Logs/Diaries, average consumption of both gluten and dairy decreased to zero after baseline for the MPDI group, whereas the control group subjects maintained a similar range of consumed ounce and cup equivalents, respectively, of gluten and dairy containing products throughout the protocol (Table S1). This indicates that the subjects in the control group maintained their usual diet in terms of gluten and dairy products, whereas the MPDI group subjects adhered to the prescribed MPDI in that gluten and dairy were not consumed during the protocol.
Efficacy
Fatigue and quality of life
The primary outcome measure, perceived fatigue associated with daily activities, decreased in MPDI subjects but not in controls. Average FSS scores decreased by 1.4 points in the MPDI group, but increased by 0.2 points in controls (Figure 2A, p=0.03, post hoc: p<0.05 [ITT: p=0.05]). Four MPDI subjects had average FSS score reductions of more than 1 point postprotocol (Figure 2B). In contrast, none of the controls had such large decreases, and two controls experienced increased FSS scores greater than 1 point.
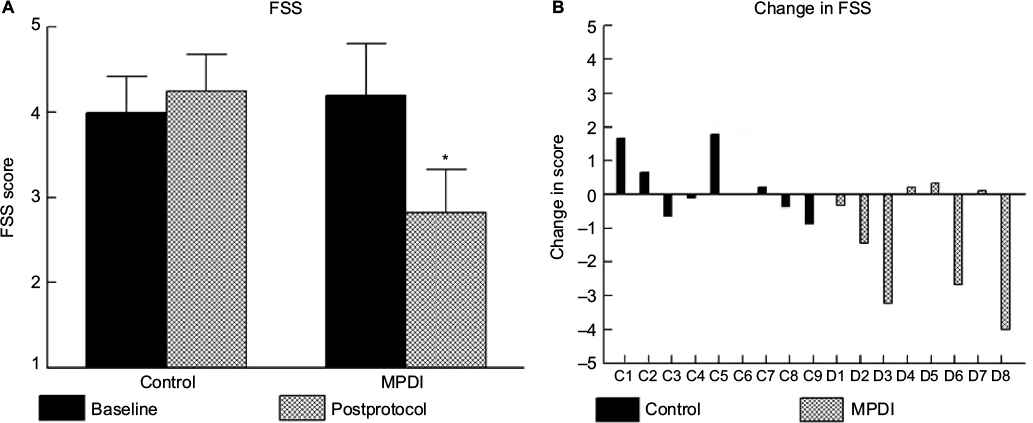 | Figure 2 Mean FSS scores at baseline and postprotocol in control and MPDI groups (A). Each bar represents the mean score from the nine questions of the FSS for each subject group (abscissa) at baseline (black bars) and postprotocol (crosshatch bars). Error bars indicate ± SE. Changes in FSS scores of individual control (C1–C9) and MPDI (D1–D8) subjects from baseline to postprotocol (B); * denotes significant difference. Abbreviations: MPDI, modified Paleolithic dietary intervention; FSS, Fatigue Severity Scale; SE, standard error. |
Mental health QOL improved in MPDI subjects postprotocol compared to control subjects (Figure 3A and B, p=0.02, post hoc: p<0.05 [ITT: p=0.02, post hoc: p<0.05]). Despite having much higher average scores at baseline, the average MSQOL-M health score for the MPDI group improved by 16.2%, whereas the average score for the control group decreased by 1.5% postprotocol. All MPDI subjects demonstrated improved MSQOL-M health scores of at least 5 points, whereas only three controls experienced similar improvements (Figure 3B). Similarly, increased physical health QOL was observed in MPDI subjects postprotocol compared to controls (Figure 3C and D, p=0.03, post hoc: p<0.05 [ITT: p=0.06]). All subjects, except D1, in the MPDI group had improved MSQOL physical (MSQOL-P) scores, whereas only three control subjects improved (Figure 3D). The majority of control subjects (C2– C5, C7– C8) had decreased MSQOL-P scores postprotocol (Figure 3D).
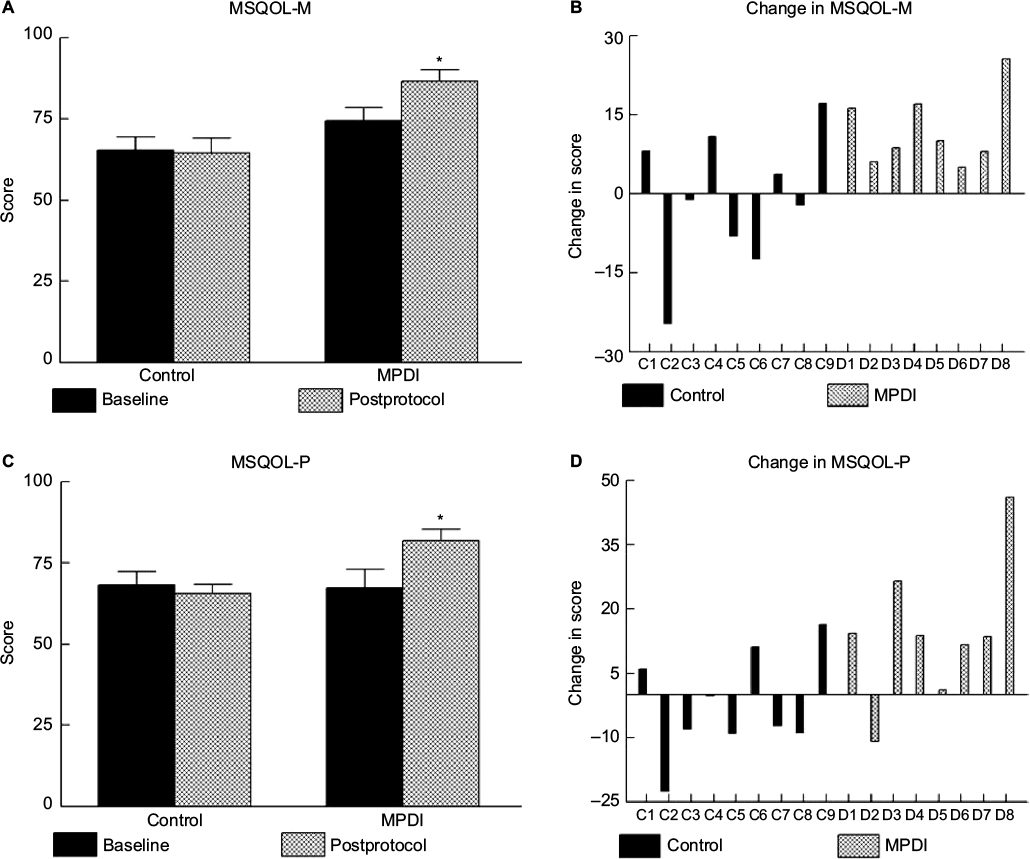 | Figure 3 Mean changes in MSQOL-M (A) and MSQOL-P (C). Each bar represents the mean score for the MSQOL mental (A) and physical (C) health domains for subject groups (abscissa) at baseline (black bars) and postprotocol (crosshatch bars). Error bars indicate ± SE. Changes in MSQOL scores of individual control (C1–C9) and MPDI (D1–D8) subjects from baseline to postprotocol for mental (B) and physical (D) health domains. * denotes significant difference. Abbreviations: MPDI, modified Paleolithic dietary intervention; MSQOL, Multiple Sclerosis Quality of Life; MSQOL-M, MSQOL mental; MSQOL-P, MSQOL physical; SE, standard error. |
MS Functional Composite, motor function, and exercise capacity
Subjects in both groups demonstrated improved gait function, but MPDI group subjects tended to improve more than controls. MPDI subjects decreased 25-FW time after the intervention by 11.6% on average, whereas controls decreased by only 3% (Figure 4C, p=0.09 [ITT: p=0.20]). Similarly, the MPDI group improved 6-MW distance by 10.7% at postprotocol, whereas the control group improved by 5.5% postprotocol compared to baseline (Figure 4D, time effect: p=0.004 [ITT: p=0.24]). Subjects in the MPDI group exhibited greater improvements in fine hand motor function than controls. Greater reductions in time to complete the 9-HPT with the dominant (Figure 4A, p=0.02, post hoc: p=0.37 [ITT: p=0.03, post hoc: p=0.14]) and nondominant (Figure 4B, p=0.05 [ITT: p=0.14]) hands at postprotocol were observed in the MPDI group compared to subjects in the control group. Both groups demonstrated reduced time to complete the 9-HPT, but average decreases by MPDI subjects were 15.1% and 18.2%, whereas controls decreased by only 3% and 7.4% for dominant and nondominant hands, respectively. Small improvements of 5.5% and 10.9% from baseline to postprotocol were observed in PASAT scores of controls and MPDI subjects, respectively (time effect: p=0.01 [ITT: p=0.003]), but there were no differences between the two groups (p=0.17 [ITT: p=0.09]). Greater improvements in METs/exercise capacity on the Veteran’s Specific Activity Questionnaire were seen in MPDI subjects postprotocol compared to controls (p=0.08 [ITT: p=0.06]). On average, the control group showed no change from baseline to postprotocol, whereas the MPDI group reported a 26.5% improvement in METs.
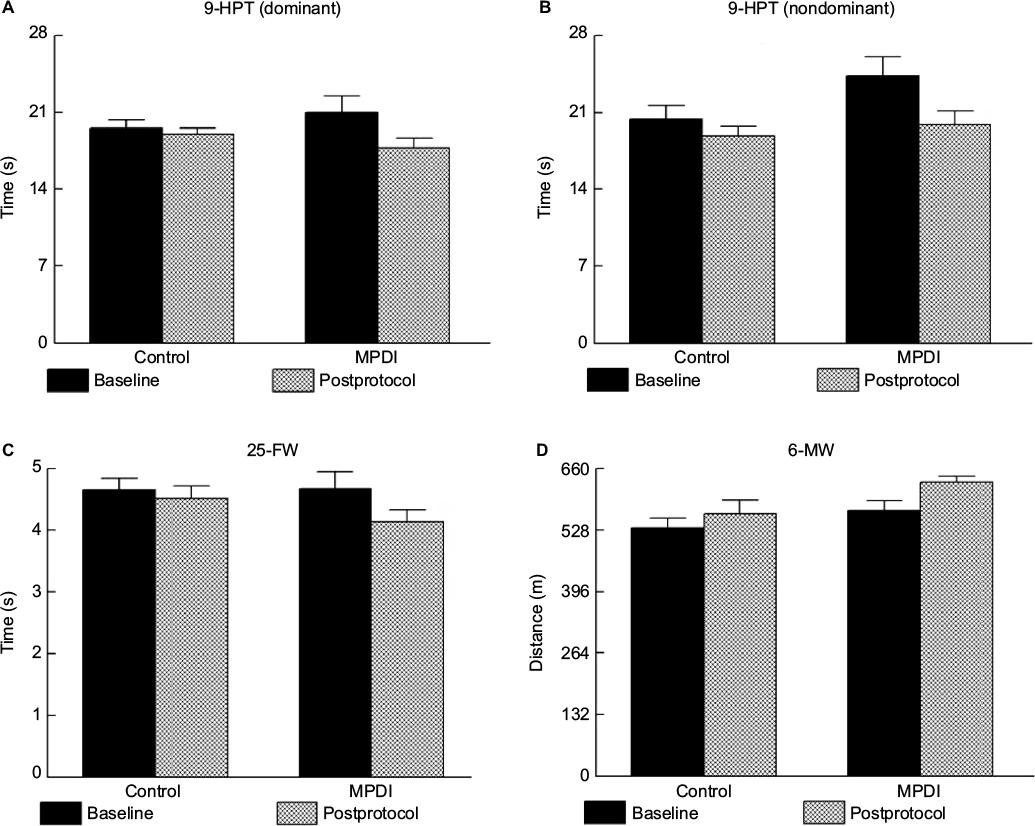 | Figure 4 Average changes in motor tests for each group: dominant hand 9-HPT (A), nondominant hand 9-HPT (B), 25-FW (C), and 6-MW (D). Notes: Each bar represents the mean time (A–C), or distance walked (D), for the control or MPDI groups in the specified test at baseline and postprotocol. Average times in two 9-HPT trials with each hand and two 25-FW tests were used. Error bars indicate ± SE. Abbreviations: SE, standard error; 9-HPT, 9-Hole Peg Test; 25-FW, 25-Foot Walk; 6-MW, 6-minute walk; MPDI, modified Paleolithic dietary intervention. |
Blood serum measures
Serum levels of vitamin K increased substantially on average in the MPDI group subjects, but did not change greatly in controls (Figure 5A, p=0.02, post hoc: p<0.05 [ITT: p=0.04, post hoc: p<0.05]). Seven of the eight MPDI subjects demonstrated increased vitamin K serum levels, whereas only three control subjects (3, 4, and 8) experienced similar improvements. Control group subjects averaged a 3.6% decrease in vitamin K, whereas the MPDI group averaged a 262% increase from baseline.
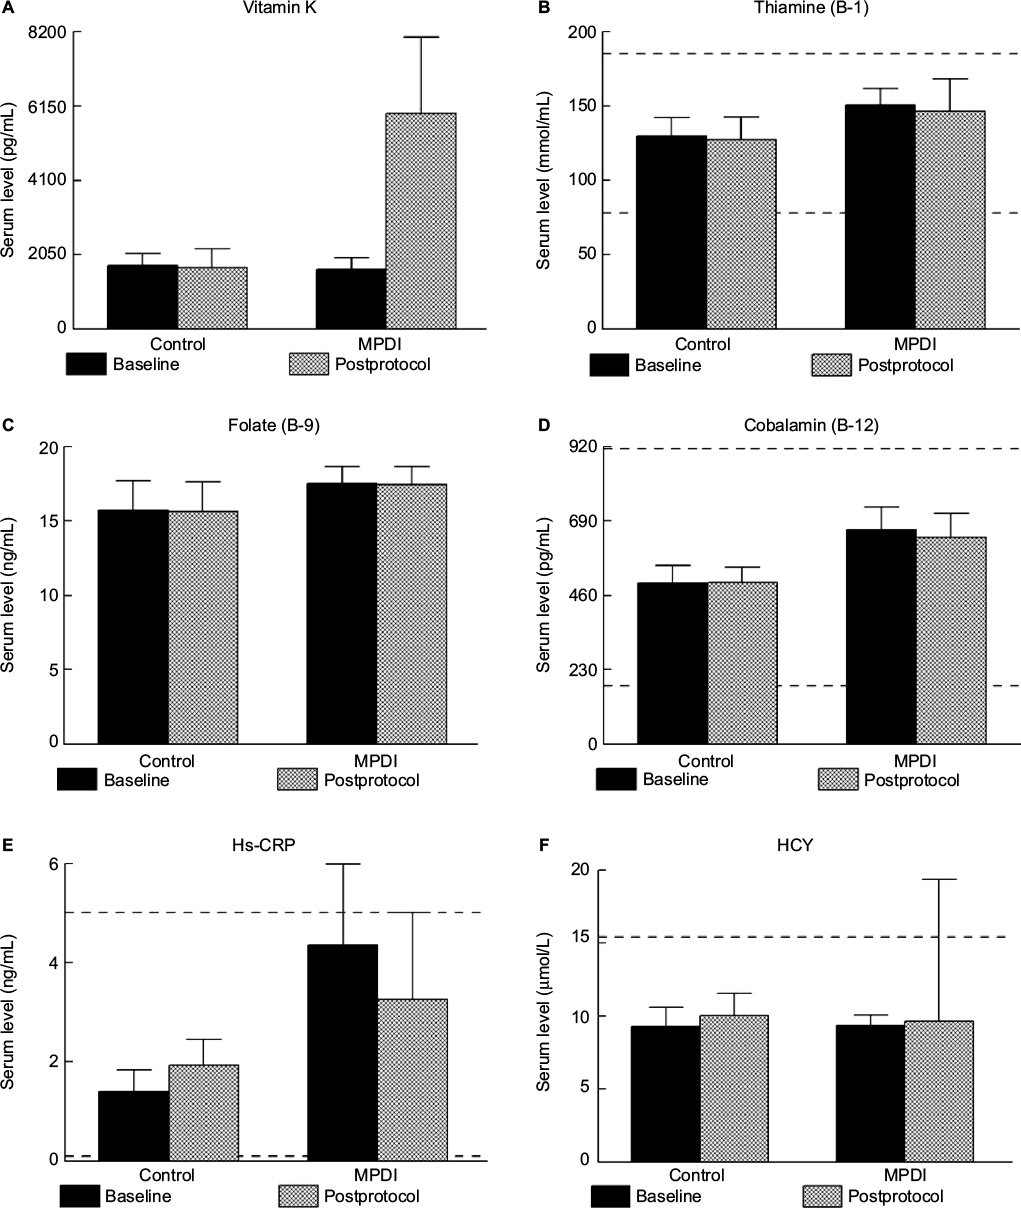 | Figure 5 Average changes in blood serum concentrations of vitamins K (A), B-1 (B), B-9 (C), B-12 (D), Hs-CRP (E), and HCY (F). Notes: Each bar represents the mean serum concentration of the specified measure for the control or MPDI group at baseline and postprotocol. Error bars indicate ± SE. The dashed lines represent presumptive upper and lower serum measure limits of healthy adults (normative laboratory values reported by testing facility). Abbreviations: MPDI, modified Paleolithic dietary intervention; SE, standard error; HCY, homocysteine. |
No changes in hs-CRP serum levels were detected in either group postprotocol (Figure 5E, p=0.45 [ITT: p=0.38]). However, despite starting with much lower hs-CRP, the control group demonstrated an average hs-CRP serum level increase of 38.1%, whereas the MPDI group demonstrated a 25% decrease in average hs-CRP postprotocol compared to baseline. No differences in homocysteine serum levels were observed between groups postprotocol compared to baseline (Figure 5F, p=0.87 [ITT: p=0.80]). Both groups demonstrated increased average HCY postprotocol. The average HCY serum level in the control group increased by 8% and by 3% in the MPDI group postprotocol compared to baseline. No differences were seen in any of the vitamin B serum measures (B-1: Figure 5B, p=0.99 [ITT: p=0.89]; B-9: Figure 5C, p=0.69 [ITT: p=0.44]; and B-12: Figure 5D, p=0.71 [ITT: P=0.89]).
Discussion
Important health-related improvements in perceived fatigue, physical and mental health QOL, and dominant hand motor function were observed along with increased vitamin K serum levels in the MPDI group compared to the control group postprotocol (p<0.05). Smaller improvements in exercise capacity, nondominant hand motor function, and 25-FW were also seen in the MPDI compared to controls postprotocol (p<0.1).
The MPDI appears to reduce perceived fatigue associated with performing daily activities, which is an important problem for MS patients contributing to reduced self-efficacy and QOL.14,75–78 We expected to observe such improvements in postprotocol MPDI subjects based on preliminary results from studies in progressive MS patients.39,41,79 However, these previous studies suggested that a multimodal intervention including diet, nutritional supplementation, exercise, neuromuscular stimulation, and stress reduction may be necessary to reduce fatigue, whereas we observed improvement with diet alone. Clinically significant improvements in fatigue (more than 2 points reduction on FSS) were observed in three of the eight MPDI subjects (Figure 2B).80 There were no significant differences in FSS scores between groups at baseline, but MPDI group subjects demonstrated improved FSS scores, whereas FSS scores worsened for control group subjects on average (Figure 2A). This is significant as studies suggest there is little evidence supporting currently prescribed pharmacological treatments to help persons with MS manage their fatigue, yet these treatments may result in distressing side effects.81,82 Previous review studies have also suggested that unhealthy eating patterns may aggravate fatigue, which may explain the worsened fatigue in some control group subjects postprotocol.22,83
Consistent with the improvement in perceived fatigue, the MPDI was also associated with improved mental and physical health QOL and disease outlook relative to controls. All MPDI subjects demonstrated improved MSQOL-M health scores, and all but one exhibited improved MSQOL-P health scores, whereas controls had variable changes with, on average, no change in MSQOL-M and -P scores (Figure 3). Notably, the improvement in MSQOL-M occurred even though MPDI subjects had much higher scores at baseline (Figure 3). These findings indicate positive health effects due to the MPDI, such as improved disease management and coping, consistent with outcomes from other nonpharmaceutical interventions, further suggesting the MPDI may provide relief from declining mental and physical health that currently prescribed pharmaceuticals do not offer.13,84–87 Furthermore, self-efficacy, the belief in one’s ability to produce outcomes one wants, is a strong predictor of health behavior and can be instrumental in modulating the experience of chronic illness.13,15
Improved motor function observed in MPDI subjects is consistent with self-reported improved physical health QOL. Subjects in the MPDI group exhibited reductions in time to complete the 9-HPT with both hands, increased distance walked in the 6-MW test, and showed greater improvements in gait speed in the 25-FW test relative to controls. Although part of these improvements were probably due to experience with the tests, since controls also showed some improvement, the larger improvements in MPDI subjects are likely related to the effects of MPDI on QOL and associated increases in physical activity during the 3 months’ protocol. It is also possible that the MPDI reduces central nervous system inflammation, thereby improving nervous system function and performance on motor and cognitive tasks.88,89
The mechanisms underlying the effects of MPDI are unclear. We measured a number of blood biomarkers that may be related to disease progression, but only vitamin K serum levels were significantly improved by the diet. There was no evidence of improved serum concentrations of HCY or B vitamins. The large increases in serum levels of vitamin K may indicate reductions in oxidative cell and mitochondrial damage along with reduced inflammation, perhaps contributing to improved cognitive and motor function, fatigue, and QOL.64–69 The increases in serum vitamin K levels seen only in the MPDI group may also confirm adherence to the protocol components of three cups of leafy greens each day (vitamin K1) and organ meats (vitamin K2).
There was some evidence that the MPDI decreases hs-CRP serum levels (Figure 5E). Although MPDI subjects experienced, on average, a reduction in hs-CRP serum levels postprotocol compared to subjects in the control group, who exhibited a 38.1% increase in hs-CRP from baseline, there were no statistically significant differences due to high intersubject variability and the small number of subjects. Overall, hs-CRP serum levels may indicate progression of disease; however, cultural and ethnic differences, as well as dietary variability, may influence dietary impact on hs-CRP.52,90 Some studies demonstrate elevated plasma HCY levels in MS patients, whereas others report no differences between MS patients and controls.54,91–95 The slight increase in HCY seen in subjects assigned to the control group may represent the disease state of MS (Figure 5F). Future studies should consider measuring an array of serum proinflammatory cytokines. There are recent reports that more of these cytokines are elevated relative to healthy controls in pediatric RRMS patients with diagnosed relapse compared to patients in remission.96
We expected to observe measureable increases in serum vitamin B levels as prescribed components of the MPDI are significant sources of B vitamins. However, no significant differences were seen in any of the vitamin B serum levels postprotocol compared to baseline. This may be due to incomplete adherence to the diet as yeast (the most concentrated source of B-1) and liver (a very high source of B-12 and the most concentrated source of B-9) consumption were not requisite to achieve dietary adherence for our analysis and were found through phone check-ins to be less tolerated than other aspects of the MPDI.97–99 This might explain why both groups essentially maintained their baseline vitamin B serum levels, but it is not clear why the MPDI group had slightly reduced serum levels of the studied B vitamins (Figure 5B–D). Grains, which were restricted in the MPDI, are also significant, concentrated sources of B-1 and B-9, and it has been demonstrated that serum levels of thiamine, folate, and HCY are sensitive indicators of dietary B-1 and B-9 intake.100–103 Our results demonstrate that abstaining from grains did not negatively affect vitamin B levels in MPDI subjects. This finding also likely contributes to the maintenance of HCY levels from baseline to postprotocol for the MPDI group as HCY is strongly linked to folate status.104 Recent research also demonstrates an effect of diminishing returns for vitamin B-12 such that increased intake does not lead to increased serum levels.105–108 The same is true for serum folate levels given our laboratory testing protocol.109–111 The interaction of these factors serves to explain the essentially null findings regarding serum vitamin B measures.
Limitations
The high number of subject withdrawals observed is consistent with previous studies and is likely due to the difficulty of lifestyle interventions.112–114 The monetary costs associated with purchasing food for the MPDI can be substantial, although more recent iterations have used cooking classes and education to make diet adherence possible for those with limited financial means. Subjects are self-selected for the current study based on their ability to afford a potential 30% increase in food costs, perhaps demonstrating a socioeconomic bias.41 This bias may limit the application of treatment to individuals who are better educated and more affluent and may also reflect current diagnostic and treatment biases in persons who have received MS diagnoses. It is worth noting that 72.7% of all enrolled subjects received at least a bachelor’s degree, in contrast to the 20.2% of Americans who have received a bachelor’s degree.115
Of course, no diet can be completely exclusive of “forbidden” items in the context of subject-directed meal planning and eating. It is unlikely that any recall tool, including the ASA-24, is well-suited for detecting minute sources of gluten or dairy consumed, for instance, in the context of a dinner away from home. The ASA-24 also does not have qualifiers for nondairy milk sources (such as almond or coconut milks) or gluten-free versions of common foods (such as pizza or pasta). Another limitation of the ASA-24 is its inability to detect foods that may or may not contain gluten or dairy (such as granola). Additionally, since the ASA-24 is a self-reporting tool, an individual may not feel compelled to list an item “only nibbled on”, such as a bite of a child’s dinner or a spouse’s dessert, reflected by occasional subject admissions during phone interviews. However, subjects were encouraged to “cheat smart” choosing nongluten grains and vegetable starches over the craving for a cheesy, glutinous pizza, for example. This approach increases the usefulness of such a prescribed treatment as it takes into account the realistic shortfalls of human self-control. These deviations from the assigned protocol, if thoroughly evaluated, may serve to demonstrate a dose–response associated with increased adherence to the protocol and would strengthen the validity of our work. Furthermore, the ASA-24 is only as good as the data programmed into it. We did find entries for food items known not to contain gluten or dairy (Clif bars, for example) that were listed as containing these components. These foods were removed from our analysis, but could affect the results by making the subject appear more or less adherent.
Lack of blinding of research personnel administering the various cognitive and motor tests to the subject groups is a clear limitation of this research. Future investigations should use different evaluators at baseline and postprotocol and strongly warn subjects prior to the posttest that they should not discuss their diet with the evaluator. Additionally, there may be a placebo effect with retesting of subjects, especially in individuals selected to the MPDI as they may be more motivated to perform well than their counterparts in the control group. Controlling for placebo effect in dietary interventions is difficult and typically utilizes a pill or control diet in an attempt to simulate complex lifestyle changes.116,117 However, unless we remove the pharmacologic and/or nutritional components of a drug or food from study, it cannot be said that we have truly isolated the intervention under study; of course, this is impossible in the study of nutrition.117 However, previous studies have shown that placebos can offer measurable changes in health and do not detract from therapeutic potential.118–122 Similarly, lack of expectation of positive effects in the control group may have contributed to smaller changes due to experience with the tasks than in the MPDI group.
Use of per-protocol analysis as the primary statistical analysis may also be viewed as a limitation because of the potential to bias results and interpretation. However, our primary interest in this study was to evaluate potential efficacy in subjects who adhered to the MPDI relative to those who maintained their usual diet. Including subjects who did not adhere to the study diet would not provide a clear answer to whether the diet can be efficacious. By including results of an ITT statistical analysis, we have provided information relevant to design of a larger trial of the modified Paleo diet to evaluate the overall effectiveness of the dietary intervention in MS.
Conclusion
Our results demonstrate statistically significant health-related improvements in perceived fatigue, MSQOL-M and -P health scores, serum levels of vitamin K, and dominant hand 9-HPT along with improved nondominant 9-HPT, METs, and 25-FW in MPDI subjects postprotocol compared to the control group. These results are consistent with the results of previous studies evaluating complementary and alternative medicine interventions as well as approaches that put the patient in control of treatment for his/her illness.12,14
These findings may support a Paleo diet as a potential treatment for patients with RRMS or as an addition to currently available therapies. The observed reductions of perceived fatigue, increases in serum vitamin K (a proxy for reductions in oxidative cell and mitochondrial damage), and improvements in exercise capacity, mental and physical QOL, and motor function suggest using a Paleo diet may improve overall well-being in individuals diagnosed with RRMS. However, further studies with larger sample size, dietary change of longer duration, and blinding of research personnel to subject groups are necessary to conclusively assess the effects of the MPDI. Additional work evaluating variations in levels of adherence to the diet might produce results further defining the required “dosage” of this dietary intervention for MS.
Acknowledgments
The authors gratefully acknowledge the assistance of Sara Hussain, Linda Rubenstein, and Kelly Cole in critically revising the manuscript.
Disclosure
This study was supported by a grant from TZ Press, which is owned by Dr TLW. Dr TLW has a data management plan on file with The University of Iowa. The authors report no conflicts of interest in this work.
References
Goverman J. Autoimmune T cell responses in the central nervous system. Nat Rev Immunol. 2009;9(6):393–407. | ||
Ramagopalan SV, Dobson R, Meier UC, Giovannoni G. Multiple sclerosis: risk factors, prodromes, and potential causal pathways. Lancet Neurol. 2010;9(7):727–739. | ||
Goodin DS. The causal cascade to multiple sclerosis: a model for MS pathogenesis. PLoS One. 2009;4(2):e4565. | ||
Marrie RA. Environmental risk factors in multiple sclerosis aetiology. Lancet Neurol. 2004;3(12):709–718. | ||
Mc Guire C, Prinz M, Beyaert R, van Loo G. Nuclear factor kappa B (NF-kappaB) in multiple sclerosis pathology. Trends Mol Med. 2013;19(10):604–613. | ||
Bitsch A, Bruck W. Differentiation of multiple sclerosis subtypes: implications for treatment. CNS Drugs. 2002;16(6):405–418. | ||
Lublin FD, Reingold SC. Defining the clinical course of multiple sclerosis: results of an international survey. National Multiple Sclerosis Society (USA) Advisory Committee on Clinical Trials of New Agents in Multiple Sclerosis. Neurology. 1996;46(4):907–911. | ||
D’Hooghe MB, Nagels G, Bissay V, De Keyser J. Modifiable factors influencing relapses and disability in multiple sclerosis. Mult Scler. 2010;16(7):773–785. | ||
Clegg A, Bryant J. Immunomodulatory drugs for multiple sclerosis: a systematic review of clinical and cost effectiveness. Expert Opin Pharmacother. 2001;2(4):623–639. | ||
Chaudhuri A, Behan PO. Treatment of multiple sclerosis: beyond the NICE guidelines. QJM. 2005;98(5):373–378. | ||
Jelinek GA, Hassed CS. Managing multiple sclerosis in primary care: are we forgetting something? Qual Prim Care. 2009;17(1):55–61. | ||
Yadav V, Shinto L, Bourdette D. Complementary and alternative medicine for the treatment of multiple sclerosis. Expert Rev Clin Immunol. 2010;6(3):381–395. | ||
Jongen PJ, Ruimschotel R, Heerings M, et al. Improved self-efficacy in persons with relapsing remitting multiple sclerosis after an intensive social cognitive wellness program with participation of support partners: a 6-months observational study. Health Qual Life Outcomes. 2014;12:40. | ||
Hadgkiss EJ, Jelinek GA, Weiland TJ, et al. Health-related quality of life outcomes at 1 and 5 years after a residential retreat promoting lifestyle modification for people with multiple sclerosis. Neurol Sci. 2013;34(2):187–195. | ||
McCabe MP, McKern S, McDonald E. Coping and psychological adjustment among people with multiple sclerosis. J Psychosom Res. 2004;56(3):355–361. | ||
Farinotti M, Vacchi L, Simi S, Di Pietrantonj C, Brait L, Filippini G. Dietary interventions for multiple sclerosis. Cochrane Database Syst Rev. 2012;12:CD004192. | ||
Riccio P. The molecular basis of nutritional intervention in multiple sclerosis: a narrative review. Complement Ther Med. 2011;19(4):228–237. | ||
Jacobs DR Jr, Gross MD, Tapsell LC. Food synergy: an operational concept for understanding nutrition. Am J Clin Nutr. 2009;89(5):1543S–1548S. | ||
Jacobs DR, Tapsell LC. Food synergy: the key to a healthy diet. Proc Nutr Soc. 2013;72(2):200–206. | ||
Wu X, Schauss AG. Mitigation of inflammation with foods. J Agric Food Chem. 2012;60(27):6703–6717. | ||
Sears B, Ricordi C. Anti-inflammatory nutrition as a pharmacological approach to treat obesity. J Obes. 2011;2011:14. | ||
Riccio P, Rossano R. Nutrition facts in multiple sclerosis. ASN Neuro. 2015;7(1):pii: 1759091414568185. | ||
Berkson BM, Rubin DM, Berkson AJ. Revisiting the ALA/N (alpha-lipoic acid/low-dose naltrexone) protocol for people with metastatic and nonmetastatic pancreatic cancer: a report of 3 new cases. Integr Cancer Ther. 2009;8(4):416–422. | ||
Nam NH. Naturally occurring NF-kappaB inhibitors. Mini Rev Med Chem. 2006;6(8):945–951. | ||
Ramakers JD, Mensink RP, Schaart G, Plat J. Arachidonic acid but not eicosapentaenoic acid (EPA) and oleic acid activates NF-kappaB and elevates ICAM-1 expression in Caco-2 cells. Lipids. 2007;42(8):687–698. | ||
Hernandez-Lahoz C, Rodrigo L. [Gluten-related disorders and demyelinating diseases]. Med Clin (Barc). 2012;140(7):314–319. Spanish. | ||
Rodrigo L, Hernandez-Lahoz C, Fuentes D, Alvarez N, Lopez-Vazquez A, Gonzalez S. Prevalence of celiac disease in multiple sclerosis. BMC Neurol. 2011;11:31. | ||
Hadjivassiliou M, Sanders DS, Grunewald RA, Woodroofe N, Boscolo S, Aeschlimann D. Gluten sensitivity: from gut to brain. Lancet Neurol. 2010;9(3):318–330. | ||
Shor DB, Barzilai O, Ram M, et al. Gluten sensitivity in multiple sclerosis: experimental myth or clinical truth? Ann N Y Acad Sci. 2009;1173:343–349. | ||
Stefferl A, Schubart A, Storch M, et al. Butyrophilin, a milk protein, modulates the encephalitogenic T cell response to myelin oligodendrocyte glycoprotein in experimental autoimmune encephalomyelitis. J Immunol. 2000;165(5):2859–2865. | ||
Malosse D, Perron H, Sasco A, Seigneurin JM. Correlation between milk and dairy product consumption and multiple sclerosis prevalence: a worldwide study. Neuroepidemiology. 1992;11(4–6):304–312. | ||
Butcher J. The distribution of multiple sclerosis in relation to the dairy industry and milk consumption. N Z Med J. 1976;83(566):427–430. | ||
Hamid R, Masood A. Dietary lectins as disease causing toxicants. Pak J Nutr. 2009;8(3):293–303. | ||
Riccio P, Rossano R, Liuzzi GM. May diet and dietary supplements improve the wellness of multiple sclerosis patients? A molecular approach. Autoimmune Dis. 2011;2010:249842. | ||
Maroon JC, Bost JW, Maroon A. Natural anti-inflammatory agents for pain relief. Surg Neurol Int. 2010;1:80. | ||
Kidd PM. Neurodegeneration from mitochondrial insufficiency: nutrients, stem cells, growth factors, and prospects for brain rebuilding using integrative management. Altern Med Rev. 2005;10(4):268–293. | ||
Torkildsen O, Loken-Amsrud KI, Wergeland S, Myhr KM, Holmoy T. Fat-soluble vitamins as disease modulators in multiple sclerosis. Acta Neurol Scand Suppl. 2013(196):16–23. | ||
Sanoobar M, Dehghan P, Khalili M, Azimi A, Seifar F. Coenzyme Q10 as a treatment for fatigue and depression in multiple sclerosis patients: a double blind randomized clinical trial. Nutr Neurosci. 2016;19(3):138–143. | ||
Bisht B, Darling WG, Shivapour ET, et al. Multimodal intervention improves fatigue and quality of life in subjects with progressive multiple sclerosis: a pilot study. Degener Neurol Neuromuscul Dis. 2015;5:19–35. | ||
McDonald WI, Compston A, Edan G, et al. Recommended diagnostic criteria for multiple sclerosis: guidelines from the International Panel on the diagnosis of multiple sclerosis. Ann Neurol. 2001;50(1):121–127. | ||
Bisht B, Darling WG, Grossmann RE, et al. A multimodal intervention for patients with secondary progressive multiple sclerosis: feasibility and effect on fatigue. J Altern Complement Med. 2014;20(5):347–355. | ||
Valko PO, Bassetti CL, Bloch KE, Held U, Baumann CR. Validation of the fatigue severity scale in a Swiss cohort. Sleep. 2008;31(11):1601–1607. | ||
Krupp LB, LaRocca NG, Muir-Nash J, Steinberg AD. The fatigue severity scale. Application to patients with multiple sclerosis and systemic lupus erythematosus. Arch Neurol. 1989;46(10):1121–1123. | ||
Vickrey BG, Hays RD, Harooni R, Myers LW, Ellison GW. A health-related quality of life measure for multiple sclerosis. Qual Life Res. 1995;4(3):187–206. | ||
Myers J, Bader D, Madhavan R, Froelicher V. Validation of a specific activity questionnaire to estimate exercise tolerance in patients referred for exercise testing. Am Heart J. 2001;142(6):1041–1046. | ||
Cutter GR, Baier ML, Rudick RA, et al. Development of a multiple sclerosis functional composite as a clinical trial outcome measure. Brain. 1999;122 (Pt 5):871–882. | ||
Solari A, Radice D, Manneschi L, Motti L, Montanari E. The multiple sclerosis functional composite: different practice effects in the three test components. J Neurol Sci. 2005;228(1):71–74. | ||
Fisher JS, Jak AJ, Kniker JE, Rudick RA, Cutter GR. Administration and Scoring Manual for the Multiple Sclerosis Functional Composite Measure (MSFC). New York, NY: Demos; 1999. | ||
Rao SM, Leo GJ, Haughton VM, St Aubin-Faubert P, Bernardin L. Correlation of magnetic resonance imaging with neuropsychological testing in multiple sclerosis. Neurology. 1989;39(2 Pt 1):161–166. | ||
Tombaugh TN, Rees L, Baird B, Kost J. The effects of list difficulty and modality of presentation on a computerized version of the Paced Serial Addition Test (PSAT). J Clin Exp Neuropsychol. 2004;26(2):257–265. | ||
Goldman MD, Marrie RA, Cohen JA. Evaluation of the six-minute walk in multiple sclerosis subjects and healthy controls. Mult Scler. 2008;14(3):383–390. | ||
Soilu-Hanninen M, Koskinen JO, Laaksonen M, Hanninen A, Lilius EM, Waris M. High sensitivity measurement of CRP and disease progression in multiple sclerosis. Neurology. 2005;65(1):153–155. | ||
Sellner J, Greeve I, Mattle HP. Atorvastatin decreases high-sensitivity C-reactive protein in multiple sclerosis. Mult Scler. 2008;14(7):981–984. | ||
Triantafyllou N, Evangelopoulos ME, Kimiskidis VK, et al. Increased plasma homocysteine levels in patients with multiple sclerosis and depression. Ann Gen Psychiatry. 2008;7:17. | ||
Zhang P, Dilley C, Mattson MP. DNA damage responses in neural cells: focus on the telomere. Neuroscience. 2007;145(4):1439–1448. | ||
Obeid R, Herrmann W. Mechanisms of homocysteine neurotoxicity in neurodegenerative diseases with special reference to dementia. FEBS Lett. 2006;580(13):2994–3005. | ||
Oldreive CE, Doherty GH. Neurotoxic effects of homocysteine on cerebellar Purkinje neurons in vitro. Neurosci Lett. 2007;413(1):52–57. | ||
Kruman, II, Culmsee C, Chan SL, et al. Homocysteine elicits a DNA damage response in neurons that promotes apoptosis and hypersensitivity to excitotoxicity. J Neurosci. 2000;20(18):6920–6926. | ||
Jhala SS, Wang D, Hazell AS. Thiamine deficiency results in release of soluble factors that disrupt mitochondrial membrane potential and downregulate the glutamate transporter splice-variant GLT-1b in cultured astrocytes. Biochem Biophys Res Commun. 2014;448(3):335–341. | ||
Jhala SS, Hazell AS. Modeling neurodegenerative disease pathophysiology in thiamine deficiency: consequences of impaired oxidative metabolism. Neurochem Int. 2011;58(3):248–260. | ||
Mattson MP, Shea TB. Folate and homocysteine metabolism in neural plasticity and neurodegenerative disorders. Trends Neurosci. 2003;26(3):137–146. | ||
Kronenberg G, Colla M, Endres M. Folic acid, neurodegenerative and neuropsychiatric disease. Curr Mol Med. 2009;9(3):315–323. | ||
Reynolds EH. Multiple sclerosis and vitamin B12 metabolism. J Neuroimmunol. 1992;40(2–3):225–230. | ||
Vos M, Esposito G, Edirisinghe JN, et al. Vitamin K2 is a mitochondrial electron carrier that rescues pink1 deficiency. Science. 2012;336(6086):1306–1310. | ||
Li J, Wang H, Rosenberg PA. Vitamin K prevents oxidative cell death by inhibiting activation of 12-lipoxygenase in developing oligodendrocytes. J Neurosci Res. 2009;87(9):1997–2005. | ||
Carrie I, Portoukalian J, Vicaretti R, Rochford J, Potvin S, Ferland G. Menaquinone-4 concentration is correlated with sphingolipid concentrations in rat brain. J Nutr. 2004;134(1):167–172. | ||
Ohsaki Y, Shirakawa H, Miura A, et al. Vitamin K suppresses the lipopolysaccharide-induced expression of inflammatory cytokines in cultured macrophage-like cells via the inhibition of the activation of nuclear factor kappaB through the repression of IKKalpha/beta phosphorylation. J Nutr Biochem. 2010;21(11):1120–1126. | ||
Achiron A, Feldman A, Magalashvili D, Dolev M, Gurevich M. Suppressed RNA-polymerase 1 pathway is associated with benign multiple sclerosis. PLoS One. 2012;7(10):e46871. | ||
Ferland G. Vitamin K and brain function. Semin Thromb Hemost. 2013;39(8):849–855. | ||
Shea MK, Cushman M, Booth SL, Burke GL, Chen H, Kritchevsky SB. Associations between vitamin K status and haemostatic and inflammatory biomarkers in community-dwelling adults. The Multi-Ethnic Study of Atherosclerosis. Thromb Haemost. 2014;112(3):438–444. | ||
Subar AF, Kirkpatrick SI, Mittl B, et al. The Automated Self-Administered 24-hour dietary recall (ASA24): a resource for researchers, clinicians, and educators from the National Cancer Institute. J Acad Nutr Diet. 2012;112(8):1134–1137. | ||
Moshfegh AJ, Rhodes DG, Baer DJ, et al. The US Department of Agriculture Automated Multiple-Pass Method reduces bias in the collection of energy intakes. Am J Clin Nutr. 2008;88(2):324–332. | ||
Gupta SK. Intention-to-treat concept: a review. Perspect Clin Res. 2011;2(3):109–112. | ||
Armijo-Olivo S, Warren S, Magee D. Intention to treat analysis, compliance, drop-outs and how to deal with missing data in clinical research: a review. Phys Ther Rev. 2009;14(1):36–49. | ||
Higginson IJ, Hart S, Silber E, Burman R, Edmonds P. Symptom prevalence and severity in people severely affected by multiple sclerosis. J Palliat Care. 2006;22(3):158–165. | ||
Fisk JD, Pontefract A, Ritvo PG, Archibald CJ, Murray TJ. The impact of fatigue on patients with multiple sclerosis. Can J Neurol Sci. 1994;21(1):9–14. | ||
Egner A, Phillips VL, Vora R, Wiggers E. Depression, fatigue, and health-related quality of life among people with advanced multiple sclerosis: results from an exploratory telerehabilitation study. NeuroRehabilitation. 2003;18(2):125–133. | ||
Attarian HP, Brown KM, Duntley SP, Carter JD, Cross AH. The relationship of sleep disturbances and fatigue in multiple sclerosis. Arch Neurol. 2004;61(4):525–528. | ||
Reese D, Shivapour ET, Wahls TL, Dudley-Javoroski SD, Shields R. Neuromuscular electrical stimulation and dietary interventions to reduce oxidative stress in a secondary progressive multiple sclerosis patient leads to marked gains in function: a case report. Cases J. 2009;2:7601. | ||
Learmonth YC, Dlugonski D, Pilutti LA, Sandroff BM, Klaren R, Motl RW. Psychometric properties of the Fatigue Severity Scale and the Modified Fatigue Impact Scale. J Neurol Sci. 2013;331(1–2):102–107. | ||
Lee D, Newell R, Ziegler L, Topping A. Treatment of fatigue in multiple sclerosis: a systematic review of the literature. Int J Nurs Pract. 2008;14(2):81–93. | ||
Pucci E, Branas P, D’Amico R, Giuliani G, Solari A, Taus C. Amantadine for fatigue in multiple sclerosis. Cochrane Database Syst Rev. 2007;1:CD002818. | ||
Schwarz S, Leweling H. Multiple sclerosis and nutrition. Mult Scler. 2005;11(1):24–32. | ||
Ozakbas S, Cagiran I, Ormeci B, Idiman E. Correlations between multiple sclerosis functional composite, expanded disability status scale and health-related quality of life during and after treatment of relapses in patients with multiple sclerosis. J Neurol Sci. 2004;218(1–2):3–7. | ||
Kargarfard M, Etemadifar M, Baker P, Mehrabi M, Hayatbakhsh R. Effect of aquatic exercise training on fatigue and health-related quality of life in patients with multiple sclerosis. Arch Phys Med Rehabil. 2012;93(10):1701–1708. | ||
Berger JR. Functional improvement and symptom management in multiple sclerosis: clinical efficacy of current therapies. Am J Manag Care. 2011;17(Suppl 5 Improving):S146–S153. | ||
Habek M, Hojsak I, Brinar VV. Nutrition in multiple sclerosis. Clin Neurol Neurosurg. 2010;112(7):616–620. | ||
Filippi M, Rocca MA. MRI evidence for multiple sclerosis as a diffuse disease of the central nervous system. J Neurol. 2005;252(Suppl 5):v16–24. | ||
Tomassini V, Matthews PM, Thompson AJ, et al. Neuroplasticity and functional recovery in multiple sclerosis. Nat Rev Neurol. 2012;8(11):635–646. | ||
Hon G, Hassan M, van Rensburg SJ, et al. Immune cell membrane fatty acids and inflammatory marker, C-reactive protein, in patients with multiple sclerosis. Br J Nutr. 2009;102(9):1334–1340. | ||
Vrethem M, Mattsson E, Hebelka H, et al. Increased plasma homocysteine levels without signs of vitamin B12 deficiency in patients with multiple sclerosis assessed by blood and cerebrospinal fluid homocysteine and methylmalonic acid. Mult Scler. 2003;9(3):239–245. | ||
Teunissen CE, van Boxtel MP, Jolles J, et al. Homocysteine in relation to cognitive performance in pathological and non-pathological conditions. Clin Chem Lab Med. 2005;43(10):1089–1095. | ||
Teunissen CE, Killestein J, Kragt JJ, Polman CH, Dijkstra CD, Blom HJ. Serum homocysteine levels in relation to clinical progression in multiple sclerosis. J Neurol Neurosurg Psychiatry. 2008;79(12):1349–1353. | ||
Goodkin DE, Jacobsen DW, Galvez N, Daughtry M, Secic M, Green R. Serum cobalamin deficiency is uncommon in multiple sclerosis. Arch Neurol. 1994;51(11):1110–1114. | ||
Ramsaransing GS, Fokkema MR, Teelken A, Arutjunyan AV, Koch M, De Keyser J. Plasma homocysteine levels in multiple sclerosis. J Neurol Neurosurg Psychiatry. 2006;77(2):189–192. | ||
Cala CM, Moseley CE, Steele C, et al. T cell cytokine signatures: biomarkers in pediatric multiple sclerosis. J Neuroimmunol. 2016;297:1–8. | ||
National Institutes of Health (NIH). Folate Dietary Supplement Fact Sheet, 2012. Available from: http://ods.od.nih.gov/factsheets/Folate-HealthProfessional/#h3. Accessed October 23, 2014. | ||
NIH. Vitamin B12 Dietary Supplement Fact Sheet, 2011. Available from: http://ods.od.nih.gov/factsheets/VitaminB12-HealthProfessional/#h3. Accessed October 23, 2014. | ||
USDA. USDA National Nutrient Database for Standard Reference, 2011. Available from: http://ndb.nal.usda.gov/. Accessed October 12, 2014. | ||
Sharma S, Sheehy T, Kolonel LN. Ethnic differences in grains consumption and their contribution to intake of B-vitamins: results of the Multiethnic Cohort Study. Nutr J. 2013;12:65. | ||
Jacques PF, Sulsky SI, Sadowski JA, Phillips JC, Rush D, Willett WC. Comparison of micronutrient intake measured by a dietary questionnaire and biochemical indicators of micronutrient status. Am J Clin Nutr. 1993;57(2):182–189. | ||
Pufulete M, Emery PW, Nelson M, Sanders TA. Validation of a short food frequency questionnaire to assess folate intake. Br J Nutr. 2002;87(4):383–390. | ||
Green R. Indicators for assessing folate and vitamin B12 status and for monitoring the efficacy of intervention strategies. Food Nutr Bull. 2008;29(Suppl 2):S52–S63; discussion S64–S56. | ||
Pietrzik K, Bronstrup A. Vitamins B12, B6 and folate as determinants of homocysteine concentration in the healthy population. Eur J Pediatr. 1998;157(Suppl 2):S135–S138. | ||
MacFarlane AJ, Shi Y, Greene-Finestone LS. High-dose compared with low-dose vitamin B-12 supplement use is not associated with higher vitamin B-12 status in children, adolescents, and older adults. J Nutr. 2014;144(6):915–920. | ||
Vogiatzoglou A, Smith AD, Nurk E, et al. Dietary sources of vitamin B-12 and their association with plasma vitamin B-12 concentrations in the general population: the Hordaland Homocysteine Study. Am J Clin Nutr. 2009;89(4):1078–1087. | ||
Dullemeijer C, Souverein OW, Doets EL, et al. Systematic review with dose-response meta-analyses between vitamin B-12 intake and European Micronutrient Recommendations Aligned’s prioritized biomarkers of vitamin B-12 including randomized controlled trials and observational studies in adults and elderly persons. Am J Clin Nutr. 2013;97(2):390–402. | ||
Tucker KL, Rich S, Rosenberg I, et al. Plasma vitamin B-12 concentrations relate to intake source in the Framingham Offspring study. Am J Clin Nutr. 2000;71(2):514–522. | ||
Lucock M, Wild J, Smithells R, Hartley R. Biotransformation of pteroylmonoglutamic acid during absorption: implications of Michaelis-Menten kinetics. Eur J Clin Nutr. 1989;43(9):631–635. | ||
Kelly P, McPartlin J, Goggins M, Weir DG, Scott JM. Unmetabolized folic acid in serum: acute studies in subjects consuming fortified food and supplements. Am J Clin Nutr. 1997;65(6):1790–1795. | ||
Kalmbach RD, Choumenkovitch SF, Troen AM, D’Agostino R, Jacques PF, Selhub J. Circulating folic acid in plasma: relation to folic acid fortification. Am J Clin Nutr. 2008;88(3):763–768. | ||
Garrett M, Hogan N, Larkin A, Saunders J, Jakeman P, Coote S. Exercise in the community for people with multiple sclerosis – a follow-up of people with minimal gait impairment. Mult Scler. 2013;19(6):790–798. | ||
Garrett M, Hogan N, Larkin A, Saunders J, Jakeman P, Coote S. Exercise in the community for people with minimal gait impairment due to MS: an assessor-blind randomized controlled trial. Mult Scler. 2013;19(6):782–789. | ||
Farinotti M, Simi S, Di Pietrantonj C, et al. Dietary interventions for multiple sclerosis. Cochrane Database Syst Rev. 2007;1:CD004192. | ||
United States Census Bureau. Educational Attainment in the United States: 2014 – Detailed Tables; 2014. | ||
Bunner AE, Agarwal U, Gonzales JF, Valente F, Barnard ND. Nutrition intervention for migraine: a randomized crossover trial. J Headache Pain. 2014;15(1):69. | ||
Brader L, Rejnmark L, Carlberg C, et al. Effects of a healthy Nordic diet on plasma 25-hydroxyvitamin D concentration in subjects with metabolic syndrome: a randomized, [corrected] controlled trial (SYSDIET). Eur J Nutr. 2014;53(4):1123–1134. | ||
Crum AJ, Langer EJ. Mind-set matters: exercise and the placebo effect. Psychol Sci. 2007;18(2):165–171. | ||
Cherkin DC, Sherman KJ, Avins AL, et al. A randomized trial comparing acupuncture, simulated acupuncture, and usual care for chronic low back pain. Arch Intern Med. 2009;169(9):858–866. | ||
Turner JA, Deyo RA, Loeser JD, Von Korff M, Fordyce WE. The importance of placebo effects in pain treatment and research. JAMA. 1994;271(20):1609–1614. | ||
Benson H, Friedman R. Harnessing the power of the placebo effect and renaming it “remembered wellness”. Annu Rev Med. 1996;47:193–199. | ||
Moore SD, King AC, Kiernan M, Gardner CD. Outcome expectations and realizations as predictors of weight regain among dieters. Eat Behav. 2011;12(1):60–63. |
Supplementary materials
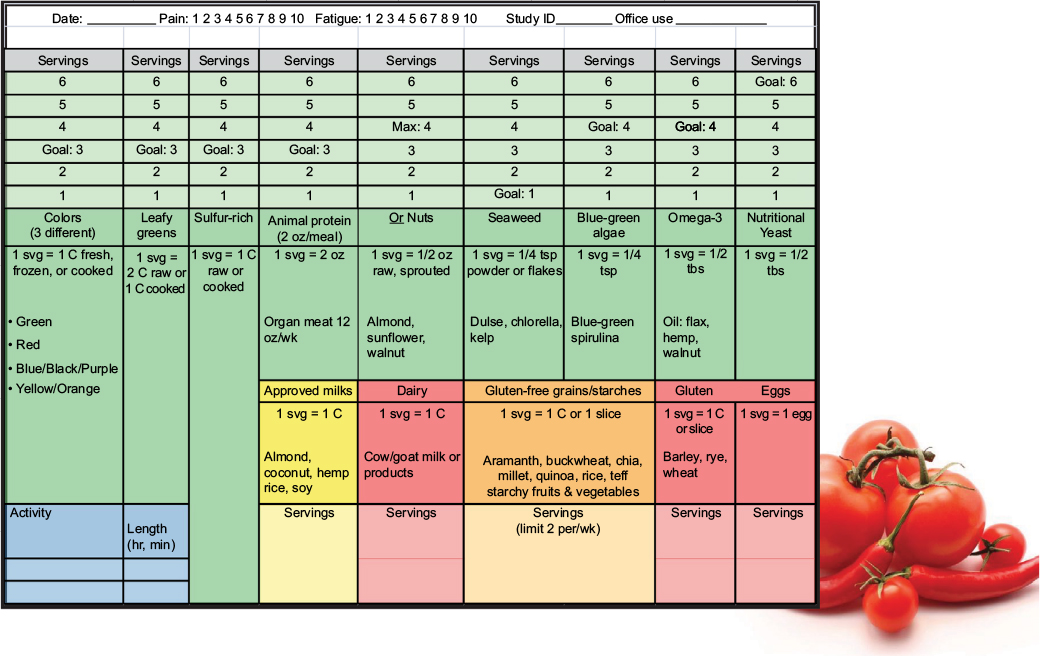 | Figure S1 Food Log. Abbreviations: C, cup; svg, serving; tbs, tablespoon. |
 | Figure S2 Food Diary. |
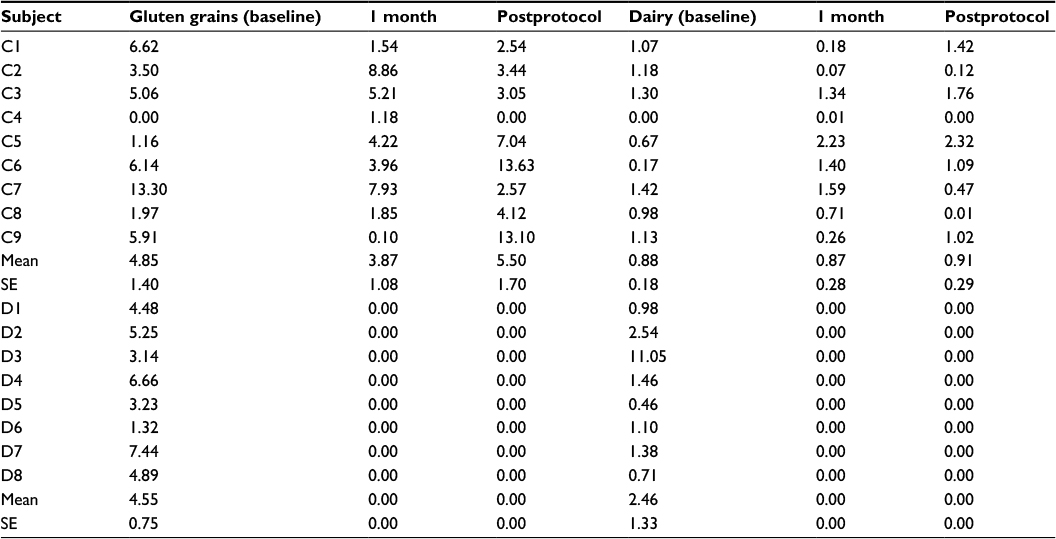 | Table S1 Adherence Notes: Total consumed gluten-containing grains and dairy reported by individual control (C1–C9) and MPDI (D1–D8) subjects from baseline, 1 month, and postprotocol ASA-24 recalls. Values in ounce equivalents for gluten-containing grains and cup equivalents for dairy were collected from Individual Foods and Pyramid Equivalents (INFMYPHEI) and Daily Total Pyramid Equivalents (TNMYPHEI) batched ASA-24 reports. Ounce equivalents are quantities of foods that count as one ounce of that food toward daily recommended intake (eg, one slice of bread, one cup of ready-to-eat cereal, or half cup of cooked rice). Abbreviations: MPDI, modified Paleolithic dietary intervention; SE, standard error; ASA-24, Automated Self-Administered 24-hour dietary recall. |
 © 2017 The Author(s). This work is published and licensed by Dove Medical Press Limited. The
full terms of this license are available at https://www.dovepress.com/terms
and incorporate the Creative Commons Attribution
- Non Commercial (unported, 3.0) License.
By accessing the work you hereby accept the Terms. Non-commercial uses of the work are permitted
without any further permission from Dove Medical Press Limited, provided the work is properly
attributed. For permission for commercial use of this work, please see paragraphs 4.2 and 5 of our Terms.
© 2017 The Author(s). This work is published and licensed by Dove Medical Press Limited. The
full terms of this license are available at https://www.dovepress.com/terms
and incorporate the Creative Commons Attribution
- Non Commercial (unported, 3.0) License.
By accessing the work you hereby accept the Terms. Non-commercial uses of the work are permitted
without any further permission from Dove Medical Press Limited, provided the work is properly
attributed. For permission for commercial use of this work, please see paragraphs 4.2 and 5 of our Terms.