Back to Journals » Journal of Pain Research » Volume 15
Radiological Changes of Paraspinal Muscles: A Comparative Study of Patients with Isthmic Spondylolisthesis, Patients with Degenerative Lumbar Spondylolisthesis, and Healthy Subjects
Authors Li C ![]() , Wang L, Wang Z, Li D, Ibrahim Y, Tian Y, Yuan S, Liu X
, Wang L, Wang Z, Li D, Ibrahim Y, Tian Y, Yuan S, Liu X
Received 28 May 2022
Accepted for publication 9 November 2022
Published 11 November 2022 Volume 2022:15 Pages 3563—3573
DOI https://doi.org/10.2147/JPR.S376575
Checked for plagiarism Yes
Review by Single anonymous peer review
Peer reviewer comments 2
Editor who approved publication: Professor Michael Überall
Chao Li,* Lianlei Wang,* Zheng Wang, Donglai Li, Yakubu Ibrahim, Yonghao Tian, Suomao Yuan, Xinyu Liu
Department of Orthopedics, Qilu Hospital of Shandong University, Jinan, 250012, People’s Republic of China
*These authors contributed equally to this work
Correspondence: Xinyu Liu, Department of Orthopedic Surgery, Qilu Hospital of Shandong University, Wenhua West Road 107#, Jinan, 250012, People’s Republic of China, Tel +86-18560082585, Fax +86-531-8216-9423, Email [email protected]
Objective: To investigate the differences, correlations, and clinical significance of the paraspinal muscles among patients with isthmic spondylolisthesis (IS), degenerative lumbar spondylolisthesis (DLS), and age-matched healthy subjects.
Methods: This study involved 159 age-matched patients with L4 anterior spondylolisthesis. The patients were divided into the IS group (n = 81) and DLS group (n = 78). Eighty-four age-matched healthy adults were enrolled as the control group. The cross-sectional area (CSA) of paraspinal muscles (multifidus [MF], erector spinae [ES], and psoas [PS]) and the relative CSA of the paraspinal muscles (paraspinal muscle CSA/vertebral CSA) were measured in the IS group, DLS group, and control group. The degree of fat infiltration was simultaneously observed.
Results: There was no significant difference in age or sex among the three groups. The relative CSA of the MF and PS was higher in control group than in IS and DLS groups (p < 0.05). The relative CSA of ES was higher in IS and control groups than in DLS group (p < 0.05). The relative CSA of total paraspinal muscles decreased in the order of control group > IS group > DLS group (p < 0.05). Logistic regression analysis showed that the relative CSA of MF, and the degree of fat infiltration of ES were independent protective factors for IS (odds ratio < 1, p < 0.05). The relative CSA of MF was an independent protective factor for DLS (odds ratio < 1, p < 0.05), whereas BMI and the degree of fat infiltration of MF were independent risk factor for DLS (odds ratio > 1, p < 0.05).
Conclusion: Compared with the control group, patients with IS and DLS showed varying degrees of degeneration, and the degree of degeneration in patients with DLS was more severe at the same age. Lower fat infiltration and higher paraspinal muscle CSA are protective factors for IS and DLS, whereas the higher BMI is risk factor for DLS.
Keywords: lumbar vertebrae, spondylolysis, isthmus, degenerative lumbar spondylolisthesis, paraspinal muscle
Introduction
Lumbar spondylolisthesis refers to the forward or backward displacement of a lumbar vertebra and has become a more common disease in clinical orthopedics.1,2 Lumbar spondylolisthesis can be caused by dysplasia, isthmus fissures, degeneration, trauma, and pathologic processes. IS and DLS are the most common types.3 The incidence of lumbar spondylolisthesis varies among different regions according to race and genetics.4 Previous studies have shown that the prevalence of lumbar spondylolisthesis is 22.5% in China and 21.2% in the United States.3,5 Other studies have revealed that the prevalence of IS and DLS is 6.8% and 24.8%, respectively.6
In recent years, numerous studies have elaborated the similarities and differences in the etiology, pathogenesis, and compensatory mechanisms of different types of lumbar spondylolisthesis. The paraspinal muscles play an important role in the pathogenesis and compensatory mechanisms of different types of lumbar spondylolisthesis. The main function of the lumbar paraspinal muscles is to maintain the upright posture and dynamic stability of the spine.7 A recent study showed that the multifidus (MF) of patients with IS exhibited selective atrophy, whereas the erector spinae (ES) showed moderate compensatory hypertrophy.8 Another study confirmed that the paraspinal muscle atrophy ratio of the MF and ES was an independent predisposing factor to DLS.9
However, these studies on the paraspinal muscle changes in different types of lumbar spondylolisthesis were limited because most of them only focused on the pathological changes of paraspinal muscles in a single type of spondylolisthesis. Additionally, patients with DLS have generally been older than patients with IS in these studies. The current study was performed to investigate the differences in sex, body mass index, CSA of the paraspinal muscles (MF, ES, and PS), and degree of fat infiltration between patients with IS and DLS; explore the differences and significance of the paraspinal muscles between patients with spondylolisthesis (IS and DLS) and healthy subjects; and analyze the paraspinal muscle-related risk factors in different types of lumbar spondylolisthesis.
Methods
Patient Population
This study was approved by the Ethics Committee of local hospital and the informed consent was obtained from all patients before enrollment. This study was performed in accordance with the Declaration of Helsinki. We retrospectively reviewed the records of 159 age-matched patients with lumbar spondylolisthesis with complete imaging data in a single institution, including 81 patients with IS (IS group) and 78 patients with DLS (DLS group); And the patients included in IS group and DLS group have clear surgical indications in our hospital. The control group was composed of 84 age-matched healthy adults without any disease recruited by the physical examination center of our hospital.
The inclusion criteria were L4 single-segment low-grade (Meyerding grade I) lumbar spondylolisthesis diagnosed by imaging examination and complete and clear imaging data obtained by lumbar X-ray, computed tomography, and magnetic resonance imaging (MRI) examination. The exclusion criteria were multi-segment spondylolisthesis; previous spinal trauma, tuberculosis, tumor, or infection; severe lumbar spondylolisthesis; idiopathic, congenital, or other structural spinal deformities; and a history of lumbar fracture.
Radiological Measurements
All patients with lumbar spondylolisthesis (IS and DLS) and healthy controls underwent lumbar MRI examination. The middle image for each intervertebral disc place at L4/5 was selected by locating lines on T2-weighted cross-sectional MRI (Figure 1). ImageJ software was used to measure the CSAs of the paraspinal muscles, including the CSA of the MF (MCSA), CSA of the ES (ECSA), and CSA of the PS (PCSA); the average value was used for analysis (Figure 1). To reduce individual differences, the CSA of the L4 vertebral body (VCSA) was measured at the same time, and the relative CSA of the paraspinal muscles was calculated (MCSA/VCSA, ECSA/VCSA, and PCSA/VCSA). The sum of the MCSA, ECSA, and PCSA; the total paraspinal muscle CSA (TCSA); and the relative TCSA (TCSA/VCSA) were also calculated. All participants were evaluated by visual semiquantitative assessment of fat infiltration, which was divided into four grades (Grade 0: normal muscle condition, fat infiltration of <10% of the muscle’s CSA; Grade 1: mild muscle degeneration, fat infiltration of 10%–25%; Grade 2: moderate muscle degeneration, fat infiltration of 25%–50%; and Grade 3: severe muscle degeneration, fat infiltration of >50%) (Figure 2).10,11 The relative CSA and fat infiltration of the paraspinal muscles were used to evaluate the degree of paraspinal muscle degeneration.
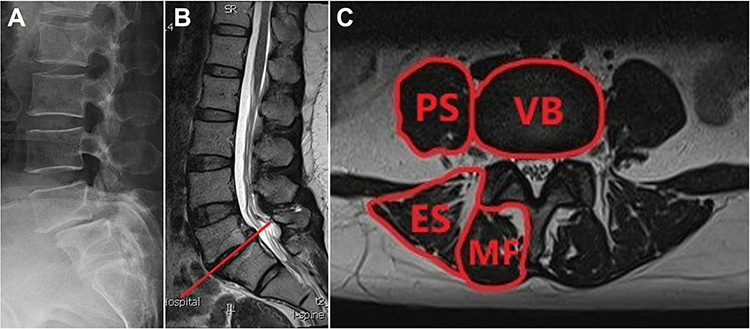 |
Figure 1 (A) A 50-year-old woman was diagnosed as isthmic spondylolisthesis at L4 on X-ray. (B) The middle image for each disc place at L4/5 was selected by locating lines on T2-weighted cross-sectional magnetic resonance images. (C) Measurement of the cross-sectional areas of the multifidus (MF), erector spinae (ES), psoas (PS), and vertebral body (VB). |
 |
Figure 2 Degree of fat infiltration of multifidus shown on magnetic resonance imaging. (A) Grade 0 (normal infiltration), with an infiltration rate of 0% to 10%. (B) Grade 1 (mild fat infiltration), with an infiltration rate of 10% to 25%. (C) Grade 2 (moderate fat infiltration), with an infiltration rate of 25% to 50%. (D) Grade 3 (severe fat infiltration), with an infiltration rate of >50%. |
Statistical Analysis
Statistical analyses were performed using SPSS version 25.0 (IBM Corp., Armonk, NY, USA). All continuous data are expressed as mean ± standard deviation. One-way analysis of variance was performed to analyze the differences in radiological parameters among the IS group, DLS group, and control group. The chi-square test was performed to analyze categorical variables. The Pearson’s correlation coefficient test was used to assess the relationships between the relative CSA of the paraspinal muscles and the VAS score of low back pain. To reduce the influence of confounding factors, we first screened out the factors with significant differences among the different types of lumbar spondylolisthesis by univariate analysis. Multivariate logistic regression was then performed to analyze the risk factors and protective factors for different types of lumbar spondylolisthesis. A p value of <0.05 was considered statistically significant.
Results
Patient Population
The characteristics of the three groups are summarized in Table 1. There was no significant difference in age or sex among the three groups. The IS group comprised 81 patients (28 men, 53 women), the DLS group comprised 78 patients (27 men, 51 women), and the control group comprised 84 patients (35 men, 49 women). Women accounted for 65.4% of all patients with lumbar spondylolisthesis (65.4% in IS group and 65.3% in DLS group). The BMI was higher in IS group and DLS group than in the control group (p<0.05).
 |
Table 1 Characteristics of Patients in the Three Study Groups |
Radiological Measurement
The radiological characteristics among the three groups are shown in Table 2. The MCSA/VCSA and PCSA/VCSA were higher in the control group than in the IS and DLS groups (p<0.05). The ECSA/VCSA was higher in the IS group and control group than in the DLS group (p<0.05). The TCSA/VCSA decreased in the order of control group > IS group > DLS group (p<0.05).
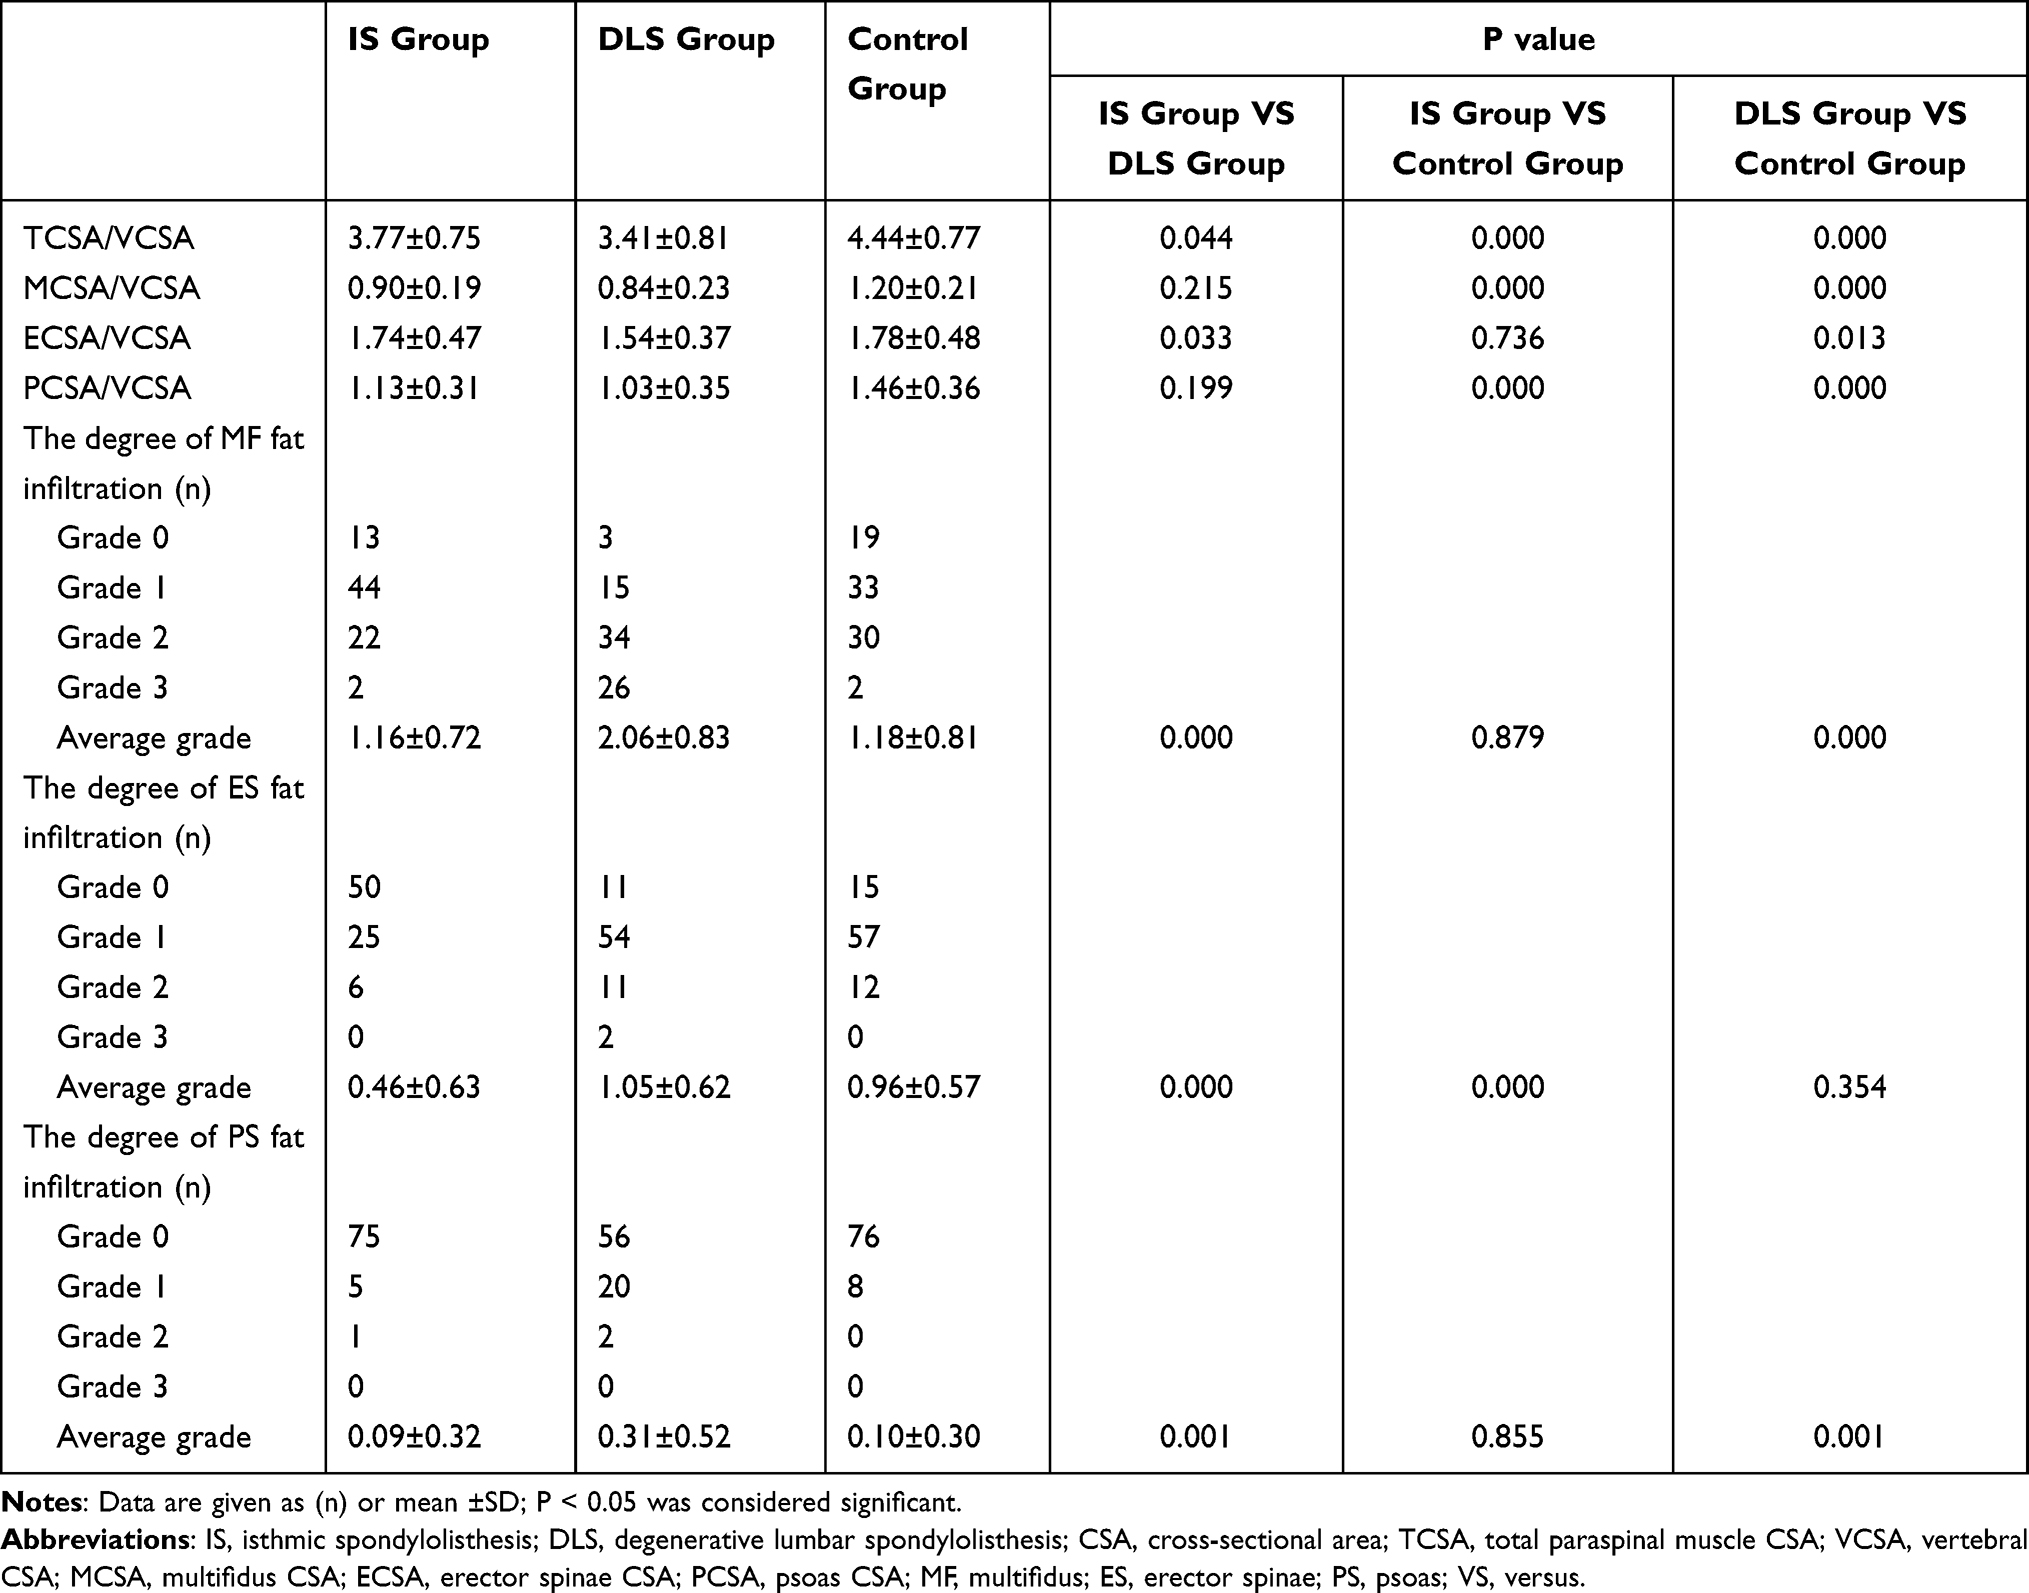 |
Table 2 Radiological Measurements of Lumbar Spondylolisthesis in the Three Study Groups |
The degree of fat infiltration of the MF, ES, and PS was significantly higher in the DLS (male or female) than IS group (p<0.05). The degree of fat infiltration of the MF and PS was significantly higher in the DLS group than in the control group (p<0.05). The degree of fat infiltration of the ES was significantly lower in the IS group than in the control group (p<0.05).
In the IS and DLS groups, the degree of fat infiltration of the MF was significantly higher in women than in men. Among women, the ECSA/VCSA and TCSA/VCSA were significantly higher in the IS than DLS group (p<0.05).
Pearson Correlations
In the IS group, the VAS of low back pain demonstrated a significant negative linear relationship with the MCSA/VCSA (r = −0.355, p = 0.025) and TCSA/VCSA (r = −0.324, p = 0.042) (Figure 3). Conversely, In the DLS group, the VAS of low back pain demonstrated a significant negative linear relationship with the MCSA/VCSA (r = −0.349, p = 0.028), PCSA/VCSA (r = −0.430, p = 0.006), and TCSA/VCSA (r = −0.384, p = 0.015) (Figure 4).
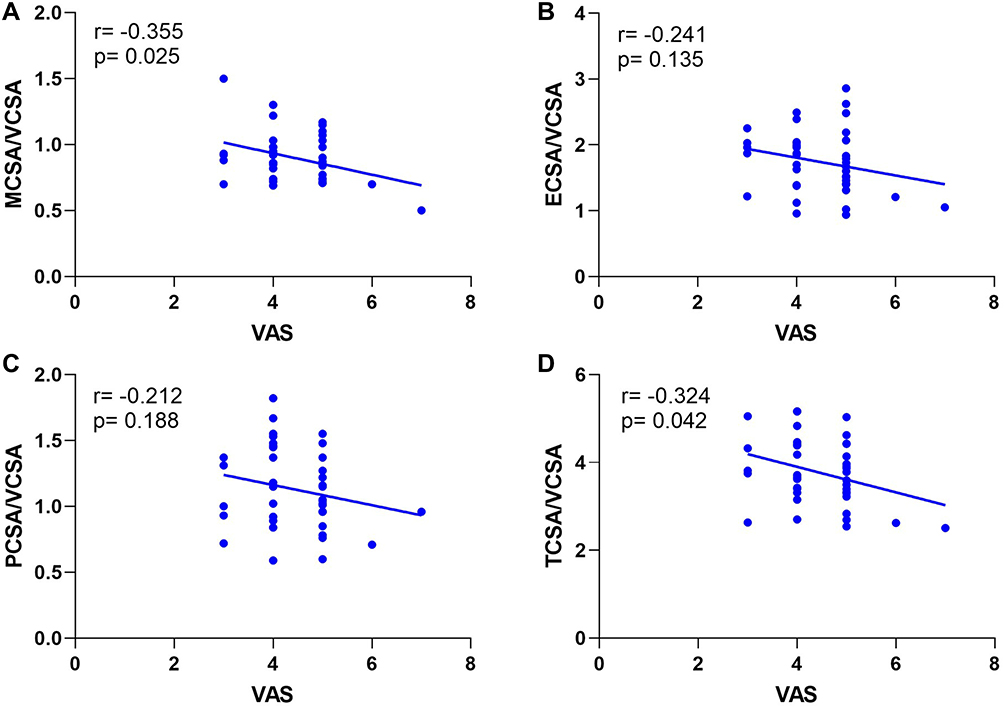 |
Figure 3 Correlation between the VAS of low back pain and (A) MCSA/VCSA, (B) ECSA/VCSA, (C) PCSA/VCSA, and (D) TCSA/VCSA among all the patients with IS. The VAS of low back pain demonstrated a significant negative linear relationship with MCSA/VCSA and TCSA/VCSA (A and D). There was no significant relationship between the VAS of low back pain and ECSA/VCSA and PCSA/VCSA (B and C). |
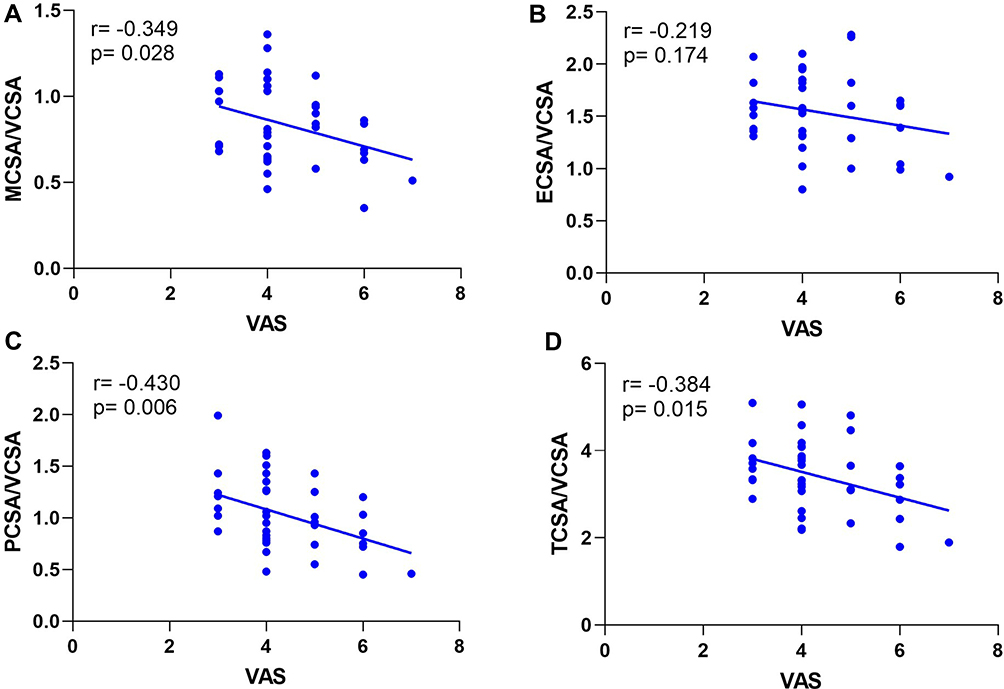 |
Figure 4 Correlation between the VAS of low back pain and (A) MCSA/VCSA, (B) ECSA/VCSA, (C) PCSA/VCSA, and (D) TCSA/VCSA among all the patients with DLS. The VAS of low back pain demonstrated a significant negative linear relationship with MCSA/VCSA, PCSA/VCSA, and TCSA/VCSA (A, C, and D). There was no significant relationship between the VAS of low back pain and ECSA/VCSA (B). |
Logistic Regression Analysis
We performed a multivariate logistic regression analysis of different types of lumbar spondylolisthesis (Tables 3 and 4). The MCSA/VCSA, and the degree of fat infiltration of the ES were protective factors for IS (odds ratio [OR]<1, p<0.05). The MCSA/VCSA was an independent protective factor for DLS (OR<1, p<0.05)), whereas BMI and the degree of fat infiltration of the MF were independent risk factors for DLS (OR>1, p<0.05).
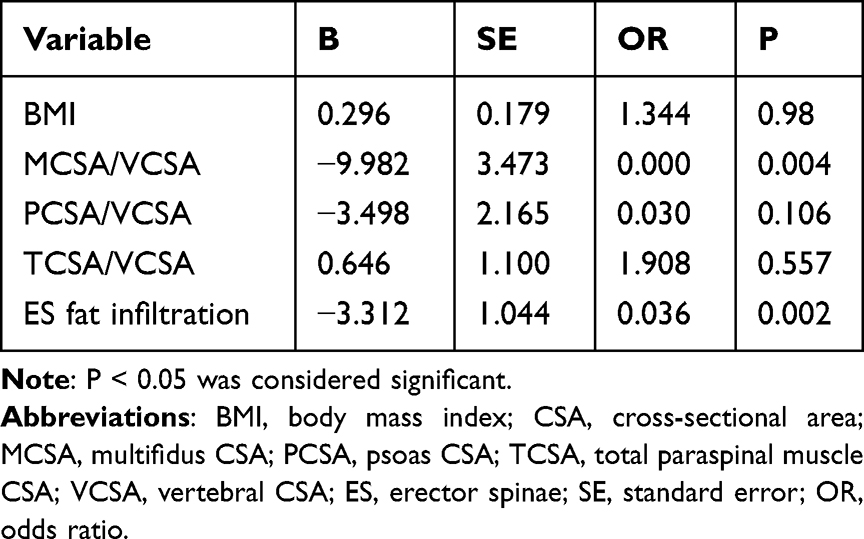 |
Table 3 Multivariate Logistic Regression Analysis of is and Control Group |
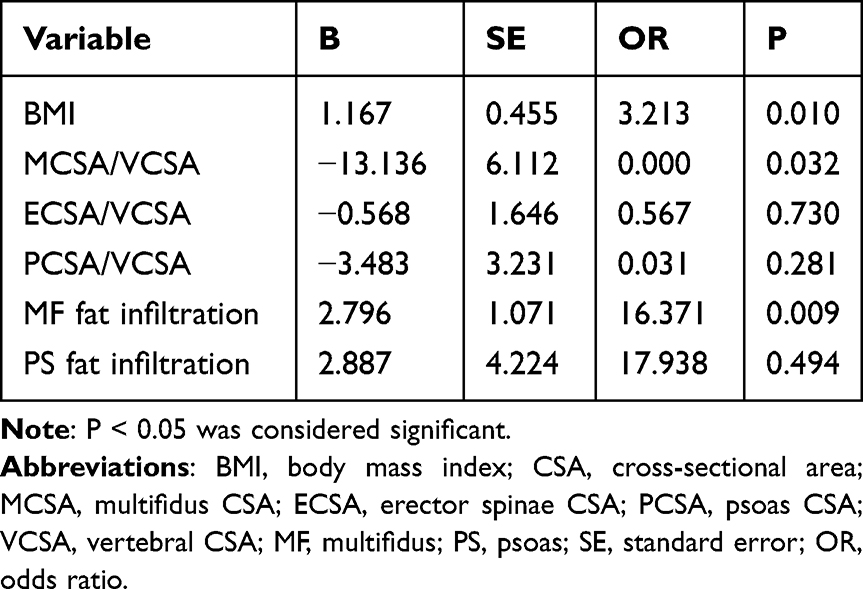 |
Table 4 Multivariate Logistic Regression Analysis of DLS and Control Group |
Discussion
Prevalence of Lumbar Spondylolisthesis and Sex-Related Differences in Paraspinal Muscles
A previous review showed that the female: male prevalence ratio in patients with lumbar spondylolisthesis was approximately 2:1.2 Inculet et al12 also found that significantly more women than men had lumbar spondylolisthesis. Our data supports previous findings that women are more likely to have symptomatic lumbar spondylolisthesis when compared to men. Additionally, the degree of degeneration of the paraspinal muscles is higher in women than in men, and women have more severe in DLS than IS. Wang et al2 indicated that a possible reason for the lower rate of spondylolisthesis in men than in women is that men tend to have stronger protective paraspinal muscles. When the waist sustains a strong load for a long period, the paraspinal muscles tend to lose elasticity and toughness, resulting in biomechanical imbalance and eventual lumbar spondylolisthesis. In addition, studies have also shown that the strength of the paraspinal muscles is affected by hormone levels in women.2,13,14 When hormone levels remain relatively high, the strength of the paraspinal muscles is greater, and vice versa. Women are prone to endocrine disorders, especially estrogen and progesterone disorders. Such disorders are more likely to occur during pregnancy and menopause, and women have a higher risk of lumbar spondylolisthesis during these two periods. The estrogen level gradually decreases with aging, leading to a decrease in paraspinal muscle strength and a decrease in bone mineral density, thus increasing the probability of spondylolisthesis. Therefore, because of the influence of many comprehensive factors, the prevalence of lumbar spondylolisthesis and the degree of paraspinal muscle degeneration are higher in women than in men.
Differences in CSAs of Paraspinal Muscles Among the Three Groups
Differences in MCSA
The MF is considered the most important muscle for extension and stabilization of the lumbar spine.15 The MF is a paraspinal muscle located in the innermost part of the spine. It has the largest attachment area, allowing it to control the rotational movement and shear force between the spinal segments. The present study showed that the MCSA/VCSA was significantly lower in the DLS and IS groups than in the control group, suggesting that the MF in patients with lumbar spondylolisthesis (IS and DLS) was significantly atrophied. This is consistent with the results of previous studies. Kalichman et al16 found that patients with lumbar spondylolisthesis (IS or DLS) had developed segmental atrophy of the MF. Similarly, Wang et al9 found obvious degeneration and atrophy of the MF through an analysis of lumbar MRI in 149 patients with DLS. Thakar et al8 assessed the CSA of the paraspinal muscles in 120 adults with IS and reported that the CSA of the MF was significantly lower than that of healthy controls (p=0.009).8 However, the causal relationship between lumbar spondylolisthesis and MF atrophy remains controversial. Franke et al17 postulated that the MF is only innervated by the medial branch of the posterior branch of the lumbar nerve; the nerve root compression caused by lumbar spondylolisthesis can easily lead to denervation of the MF, resulting in MF atrophy. The MF is divided into five myotomes, each innervated by a single spinal segment.18 Muscle fibers attached to the spinous process of a particular vertebra are segmentally innervated by the medial branch of the dorsal ramus, which originates inferior to the respective vertebra.8 The deep fibers of the MF are composed of type I (slow-twitch) fibers. These fatigue-resistant fibers are suited to low-load tonic activity and are more vulnerable to immobilization or pain than type II (fast-twitch) muscle fibers, which can explain the selective atrophy of the MF.8
Differences in ECSA
The ES consists of a spinous muscle, longus muscle, and iliocostal muscle. Like the MF, the ES controls the direction of the spine and extends the spine backward. We found that the ECSA/VCSA was significantly higher in the IS and control groups than in the DLS group, indicating that ES hypertrophy occurs in patients with IS and that ES atrophy occurs in patients with DLS. The MF and ES work synergistically to maintain spinal balance. When the MF is atrophied, the hypertrophied ES will partially replace the function of the MF. The change in the relative hypertrophy of the ES is a compensatory change in vertebral instability.
Our findings regarding hypertrophy of the ES in patients with IS are consistent with previous studies. Thakar et al8 analyzed the characteristics of the paraspinal muscles in 120 patients with IS and found that compared with that of the healthy control group, the MF of patients with IS showed selective atrophy, whereas the ES showed moderate compensatory hypertrophy. In terms of dystrophy of the ES in patients with DLS, our results are inconsistent with previous studies. Wang et al9 found that compensatory hypertrophy of the ES can occur in patients with DLS. Kalpakcioglu et al19 also reported that the incidence of ES hypertrophy in patients with DLS was significantly higher than that in the control group. We therefore infer that the ES of patients with DLS in the present study might have begun to degenerate and atrophy because of the relatively higher age of our study population. The compensatory capacity of the ES is limited; additionally, some patients may have passed the compensatory period and begun to develop decompensation, thus explaining the absence of proliferation and hypertrophy. Therefore, the ES undergoes significantly more compensatory hypertrophy in patients with IS than in patients with DLS.
Differences in PCSA
The PS originates from the T12–L5 vertebrae; the lateral intervertebral disc runs vertically downward on the anterior surface of the pelvis and terminates in the lesser trochanter of the femur. Its main functions include hip flexion, external rotation, lumbar flexion, lateral flexion, and maintenance of lumbar kyphosis and stability.20 We found that the PCSA/VCSA was significantly lower in the IS and DLS groups than in the control group, suggesting that the PS in patients with IS and DLS was significantly atrophied. We infer that when the lumbar spine is unstable, the PS located in front of the vertebral body can enhance the contractile force, restore the upright posture of the spine, and increase the physiological kyphosis of the lumbar spine to maintain the overall stability of the spine. Long-term stress contraction eventually leads to the same degree of decompensated atrophy as seen in the MF, which is supported by some studies but not by others. Thakar et al8 analyzed the characteristics of the paraspinal muscles in 120 patients with IS but found no significant reductions in the ratio of the PCSA to vertebral body area (0.61±0.19, 0.63±0.20, p=0.427) in patients with IS versus controls. Wagner et al21 found that the absolute PCSA was significantly decreased in patients with DLS characterized by severe lumbar disability.
Differences in TCSA
In terms of the TCSA/VCSA, the current study showed significantly more severe atrophy in the IS and DLS groups than in the control group, consistent with the results of previous studies. Barker et al22 found that the percentage of CSA decrease in the paraspinal muscles was positively correlated with the degree of pain. Therefore, we should also consider that many patients with spondylolisthesis fear exercise because they cannot tolerate the associated low back pain.23 Related studies have suggested that disuse and inflammation caused by low back pain can lead to atrophy of the back muscle tissue.24 The present study included patients with IS and DLS with related clinical symptoms; thus, the total paraspinal muscles of patients in the IS and DLS groups exhibited degeneration and atrophy. However, the TCSA/VCSA in the IS group indicated significant compensatory hypertrophy compared with that in the DLS group. The occurrence of DLS is mainly related to abnormalities of the intervertebral discs and the changes in the articular process angle.25 In patients of the same age and with the same degree of spondylolisthesis, local instability of the spine occurs in patients with IS because of the fracture of the isthmus articular process, and the resistance to shear force of the articular process thus decreases. To maintain spinal stability, the posterior muscles and ligaments bear more pressure. Therefore, the paraspinal muscles undergoes significantly more compensatory hypertrophy in patients with IS than in patients with DLS.
Differences in Degree of Fat Infiltration of Paraspinal Muscles Among the Three Groups
Fat infiltration is due to decreased skeletal muscle mass caused by the aging process and the replacement of muscle by non-contractile connective tissue.16 The degree of fat infiltration is an important index with which to evaluate the quality of the paraspinal muscles.26 We found that the degree of fat infiltration of the MF, ES, and PS in patients with DLS patients (both men and women) was significantly higher than that in patients with IS, indicating that the severity of paraspinal muscle degeneration was much greater in patients with DLS than IS. As indicated above, the mechanism of IS results in more severe compensatory hypertrophy of the paraspinal muscles than occurs in DLS; the degree of fat infiltration is relatively low. The reasons for this have been discussed in several reports. Previous studies have shown that the BMI and subcutaneous fat levels may also affect fat penetration.27 More specifically, paraspinal muscle density has been shown to decrease as the BMI increases.28 Fortin et al29 performed a 15-year longitudinal follow-up study and found a significant relationship between the increase in the BMI and the presence of fat infiltration in the paraspinal muscles. Our study showed that the average value of BMI was higher in patients with DLS than IS, leading us to conclude that paraspinal muscle degeneration is significantly more severe in DLS than IS. Other studies have shown that the fat content of the lumbar muscles is positively correlated with age.29,30 Shahidi et al31 reported that the fat content changes with age in individuals with pathological changes. Tamai et al32 also found that Goutallier grading (muscle mass) is associated with age. Although age was not statistically significant in the current study, the average age of patients with DLS was higher than that of patients with IS, showing some similarity with previous studies.
This study also showed that the fat infiltration of the MF and PS was significantly higher in patients with DLS than in healthy controls (p<0.05), whereas the degree of fat infiltration of the ES was not significantly different. This suggests that the ES of patients with DLS undergoes a certain extent of compensatory hypertrophy. In addition, we found that the degree of fat infiltration of the ES was significantly lower in patients with IS than in healthy controls (p<0.05), whereas the degree of fat infiltration in the MF and PS was not significantly different. The ES in patients with IS showed obvious compensatory hypertrophy. We can cautiously conclude that compensatory hypertrophy of the ES occurs in both IS and DLS, but especially in IS.
The Correlation Between the VAS of Low Back Pain and Paraspinal Muscles
Pain and an inactive lifestyle may cause paraspinal muscle atrophy, which is significantly associated with pain.33 In addition, previous studies have confirmed the increase in atrophy of the paraspinal muscles in clinical chronic low back pain patients.34 In this study, the results demonstrated that the VAS of low back pain have a significant negative linear relationship with the paraspinal muscles in IS and DLS groups, which was consistent with previous studies.
Prediction and Analysis of Risk Factors for Lumbar Spondylolisthesis
We performed a multivariate logistic regression analysis of different types of lumbar spondylolisthesis and found that the MCSA/VCSA, and the degree of fat infiltration of the ES were protective factors for IS. In contrast, the MCSA/VCSA was an independent protective factor for DLS, whereas BMI and the degree of fat infiltration of the MF were independent risk factors for DLS. These findings are similar to previous studies but also have some differences. A recent study showed that the ES atrophy ratio and the signal intensity ratio of the MF were independent predisposing factors to lumbar spondylolisthesis (OR>1, p<0.05), whereas the MF atrophy ratio was an independent protective factor (OR<1, p<0.05).9,16 Lee et al18 found that increased fat infiltration in the MF with decreased fat infiltration in the ES was the best predictor of DLS.
Limitations
The current study had some limitations. First, it was a retrospective study with limited case numbers. Second, it mainly focused on IS and DLS; patients with other types of lumbar spondylolisthesis were not included, which may have caused some bias of the results. More clinical cohort studies with larger sample sizes involving different concepts are needed to better understand the soft tissue changes in patients with different types of lumbar spondylolisthesis. Additionally, all lumbar spondylolisthesis were both at L4-5 in this study, so patients with different segments of lumbar spondylolisthesis should be included in future studies to better confirm the radiological changes of different types of lumbar spondylolisthesis.
Conclusion
Compared with the control group, patients with IS and DLS showed varying degrees of degeneration, and the degree of degeneration in DLS patients was more severe at the same age. The incidence of lumbar spondylolisthesis and the degree of paraspinal muscle degeneration were higher in women than in men. The VAS of low back pain has a significant negative linear relationship with the paraspinal muscles. The MCSA/VCSA, and the degree of fat infiltration of the ES were protective factors for IS. For DLS, the MCSA/VCSA was an independent protective factor, whereas BMI and the degree of fat infiltration of the MF were independent risk factors.
Ethics Approval and Consent to Participate
This research was approved by the ethics committee of Qilu Hospital of Shandong University [KYLL-2021(KS)-055]. This study was performed in accordance with the Declaration of Helsinki. All participants agreed with the data and publication of the manuscript, and all participants provided written informed consent.
Acknowledgments
We thank Angela Morben, DVM, ELS, from Liwen Bianji (Edanz) (www.liwenbianji.cn) for editing the English text of a draft of this manuscript.
Funding
This work was supported in part by the National Nature Science Foundation (81874022 and 82172483 to Xinyu Liu; 82102522 to Lianlei Wang), Shandong Natural Science Foundation (ZR202102210113 to Lianlei Wang) and Shandong Province Taishan Scholar Project to Lianlei Wang.
Disclosure
The authors declare no potential conflicts of interest with respect to the research, authorship, and/or publication of the article.
References
1. Austevoll IM, Hermansen E, Fagerland MW., et al. Decompression with or without fusion in degenerative lumbar spondylolisthesis. N Engl J Med. 2021;385(6):526–538. doi:10.1056/NEJMoa2100990
2. Wang YXJ, Kaplar Z, Deng M, Leung JCS. Lumbar degenerative spondylolisthesis epidemiology: a systematic review with a focus on gender-specific and age-specific prevalence. J Orthop Translat. 2017;11:39–52. doi:10.1016/j.jot.2016.11.001
3. Kalichman L, Kim DH, Li L, Guermazi A, Berkin V, Hunter DJ. Spondylolysis and spondylolisthesis: prevalence and association with low back pain in the adult community-based population. Spine. 2009;34(2):199–205. doi:10.1097/BRS.0b013e31818edcfd
4. Cai T, Yang L, Cai WS, et al. Dysplastic spondylolysis is caused by mutations in the diastrophic dysplasia sulfate transporter gene. Proc Natl Acad Sci U S A. 2015;112(26):8064–8069. doi:10.1073/pnas.1502454112
5. He LC, Wang YX, Gong JS, et al. Prevalence and risk factors of lumbar spondylolisthesis in elderly Chinese men and women. Eur Radiol. 2014;24(2):441–448. doi:10.1007/s00330-013-3041-5
6. Mesfin A, Sherif SM, Liu AY, Liu SE, Joo P, Menga EN. Prevalence of isthmic and degenerative lumbar spondylolisthesis: analysis of 882 CT scans. Spine J. 2019;19(9):S95–S96. doi:10.1016/j.spinee.2019.05.214
7. Ward SR, Kim CW, Eng CM, et al. Architectural analysis and intraoperative measurements demonstrate the unique design of the multifidus muscle for lumbar spine stability. J Bone Joint Surg Am. 2009;91(1):176–185. doi:10.2106/JBJS.G.01311
8. Thakar S, Sivaraju L, Aryan S, Mohan D, Sai Kiran NA, Hegde AS. Lumbar paraspinal muscle morphometry and its correlations with demographic and radiological factors in adult isthmic spondylolisthesis: a retrospective review of 120 surgically managed cases. J Neurosurg Spine. 2016;24(5):679–685. doi:10.3171/2015.9.SPINE15705
9. Wang G, Karki SB, Xu S, et al. Quantitative MRI and X-ray analysis of disc degeneration and paraspinal muscle changes in degenerative spondylolisthesis. J Back Musculoskelet Rehabil. 2015;28(2):277–285. doi:10.3233/BMR-140515
10. Kjaer P, Bendix T, Sorensen JS, Korsholm L, Are L-YC. MRI-defined fat infiltrations in the multifidus muscles associated with low back pain? BMC Med. 2007;52. doi:10.1186/1741-7015-5-2
11. Kalichman L, Klindukhov A, Li L, Linov L. Indices of Paraspinal Muscles Degeneration: reliability and Association With Facet Joint Osteoarthritis: feasibility Study. Clin Spine Surg. 2016;29(9):465–470. doi:10.1097/BSD.0b013e31828be943
12. Inculet C, Urquhart JC, Rasoulinejad P, et al. Factors associated with using an interbody fusion device for low-grade lumbar degenerative versus isthmic spondylolisthesis: a retrospective cohort study. J Neurosurg Spine. 2021:1–9. doi:10.3171/2020.11.SPINE201261
13. Skelton DA, Phillips SK, Bruce SA, Naylor CH, Woledge RC. Hormone replacement therapy increases isometric muscle strength of adductor pollicis in post-menopausal women. Clin Sci. 1999;96(4):357–364. doi:10.1042/Cs19980318
14. Collins BC, Laakkonen EK, Lowe DA. Aging of the musculoskeletal system: how the loss of estrogen impacts muscle strength. Bone. 2019;123:137–144. doi:10.1016/j.bone.2019.03.033
15. Kaariainen T, Taimela S, Aalto T, et al. The effect of decompressive surgery on lumbar paraspinal and biceps brachii muscle function and movement perception in lumbar spinal stenosis: a 2-year follow-up. Eur Spine J. 2016;25(3):789–794. doi:10.1007/s00586-015-4036-5
16. Kalichman L, Carmeli E, Been E. The Association between Imaging Parameters of the Paraspinal Muscles, Spinal Degeneration, and Low Back Pain. Biomed Res Int. 2017;2017:1–14. doi:10.1155/2017/2562957
17. Franke J, Hesse T, Tournier C, et al. Morphological changes of the multifidus muscle in patients with symptomatic lumbar disc herniation. J Neurosurg Spine. 2009;11(6):710–714. doi:10.3171/2009.7.SPINE08448
18. Lee ET, Lee SA, Soh Y, Yoo MC, Lee JH, Chon J. Association of Lumbar Paraspinal Muscle Morphometry with Degenerative Spondylolisthesis. Int J Environ Res Public Health. 2021;18(8). doi:10.3390/ijerph18084037
19. Kalpakcioglu B, Altinbilek T, Senel K. Determination of spondylolisthesis in low back pain by clinical evaluation. J Back Musculoskelet Rehabil. 2009;22(1):27–32. doi:10.3233/BMR-2009-0212
20. Tarantino U, Fanucci E, Iundusi R, et al. Lumbar spine MRI in upright position for diagnosing acute and chronic low back pain: statistical analysis of morphological changes. J Orthop Traumatol. 2013;14(1):15–22. doi:10.1007/s10195-012-0213-z
21. Wagner SC, Sebastian AS, McKenzie JC, et al. Severe Lumbar Disability Is Associated With Decreased Psoas Cross-Sectional Area in Degenerative Spondylolisthesis. Global Spine J. 2018;8(7):716–721. doi:10.1177/2192568218765399
22. Barker KL, Shamley DR, Jackson D. Changes in the cross-sectional area of multifidus and psoas in patients with unilateral back pain: the relationship to pain and disability. Spine. 2004;29(22):E515–519. doi:10.1097/01.brs.0000144405.11661.eb
23. Cracco E, Clauwaert A, Van den Broeck Y, Van Damme S, Brass M. Motor simulation is disturbed when experiencing pain. Pain. 2019;160(12):2743–2750. doi:10.1097/j.pain.0000000000001665
24. Teichtahl AJ, Urquhart DM, Wang Y, et al. Fat infiltration of paraspinal muscles is associated with low back pain, disability, and structural abnormalities in community-based adults. Spine J. 2015;15(7):1593–1601. doi:10.1016/j.spinee.2015.03.039
25. Jeon CH, Park JU, Chung NS, Son KH, Lee YS, Kim JJ. Degenerative retrolisthesis: is it a compensatory mechanism for sagittal imbalance? Bone Joint J. 2013;95-B(9):1244–1249. doi:10.1302/0301-620X.95B9.31237
26. He K, Head J, Mouchtouris N, et al. The Implications of Paraspinal Muscle Atrophy in Low Back Pain, Thoracolumbar Pathology, and Clinical Outcomes After Spine Surgery: a Review of the Literature. Global Spine J. 2020;10(5):657–666. doi:10.1177/2192568219879087
27. Goubert D, Van Oosterwijck J, Meeus M, Danneels L. Structural Changes of Lumbar Muscles in Non-Specific Low Back Pain. Pain Physician. 2016;19(7):E985–E999.
28. Kalichman L, Hodges P, Li L, Guermazi A, Hunter DJ. Changes in paraspinal muscles and their association with low back pain and spinal degeneration: CT study. Eur Spine J. 2010;19(7):1136–1144. doi:10.1007/s00586-009-1257-5
29. Fortin M, Videman T, Gibbons LE, Battie MC. Paraspinal muscle morphology and composition: a 15-yr longitudinal magnetic resonance imaging study. Med Sci Sports Exerc. 2014;46(5):893–901. doi:10.1249/MSS.0000000000000179
30. Gildea JE, Hides JA, Hodges PW. Size and symmetry of trunk muscles in ballet dancers with and without low back pain. J Orthop Sports Phys Ther. 2013;43(8):525–533. doi:10.2519/jospt.2013.4523
31. Shahidi B, Parra CL, Berry DB, et al. Contribution of Lumbar Spine Pathology and Age to Paraspinal Muscle Size and Fatty Infiltration. Spine. 2017;42(8):616–623. doi:10.1097/BRS.0000000000001848
32. Tamai K, Chen J, Stone M, et al. The evaluation of lumbar paraspinal muscle quantity and quality using the Goutallier classification and lumbar indentation value. Eur Spine J. 2018;27(5):1005–1012. doi:10.1007/s00586-018-5485-4
33. Wu Z, Ye X, Ye Z, et al. Asymmetric Biomechanical Properties of the Paravertebral Muscle in Elderly Patients With Unilateral Chronic Low Back Pain: a Preliminary Study. Front Bioeng Biotechnol. 2022;10:814099. doi:10.3389/fbioe.2022.814099
34. Faur C, Patrascu JM, Haragus H, Anglitoiu B. Correlation between multifidus fatty atrophy and lumbar disc degeneration in low back pain. BMC Musculoskelet Disord. 2019;20(1):414. doi:10.1186/s12891-019-2786-7
 © 2022 The Author(s). This work is published and licensed by Dove Medical Press Limited. The
full terms of this license are available at https://www.dovepress.com/terms
and incorporate the Creative Commons Attribution
- Non Commercial (unported, 3.0) License.
By accessing the work you hereby accept the Terms. Non-commercial uses of the work are permitted
without any further permission from Dove Medical Press Limited, provided the work is properly
attributed. For permission for commercial use of this work, please see paragraphs 4.2 and 5 of our Terms.
© 2022 The Author(s). This work is published and licensed by Dove Medical Press Limited. The
full terms of this license are available at https://www.dovepress.com/terms
and incorporate the Creative Commons Attribution
- Non Commercial (unported, 3.0) License.
By accessing the work you hereby accept the Terms. Non-commercial uses of the work are permitted
without any further permission from Dove Medical Press Limited, provided the work is properly
attributed. For permission for commercial use of this work, please see paragraphs 4.2 and 5 of our Terms.
Recommended articles
Comparative Analysis of Paraspinal Muscle Fat Infiltration and Clinical Efficacy Following Single-Level UBD-TLIF versus MIS-TLIF: A Retrospective MRI-Based Study
Yan J, Tian M, Wu M, Yuan Z, Fan Y, Wu X, Ni H, Zhao Y, Yu S, He S
Journal of Pain Research 2025, 18:5673-5680
Published Date: 30 October 2025