Back to Journals » Vascular Health and Risk Management » Volume 19
Racial Differences and Contributory Cardiovascular and Non-Cardiovascular Risk Factors Towards Chronic Kidney Disease Progression
Authors Choi Y, Jacobs Jr DR, Kramer HJ, Shroff GR, Chang AR, Duprez DA ![]()
Received 24 April 2023
Accepted for publication 4 July 2023
Published 12 July 2023 Volume 2023:19 Pages 433—445
DOI https://doi.org/10.2147/VHRM.S416395
Checked for plagiarism Yes
Review by Single anonymous peer review
Peer reviewer comments 2
Editor who approved publication: Dr Konstantinos Tziomalos
Yuni Choi,1 David R Jacobs Jr,1 Holly J Kramer,2 Gautam R Shroff,3 Alexander R Chang,4 Daniel A Duprez5
1Division of Epidemiology and Community Health, School of Public Health, University of Minnesota, Minneapolis, MN, USA; 2Departments of Public Health Sciences and Medicine, Loyola University Chicago, Maywood, IL, USA; 3Division of Cardiology and Department of Medicine, Hennepin Healthcare, University of Minnesota Medical School, Minneapolis, MN, USA; 4Departments of Population of Health Sciences and Nephrology, Geisinger, Danville, PA, USA; 5Cardiovascular Division, Department of Medicine, University of Minnesota, Minneapolis, MN, USA
Correspondence: Daniel A Duprez, Cardiovascular Division, Department of Medicine, University of Minnesota, 420 Delaware St SE, MMC 508, Minneapolis, MN, 55455, USA, Tel + 1 612-624-4948, Fax + 1 612-626-4411, Email [email protected]
Background: The prevalence of advanced chronic kidney disease (CKD) is higher in Black than in White Americans. We evaluated CKD progression in Black and White participants and the contribution of biological risk factors. We included the study of lung function (measured by forced vital capacity [FVC]), which is part of the emerging notion of interorgan cross-talk with the kidneys to racial differences in CKD progression.
Methods: This longitudinal study included 2175 Black and 2207 White adult Coronary Artery Risk Development in Young Adults (CARDIA) participants. Estimated glomerular filtration rate (eGFR) and urinary albumin-to-creatinine ratio (UACR) were measured at study year 10 (age 27– 41y) and every five years for 20 years. The outcome was CKD progression through no CKD, low, moderate, high, or very high-risk categories based on eGFR and UACR in combination. The association between race and CKD progression as well as the contribution of risk factors to racial differences were assessed in multivariable-adjusted Cox models.
Results: Black participants had higher CKD transition probabilities than White participants and more prevalent risk factors during the 20-year period studied. Hazard ratios for CKD transition for Black (vs White participants) were 1.38 from No CKD into ≥ low risk, 2.25 from ≤ low risk into ≥ moderate risk, and 4.49 from ≤ moderate risk into ≥ high risk. Racial differences in CKD progression from No CKD into ≥ low risk were primarily explained by FVC (54.8%), hypertension (30.9%), and obesity (20.8%). In contrast, racial differences were less explained in more severe transitions.
Conclusion: Black participants had a higher risk of CKD progression, and this discrepancy may be partly explained by FVC and conventional risk factors.
Keywords: CKD progression, racial disparities, young adults, conventional risk factors, lung function
Introduction
There is a racial disparity in the prevalence of chronic kidney disease (CKD) in the US, with the highest prevalence observed among Black individuals.1 Diabetes and hypertension are widely recognized risk factors for CKD and end-stage kidney disease (ESKD).2,3 These disorders are the leading contributors to kidney failure in the US and together account for 64% of kidney failure.4 Another clinical risk factor for the onset of CKD that has been heavily researched is obesity.5 Although the exact causes of racial differences in CKD are not all understood, this likely in part reflects differences in the disproportionate prevalence of these major contributors.6,7 Social and economic disadvantages related to race or ethnicity may also generally help explain disparities in clinical conditions and CKD prevalence.8 There is little evidence from longitudinal data on the CKD progression rate between Black and White Americans from early adulthood to middle age, as determined by combinations of estimated glomerular filtration rate (eGFR) and urinary albumin-to-creatinine ratio (UACR). Little is known about the factors contributing to racial disparities in CKD progression during this transitional period. Additional research is necessary to comprehend racial and ethnic inequalities in eGFR decline before CKD onset, as conventional risk factors are insufficient to explain them.9 We recently showed, using longitudinal data from the Coronary Artery Risk Development in Young Adults (CARDIA) study that even minor deterioration in kidney function was associated with higher risk of incident CVD, total mortality, and the CKD progression through modified KDIGO categories;10 the CKD progression to more advanced risk categories were predicted by conventional and non-traditional risk factors.11 Besides well-known risk factors for CKD progression, we found that absolute lung function (as assessed by forced vital capacity (FVC)), markers of low-grade inflammation, serum urate, and serum carotenoids also predicted CKD progression. All of these factors play a role in or are statistically associated with vascular disease and may therefore affect kidney function. Cross-talk between lung and kidney is well document.12–14 Lung and kidney endothelial tissue function are sensitive to microvascular changes.15 The kidney medulla has the lowest oxygen content in the body and is sensitive to minor hypoxemia, possibly leading to nephron loss and damage.13 Inflammation is a common thread in endothelial cell health.16 Urate may be a cause or a biomarker of CKD progression.17–19 Serum carotenoids (alpha- and beta-carotene, beta-cryptoxanthin, and zeaxanthin/lutein) are empirically associated with diet quality, physical activity, smoking, and body mass index (BMI)20 and these carotenoids are strongly suggested to influence endothelial function.21
We prospectively examined CKD progression in Black and White individuals, and assessed how conventional and non-traditional factors contribute to racial disparities in such progression. It was hypothesized that CKD progression rate would be higher among Black vs White Americans and that the higher progression would be explained by disproportionate distribution of many clinical conditions.
Materials and Methods
The data that support the findings of this study are available from the CARDIA Coordinating Center (https://www.cardia.dopm.uab.edu) upon reasonable request.
Study Design and Population
This study was conducted in the CARDIA cohort, a longitudinal community-based study of Black and White men and women from four cities able to walk on a treadmill when they were 18 to 30 years old at the time of enrolment in 1985–1986 (exam Year 0).22 Furthermore, balanced representation of age, race (Black or White), sex, and educational attainment (<high school or ≥high school) was also a goal of the recruiting scheme at each of the field centers. CARDIA was approved by the institutional review boards of each study center, and at each follow-up visit, participants provided written informed consent. The current analyses composed of 4382 participants after we excluded participants who had a history of cardiovascular disease or died before baseline for this study at Year 10 (n=90), had no kidney measurements (n=722), or had no data on hypertension, diabetes, dyslipidemia, or obese status at Year 10 (n=9).
Assessment of Kidney Markers and Definition of CKD Progression
Serum creatinine, urinary albumin, and urinary creatinine were assayed up to 5 times between Year 10 and Year 30. Serum creatinine was measured using Jaffe methodology; urinary albumin and creatinine were evaluated using single untimed urine samples, with albumin measured through nephelometry using a specific anti-albumin monoclonal antibody and creatinine measured using the Jaffe method.23 eGFR was calculated using serum creatinine-based CKD-EPI 2021 race-free equation.24,25 Hospitalized or fatal kidney failure was ascertained via annual surveys until Year 32 (August 31, 2018). The 2012 KDIGO heat map depicting CKD progression risk categories was modified to account for the low number of adults with large declines in eGFR, typical of a generally healthy younger group in CARDIA.26 The five CKD categories analyzed for this study were No CKD, low risk, moderate risk, high risk, and very high risk (Figure S1). Specifically, 1) low UACR was split into two categories: <10 (mg/g) and 10−29 (as UACR 10−29 is common in early middle age), allowing distinction between No CKD from low risk with early increases in UACR; 2) we categorized the few individuals with eGFR 45−59 (mL/min/1.73 m2) and UACR <30 from moderate risk to high risk to prevent mixing them with the participants with eGFR 45−59 (mL/min/1.73 m2) and UACR 10–29. Other than that, the aforementioned categories and their labels correspond to KDIGO heat map categories.10 The highest CKD category for each exam was used, carrying forward the most recent non-missing value, if necessary. Therefore, sample size at Year 10 was 3461 and increased as participants who skipped the Year 10 clinic visit were next reexamined at Year 15, Year 20, Year 25, or Year 30 to 4032, 4261, 4376, and 4382 participants, respectively. Although some participants were observed to revert across examinations to lower risk categories, particularly based on the variation in UACR, we found by looking at the full record that about 80% of those who ever reached a higher risk category showed systematic evidence of worsening CKD.11 The primary outcomes used in the current study were three binary transitions: Transition 1) from No CKD into low, moderate, high, or very high risk (or No CKD into ≥ low risk); Transition 2) from No CKD or low risk into moderate, high, or very high risk (or ≤ low risk into ≥ moderate risk); and Transition 3) from No CKD,low, or moderate risk into high or very high risk (or ≤ moderate risk into ≥ high risk). The first and second outcomes primarily represent a rise in UACR, both while retaining eGFR ≥60.The third outcome represents transitions involving decreased eGFR, either alone or in conjunction with increase in UACR, or severely increased UACR with eGFR ≥60. Transitions from specific modified KDIGO categories were not considered; many people who transitioned to higher risk categories skipped over some lower risk categories, likely due to the long inter-exam interval.11 Transitioning into the very high risk was not evaluated separately due to very few numbers.
Assessment of Covariates
We obtained information about age, self-reported race, and sex at Year 0 and at each exam have updated years of education completed, smoking status and pack-year of smoking, and medication use (diabetes, hypertension, and dyslipidemia) through self-reported questionnaire and/or review of medication bottles. Time-updated covariates were created for the current analysis. Measurements of all other physical and laboratory covariates were done between Year 10 and Year 30 except for several variables as described later. BMI was measured, and obesity was defined as BMI ≥30 kg/m2. Hypertension was defined as systolic blood pressure ≥140 mm Hg, diastolic blood pressure ≥90 mm Hg, or the use of antihypertensive medication. Lung volume was measured as forced vital capacity (FVC; Year 0, Year 2, Year 5, Year 10, Year 20, and Year 30).27 Participants were asked to fast for 12 hours before each blood draw. Blood was drawn from the antecubital vein and serum and plasma aliquots were stored at −70°C until testing. Description of blood specimen collection and assay methodologies were described previously.28–30 Laboratory variables included triglycerides (Year 10-Year 30), HDL-C (Year 10-Year 30), serum urate (Year 10, Year 15, Year 20),31 high-sensitivity C-reactive protein (hsCRP; Year 7, Year 15, Year 20, Year 25),32 the nuclear magnetic resonance marker GlycA (Year 7),33,34 and sum of 4 carotenoids (alpha-carotene, beta-carotene, beta-cryptoxanthin, and zeaxanthin/lutein; Year 7, Year 15, Year 20).35,36 Other binary covariates included high triglycerides (serum triglycerides ≥1.69 mmol/L), measured at all exams), low HDL-C (<1.29 mmol/L for female and <1.04 mmol/L for male, measured at all exams), and diabetes (fasting glucose concentration ≥6.99 mmol/L; 2-hour post-challenge glucose concentration ≥11.1 mmol/L, measured at Year 10, Year 20, and Year 25); glycated hemoglobin (HbA1c) ≥0.07 fraction, measured at Year 20 and Year 25); and/or use of glucose lowering medication.37 Thus, all important predictor variables, including diabetes, hypertension and dyslipidemia were diagnosed based on known medical treatment or measured values.
The Institutional Review Board of the University of Alabama at Birmingham serves as a single review body for CARDIA and approved the study at all sites included in this work: University of Alabama at Birmingham, Northwestern University, Kaiser Permanente Northern California, University of Minnesota. CARDIA participants have signed informed consent at each clinic visit, in accordance with the Declaration of Helsinki.
Statistical Analyses
We applied a 3-stage analytic approach to explore how potential risk factors for CKD progression differed between Black and White participants. First, we estimated the occurrence rates of transitions by race and then stratified by individual risk factors, presenting them as the percentage of people making three CKD transitions within extreme quartiles of risk factor categories. Second, minimal models adjusting for age, sex, and education were fitted using Cox proportional hazard regression; these models estimated the hazard ratios (HRs) of CKD transitions for Black vs White participants. Third, we then examined models further adjusting for each risk factor. The percentage change in the estimated log HR (or β, where eβ equals the HR for incident CKD transition in Black compared with White participants) were quantified to determine the extent to which the aforementioned risk factors contributed to racial differences in risk for CKD transition; the formula used is (βrace adjusted for predictor – βrace unadjusted / βrace unadjusted) × 100. In a final step, mutually adjusted models that included all risk factors simultaneously were used to quantify the relative explanatory importance of combined risk factors for the same outcome prediction. Covariates were allowed to change with time. For continuous covariates, data were averaged over the available years up to each examination, and for the outcome of binary disease incidence (yes or no), the first disease occurrence was cumulative over study years of follow-up. Analytical strategies using time-varying covariates estimate the risk of CKD transition for each examination year, and the overall HR represents an average HR for the whole follow-up time. This averaging approach allows for the minimization of random within-person errors, better reflects the cumulative effect of each variable, preserves the sample size, and automatically accounts for any missing data in follow-up measures.10 SAS version 9.4 (SAS Institute Inc., Cary, NC) was used for analyses, and two-sided P values <0.05 were considered statistically significant.
Results
Study Population Characteristics
The study included 4382 participants, of whom 2175 (49.6%) self-reported Black and 2207 self-reported White race (50.4%). For each race, the corresponding mean (SD) ages were 34.4 (3.8) and 35.6 (3.4) years. The characteristics of the study participants according to race are presented in Table 1.” Black participants, in comparison to White participants, were younger (34.4 vs 35.6 years), had fewer years of education (14.7 vs 16.3 years), a higher proportion were female (57.2 vs 53.1%), and had lower eGFR (102.8 vs 108.3 mL/min/1.73 m2) but higher UACR (29.5 vs 10.7 mg/g). In general, conventional and non-traditional characteristics were less favorable for Black individuals. For example, compared with White participants, Black participants tended to have lower levels and greater change of FVC and serum carotenoids, while GlycA, hsCRP, urate, hypertension, diabetes, and obesity were higher and/or increased more during follow-up. However, Black participants had lower levels of triglycerides.
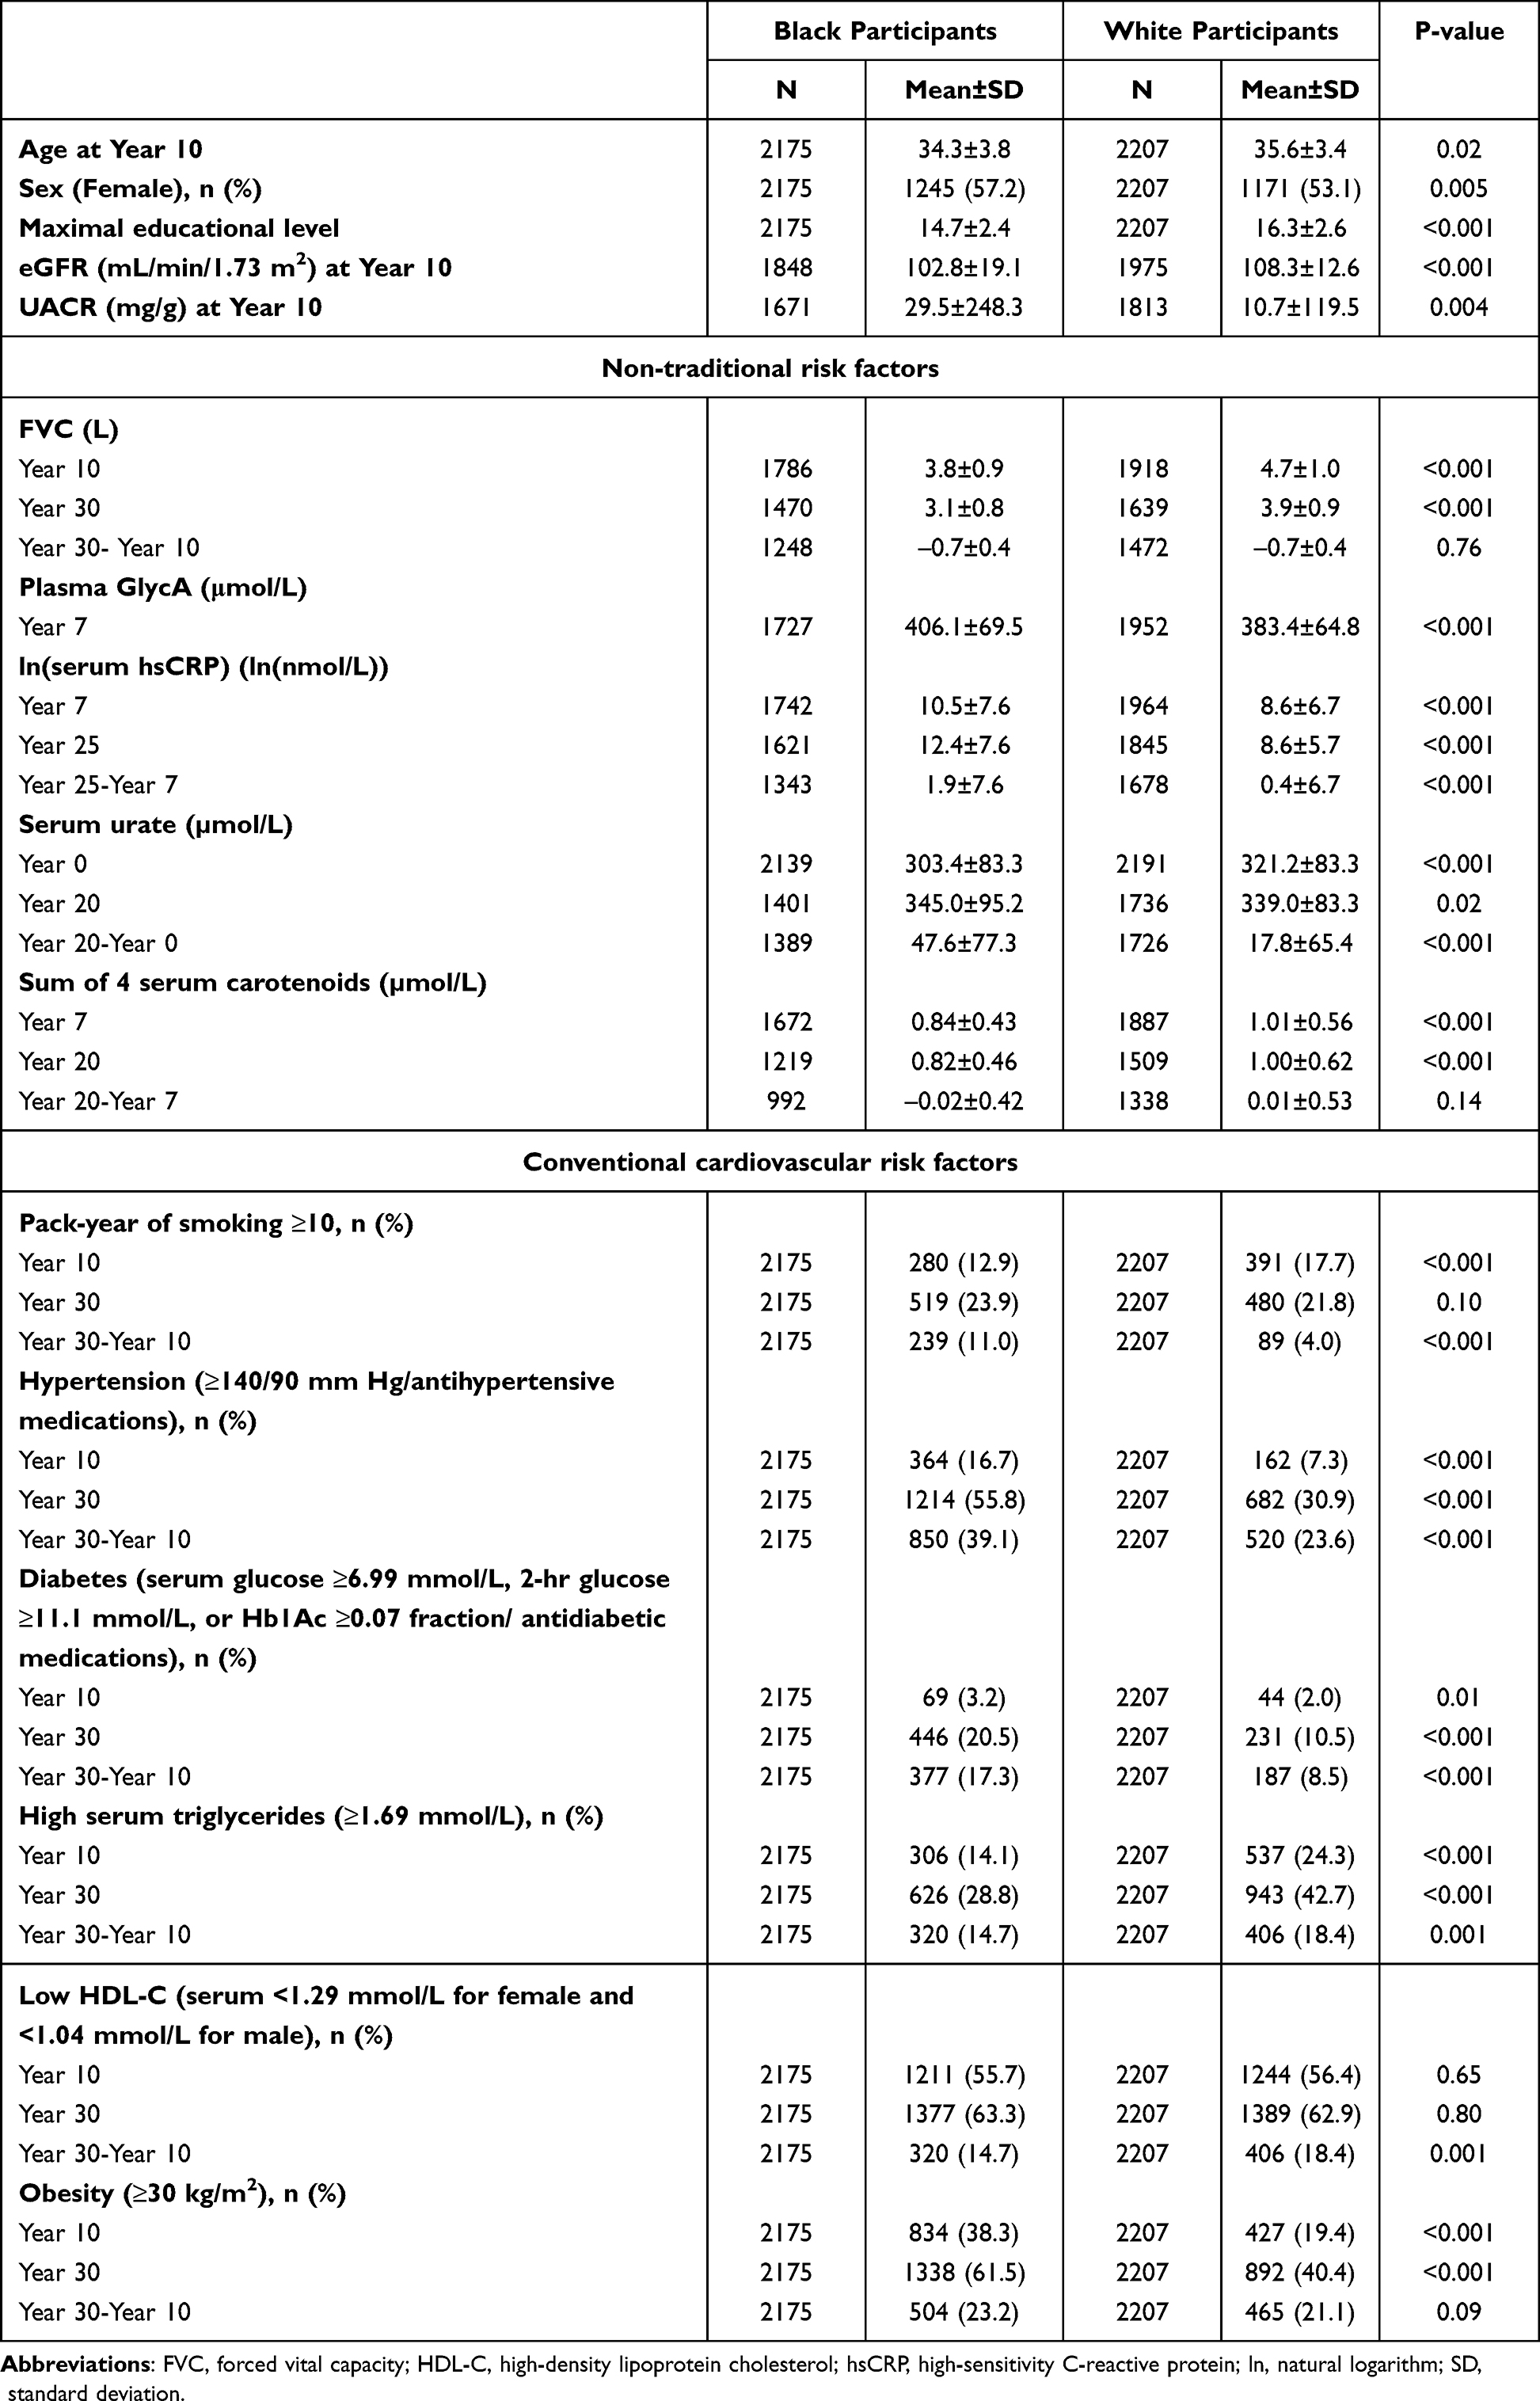 |
Table 1 Characteristics of CARDIA Study Participants According to Race |
CKD Transition Probability by Race
Black individuals had greater probabilities for all three transitions compared to White participants across the 20-year period (Table 2). The transition probabilities for Black and White participants were 33% vs 25.5% for no CKD into ≥ low risk, 15.9% vs 8.1% for ≤ low risk into ≥ moderate risk, and 8.1% vs 2.0% for ≤ moderate risk into ≥ high risk. The non-traditional factors FVC and sum of 4 carotenoids showed inverse associations with advancing into higher categories when comparing extreme quartiles, while GlycA, hsCRP, and serum urate had positive associations. The only exception to the observed direction of association was for FVC in Black participants in the transition from ≤ moderate risk into ≥ high risk. Of conventional factors, transitioning into higher categories was most strongly associated with diabetes and hypertension in both Black and White participants, but associations with cigarette smoking were weak. In some instances, the patterns were nominally more pronounced among the White participants.
 |
Table 2 CKD Transition Probabilities According to Non-Traditional and Conventional Cardiovascular Risk Factors |
Contribution of Risk Factors to the Association Between Black Race and CKD Transition
Table 3 shows the adjusted HRs for CKD progression for Black participants compared to White participants using the minimal model (age, sex, and education adjusted) and percent change in the β estimates after additional individual risk factor adjustment relative to the minimal model in proportional hazard regression. Black participants had higher risk of CKD progression, with the association being stronger with more severe transitions; the adjusted HR in Black participants compared with White participants were 1.38 for no CKD into ≥ low risk, 2.25 for ≤ low risk into ≥ moderate risk, and 4.49 for ≤ moderate risk into ≥ high risk. In a series of analyses associated with each single risk factor, the dominant variables explaining of racial differences in CKD progression were FVC, followed by hypertension and obesity. When FVC was included in the main multivariable analysis, the association between race and CKD progression risk was substantially reduced; Specifically, FVC explained 54.8%, 32.2%, and 14.2% of the observed race and three CKD transitions, respectively. The corresponding estimates were 30.9%, 20.1%, and 13.7% for hypertension, and 20.8%, 12.5%, and 4.7% for obesity. Some other factors explained smaller amounts of the race coefficient, and adjustment for TG enhanced the race coefficient. Simultaneous adjustment for all risk factors had a similar result as for adjustment only for FVC. In general, the transition to the highest categories (≤ moderate risk into ≥ high risk) was less explained by risk factors studied compared with the first two transitions.
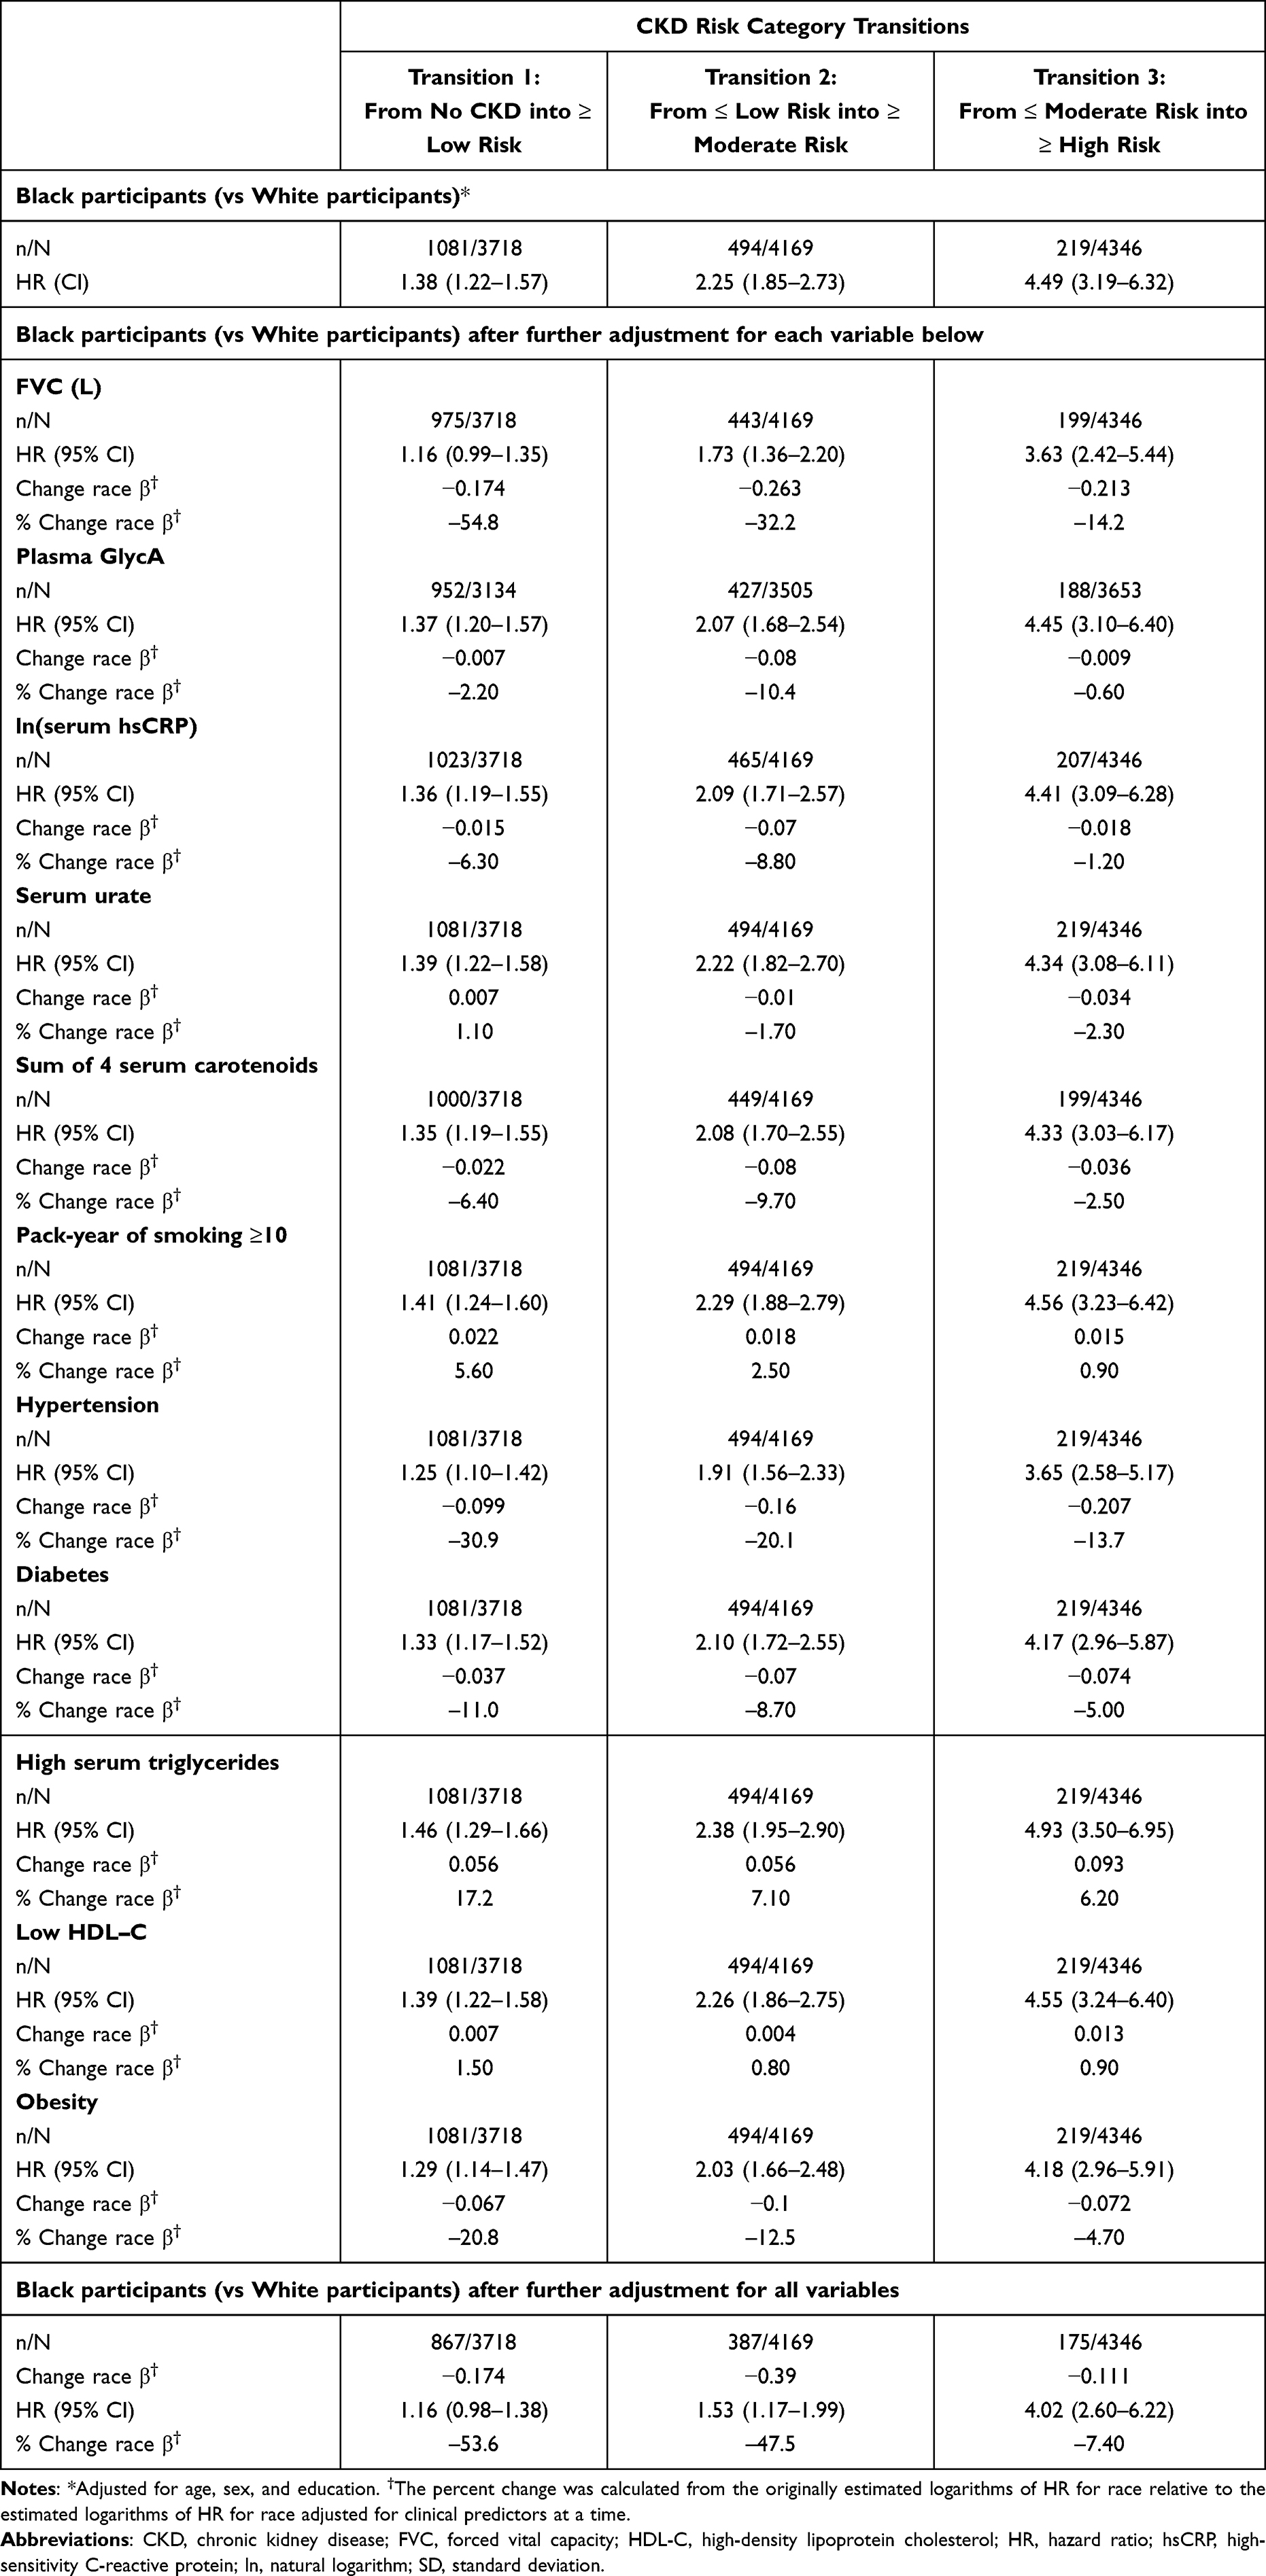 |
Table 3 Adjusted HRs of CKD Progression Associated with Black Participants (Vs White Participants), Adjusted for Time-Varying Predictors, One at a Time and Simultaneously |
Discussion
The novelty of our study is that we demonstrated large differences between young Black and White Americans in risk of CKD progression across younger adulthood and quantified potential underlying mechanisms linking race to CKD progression. In this longitudinal study, Black individuals had a greater probability of progressing to more advanced CKD categories, and the observed race association became stronger in more severe transitions for example, in the 4.5-fold higher risk of CKD among Blacks vs Whites for the transition from ≤ moderate risk into ≥ high risk. We also found that Black participants had higher incidence of individual risk factors that predict CKD progression. Notably, FVC, hypertension, and obesity were key factors responsible for the racial differences in CKD transitions, and they explained earlier transitions better on the percent difference scale, though the corresponding differential on the additive scale is small. The rest of the traditional and non-conventional factors variably explained smaller magnitudes of the racial differences in CKD progression.
This study complements previous findings1,38,39 by demonstrating racial differences in longitudinal CKD progression from young to middle adulthood using modified KDIGO categories that incorporated eGFR and UACR in combination. In our study, racial differences in CKD progression were mainly explained by absolute FVC,11 with considerable differences for high vs low FVC. The reasons underlying racial differences in FVC remain unresolved but prior studies suggested that height and frame size may be more important to explain these differences than socioeconomic, nutritional, and environmental factors.40,41
Consistent with our findings, higher burden of chronic disease and earlier onset of multimorbidity were observed in Black than in White middle-aged Americans.42 Hypertension, diabetes, and obesity are intertwined (cardiometabolic syndrome) and are well-known risk factors for CKD and ESKD.2,3,5 These traditional risk factors at younger age were strongly associated with CKD progression in a previous CARDIA analysis.11 In a nationally representative sample, the prevalence of CKD decreased from 2003–2006 to 2015–2018 within the high-risk group for diabetes and CVD, but rising rates of obesity, hypertension, and diabetes offset all progress achieved through the improvement of CKD rate, underscoring the importance of addressing these important risk factors in an effort to lower the overall burden of CKD.43 Development of cardiometabolic dysfunction early in life among Black Americans may indicate earlier and longer cumulative exposure to risk factors that contribute to higher risk of CKD progression.44,45 Overall, a set of individual risk factors studied could account for about half of the racial difference in less severe CKD progression and, to a smaller extent, in more severe CKD transitions. In parallel to the clinical factors, a number of social components that are complexly interrelated (so-called systemic racism) may also comprise a part of an explanation for racial differences in CKD progression: health services (eg, access to and quality of care and insurance status), physical environment (eg, housing quality and stability, neighborhood, and transportation), social environment (eg, educational level, income level, and discrimination), social support, and health literacy.8,46 Our findings add to published findings in CARDIA delineating several ways in which social determinants of health and clinical factors contribute to Black-White differences in risky behaviors,47 obesity,48 and CVD.49 Moreover, racial disparities in CKD may be explained by variants in the APOL1 gene that were known to link with end-stage kidney disease and CKD in Black people, but rarely occurs in White people. In previous CARDIA work, in fully adjusted analysis, the estimated population attributable fraction of albuminuria incidence explained by APOL1 high-risk genotype was 10.8% among Black participants.50 The remaining difference in CKD progression could be attributable to unmeasured factors or other biological, genetic, and environmental factors. Further research is needed to better understand contributors to racial differences in CKD progression.
The strengths of our study were first, CARDIA is a community-based, long-term follow-up longitudinal study with a high follow-up rate among survivors. Second, a wide range of clinical variables were assessed and repeatedly measured many times, allowing for the calculation of the average effect over 20 years. Third, CKD was identified based on a modified KDIGO 2012 classification that suggested using eGFR and UACR in combination, and dynamic progression across CKD categories with non-traditional and conventional factors was evaluated. Lastly, our findings for FVC, which substantially explained the relationship between race and CKD progression, were novel and can provide further insight into a factor yielding potential racial differences in CKD progression. This study also has several limitations. The observational nature of this study precludes causal inference and residual confounding may exist. Additionally, CARDIA included only Black and White Americans, other races were not represented.
The findings of our longitudinal study suggest that CKD progression is more common in Black than White counterparts during the transition from young to middle-aged adulthood. Moreover, these differences may be explained partly by key non-traditional and conventional risk factors that showed apparent differences in CKD transition probabilities between them, notably FVC, hypertension, and obesity. Important factors in avoiding CKD progression include hypertension, diabetes, absolute FVC, and obesity.11 In this paper, we showed that FVC, hypertension, and obesity are dominant in explaining the race difference in CKD progression and both were more strongly related to UACR changes than to eGFR changes. Preserving kidney function is important for all persons, regardless of their race. However, given the disproportionate burden of risk factors for CKD among Black adults, it is particularly important to address the risk factors for CKD in Black adults in order to reduce disparities in CKD and its downstream consequences including end-stage renal disease and cardiovascular disease. Because CKD progression can begin in younger adulthood and is attributed to various adverse health conditions, the implication is that primordial prevention should begin early in adult life.
Conclusions
To close the equity gap related to the foremost risk factors for CKD and burden of CKD, strategic actions are needed to eliminate the determinants of population health known to increase risk of CKD progression and improve the health of individuals, families, and communities in the context of racial disparities. Currently, there are no recommendations for CKD screening by the US Preventive Task Force. Blood pressure and BMI measurement are currently recommended for screening in young people every year. Assessment of eGFR and albuminuria should also be considered, especially if other known risk factors for CKD are present, such as diabetes or hypertension. Screening may be particularly crucial for young Black adults due to their elevated risk of chronic kidney disease progression.
Author Contributions
All authors contributed to data analysis, drafting or revising the article, have agreed on the journal to which the article will be submitted, gave final approval of the version to be published, and agree to be accountable for all aspects of the work.
Funding
The Coronary Artery Risk Development in Young Adults Study (CARDIA) is conducted and supported by the National Heart, Lung, and Blood Institute (NHLBI) in collaboration with the University of Alabama at Birmingham (HHSN268201800005I & HHSN268201800007I), Northwestern University (HHSN268201800003I), University of Minnesota (HHSN268201800006I), and Kaiser Foundation Research Institute (HHSN268201800004I). This manuscript has been reviewed by CARDIA for scientific content. The sponsor, NHLBI has a representative on the Steering Committee of CARDIA and participated in study design, data collection, and scientific review of this paper. The sponsor had no role in data analysis, data interpretation, or writing of this report. The data used in this study are available from the CARDIA Coordinating Center (www.cardia.dopm.uab.edu) on reasonable request.
Disclosure
HK has served as a consultant for Bayer Pharmaceuticals and CSL Vifor and was a past president of the National Kidney Foundation. AC has served as a consultant for Novartis, Reata, Amgen, and Relypsa and reports grants from Novartis, Bayer and National Kidney Foundation, outside the submitted work. The authors report no other conflicts of interest in this work.
References
1. Centers for Disease Control and Prevention. Chronic kidney disease surveillance system—United States. Available from: http://www.cdc.gov/ckd.
2. Shen Y, Cai R, Sun J, et al. Diabetes mellitus as a risk factor for incident chronic kidney disease and end-stage renal disease in women compared with men: a systematic review and meta-analysis. Endocrine. 2017;55(1):66–76. doi:10.1007/s12020-016-1014-6
3. Weldegiorgis M, Woodward M. The impact of hypertension on chronic kidney disease and end-stage renal disease is greater in men than women: a systematic review and meta-analysis. BMC Nephrol. 2020;21(1):506. doi:10.1186/s12882-020-02151-7
4. Centers for Disease Control and Prevention. Chronic Kidney Disease in the United States, 2019. Atlanta, GA: Department of Health and Human Services, Centers for Disease Control and Prevention; 2019.
5. Hall ME, Do Carmo JM, da Silva AA, Juncos LA, Wang Z, Hall JE. Obesity, hypertension, and chronic kidney disease. Int J Nephrol Renovasc Dis. 2014;7:75–88. doi:10.2147/IJNRD.S39739
6. Centers for Disease Control and Prevention. Hypertension Cascade: Hypertension Prevalence, Treatment and Control Estimates Among U.S. Adults Aged 18 Years and Older Applying the Criteria from the American College of Cardiology and American Heart Association’s 2017 Hypertension Guideline—NHANES 2015–2018. Atlanta, GA: Department of Health and Human Services; 2021.
7. Centers for Disease Control and Prevention. National Diabetes Statistics Report, 2020. Atlanta, GA: Centers for Disease Control and Prevention, U.S. Dept of Health and Human Services; 2020.
8. Norton JM, Moxey-Mims MM, Eggers PW, et al. Social determinants of racial disparities in CKD. J Am Soc Nephrol. 2016;27(9):2576–2595. doi:10.1681/ASN.2016010027
9. Peralta CA, Katz R, DeBoer I, et al. Racial and ethnic differences in kidney function decline among persons without chronic kidney disease. J Am Soc Nephrol. 2011;22(7):1327–1334. doi:10.1681/ASN.2010090960
10. Choi Y, Jacobs DR, Shroff GR, Kramer H, Chang AR, Duprez DA. Progression of chronic kidney disease risk categories and risk of cardiovascular disease and total mortality: coronary artery risk development in young adults cohort. J Am Heart Assoc. 2022;11(21):e026685. doi:10.1161/JAHA.122.026685
11. Choi Y, Jacobs DR, Kramer HJ, Shroff GR, Chang AR, Duprez DA. Non-traditional risk factors for progression through chronic kidney disease risk categories: the coronary artery risk development in young adults study. Am J Med. 2022;S0002–9343(22):887. doi:10.1016/j.amjmed.2022.12.001
12. Husain-Syed F, Slutsky AS, Ronco C. Lung-kidney cross-talk in the critically ill patient. Am J Respir Crit Care Med. 2016;194(4):402–414. doi:10.1164/rccm.201602-0420CP
13. Sorino C, Scichilone N, Pedone C, Negri S, Visca D, Spanevello A. When kidneys and lungs suffer together. J Nephrol. 2019;32(5):699–707. doi:10.1007/s40620-018-00563-1
14. Chandra D, Stamm JA, Palevsky PM, et al. The relationship between pulmonary emphysema and kidney function in smokers. Chest. 2012;142(3):655–662. doi:10.1378/chest.11-1456
15. Harris B, Klein R, Jerosch-Herold M, et al. The association of systemic microvascular changes with lung function and lung density: a cross-sectional study. PLoS One. 2012;7(12):e50224. doi:10.1371/journal.pone.0050224
16. Jourde-Chiche N, Fakhouri F, Dou L, et al. Endothelium structure and function in kidney health and disease. Nat Rev Nephrol. 2019;15(2):87–108. doi:10.1038/s41581-018-0098-z
17. Kumagai T, Ota T, Tamura Y, Chang WX, Shibata S, Uchida S. Time to target uric acid to retard CKD progression. Clin Exp Nephrol. 2017;21(2):182–192. doi:10.1007/s10157-016-1288-2
18. Pan J, Shi M, Ma L, Fu P. Mechanistic insights of soluble uric acid-related kidney disease. Curr Med Chem. 2020;27(30):5056–5066. doi:10.2174/0929867326666181211094421
19. Ejaz AA, Nakagawa T, Kanbay M, et al. Hyperuricemia in kidney disease: a major risk factor for cardiovascular events, vascular calcification, and renal damage. Semin Nephrol. 2020;40(6):574–585. doi:10.1016/j.semnephrol.2020.12.004
20. Hozawa A, Jacobs DR, Steffes MW, Gross MD, Steffen LM, Lee DH. Relationships of circulating carotenoid concentrations with several markers of inflammation, oxidative stress, and endothelial dysfunction: the coronary artery risk development in young adults (CARDIA)/young adult longitudinal trends in antioxidants (YALTA) study. Clin Chem. 2007;53(3):447–455. doi:10.1373/clinchem.2006.074930
21. Di Pietro N, Baldassarre MPA, Cichelli A, Pandolfi A, Formoso G, Pipino C. Role of polyphenols and carotenoids in endothelial dysfunction: an overview from classic to innovative biomarkers. Oxid Med Cell Longev. 2020;2020:6381380. doi:10.1155/2020/6381380
22. Friedman GD, Cutter GR, Donahue RP, et al. CARDIA: study design, recruitment, and some characteristics of the examined subjects. J Clin Epidemiol. 1988;41(11):1105–1116. doi:10.1016/0895-4356(88)90080-7
23. Murtaugh MA, Jacobs DR, Yu X, Gross MD, Steffes M. Coronary artery risk development in young adults study. Correlates of urinary albumin excretion in young adult blacks and whites: the coronary artery risk development in young adults study. Am J Epidemiol. 2003;158(7):676–686. doi:10.1093/aje/kwg208
24. Levey AS, Stevens LA, Schmid CH, et al. A new equation to estimate glomerular filtration rate. Ann Intern Med. 2009;150(9):604–612. doi:10.7326/0003-4819-150-9-200905050-00006
25. Delgado C, Baweja M, Crews DC, et al. A unifying approach for GFR estimation: recommendations of the NKF-ASN task force on reassessing the inclusion of race in diagnosing kidney disease. Am J Kidney Dis. 2022;79(2):268–288.e1. doi:10.1053/j.ajkd.2021.08.003
26. Kidney Disease: Improving Global Outcomes (KDIGO) CKD Work Group. KDIGO 2012 clinical practice guideline for the evaluation and management of chronic kidney disease. Kidney Int Suppl. 2013;3:1–150.
27. Thyagarajan B, Jacobs DR, Apostol GG, et al. Longitudinal association of body mass index with lung function: the CARDIA study. Respir Res. 2008;9:31. doi:10.1186/1465-9921-9-31
28. Bancks MP, Carnethon MR, Chow LS, et al. Fasting glucose and insulin resistance trajectories during young adulthood and mid-life cardiac structure and function. J Diabetes Complications. 2019;33(5):356–362. doi:10.1016/j.jdiacomp.2019.01.005
29. Warnick GR, Benderson J, Albers JJ. Dextran sulfate-Mg2+ precipitation procedure for quantitation of high-density-lipoprotein cholesterol. Clin Chem. 1982;28(6):1379–1388. doi:10.1093/clinchem/28.6.1379
30. Friedewald WT, Levy RI, Fredrickson DS. Estimation of the concentration of low-density lipoprotein cholesterol in plasma, without use of the preparative ultracentrifuge. Clin Chem. 1972;18(6):499–502. doi:10.1093/clinchem/18.6.499
31. Fossati P, Prencipe L, Berti G. Use of 3,5-dichloro-2-hydroxybenzenesulfonic acid/4-aminophenazone chromogenic system in direct enzymic assay of uric acid in serum and urine. Clin Chem. 1980;26(2):227–231. doi:10.1093/clinchem/26.2.227
32. Rifai N, Tracy RP, Ridker PM. Clinical efficacy of an automated high-sensitivity C-reactive protein assay. Clin Chem. 1999;45(12):2136–2141. doi:10.1093/clinchem/45.12.2136
33. Otvos JD, Shalaurova I, Wolak-Dinsmore J, et al. GlycA: a composite nuclear magnetic resonance biomarker of systemic inflammation. Clin Chem. 2015;61(5):714–723. doi:10.1373/clinchem.2014.232918
34. Jeyarajah EJ, Cromwell WC, Otvos JD. Lipoprotein particle analysis by nuclear magnetic resonance spectroscopy. Clin Lab Med. 2006;26(4):847–870. doi:10.1016/j.cll.2006.07.006
35. Lee DH, Gross MD, Jacobs DR. cardiovascular risk development in young adults study. Association of serum carotenoids and tocopherols with gamma-glutamyltransferase: the cardiovascular risk development in young adults (CARDIA) study. Clin Chem. 2004;50(3):582–588. doi:10.1373/clinchem.2003.028852
36. Bieri JG, Brown ED, Smith JC. Determination of individual carotenoids in human plasma by high performance liquid chromatography. J Liq Chromatogr. 1985;8:473–484. doi:10.1080/01483918508067094
37. American Diabetes Association. Diagnosis and classification of diabetes mellitus. Diabetes Care. 2014;37(1):S81–90. doi:10.2337/dc14-S081
38. Grams ME, Chow EKH, Segev DL, Coresh J. Lifetime incidence of CKD stages 3–5 in the United States. Am J Kidney Dis. 2013;62(2):245–252. doi:10.1053/j.ajkd.2013.03.009
39. Muntner P, Newsome B, Kramer H, et al. Racial differences in the incidence of chronic kidney disease. Clin J Am Soc Nephrol. 2012;7(1):101–107. doi:10.2215/CJN.06450611
40. Harik-Khan RI, Muller DC, Wise RA. Racial difference in lung function in African-American and White children: effect of anthropometric, socioeconomic, nutritional, and environmental factors. Am J Epidemiol. 2004;160(9):893–900. doi:10.1093/aje/kwh297
41. Jacobs DR, Nelson ET, Dontas AS, Keller J, Slattery ML, Higgins M. Are race and sex differences in lung function explained by frame size? The CARDIA Study. Am Rev Respir Dis. 1992;146(3):644–649. doi:10.1164/ajrccm/146.3.644
42. Quiñones AR, Botoseneanu A, Markwardt S, et al. Racial/ethnic differences in multimorbidity development and chronic disease accumulation for middle-aged adults. PLoS One. 2019;14(6):e0218462. doi:10.1371/journal.pone.0218462
43. Johansen KL, Chertow GM, Gilbertson DT, et al. US renal data system 2021 annual data report: epidemiology of kidney disease in the United States. Am J Kidney Dis. 2022;79(4 Suppl 1):A8–A12. doi:10.1053/j.ajkd.2022.02.001
44. Choi Y, Jacobs DR, Bancks MP, et al. Association of cardiovascular health score with early- and later-onset diabetes and with subsequent vascular complications of diabetes. J Am Heart Assoc. 2022;12:e027558. doi:10.1161/JAHA.122.027558
45. Bae EH, Lim SY, Kim B, et al. Effects of blood pressure according to age on end-stage renal disease development in patients with diabetes: a nationwide population-based cohort study. Hypertension. 2022;79(8):1765–1776. doi:10.1161/HYPERTENSIONAHA.121.18881
46. Crews DC, Pfaff T, Powe NR. Socioeconomic factors and racial disparities in kidney disease outcomes. Semin Nephrol. 2013;33(5):468–475. doi:10.1016/j.semnephrol.2013.07.008
47. Whitaker KM, Jacobs DR, Kershaw KN, et al. Racial disparities in cardiovascular health behaviors: the coronary artery risk development in young adults study. Am J Prev Med. 2018;55(1):63–71. doi:10.1016/j.amepre.2018.03.017
48. Song C, Bancks MP, Whitaker KM, et al. Contribution of social, behavioral, and contextual exposures to black-white disparities in incident obesity: the CARDIA study. Obesity. 2023;2023:1.
49. Shah NS, Ning H, Petito LC, et al. Associations of clinical and social risk factors with racial differences in premature cardiovascular disease. Circulation. 2022;146(3):201–210. doi:10.1161/CIRCULATIONAHA.121.058311
50. Peralta CA, Bibbins-Domingo K, Vittinghoff E, et al. APOL1 genotype and race differences in incident albuminuria and renal function decline. J Am Soc Nephrol. 2016;27(3):887–893. doi:10.1681/ASN.2015020124
 © 2023 The Author(s). This work is published and licensed by Dove Medical Press Limited. The
full terms of this license are available at https://www.dovepress.com/terms
and incorporate the Creative Commons Attribution
- Non Commercial (unported, 3.0) License.
By accessing the work you hereby accept the Terms. Non-commercial uses of the work are permitted
without any further permission from Dove Medical Press Limited, provided the work is properly
attributed. For permission for commercial use of this work, please see paragraphs 4.2 and 5 of our Terms.
© 2023 The Author(s). This work is published and licensed by Dove Medical Press Limited. The
full terms of this license are available at https://www.dovepress.com/terms
and incorporate the Creative Commons Attribution
- Non Commercial (unported, 3.0) License.
By accessing the work you hereby accept the Terms. Non-commercial uses of the work are permitted
without any further permission from Dove Medical Press Limited, provided the work is properly
attributed. For permission for commercial use of this work, please see paragraphs 4.2 and 5 of our Terms.
Recommended articles
Prevalence of Clinical Cardiovascular Disease Risk Factors Among HIV Infected Patients on Anti-Retroviral Treatment in a Tertiary Hospital in Ethiopia
Woldeyes E, Fisseha H, Mulatu HA, Ephrem A, Benti H, Alem MW, Ahmed AI
HIV/AIDS - Research and Palliative Care 2022, 14:297-309
Published Date: 17 June 2022
Risk Factors for Left Ventricular Hypertrophy in Patients with Diabetic Kidney Disease: A Multi-Center Study
Wang X, Zhu D, Peng L, Gao Y, Li X
International Journal of General Medicine 2023, 16:1705-1712
Published Date: 8 May 2023
A 5-Year Follow-Up Study to Explore Factors Associated with Rapid Kidney Function Decline Among Bus Drivers
Wu Y, Chen Q, Zhang Q, Wu Y, Zheng X
International Journal of General Medicine 2023, 16:3193-3201
Published Date: 28 July 2023
Impact of Prior Chronic Kidney Disease and Newly Detected eGFR Impairment at Admission on Outcomes and Prognosis of Hospitalized COVID-19 Patients – A Single-Center Cohort Study
Kania M, Terlecki M, Batko K, Rajzer M, Malecki MT, Krzanowski M
International Journal of General Medicine 2025, 18:593-602
Published Date: 5 February 2025
Determinants of Anemia Among Patients with Chronic Kidney Disease: A Systematic Review of Empirical Evidence
Prapaiwong P, Ruksakulpiwat S, Jariyasakulwong P, Kasetkala P, Puwarawuttipanit W, Pongsuwun K
Journal of Multidisciplinary Healthcare 2025, 18:3765-3780
Published Date: 28 June 2025