Back to Journals » OncoTargets and Therapy » Volume 15
PTEN Expression Was Significantly Associated with PD-L1 Score but Not with EBV Infection in Gastric Cancer
Authors Cao D, Su T, Wu Y, Jia Z, Fu Y, Sun Y ![]() , Jin M, Wang Y, Yi J, Cui Y, Zhang Y, Lv H, Qu L, Jiang J, Cao X
, Jin M, Wang Y, Yi J, Cui Y, Zhang Y, Lv H, Qu L, Jiang J, Cao X
Received 10 May 2022
Accepted for publication 10 September 2022
Published 21 September 2022 Volume 2022:15 Pages 1011—1020
DOI https://doi.org/10.2147/OTT.S374175
Checked for plagiarism Yes
Review by Single anonymous peer review
Peer reviewer comments 2
Editor who approved publication: Dr Arseniy Yuzhalin
Donghui Cao,1,* Tongrong Su,2,* Yanhua Wu,1 Zhifang Jia,1 Yingli Fu,1 Yuanlin Sun,2 Meishan Jin,3 Yueqi Wang,1 Jiaxin Yi,1 Yingnan Cui,2 Yuzheng Zhang,1 Haiyong Lv,1 Limei Qu,3 Jing Jiang,1 Xueyuan Cao2
1Division of Clinical Epidemiology, First Hospital of Jilin University, Changchun, People’s Republic of China; 2Department of Gastric and Colorectal Surgery, General Surgery Center, First Hospital of Jilin University, Changchun, People’s Republic of China; 3Division of Pathology, First Hospital of Jilin University, Changchun, People’s Republic of China
*These authors contributed equally to this work
Correspondence: Xueyuan Cao, Department of Gastric and Colorectal Surgery, General Surgery Center, First Hospital of Jilin University, Changchun, 130021, People’s Republic of China, Email [email protected]
Purpose: Gastric cancer (GC) remains a prevalent aggressive tumor with high morbidity and mortality globally. The identification of GC subtypes based on molecular features improved the prediction of prognosis and the selection of targeted therapies. PTEN is a characteristic tumor suppressor, while its association with different GC subtypes was unknown.
Patients and Methods: The cohort consisted of 248 patients diagnosed with gastric cancer who were hospitalized and received radical gastrectomy. In addition, PTEN gene expression matrix of STAD was retrieved from TCGA. The mRNA and protein levels of PTEN and PD-L1 were detected using qRT-PCR and IHC staining. Multivariate logistic regression and Kaplan–Meier analysis were used to examine the relationship between PTEN expression and clinical characteristics.
Results: In our study, PTEN was downregulated in gastric tumors both in mRNA and protein levels. Its inactivation was closely linked to higher histological grade (P = 0.005), neural invasion (P = 0.012), depth of invasion (P = 0.021), lymph metastasis (P = 0.026), and TNM stage (P = 0.001) of GC in the present study. Moreover, according to the molecular subtypes, high PTEN expression was related to high TPS score of PD-L1 positively (P = 0.010) but was not associated with MSI and EBV infection. Further, TCGA data validated that PTEN was indeed correlated with histological grade and invasion depth and positively related to PD-L1 expression (R = 0.29, adjusted P < 0.001).
Conclusion: The above results suggested that PTEN expression was a useful marker in gastric carcinogenesis and progression and in the selection of immunotherapy-based treatments for GC patients.
Keywords: gastric cancer, PTEN, molecular subtype, PD-L1, biomarker
Introduction
Gastric cancer (GC) is a kind of worldwide malignancy, with the incidence rate ranked fifth and the mortality rate ranked third.1 Despite improvements in surgical and chemotherapeutic treatment, the overall five-year survival of GC remains poor due to late detection, recurrence and metastasis. Thus, searching for new molecular markers may further improve the early detection and prediction of prognosis.
Cancer is a consequence of hyperactivity of proto-oncogenes or inhibition of tumor suppressors.2 PTEN is a classical tumor suppressor, and its activity is commonly inhibited in many cancers.3 PTEN regulates diverse cellular processes through various signaling pathways. PTEN inhibits cell migration and invasion by downregulating the FAK pathway, suppresses cell differentiation by negatively regulating the MAPK pathway,4 and induces cell apoptosis by antagonizing the PI3K/Akt pathway.5
The loss of PTEN expression was frequently observed in dysplasia and carcinoma than that in normal mucosa of the stomach, suggesting the clinical implication of PTEN in gastric carcinogenesis.6 GC is a heterogeneous disease and is classified into intestinal-type and diffuse-type based on histological criteria.7 PTEN had lower protein expression in diffuse-type GC than in intestinal-type GC (P<0.05).6 Moreover, GC was also divided into four subtypes:1 tumors positive for EBV, displaying PD-L1 amplification and DNA hypermethylation; microsatellite unstable tumors (MSI), showing hyperactive gene mutation; genomically stable tumors (GS), displaying enriched diffuse histological variant; tumors with chromosomal instability (CIS), showing marked aneuploidy. The molecular classification helped to screen new therapeutic targets in distinct GC subgroups.8,9 EBV-positive and MSI tumors independently contained 20% and 25% PTEN mutations.8 However, PTEN protein expression in different molecular types has not been elucidated. EBV, PD-1, PD-L1 and MSI-high are predictive biomarkers for immunotherapy.10 Avelumab (anti-PD-L1 mAb) can significantly increase the median progression-free survival in GC/GEJ adenocarcinoma patients.11 Pembrolizumab (anti-PD-1 mAb) is also recommended as a first-line or later-line therapy for advanced GC patients.12,13 The curative effect of avelumab on EBV-positive GC patients was more lasting than EBV-negative patients.13 Elucidating the effects of MSI, EBV, and PD-L1 on PTEN mRNA and protein expression will help patients choose either immunotherapy or combined therapy for GC.
The present study first detected the prevalence of PTEN expression in a GC cohort study and evaluated the association between PTEN mRNA and protein expression and the molecular biomarkers MSI, EBV, and PD-L1. In addition, TCGA data in GC were analyzed to validate the above results. This research provides a scientific foundation for selecting targeted therapies and evaluating the prognosis of GC.
Patients and Methods
Study Population
The cohort consisted of 248 patients diagnosed with gastric cancer who were hospitalized and received radical gastrectomy from 2007 to 2018 in the Department of Gastric and Colorectal Surgery in the First Hospital of Jilin University (Changchun, China). Demographic information (sex, age) and principal clinicopathological data were collected.
Ethics
The informed consent was signed by each participant, and the study was approved by the Ethics Committee of the First Hospital of Jilin University (2018–382). Our study complied with the Declaration of Helsinki.
Follow-Up
Follow-up investigation began after radical gastrectomy in the third and sixth months, at 1 year and then every year. Survival time was calculated from the surgery to the death or final successful follow-up.
TCGA Data Collection
The PTEN FPKM gene expression matrix of STAD and data on clinical characteristics were retrieved from TCGA, and the data on molecular subtypes, microsatellite instability (MSI) statuses and EBV infection statuses were downloaded from the cBioPortal (https://www.cbioportal.org/) based on TCGA STAD patients. High and low PTEN mRNA expression levels were assigned using the median expression of PTEN as the cutoff value.
qRT–PCR
Total RNA was isolated from gastric tumors and paired adjacent nontumors using a FastPure Cell/Tissue RNA Isolation Mini Kit (Vazyme, China), and cDNA was synthesized using a HiScript 1st Strand cDNA Synthesis Kit (Vazyme). The relative PTEN and PD-L1 mRNA expression were analyzed using 2−ΔΔCt method on real-time PCR (Light Cycler 480, Roche), and GAPDH was the internal control.14
Immunohistochemistry Staining
Sections (4 μm thick) from tissue microarray blocks were deparaffinized and incubated with PTEN (1:100, Abcam, Cambridge, UK), PD-L1 (1:200, CST, Cambridge, UK), MLH1 (1:200, Abcam), MSH2 (1:200, Abcam), MSH6 (1:200, Abcam), PMS2 (1:200, Abcam) antibodies. Signals were visualized using DAB and analyzed by software (GenASIs, Israel) and two independent pathologists (MSJ and LMQ).
PTEN protein expression was analyzed using HSCORE system.15 Briefly, HSCORE = ∑Pi(i) (i = 0, 1, 2, 3, Pi = 0–100%), where i indicates the staining intensity, Pi indicates the percentages of stained cells. The cutoff value of the PTEN protein expression levels were generated using ROCs, and it was classified to high and low expression groups using the cutoff point according to the maximal Youden index.
PD-L1 protein expression was assessed with the tumor proportion score (TPS), which was calculated as the percentage of partial/complete stained tumor cells in a sample. In addition, the MSI status was determined using IHC staining for the four MMR proteins. MSS was defined with positive staining of all MMR proteins, and MSI was defined with at least one MMR protein showing negative staining.16
EBV Infections
EBV infections were evaluated through DNA in situ hybridization (ZSGB-BIO, China). Samples with positive nuclear staining were identified as EBV-positive.16
Western Blot
Proteins were extracted from gastric tumor tissues using strong RIPA lysis buffer containing phosphatase inhibitors (Kangwei, China). The proteins were separated by SDS-PAGE (Kangwei) and transferred onto PVDF membranes (Roche). The relative protein expression levels were determined respectively using PTEN (1:1000, Abcam), PD-L1 (1:1000, Abcam) primary antibodies in an imaging system (Azure, USA). GAPDH (1:10,000, Abcam) was used as the internal control.
Statistics
All statistical analyses were carried out using SPSS 18.0 (Chicago, IL, USA) or GraphPad Prism. Data were compared with the t test or Fisher’s exact test. The correlation between PTEN and PD-L1 mRNA expression were evaluated by Pearson correlation analysis using ΔCt. The associations between PTEN protein levels and different molecular types of GC were analyzed by multivariate logistic regression. Kaplan–Meier survival curves were compared by the Log rank test. A two-sided P < 0.05 was considered to be statistically significant.
Results
Frequent Loss of PTEN Expression in Gastric Cancers
The PTEN mRNA and protein expression in human gastric tumors and adjacent nontumors were independently detected by qRT–PCR (n=24) and IHC staining (n=202). The results showed that PTEN mRNA was aberrantly downregulated in 70.8% (17/24) of gastric tumors (Figure 1A). In addition, when PTEN protein expression was stained brown (Figure 1B), PTEN protein was strongly stained in the adjacent nontumor tissues but weakly stained in the tumors (Figure 1C). Among these 202 gastric tumor specimens, the high PTEN protein expression rate in gastric tumors was 15.8% (32/202), which was lower than that in the corresponding nontumor specimens (81.7%, 165/202, P<0.001) (Table 1).
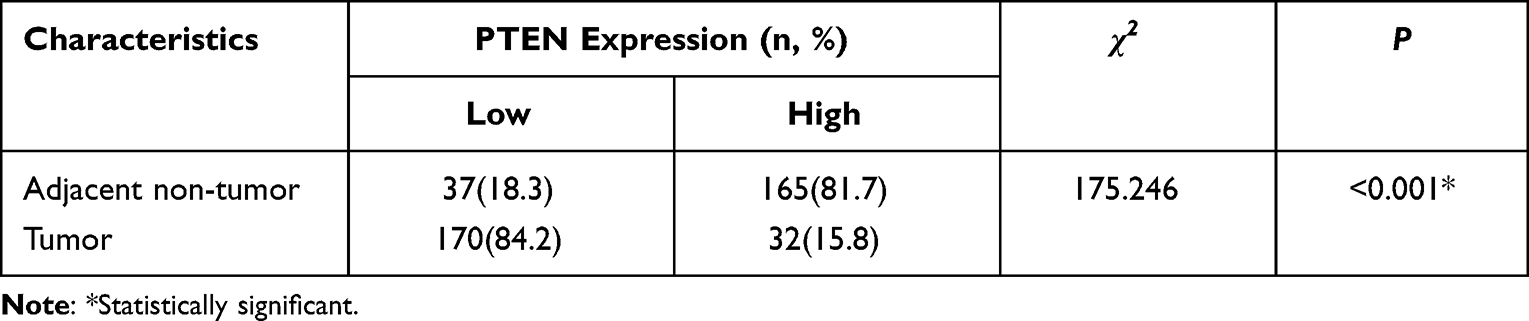 |
Table 1 The Protein Expression of PTEN in Gastric Tumor and Adjacent Non-Tumor Tissue (N=202) |
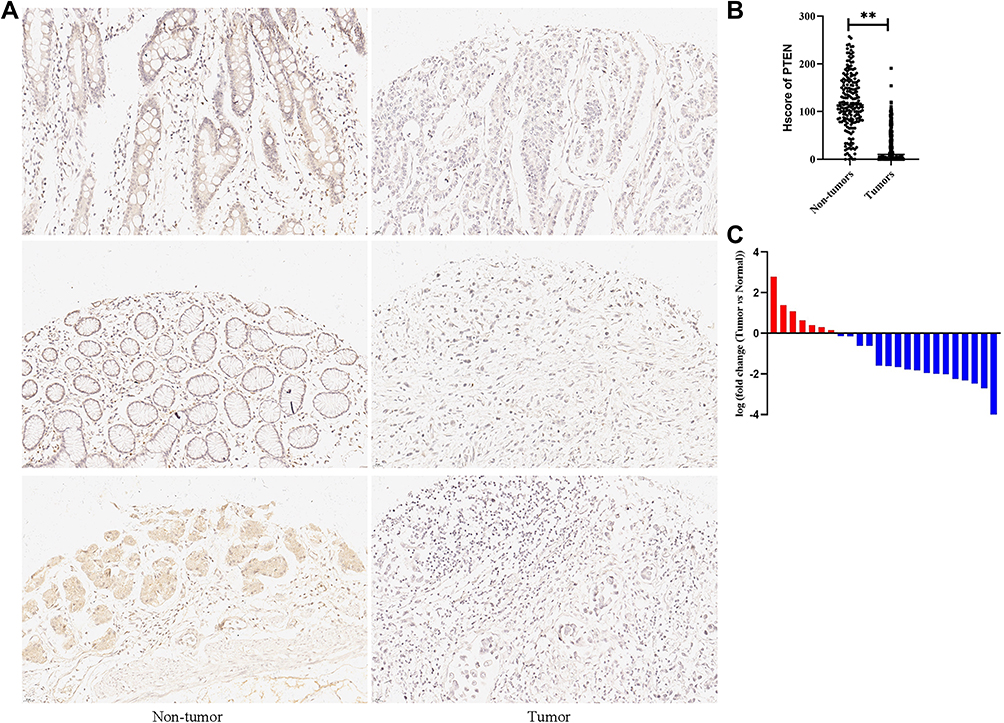 |
Figure 1 PTEN expression levels in gastric tumors and adjacent non-tumors. (A) Representative protein expression levels of PTEN in non-tumor and tumor tissues (N=202). (B) Hscore of PTEN in non-tumor and tumor tissues (N=202). (C) mRNA levels of PTEN in non-tumor and tumor tissues (N=24). Brown color indicates positive expression of PTEN antibody. **Statistically significant. |
Both mRNA and Protein Expression of PTEN Was Associated with the Clinicopathological Characteristics of GC
PTEN expression was classified into high- and low-expression groups based on the cutoff of the H-score (Figure 2). PTEN H-score ≥63.20 was defined as PTEN high expression, and H-score ≤63.19 was defined as PTEN low expression. In addition, the correlations between PTEN protein expression and principal histopathological characteristics of the tumors are summarized in Table 2. A total of 28.3% (15/53) of patients with low-grade tumors expressed PTEN at higher rates than those with high-grade tumors (24/195, 12.3%) (P=0.005). In 186 patients with neural invasion, the high expression rate was 12.4% (23/186), which was lower than that in patients without neural invasion (16/62, 25.8%) (P=0.012). A total of 14.5% (34/235) of T3/T4 gastric tumors highly expressed PTEN, which was less than that of T1/T2 gastric tumors (38.5%, 5/13) (P=0.021). Among 208 patients with lymph metastasis, 13.5% (28/208) expressed high levels of PTEN, a lower percentage than those without lymph metastasis (11/40, 27.5%) (P=0.026). In addition, TNM III/IV stage expressed PTEN protein at a lower level (11.1%, 20/180), which was 27.9% in TNM I/II stages (19/68, P=0.001) (Figure 3). The results indicated that PTEN low protein expression was associated with low-grade gastric tumors, positive neural invasion, depth of invasion, lymph metastasis and TNM stage; thus, PTEN was considered a useful marker for the carcinogenesis of GC.
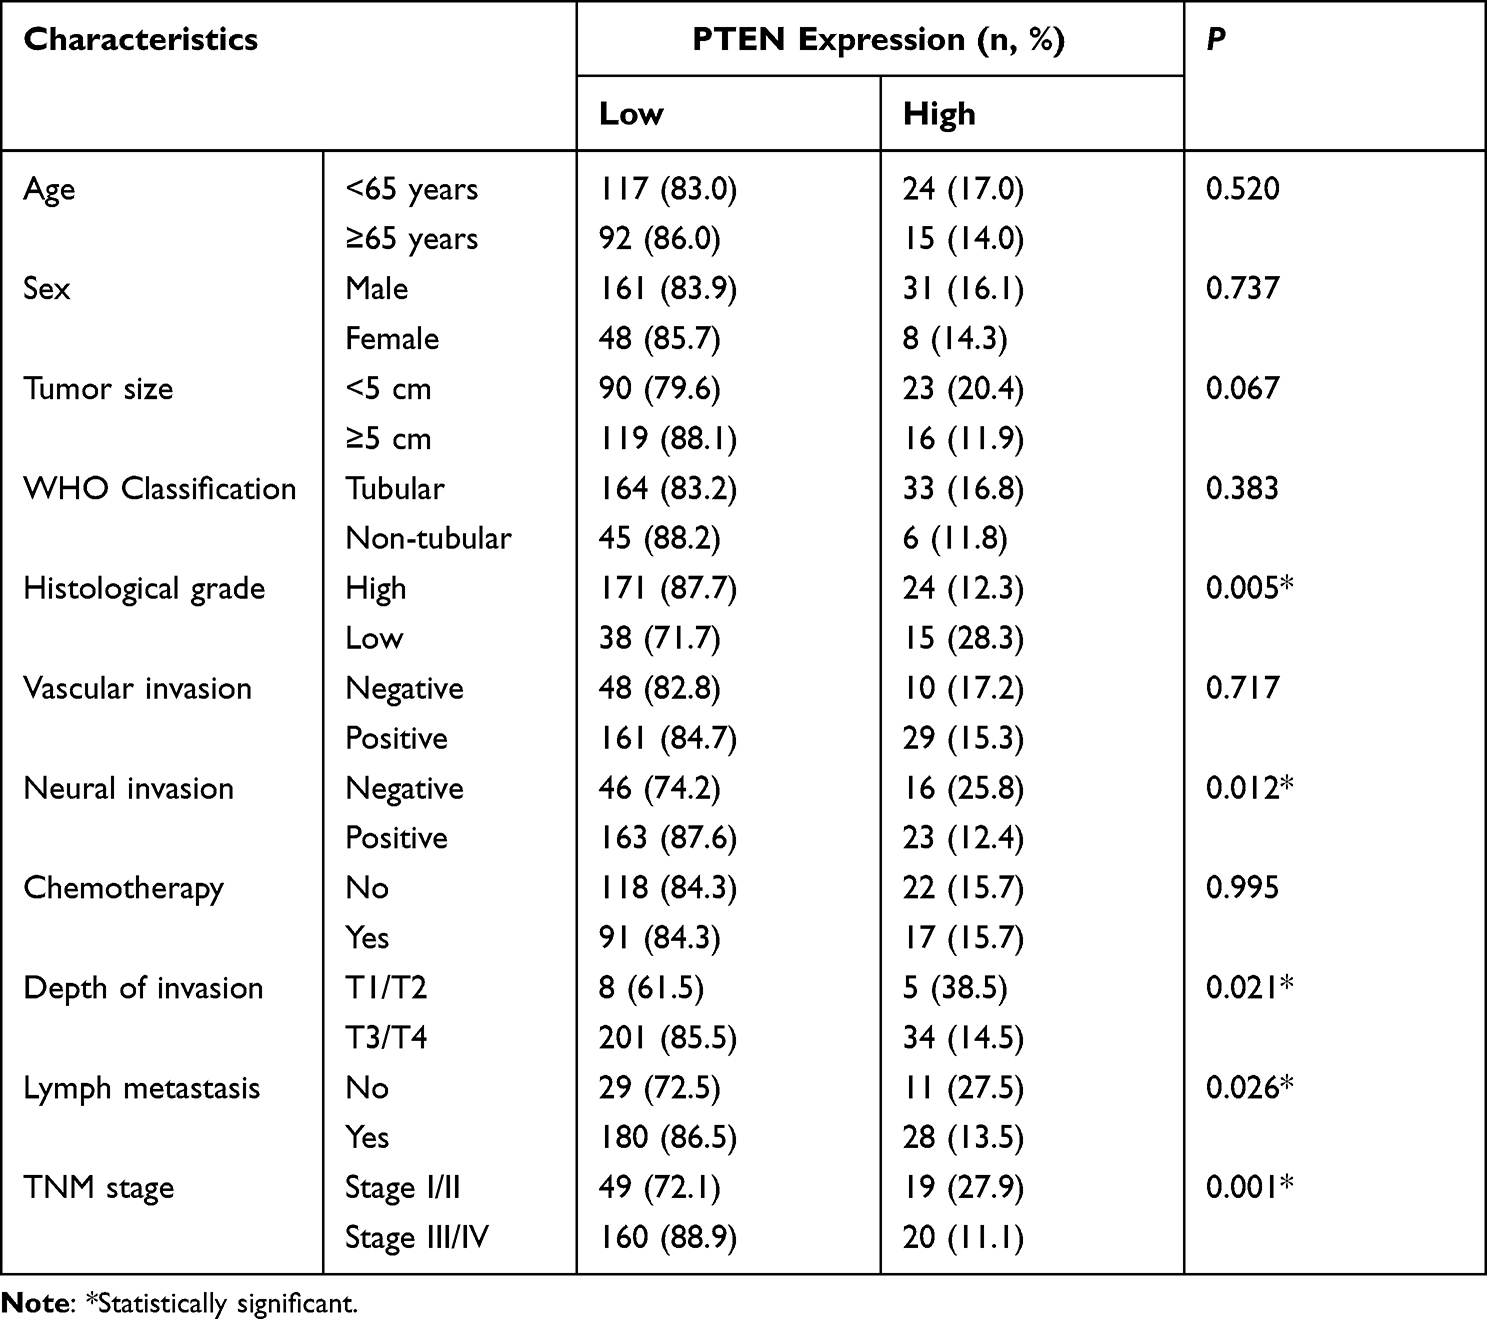 |
Table 2 Clinicopathological Characteristics of Patients According to the Expression of PTEN (N=248) |
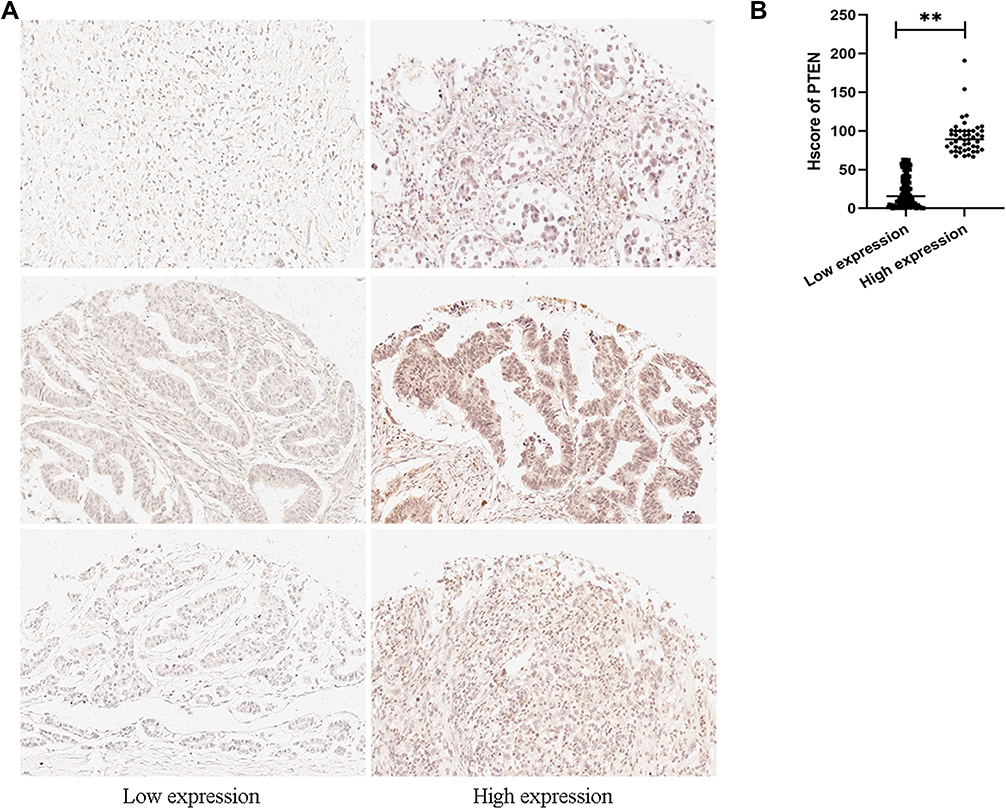 |
Figure 2 Representative low and high protein expression of PTEN in different gastric tumors (N=248). (A) The representative images and (B) Hscore of PTEN protein expression in two groups. Brown color indicates positive expression of PTEN antibody. **Statistically significant. |
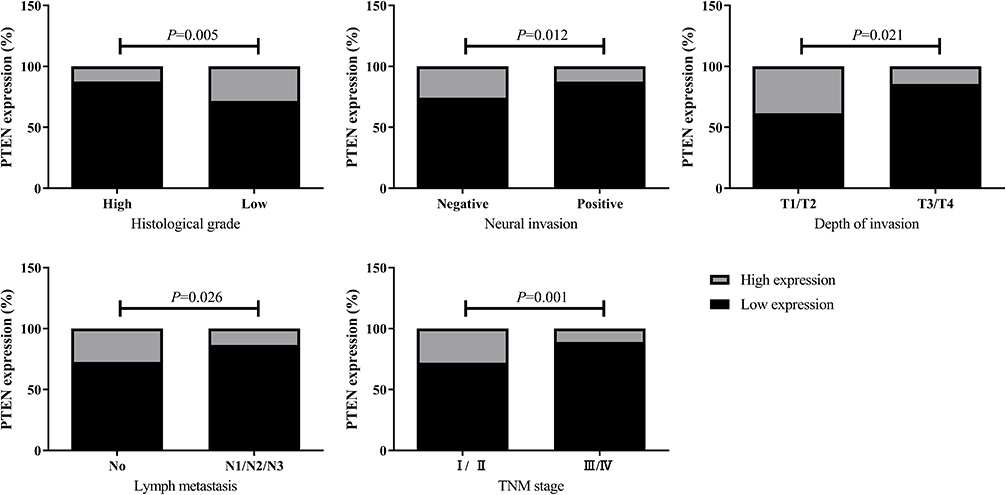 |
Figure 3 Correlation between clinicopathological characteristics (histological grade, neural invasion, depth of invasion, lymph metastasis, TNM stage) and the protein expression of PTEN (N=248). |
To further validate the correlation between PTEN and clinicopathological features, TCGA data from 375 gastric cancer patients and their clinical information were downloaded and analyzed. As shown in Table 3, 46.15% (36/79) of tubular tumors expressed PTEN at a high level, which was less than that of nontubular tumors (61.9%, 65/105) (P=0.015). In 147 cases with high-grade tumors, the high expression rate of PTEN was 34.01% (50/147), which was lower than that in low-grade tumors (132/219, 60.27%) (P=0.00), suggesting that the loss of PTEN was indeed a predictive marker of GC development. However, the survival of GC patients in either our cohort or TCGA data were not related with PTEN expression (Figure S1A and B).
 |
Table 3 Clinicopathological Characteristics of Patients in TCGA According to the mRNA Expression of PTEN (N=375) |
PTEN Protein Expression Was Correlated with Higher PD-L1 TPS Score
EBV infection in 230 cases, MSI status in 228 cases and PD-L1 expression in 227 cases were analyzed in our cohort to identify different molecular subtypes. PD-L1 expression was also divided into high- and low-expression groups based on the TPS (1%) that has been applied clinically. TPS <1% was presented as low PD-L1 expression, TPS ≥ 1% was presented as high PD-L1 expression. Cases with a high PD-L1 scores expressed PTEN highly at a rate of 24.7% (18/73), whereas cases with low PD-L1 scores expressed PTEN at a rate of 11.7% (18/154, P=0.01) (Table 4), suggesting that the PTEN protein expression was positively related with the PD-L1 TPS score. However, the distribution of PTEN among the EBV and MSI subgroups was almost the same (Table 4). As shown in Figure 4A, PTEN and PD-L1 were expressed synchronously in gastric tumors, and the same expression trends were also detected using Western blotting (Figure 4B).
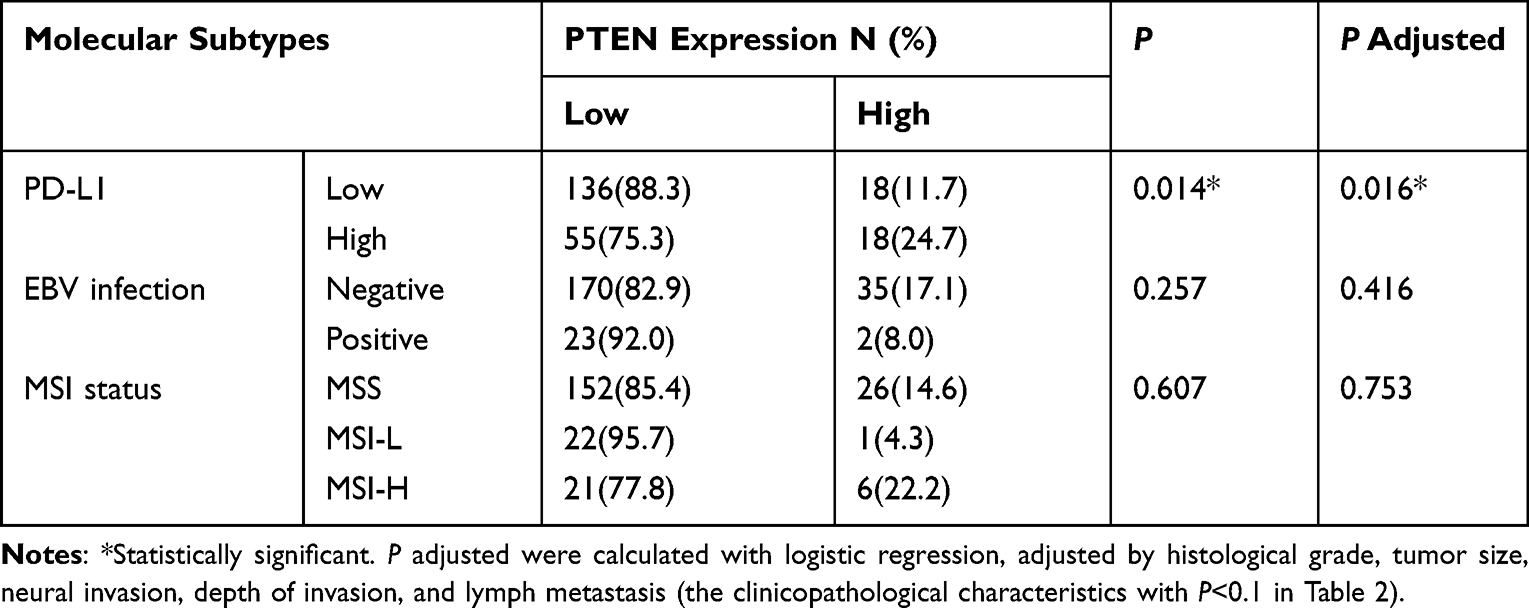 |
Table 4 The Protein Expression of PTEN in Different Molecular Subtypes of GC |
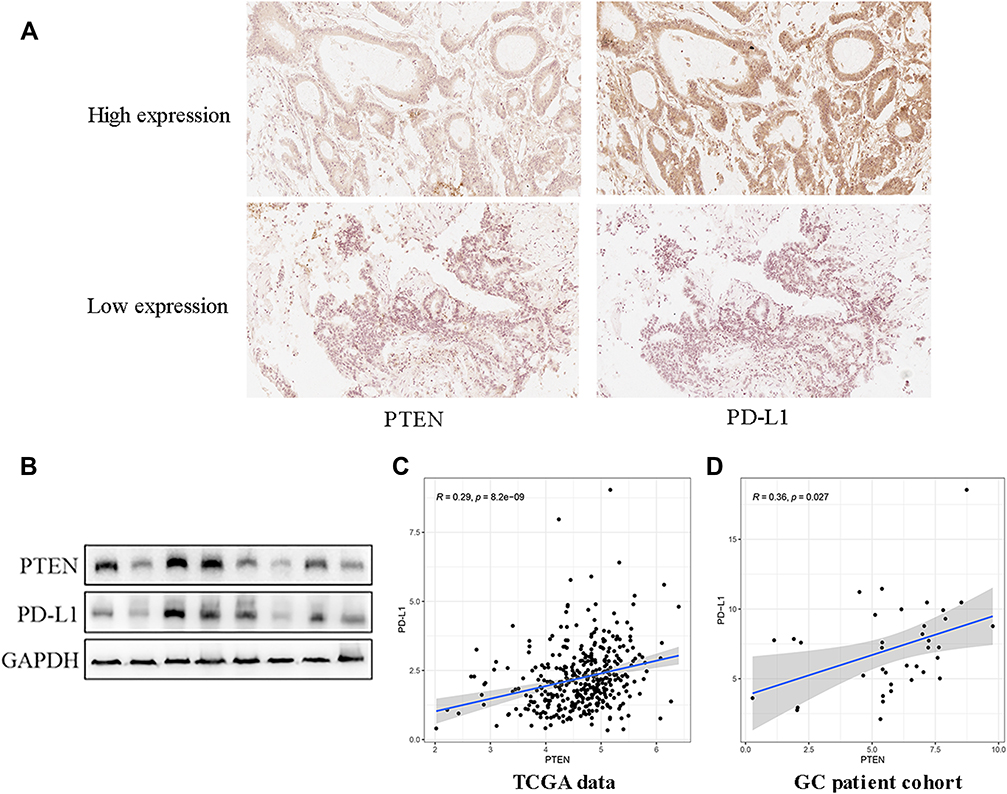 |
Figure 4 Expression of PTEN in gastric tumors with PD-L1 low and high scores independently. (A) Protein expression using IHC staining. (B) Protein expression using Western blot. The positive relation between PTEN and PD-L1 expression using TCGA data (C) and our GC patient cohort (D). Brown color indicates positive expression of PTEN or PD-L1 antibody independently. |
Furthermore, the molecular subtypes, microsatellite instability (MSI) and EBV infection were analyzed based on the cBioPortal database. The data showed that PTEN was expressed differently among MSI statuses (Table 5). And PD-L1 and PTEN were expressed with positive correlation both in TCGA data (R=0.29, P<0.05, Figure 4C) and in our GC patient cohort (R=0.36, P=0.027, Figure 4D).
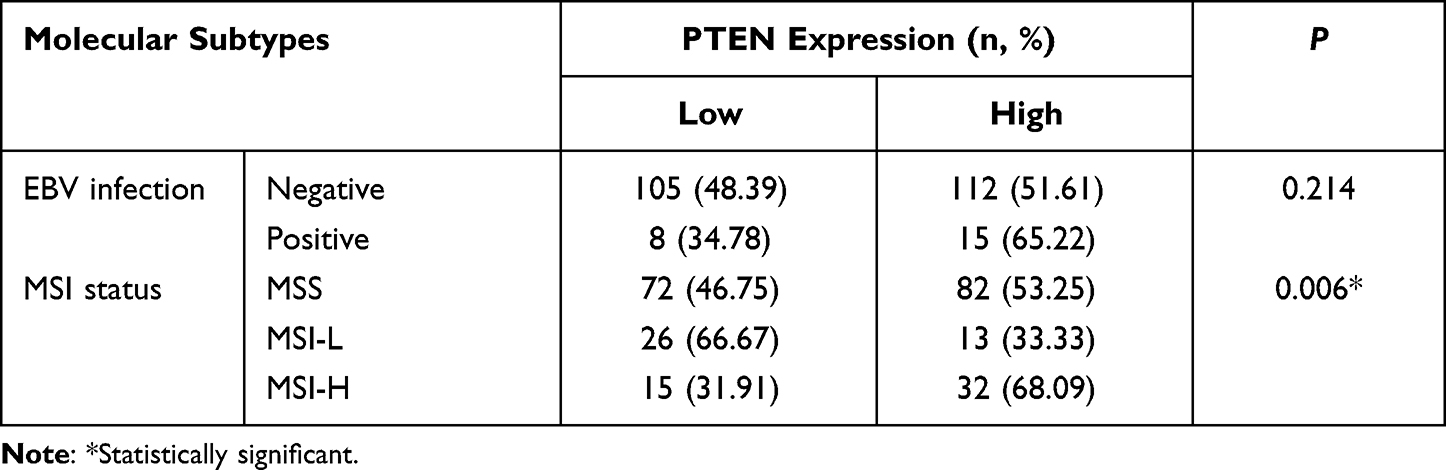 |
Table 5 mRNA Expression of PTEN in Different Molecular Subtypes of GC from TCGA |
Discussion
In the present study, we first analyzed PTEN expression in a GC cohort based on pathological subtypes. We identified the loss of PTEN protein expression in 57.9% of tumor and 7.1% of the adjacent nontumor cases, which was similar to other studies reporting that PTEN protein expression was significantly higher in adjacent tissues than in cancer tissues (45.1% vs 10.6%).17 Other studies pointed out that PTEN protein expression was decreased gradually from normal mucosa (100%), intestinal metaplasia (98.5%), dysplasia (66.7%) to carcinoma of the stomach (47.8%), suggesting that PTEN might participate in the malignant transition of gastric epithelial cells.6
As a tumor suppressor, PTEN participated in cellular differentiation, adhesion and mobility.18 PTEN inactivated Src/Stat3 function and enhanced the anti-invasive potential of cancer cells.19 PTEN inactivation induced the missing of apical-basal polarity and promoted cellular dissemination.20 PTEN decreased cell adhesion through dephosphorylation of FAKs.21 PTEN inhibited tumorigenicity and metastasis through regulating multiple proteins, such as MMPs, IGFs and VEGFs.22 As such, several clinical trials targeting distinct nodes of the PTEN pathway are currently in progress for multiple cancers.23 PTEN protein expression was lower in GCs with than without neural invasion, with or without lymph metastasis in this study, indicating that PTEN levels indicated the clinicopathological stage of GC and provided novel drug combination strategies for GC patients.
In addition to pathological subtypes, TCGA and ACRG classified GC into distinct subtypes based on different molecular characteristics to screen new therapeutic targets in distinct patient subgroups.8,9 According to Schlosser’s research, the positive rate of PD-L1 was higher in MSI-H GC than in MSS GC.24 PTEN mutation was prevalently present in MSI-H GCs (≥10 mt/MB). And PTEN mutation was almost the same between PD-L1+ and PD-L1− tumors.25 However, our study showed that PTEN protein expression was correlated positively with a PD-L1 score but not with MSI or EBV status in GC, which is similar to other studies reporting a significant association between PTEN and PD-L1 expression.26 Although PTEN mutation is a crucial inducer of protein loss, other mechanisms, including promoter hypermethylation, miRNAs, protein–protein interaction, posttranslational mechanisms, also cause PTEN inactivation in GC.18 Distinct models of PTEN loss are not always equivalently correlated with clinical pathologies.
As PD-L1 is an immune checkpoint biomarker for immunotherapy, PD-L1 inhibitors exhibited significant antitumor activity in advanced GC patients.27 PTEN protein expression was positively correlated with the PD-L1 score in our study, suggesting the potential of PTEN to supervise the response to anti-PD-1/PD-L1 antibodies. PTEN inactivation promoted the secretion of immunosuppressive cytokines, reduced T cell infiltration at tumor sites, and inhibited T cell expansion. Importantly, anti-PD-1, pembrolizumab and nivolumab, had better clinical efficacy in patients with PTEN-positive tumors than those with PTEN-negative tumors.28 In addition, clinical trials of anti-PD-1/PD-L1 also showed that patients with PTEN alteration had lower ORR, shorter PFS and shorter OS25 in metastatic triple-negative breast cancer, indicating that wild-type PTEN might be sensitive to immunotherapies.
Although immunotherapy is a promising treatment for multiple malignancies, the majority of patients did not respond to the approach. To date, only dMMR (mismatch repair deficiency) and PD-L1 expression have been utilized to estimate the effects of immunotherapy.29,30 Patients with high expression of PD-L1 always got better results to anti-PD-1/PD-L1 immunotherapy, and new biomarkers to estimate the benefit and toxicity of immunotherapy are urgently needed.
In colorectal cancer cells, PTEN silencing increased PD-L1 protein expression while had no effects on PD-L1 mRNA, indicating that PTEN loss might influence PD-L1 protein stabilization.31 In melanoma cancer cells, PD-L1 expression does not correlate with PTEN loss.28 Moreover, PTEN-positive tumors can increase PD-L1 protein levels both in IFN-γ-dependent and IFN-γ-independent patterns, consequently evading immune surveillance.32 Above all, the relation between PTEN and PD-L1 was conflicted, suggesting that further study of PD-L1 expression in a PTEN loss context is required.
Conclusion
Conclusively, both mRNA and protein PTEN expression was associated with gastric carcinogenesis, progression and PD-L1 TPS score and may serve as a supervisor to predict the benefit and toxicity to immunotherapy in patients with GC.
Funding
This work was supported by National Natural Science Foundation of China, Grant/Award number: 82002932; Health Commission of Jilin Province, Grant/Award number: 2021JC002; Scientific and Technological Development program of Jilin Province, Grant/Award number: 20200201326JC, 20210101333JC; Jilin Province Department of Finance, Grant/Award number: JLSWSRCZX2021-073; Fundamental Research Funds for the Central Universities, Grant/Award number: 2020-JCXK-32.
Disclosure
The authors report no conflicts of interest in this work.
References
1. Sung H, Ferlay J, Siegel RL, et al. Global cancer statistics 2020: GLOBOCAN estimates of incidence and mortality worldwide for 36 cancers in 185 countries. CA Cancer J Clin. 2021;71:209–249. doi:10.3322/caac.21660
2. Weinberg RA. The molecular basis of oncogenes and tumor suppressor genes. Ann N Y Acad Sci. 1995;758:331–338. doi:10.1111/j.1749-6632.1995.tb24838.x
3. Alvarez-Nunez F, Bussaglia E, Mauricio D, et al. PTEN promoter methylation in sporadic thyroid carcinomas. Thyroid. 2006;16:17–23. doi:10.1089/thy.2006.16.17
4. Ciuffreda L, Di Sanza C, Cesta Incani U, et al. The mitogen-activated protein kinase (MAPK) cascade controls phosphatase and tensin homolog (PTEN) expression through multiple mechanisms. J Mol Med (Berl). 2012;90:667–679. doi:10.1007/s00109-011-0844-1
5. Waite KA, Eng C. Protean PTEN: form and function. Am J Hum Genet. 2002;70:829–844. doi:10.1086/340026
6. Yang L, Kuang LG, Zheng HC, et al. PTEN encoding product: a marker for tumorigenesis and progression of gastric carcinoma. World J Gastroenterol. 2003;9:35–39. doi:10.3748/wjg.v9.i1.35
7. Galon J, Mlecnik B, Bindea G, et al. Towards the introduction of the “Immunoscore” in the classification of malignant tumours. J Pathol. 2014;232:199–209. doi:10.1002/path.4287
8. Cancer Genome Atlas Research N. Comprehensive molecular characterization of gastric adenocarcinoma. Nature. 2014;513:202–209. doi:10.1038/nature13480
9. Sunakawa Y, Lenz HJ. Molecular classification of gastric adenocarcinoma: translating new insights from the cancer genome atlas research network. Curr Treat Options Oncol. 2015;16:17. doi:10.1007/s11864-015-0331-y
10. Kim ST, Cristescu R, Bass AJ, et al. Comprehensive molecular characterization of clinical responses to PD-1 inhibition in metastatic gastric cancer. Nat Med. 2018;24:1449–1458. doi:10.1038/s41591-018-0101-z
11. ClinicalTrials.gov. Avelumab in FirstLine Maintenance Gastric Cancer (JAVELIN Gastric 100). Available from: http://clinicaltrials.gov/show/NCT02625610.
12. Janjigian YY, Shitara K, Moehler M, et al. First-line nivolumab plus chemotherapy versus chemotherapy alone for advanced gastric, gastro-oesophageal junction, and oesophageal adenocarcinoma (CheckMate 649): a randomised, open-label, Phase 3 trial. Lancet. 2021;398:27–40. doi:10.1016/S0140-6736(21)00797-2
13. Marabelle A, Le DT, Ascierto PA, et al. Efficacy of pembrolizumab in patients with noncolorectal high microsatellite instability/mismatch repair-deficient cancer: results from the Phase II KEYNOTE-158 Study. J Clin Oncol. 2020;38(1):1–10. doi:10.1200/JCO.19.02105
14. Cao D, Jia Z, Wu Y, et al. Demethylation of the RB1 promoter concomitant with reactivation of TET2 and TET3 impairs gastric carcinogenesis in K19-Wnt1/C2mE transgenic mice. Life Sci. 2020;263:118580. doi:10.1016/j.lfs.2020.118580
15. Cao XY, Ma HX, Shang YH, et al. DNA methyltransferase3a expression is an independent poor prognostic indicator in gastric cancer. World J Gastroenterol. 2014;20:8201–8208. doi:10.3748/wjg.v20.i25.8201
16. Yang N, Wu Y, Jin M, et al. Microsatellite instability and Epstein-Barr virus combined with PD-L1 could serve as a potential strategy for predicting the prognosis and efficacy of postoperative chemotherapy in gastric cancer. PeerJ. 2021;9:e11481. doi:10.7717/peerj.11481
17. Zheng HCCY, Kuang LG, Yang L, et al. Expression of PTEN-encoding product in different stages of carcinogenesis and progression of gastric Carcinoma. ZhonghuaZhongliu Zazhi. 2003;25:13–6.
18. Xu WT, Yang Z, Lu NH. Roles of PTEN (Phosphatase and Tensin Homolog) in gastric cancer development and progression. Asian Pac J Cancer Prev. 2014;15:17–24. doi:10.7314/APJCP.2014.15.1.17
19. Mukhopadhyay UK, Mooney P, Jia L, Eves R, Raptis L, Mak AS. Doubles game: src-Stat3 versus p53-PTEN in cellular migration and invasion. Mol Cell Biol. 2010;30:4980–4995. doi:10.1128/MCB.00004-10
20. Cavazzoni A, La Monica S, Alfieri R, et al. Enhanced efficacy of AKT and FAK kinase combined inhibition in squamous cell lung carcinomas with stable reduction in PTEN. Oncotarget. 2017;8:53068–53083. doi:10.18632/oncotarget.18087
21. Maehama T, Taylor GS, Dixon JE. PTEN and myotubularin: novel phosphoinositide phosphatases. Annu Rev Biochem. 2001;70:247–279. doi:10.1146/annurev.biochem.70.1.247
22. Hwang PH, Yi HK, Kim DS, Nam SY, Kim JS, Lee DY. Suppression of tumorigenicity and metastasis in B16F10 cells by PTEN/MMAC1/TEP1 gene. Cancer Lett. 2001;172:83–91. doi:10.1016/s0304-3835(01)00632-2
23. Dillon LM, Miller TW. Therapeutic targeting of cancers with loss of PTEN function. Curr Drug Targets. 2014;15:65–79. doi:10.2174/1389450114666140106100909
24. Schlosser HA, Drebber U, Kloth M, et al. Immune checkpoints programmed death 1 ligand 1 and cytotoxic T lymphocyte associated molecule 4 in gastric adenocarcinoma. Oncoimmunology. 2016;5:e1100789. doi:10.1080/2162402X.2015.1100789
25. Barroso-Sousa R, Keenan TE, Pernas S, et al. Tumor mutational burden and PTEN alterations as molecular correlates of response to PD-1/L1 blockade in metastatic triple-negative breast cancer. Clin Cancer Res. 2020;26:2565–2572. doi:10.1158/1078-0432.CCR-19-3507
26. Hlaing AM, Furusato B, Udo E, et al. Expression of phosphatase and tensin homolog and programmed cell death ligand 1 in adenosquamous carcinoma of the lung. Biochem Biophys Res Commun. 2018;503:2764–2769. doi:10.1016/j.bbrc.2018.08.037
27. Wang BC, Zhang ZJ, Fu C, Wang C. Efficacy and safety of anti-PD-1/PD-L1 agents vs chemotherapy in patients with gastric or gastroesophageal junction cancer: a systematic review and meta-analysis. Medicine. 2019;98:e18054. doi:10.1097/MD.0000000000018054
28. Peng W, Chen JQ, Liu C, et al. Loss of PTEN promotes resistance to T cell-mediated immunotherapy. Cancer Discov. 2016;6:202–216. doi:10.1158/2159-8290.CD-15-0283
29. Le DT, Durham JN, Smith KN, et al. Mismatch repair deficiency predicts response of solid tumors to PD-1 blockade. Science. 2017;357:409–413. doi:10.1126/science.aan6733
30. Reck M, Rodriguez-Abreu D, Robinson AG, et al. Pembrolizumab versus chemotherapy for PD-L1-positive non-small-cell lung cancer. N Engl J Med. 2016;375:1823–1833. doi:10.1056/NEJMoa1606774
31. Song M, Chen D, Lu B, et al. PTEN loss increases PD-L1 protein expression and affects the correlation between PD-L1 expression and clinical parameters in colorectal cancer. PLoS One. 2013;8:e65821. doi:10.1371/journal.pone.0065821
32. Lastwika KJ, Wilson W 3rd, Li QK, et al. Control of PD-L1 expression by oncogenic activation of the AKT-mTOR pathway in non-small cell lung cancer. Cancer Res. 2016;76:227–238. doi:10.1158/0008-5472.CAN-14-3362
 © 2022 The Author(s). This work is published and licensed by Dove Medical Press Limited. The
full terms of this license are available at https://www.dovepress.com/terms
and incorporate the Creative Commons Attribution
- Non Commercial (unported, 3.0) License.
By accessing the work you hereby accept the Terms. Non-commercial uses of the work are permitted
without any further permission from Dove Medical Press Limited, provided the work is properly
attributed. For permission for commercial use of this work, please see paragraphs 4.2 and 5 of our Terms.
© 2022 The Author(s). This work is published and licensed by Dove Medical Press Limited. The
full terms of this license are available at https://www.dovepress.com/terms
and incorporate the Creative Commons Attribution
- Non Commercial (unported, 3.0) License.
By accessing the work you hereby accept the Terms. Non-commercial uses of the work are permitted
without any further permission from Dove Medical Press Limited, provided the work is properly
attributed. For permission for commercial use of this work, please see paragraphs 4.2 and 5 of our Terms.