Back to Journals » Journal of Multidisciplinary Healthcare » Volume 19
Psychometric Properties of the Turkish Medical Maximizer-Minimizer Scale
Authors Celik Y, Aydemir E ![]() , Güvey ME
, Güvey ME ![]() , Kucukkurt AC, Cimen M
, Kucukkurt AC, Cimen M ![]() , Yılmaz S
, Yılmaz S ![]()
Received 15 November 2025
Accepted for publication 3 March 2026
Published 25 March 2026 Volume 2026:19 581802
DOI https://doi.org/10.2147/JMDH.S581802
Checked for plagiarism Yes
Review by Single anonymous peer review
Peer reviewer comments 3
Editor who approved publication: Dr Judith Johnson
Yusuf Celik,1,2 Ecenur Aydemir,2 Muhammed Emre Güvey,2 Ahmet Can Kucukkurt,1,2 Mesut Cimen,1,2 Salim Yılmaz1,2
1Department of Health Management, Graduate School of Health Sciences, Acibadem Mehmet Ali Aydınlar University, Istanbul, Türkiye; 2Department of Health Management, Faculty of Health Sciences, Acibadem Mehmet Ali Aydınlar University, Istanbul, Türkiye
Correspondence: Salim Yılmaz, Department of Health Management, Faculty of Health Sciences, Acibadem Mehmet Ali Aydinlar University, Kerem Aydinlar Campus, Kayisdagi Cad. No: 32, Atasehir, Istanbul, Türkiye, Tel +90 216 500 41 41, Email [email protected]
Purpose: This study aimed to adapt the Medical Maximizer-Minimizer Scale (MMS) into Turkish and evaluate its psychometric properties, including factorial structure, reliability, measurement invariance, and construct validity in the Turkish healthcare context.
Patients and Methods: A total of 511 Turkish adults completed the Turkish MMS alongside measures of healthcare trust, utilization patterns, and health-related quality of life. The sample was divided into exploratory (n = 256) and confirmatory (n = 255) subsamples using propensity score matching. Classical item analysis, exploratory graph analysis (EGA), exploratory factor analysis (EFA), and confirmatory factor analysis (CFA) were conducted to examine dimensional structure. Five competing structural models were compared, followed by measurement invariance testing across demographic groups. Convergent and discriminant validity were evaluated through correlations with related constructs.
Results: Item analysis and EGA revealed that Item 5 demonstrated poor psychometric properties and was excluded, yielding a nine-item scale. EGA identified a stable two-dimensional structure with high bootstrap stability coefficients (0.946– 1.000). The nine-item scale demonstrated good internal consistency (α =0.78, 95% CI [0.74,0.82]). Among five competing models, the bifactor model provided superior fit (CFI =0.997, TLI =0.993, RMSEA =0.021, SRMR =0.025), identifying a general maximizing-minimizing factor alongside two specific dimensions: Generalist View (philosophical orientations toward medical intervention) and Individualist View (concrete healthcare-seeking preferences). Scalar measurement invariance was supported across gender, age, marital status, parental status, and social security status. The scale showed theoretically consistent correlations with healthcare trust (r =0.15– 0.25) and utilization intentions (r =0.09– 0.29), but minimal associations with health-related quality of life, confirming discriminant validity.
Conclusion: The nine-item Turkish MMS demonstrates robust psychometric properties with a bifactor structure capturing both general and dimension-specific healthcare orientations. The validated instrument provides a reliable tool for assessing maximizing-minimizing tendencies in Turkish populations and offers a foundation for future research on healthcare utilization and patient-centered communication.
Keywords: medical maximizer-minimizer scale, psychometric validation, bifactor model, measurement invariance, healthcare utilization, Turkish adaptation
Introduction
Across the globe, healthcare expenditures continue to outpace economic growth, driven by aging populations and advances in medical technology.1–5 However, this expansion has come with growing scrutiny over whether the care being provided is truly efficient, necessary, and outcome-oriented.6 The inappropriate use of healthcare services, in the form of both overutilization and underutilization, is among the primary issues threatening the sustainability and efficiency of global health systems.7,8 This situation has led to the emergence of concepts such as value-based healthcare delivery,9 which prioritizes patient outcomes and cost-effectiveness over service volume.10
Overutilization creates financial burdens, side-effect risks, and overdiagnosis for patients, while causing resource waste and compromised safety for providers.11,12 Defensive medicine further perpetuates this cycle. The scale is substantial: approximately $4.4 billion is spent annually on low-value Medicare services in the United States,13 while China’s healthcare expenditures tripled between 2013–2023, with per capita spending growth (17.61% annually) far exceeding income growth (11.42%), partly due to imaging and antibiotic overuse.14
Conversely, underutilization leads to disease complications, increased morbidity and mortality risks, and reduced quality of life for patients, whereas for providers, it causes decreased treatment effectiveness and deterioration in health outcomes.15 While these patterns reflect systemic inefficiencies, they are also driven by individual-level factors including health beliefs, risk perceptions, and healthcare-seeking behaviors that shape how patients engage with medical services.16,17 Understanding these determinants can inform clinical decisions and health policy, as structural reforms alone cannot address the behavioral roots of inappropriate utilization.
Individuals differ markedly in healthcare utilization: some seek care even for minor concerns, while others avoid services until absolutely necessary.18 Understanding these behavioral tendencies requires frameworks that account for individual differences in healthcare seeking. For example, risk preferences are particularly relevant: individuals inclined toward risk-taking are more likely to underuse preventive health services, whereas those who are risk-averse may demand excessive care, even when unnecessary.19 Similarly, individuals with heightened fear of illness or health anxiety may pursue low-value diagnostic procedures, while those concerned about treatment risks may reject medically necessary interventions.20,21 Thus, psychological attitudes and beliefs play a critical role in shaping healthcare demand, and understanding these behavioral tendencies is essential for designing appropriate interventions.
Groopman and Hartzband,22 drawing on clinical observations, suggested that some patients tend to be “medical maximizers” those who prefer active and aggressive treatments whereas others are “medical minimizers”, favoring as little intervention as possible. The Medical Maximizer–Minimizer theory provides a conceptual framework for understanding individual differences in the inclination to seek healthcare. According to this theory, medical maximizers are predisposed to pursue frequent medical interventions, such as doctor visits, tests, and medications, whereas medical minimizers tend to avoid medical care unless absolutely necessary. The Medical Maximizer–Minimizer Scale (MMS), developed by Scherer et al,18 reliably assesses where individuals fall on this continuum. Research has demonstrated that individuals scoring high on the MMS (maximizers) are more likely to request unnecessary or low-benefit interventions, whereas those scoring low (minimizers) are more likely to decline evidence-based, high-benefit treatments. These findings suggest that the maximizer–minimizer tendency is a unique behavioral determinant, distinct from other psychological constructs such as hypochondriasis or medical mistrust. Theoretically, this approach offers a valuable lens through which both overuse and underuse of healthcare services can be better understood.
Addressing overuse and underuse requires both system-level strategies (clinical guidelines, reimbursement incentives) and patient-level interventions (education, shared decision-making, decision support tools).23 The Medical Maximizer-Minimizer framework is relevant here: research suggests that tailoring interventions to individuals’ maximizer or minimizer tendencies can reduce low-value care while promoting beneficial services.24 Incorporating behavioral orientations into clinical practice may thus improve both efficiency and effectiveness.
In the Turkish context, both structural and cultural factors play a decisive role in shaping healthcare utilization. The Health Transformation Program, launched in 2003, substantially expanded insurance coverage and service accessibility, resulting in a sharp increase in healthcare use. For instance, the annual number of physician visits per capita rose from approximately 3 in 2002 to 9.8 in 2019, surpassing the OECD average.25 While this expansion has improved population health indicators, it has also fostered patterns of overuse—most notably the inappropriate use of antibiotics—driven by cultural expectations, such as the belief that medication is necessary for any illness, and by systemic factors, including the historical ease of obtaining antibiotics without a prescription.26 Conversely, underuse of preventive services remains a challenge, particularly in rural and socioeconomically disadvantaged areas.24 More broadly, high family involvement, collectivist values, and strong trust in healthcare professionals further shape attitudes toward medical care.27,28 These factors highlight the importance of understanding cultural influences on healthcare use in Türkiye.
Several instruments assess healthcare-related attitudes and behaviors,29–31 but these instruments primarily assess situational responses to illness rather than stable dispositional preferences regarding the intensity of medical intervention. The Medical Maximizer–Minimizer Scale (MMS) differs by measuring general preferences for more versus less intervention, independent of specific symptoms or healthcare access, thereby addressing both overutilization and underutilization within a single framework. Although the MMS has demonstrated predictive validity across cultural contexts,18,24,32,33 no Turkish version exists. The present study aimed to adapt and validate the MMS in Turkish, evaluating its dimensional structure through empirical model comparison rather than imposing the original factor structure. This validation examined maximizer--minimizer tendencies in relation to healthcare trust, quality of life, actual utilization, and hypothetical treatment scenarios.
Materials and Methods
Study Design
This cross-sectional study examined the psychometric properties of the Turkish adaptation of the Medical Maximizer-Minimizer Scale and investigated its associations with healthcare utilization patterns, trust in healthcare systems, and health-related quality of life. Data were collected between March 2024 and August 2024 through a printed and online questionnaire distributed via snowball sampling method. Participants accessed the survey through a secure online platform after providing informed consent. Figure 1 presents the study design and analytical framework, illustrating the sequential phases of translation and cultural adaptation, data collection, exploratory and confirmatory analyses, and validity testing.
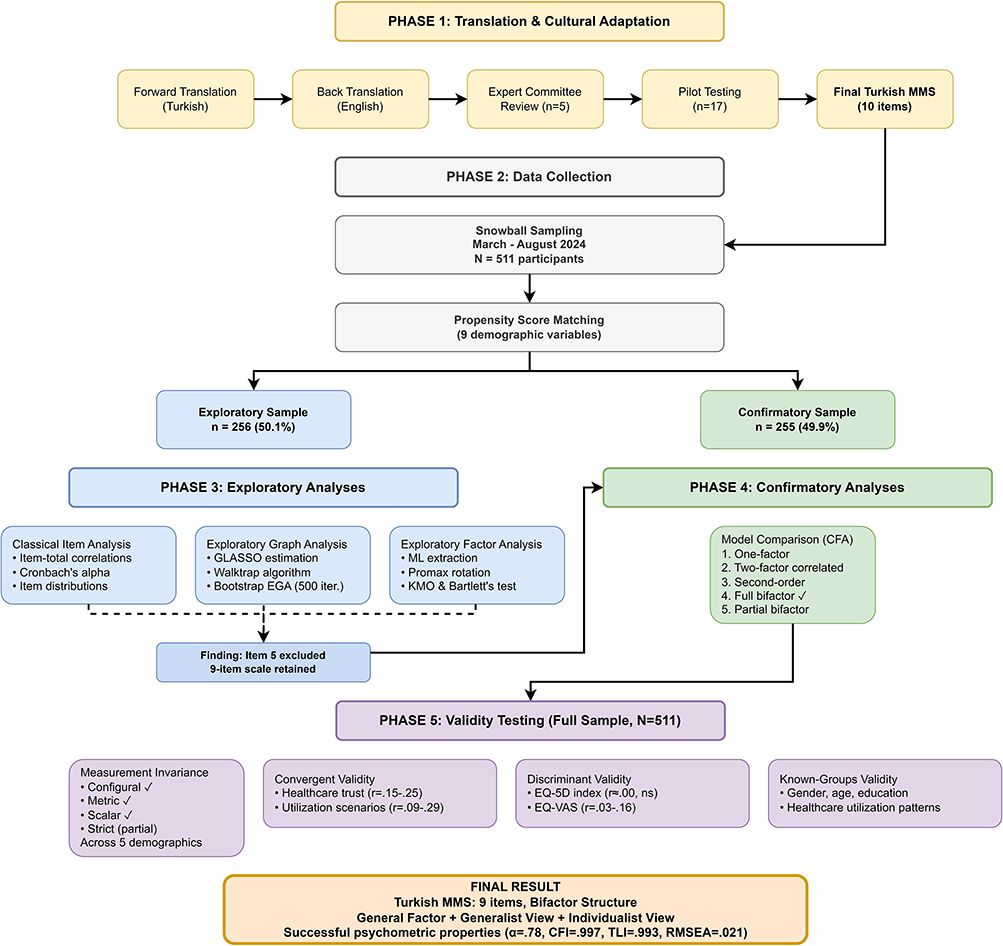 |
Figure 1 Study design and analytical framework for the Turkish adaptation of the Medical Maximizer-Minimizer Scale. The study proceeded through five phases: (i) translation and cultural adaptation following established guidelines, (ii) data collection via snowball sampling (N = 511), (iii) exploratory analyses on a propensity score matched subsample (n = 256) including classical item analysis, Exploratory Graph Analysis, and Exploratory Factor Analysis, (iv) confirmatory analyses on the remaining subsample (n = 255) including comparison of five competing CFA models, and (v) validity testing on the full sample including measurement invariance testing across five demographic groups, convergent validity with healthcare trust and utilization scenarios, discriminant validity with health-related quality of life measures, and known-groups validity across demographic and healthcare utilization patterns. Item 5 was excluded based on converging evidence from the exploratory phase, resulting in a final nine-item bifactor structure. |
Participants
The study sample comprised Turkish-speaking adults aged 18 years and older who voluntarily agreed to participate. Snowball sampling was employed as the primary recruitment strategy whereby initial participants were identified through the researchers’ professional and personal networks and subsequently invited to share the survey link with their own contacts. Eligibility criteria included being at least 18 years of age, residing in Türkiye, having sufficient Turkish language proficiency to complete the questionnaire, and providing informed consent. No minimum level of prior healthcare utilization was required for inclusion, as both healthcare users and non-users were necessary to examine known-groups validity across utilization patterns. Participants with incomplete survey responses were excluded from the final analysis to ensure data quality for psychometric evaluation. The initial response yielded 511 completed questionnaires. No incentives or compensation were provided for participation.
Translation and Cultural Adaptation
The original English version of the Medical Maximizer-Minimizer Scale (MMS) was translated into Turkish following established guidelines for the cross-cultural adaptation of self-report measures.34,35 Written permission for translation and validation was obtained from the original scale developer, Dr. Laura D. Scherer, on 9 January 2024.
Forward Translation
The initial forward translation from English to Turkish was conducted by bilingual health management experts whose native language was Turkish. The translators were instructed to prioritize conceptual equivalence over literal translation while maintaining the semantic content and intent of each item. The translators had expertise in healthcare terminology and research methodology and were fluent in both English and Turkish.
Back-Translation
Following the forward translation, the Turkish version was independently back-translated into English by a bilingual translator who was a native English speaker with professional proficiency in Turkish and no prior exposure to the original MMS items. The back-translator held a graduate degree in linguistics and had experience in academic translation. This independent back-translation enabled assessment of whether the Turkish items accurately captured the meaning and intent of the original English version. Discrepancies between the original and back-translated versions were identified and resolved through discussion between the forward translators and the expert committee.
Expert Committee Review
A multidisciplinary expert committee comprising five members—three health management researchers, two nursing researchers—reviewed the translated items to achieve semantic, idiomatic, experiential, and conceptual equivalence. Each item was systematically evaluated using a standardized expert review form and rated on a 4-point scale (1 = not appropriate, 2 = requires major revision, 3 = appropriate but requires minor revision, 4 = highly appropriate) across three dimensions: clarity, cultural appropriateness, and relevance to the Turkish healthcare context. Items receiving mean ratings below 3.5 on any dimension were revised based on expert recommendations through iterative discussion until consensus was achieved. The committee also adapted specific terminology to reflect the Turkish healthcare system (eg, “primary care physician” was translated as “aile hekimi” [family physician], consistent with Türkiye’s family medicine system). All modifications were documented to maintain an audit trail of the adaptation process.
Pilot Testing
The preliminary Turkish version of the MMS was pilot tested with 17 university students to evaluate item comprehension, wording clarity, and cultural interpretability. The pilot sample consisted of 9 female and 8 male participants, aged between 18 and 25 years, all of whom were enrolled in undergraduate programs. Participants were drawn from health-related and social science fields, including health management and nursing, ensuring familiarity with healthcare concepts while still reflecting lay perspectives rather than professional expertise. University students were purposively selected for pilot testing because they represent a substantial segment of the study’s target population and possess the literacy and cognitive skills necessary to provide precise feedback on item wording, ambiguity, and conceptual clarity. This approach is commonly adopted in scale adaptation studies to identify linguistic or cultural issues prior to large-scale administration. Participants completed the scale and provided qualitative feedback on item clarity, relevance, and ease of understanding. Based on this feedback, minor wording refinements were implemented to improve readability while preserving the original conceptual meaning of each item.
Final Turkish Version
The Turkish MMS retained the original 10-item structure and 7-point Likert response format (1 = kesinlikle katılmıyorum [strongly disagree] to 7 = kesinlikle katılıyorum [strongly agree]). All items were successfully adapted to the Turkish linguistic and cultural context while maintaining conceptual fidelity to the original instrument. The final Turkish version is presented in Supplementary Table 5.
Instruments
The survey instrument was designed to assess the construct validity of the Turkish MMS through theoretically grounded associations with related and unrelated constructs. The Medical Maximizer-Minimizer Scale constituted the primary measure under validation. Trust in healthcare items were included to assess convergent validity, based on the theoretical expectation that individuals with stronger maximizing orientations would report greater trust in healthcare institutions, as trust facilitates engagement with medical services. Healthcare utilization items enabled examination of known-groups validity by comparing MMS scores across individuals with different patterns of actual healthcare consumption, testing the hypothesis that maximizers would demonstrate higher utilization rates. Healthcare utilization scenarios, adapted from the original MMS validation studies, provided an additional measure of convergent validity by assessing behavioral intentions in specific clinical decision-making contexts. Health-related quality of life measures were included to establish discriminant validity, as maximizing-minimizing preferences reflect dispositional orientations toward healthcare rather than current health status, and thus minimal associations were hypothesized. Demographic and socioeconomic characteristics enabled examination of measurement invariance across population subgroups and facilitated propensity score matching for creating balanced exploratory and confirmatory subsamples.
Validity measures were selected based on two factors: alignment with the convergent validity framework established in the original MMS validation study by Scherer et al, and the use of culturally appropriate indicators relevant to the Turkish healthcare context. As no directly comparable validated scales for healthcare trust and utilization behaviors exist in the Turkish psychometric literature, items were adapted from standardized survey modules developed by the Turkish Statistical Institute (TURKSTAT), an official statistical institution of the Republic of Türkiye. These items were selected for their established use in national health surveys and their conceptual relevance to the maximizing-minimizing construct. Consistent with the original MMS validation approach, as they represent single-item indicators of distinct healthcare-related attitudes and behaviors rather than reflective measures of a unified latent construct.
The instruments employed different response formats appropriate to each construct type and consistent with their original validated versions. Attitudinal scales assessing subjective orientations (MMS, trust items) used Likert formats that capture gradations in agreement, with the MMS retaining its original 7-point format to ensure comparability with prior validation studies. Behavioral items assessing discrete healthcare events (healthcare utilization) used binary (yes/no) responses, as these items measured objective occurrences rather than degrees of opinion. Intention measures (clinical scenarios) employed 0–100 visual analog scales to capture fine-grained continuous variation in likelihood judgments, consistent with the original MMS validation methodology. The EQ-5D-5L retained its standardized five-level response format as required for computing validated health utility indices and enabling comparison with population norms.
Medical Maximizer-Minimizer Scale (MMS)
The MMS, originally developed by Scherer et al (2016), is a 10-item self-report measure assessing individuals’ dispositional preferences for aggressive versus passive approaches to healthcare utilization.18 Participants rate their agreement with each statement on a 7-point Likert scale ranging from 1 (strongly disagree) to 7 (strongly agree). Higher scores indicate stronger maximizing orientations (preference for proactive medical intervention), while lower scores reflect minimizing tendencies (preference for watchful waiting and avoiding unnecessary medical intervention). The original validation study identified a bifactor structure, with all items loading on a general maximizing-minimizing factor and a subset of items additionally loading on specific subfactors reflecting nuanced aspects of healthcare preferences. The scale demonstrated good internal consistency (Cronbach’s α =0.87) and test-retest reliability (ICC =0.89) in the original English-language validation.
Trust in Healthcare Items
Seven items adapted from the Life Satisfaction Survey conducted by the Turkish Statistical Institute, an official statistical institution of the Republic of Türkiye, assessed participants’ trust in various components of the Turkish healthcare system, including family physicians, public hospitals, private hospitals, private clinics, healthcare personnel in general, the Turkish healthcare system as a whole, and healthcare services broadly.36 Participants rated each item on a 5-point Likert scale ranging from 1 (strongly disagree) to 5 (strongly agree), with higher scores indicating greater trust. As these items represent single-item indicators of institutional trust rather than a validated psychometric scale, they were analyzed individually using Spearman correlations appropriate for ordinal data.
Healthcare Utilization Items
Ten binary (yes/no) items adapted from the Türkiye Health Survey conducted by the Turkish Statistical Institute, an official statistical institution of the Republic of Türkiye, assessed participants’ actual healthcare service use.37 These standardized survey items captured diverse utilization behaviors including chronic health conditions (self and child), work absenteeism due to health problems, hospital admissions, day hospital treatments, dental visits, primary care visits, prescription medication use, out-of-pocket healthcare expenditures, and perceived financial burden from healthcare costs. As these items represent a standard survey module designed for descriptive epidemiological purposes rather than a psychometric scale, they were analyzed as separate categorical variables to examine associations between healthcare utilization patterns and maximizing-minimizing preferences.
Healthcare Utilization Scenarios
Ten hypothetical clinical scenarios were developed based on the original MMS validation studies18 and adapted to reflect the Turkish healthcare context. Scenarios depicted situations requiring healthcare decisions across a spectrum from high-value preventive services (eg, flu vaccination, cholesterol screening, developmental screening) to low-value or discretionary services (eg, full-body CT scan for asymptomatic individuals, medication for infant colic). For each scenario, participants indicated their likelihood of pursuing the described healthcare action on a visual analog scale from 0 (definitely no) to 100 (definitely yes). Participants entered their numeric response in a text box beneath the scale. These scenarios enabled assessment of how maximizing-minimizing orientations translate into specific healthcare decision-making contexts.
Health-Related Quality of Life
The EuroQol-5 Dimension-5 Level (EQ-5D-5L) instrument assessed participants’ health status across five dimensions: mobility, self-care, usual activities, pain/discomfort, and anxiety/depression. Each dimension includes five severity levels. Additionally, the EuroQol Visual Analog Scale (EQ-VAS) provided a global self-rated health assessment on a vertical scale from 0 (worst imaginable health) to 100 (best imaginable health).38
Demographic and Socioeconomic Characteristics
Nine items collected information on participants’ age, gender, marital status, parental status, education level, occupation, health insurance type, household income relative to expenses, and geographic residence (urban versus rural). These variables enabled examination of potential sociodemographic moderators of maximizing-minimizing preferences and facilitated propensity score matching for sample division.
Data Analysis
The analysis followed sequential psychometric procedures to assess the dimensional structure, reliability, and validity of the Turkish version of the MMS. Following data screening and descriptive analyses, the total sample was divided into exploratory and confirmatory subsamples using propensity score matching based on nine demographic variables (age, gender, marital status, parental status, education level, occupation, social security status, income level, and place of residence). This approach ensured demographic equivalence between the subsamples while preserving statistical independence for cross-validation purposes.
The exploratory subsample was used to assess dimensionality through three complementary approaches. Dimensionality assessment followed a sequential, complementary strategy. Exploratory Graph Analysis (EGA) was first employed as a data-driven network-based method to estimate the number of latent dimensions with minimal distributional assumptions. Exploratory Factor Analysis (EFA) was subsequently used to evaluate factor interpretability, loading patterns, and cross-loadings within a latent variable framework. Confirmatory Factor Analysis (CFA) was then applied to formally test and compare theoretically plausible measurement models identified in the exploratory phase, enabling cross-validation of the final structure.
To evaluate the stability of the dimensional structure and item assignments, Bootstrap EGA was performed with 500 replications. Third, EFA was carried out using maximum likelihood extraction with promax rotation to allow for correlated factors. The number of factors was determined based on converging evidence from parallel analysis, the Kaiser criterion (eigenvalues > 1), and interpretability. Factor loadings, communalities, and cross-loadings were examined to evaluate item performance.
The confirmatory subsample was used for model testing and validation. Five competing structural models were specified and compared using Confirmatory Factor Analysis: (i) a unidimensional model, (ii) a correlated two-factor model, (iii) a second-order hierarchical model, (iv) a full bifactor model with orthogonal factors, and (v) a partial bifactor model. These competing models were specified a priori based on the theoretical structure proposed in the original MMS validation study and prior applications of bifactor and multidimensional models in healthcare preference research. Model fit was evaluated using multiple complementary indices, including the chi-square to degrees of freedom ratio (χ2/df), the Comparative Fit Index (CFI), the Tucker–Lewis Index (TLI), the Root Mean Square Error of Approximation (RMSEA) with 90% confidence intervals, the Standardized Root Mean Square Residual (SRMR), the Goodness-of-Fit Index (GFI), the Adjusted Goodness-of-Fit Index (AGFI), the Normed Fit Index (NFI), the Incremental Fit Index (IFI), the Relative Fit Index (RFI), and the Parsimony Goodness-of-Fit Index (PGFI). Model comparisons were conducted using information criteria, including the Akaike Information Criterion (AIC), the Bayesian Information Criterion (BIC), the Consistent Akaike Information Criterion (CAIC), and the Expected Cross-Validation Index (ECVI). For the selected bifactor model, additional diagnostics were computed to assess the appropriateness of interpreting total and subscale scores, including Explained Common Variance (ECV), Percentage of Uncontaminated Correlations (PUC), omega hierarchical coefficients, construct replicability index (H), and factor determinacy.
Other aspects of construct validity were examined using the full sample. Measurement invariance across demographic groups (gender, age, marital status, parental status, and social security status) was tested using a sequential constraint approach. Age was dichotomized into young adults (18–24 years) and adults (25+ years) based on the UNESCO definition of youth,39 adjusted for the eligibility criterion of ≥18 years. The sequential approach included: configural invariance (same factor structure), metric invariance (equal factor loadings), scalar invariance (equal item intercepts), and strict invariance (equal residual variances). Invariance was evaluated following established guidelines using changes in CFI (≤ 0.010), RMSEA (≤ 0.015), and SRMR (≤ 0.010 for loadings and ≤ 0.015 for intercepts).40 Convergent validity was assessed via Spearman correlations between MMS scores and theoretically related constructs (trust in healthcare and utilization scenarios). Discriminant validity was evaluated through correlations with health-related quality of life measures, which were hypothesized to show minimal association with maximizer–minimizer preferences. Known-groups validity was examined by comparing MMS scores across demographic and healthcare utilization groups using Mann–Whitney U-tests and Kruskal–Wallis H-tests, given violations of normality assumptions. A 95% confidence level was adopted.
All analyses were conducted using R version 4.4.2 with the following packages: lavaan for CFA and measurement invariance, EGAnet for exploratory graph analysis, psych for EFA and reliability analyses, semTools for bifactor diagnostics, and MatchIt for propensity score matching.
Ethical Considerations
The study was conducted in accordance with the principles of the Declaration of Helsinki with ethical approval obtained from Acibadem University Medical Research Ethics Committee (decision number 2024–5/201, dated 28.03.2024). All participants provided informed consent electronically before accessing the survey. The informed consent document clearly explained the study purpose, procedures, voluntary nature of participation, right to withdraw at any time without penalty, confidentiality protections, and contact information for the research team. No personally identifiable information was collected, and all data were stored securely with access restricted to the research team. Participants were informed that their responses would be used only for research purposes and that aggregate findings might be published in academic journals and presented at scientific conferences. No financial compensation or incentives were provided for participation. The study posed minimal risk to participants, involving only completion of a self-administered questionnaire about healthcare attitudes and behaviors.
Results
The majority of participants (n=391; 76.5%) were university graduates and living in urban areas (n=438; 85.7%). Approximately three-quarters (n=390; 76.3%) of participants were female and a large proportion (n=419; 82.0%) were single. The mean age of participants was 25.89 years (SD = 10.82, Median = 22, Range: 18–83). The age distribution revealed a predominantly young sample: 18–24 years (n = 378, 73.97%), 25–34 years (n = 58, 11.35%), 35–49 years (n = 47, 9.20%), 50–64 years (n = 22, 4.31%), and 65+ years (n = 6, 1.17%). Students composed the majority of participants (n=334; 65.4%) and n=331 (64.8%) stated that they were insured by the Social Security Institution (SSI), which is the national health insurance organization in Türkiye. Of the participants, n=87 (17.0%) had children, and regarding income status, n=287 (56.2%) reported having income equal to their expenditure (Table 1).
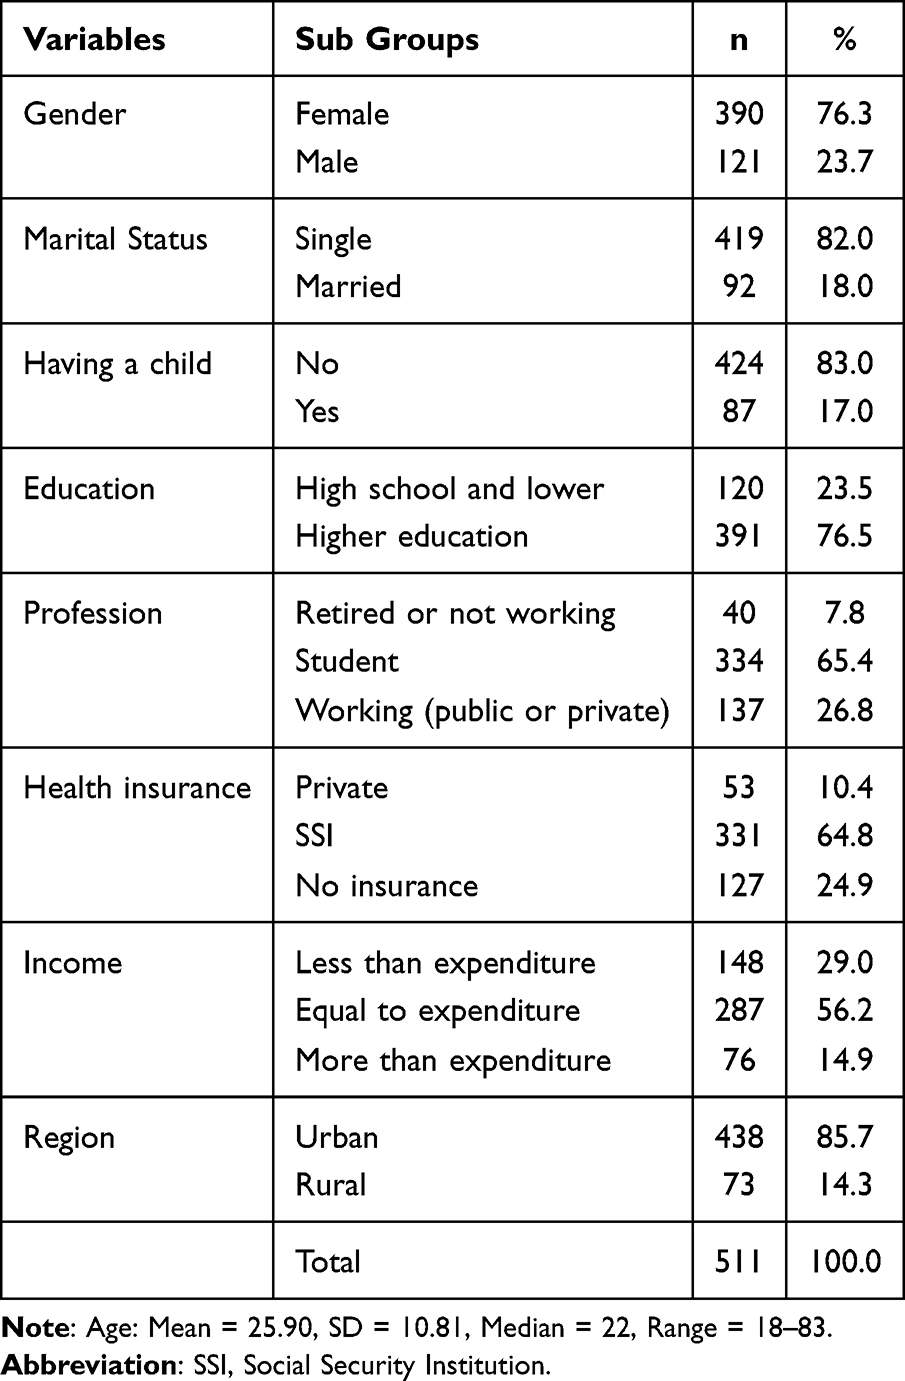 |
Table 1 Descriptive Statistics |
Following demographic analyses, the dataset was divided into exploratory (n = 256, 50.1%) and confirmatory (n = 255, 49.9%) samples (Supplementary Table 1) using propensity score matching to ensure demographic balance between groups. This approach aimed to maximize comparability across samples while maintaining sufficient statistical power for both exploratory and confirmatory factor analyses. Propensity scores were calculated based on all demographic variables (age, gender, marital status, having children, education level, occupation, social security, income level, and place of residence). Balance diagnostics confirmed that all covariates achieved standardized mean differences below the conventional 0.10 threshold, indicating largely successful matching. Although a chi-square test for gender reached statistical significance (p =0.021), the standardized mean difference for gender (SMD = 0.026) remained well below the balance threshold, and measurement invariance across gender was subsequently confirmed (Supplementary Figure 1).
Prior to conducting exploratory and confirmatory factor analyses, comprehensive item analysis was performed on the exploratory sample (n = 256) to evaluate the psychometric properties of all 10 items from the original Medical Maximizer-Minimizer Scale. This preliminary analysis examined item-total correlations, internal consistency reliability, distributional characteristics, and response patterns to identify any items that performed poorly and might warrant exclusion from subsequent analyses. Initial analysis revealed that MMS5 (“If I have a health issue, my preference is to wait and see if the problem gets better on its own before going to the doctor”) exhibited substantially inadequate psychometric properties. Specifically, MMS5 demonstrated a corrected item-total correlation of.105, falling considerably below the acceptable threshold of.30. Additionally, the alpha-if-item-deleted analysis indicated that removing MMS5 would improve the scale’s internal consistency from α =0.81 to α =0.84, suggesting that this item was diminishing rather than contributing to scale reliability. This finding was subsequently corroborated through multiple analytic approaches: confirmatory factor analysis revealed a non-significant factor loading for MMS5 (λ =0.028, p =0.691), and bootstrap exploratory graph analysis showed the lowest item stability coefficient (0.688) compared to other items (range:0.962–1.000). Given the convergent evidence across classical test theory, factor analysis, and network psychometric approaches, MMS5 was removed from all subsequent analyses.
Item analysis results for the nine retained items demonstrated adequate psychometric properties across all indicators.
Corrected item-total correlations ranged from.318 to.595, all exceeding the.30 threshold. Internal consistency was good (α =0.78, 95% CI [0.74,0.82]), and alpha-if-deleted values (0.735–0.781) supported retaining all items. Response distributions showed adequate variability without severe floor or ceiling effects (Table 2).
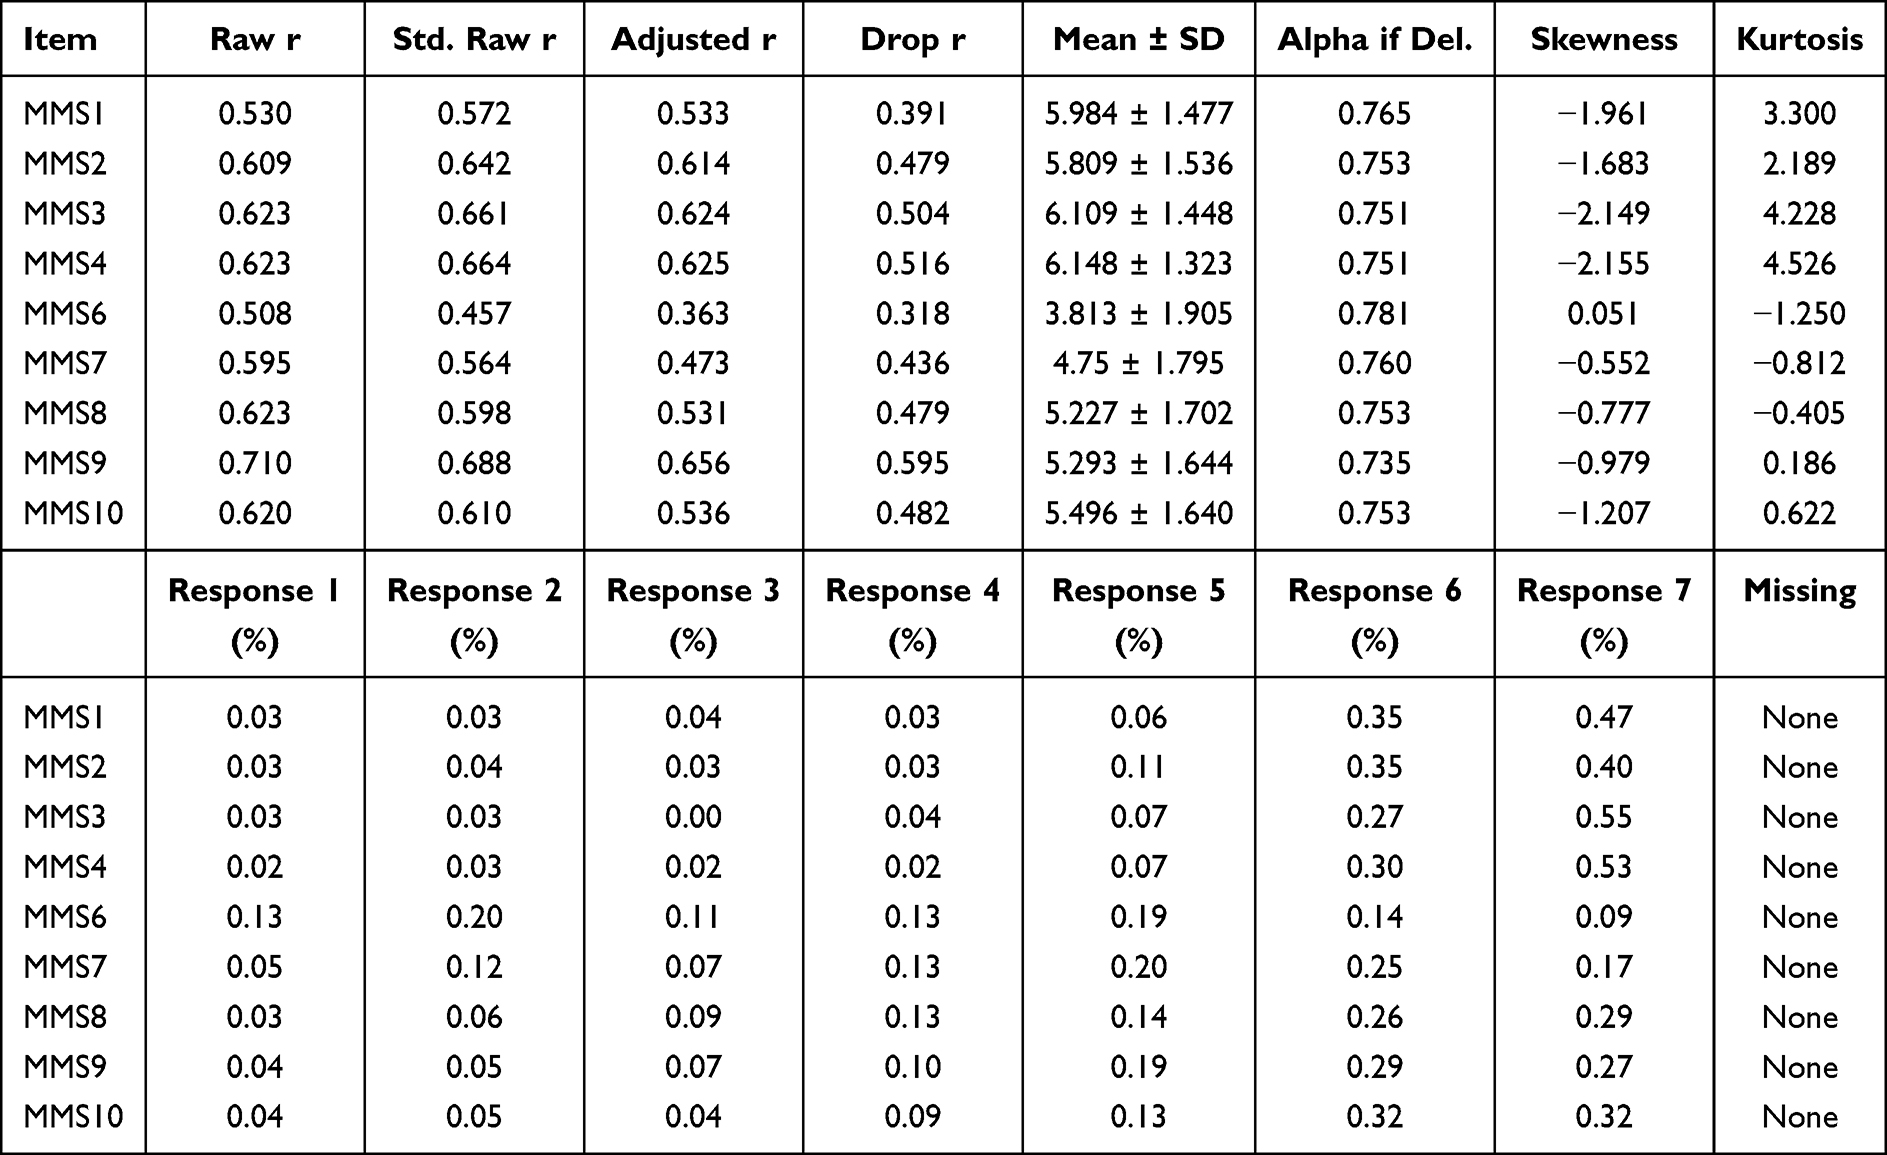 |
Table 2 Item Analysis |
Following item analysis, EGA was conducted on the exploratory sample (n = 256) to examine dimensionality using a network psychometric approach that complements traditional factor analysis by identifying communities of interconnected items based on partial correlations. EFA was also conducted on the full sample (n = 511) to validate the dimensional structure (Supplementary Table 2). The Kaiser-Meyer-Olkin measure of sampling adequacy was.796, and Bartlett’s test of sphericity was statistically significant (χ2df=36 = 1349.318, p <0.001), confirming data suitability for factor analysis. Maximum likelihood extraction with promax rotation yielded a two-factor solution explaining 57.10% of total variance, with excellent internal consistency for both factors (Factor 1: α =0.81, CR =0.87, AVE =0.63; Factor 2: α =0.74, CR =0.83, AVE =0.49) and the overall scale (α =0.77, CR =0.92, AVE =0.55). The interfactor correlation was moderate (r =0.45), indicating related but distinct dimensions.
Exploratory graph analysis revealed a two-dimensional structure for the nine-item scale. The GLASSO estimation with EBIC model selection (γ = 0.5) identified 26 edges among the 9 nodes, resulting in an edge density of.722, indicating a highly interconnected network structure. The Walktrap algorithm detected two distinct communities: Dimension 1 comprised items MMS1, MMS2, MMS3, and MMS4, while Dimension 2 included items MMS6, MMS7, MMS8, MMS9, and MMS10. The Total Entropy Fit Index (TEFI = −5.189) indicated that the data structure was not unidimensional, supporting the multidimensional nature of the construct. Non-zero edge weights ranged from −0.094 to.564 (Mean =0.138, SD =0.152), with the strongest connections observed between items within the same dimension. Bootstrap EGA (500 iterations) showed high structural stability: 94.6% of samples replicated the two-dimensional structure. All items demonstrated stability coefficients ≥.946, with six items showing perfect stability (1.000). Structural consistency was excellent for both dimensions (0.946 and.998; Figure 2).
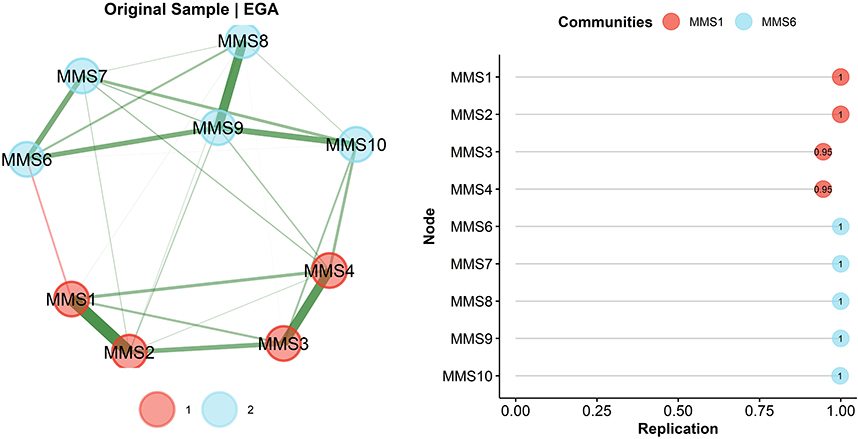 |
Figure 2 Exploratory Graph Analysis results for the nine-item Turkish Medical Maximizer-Minimizer Scale. Left panel: Network structure with nodes representing scale items and edge thickness indicating connection strength. Two communities were identified: Community 1 (red; Items 1–4, Generalist View) and Community 2 (blue; Items 6–10, Individualist View). Right panel: Bootstrap item stability analysis showing replication proportions across 500 iterations; all items demonstrated stability coefficients ≥ 0.95. |
Following the exploratory phase, which supported multidimensionality and informed decisions regarding item retention, CFA was conducted on the independent confirmatory sample (n = 255) to formally compare five a priori specified competing structural models: (i) unidimensional, (ii) two-factor correlated, (iii) second-order, (iv) full bifactor, and (v) partial bifactor. All models included correlated error terms between theoretically related items (MMS1-MMS4, MMS2-MMS4, MMS3-MMS4, and MMS6-MMS7) based on modification indices. Model fit was evaluated using chi-square statistics, chi-square/df ratio, CFI, TLI, RMSEA, SRMR, GFI, AGFI, NFI, IFI, RFI, and PGFI, with model comparisons conducted using AIC, BIC, CAIC, and ECVI. For the selected bifactor model, additional diagnostics including Explained Common Variance (ECV), Percent of Uncontaminated Correlations (PUC), omega hierarchical, construct replicability index (H), and factor determinacy were computed to evaluate the appropriateness of total and subscale score interpretation. Model comparison results are presented in Table 3 and Supplementary Figure 2.
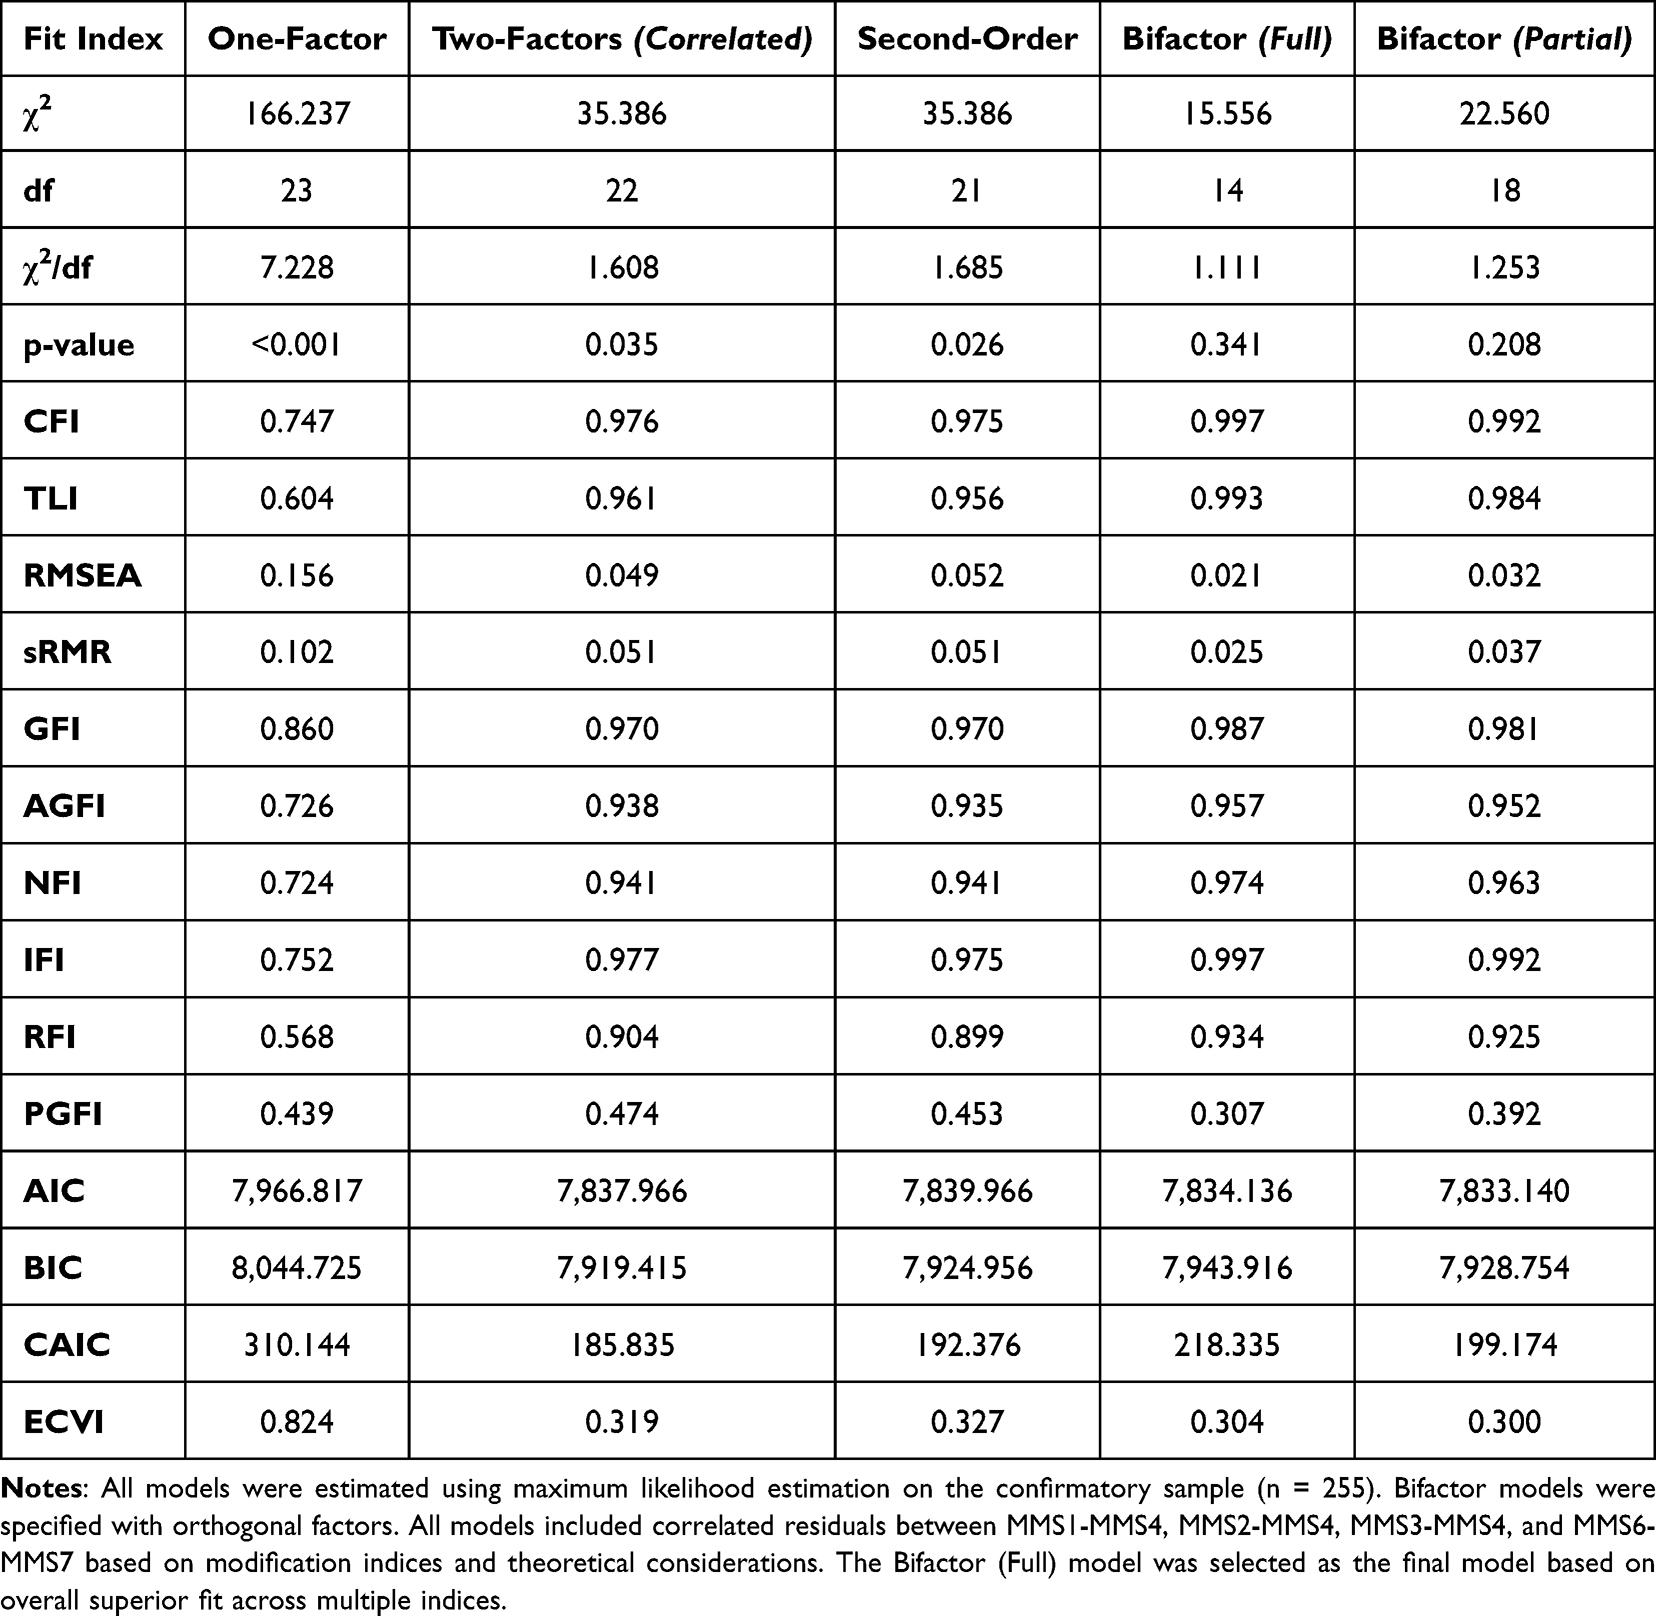 |
Table 3 Comparison of Alternative Structural Models for the Turkish MMS |
The one-factor model showed poor fit (CFI =0.747, RMSEA =0.156), indicating a unidimensional structure was inadequate. The two-factor correlated and second-order models showed improved fit (CFI =0.976/.975, RMSEA =0.049/.052), as expected given their mathematical equivalence. Both bifactor models demonstrated superior fit compared to the alternative specifications. The full bifactor model, incorporating a general factor alongside two orthogonal specific factors (χ2df=14 = 15.556, p =0.341, CFI =0.997, TLI =0.993, RMSEA =0.021, SRMR =0.025, χ2/df = 1.111), with a non-significant chi-square test indicating no significant discrepancy between the observed and model-implied covariance matrices. The partial bifactor model, which included only the Individualist View (IV) as a specific factor while allowing the Generalist View (GV) items to load solely on the general factor, also demonstrated excellent fit (χ2df=18 = 22.560, p =0.208, CFI =0.992, TLI =0.984, RMSEA =0.032, SRMR =0.037, χ2/df = 1.253). Information criteria showed mixed results: the partial bifactor model yielded the lowest AIC (7,833.140), BIC (7,928.754), and CAIC (199.174), reflecting greater parsimony, while the full bifactor model showed the lowest ECVI (0.304) and superior absolute fit indices (Table 3).
Bifactor diagnostics for the full bifactor model indicated that the general factor accounted for 46.1% of the common variance (ECV =0.461), with specific factors explaining substantial additional variance (ECV-GV =0.333, ECV-IV =0.206). The Percentage of Uncontaminated Correlations was.556. Omega hierarchical for the general factor (ωH =0.535) indicated that approximately 54% of reliable variance in total scores is attributable to the general factor, while omega hierarchical subscale values were.548 for Generalist View and.287 for Individualist View. According to established guidelines, when ECV falls below.70, ωH falls below.75, and PUC falls below.80, reliance on total scores alone may obscure meaningful dimensional differences, supporting the interpretation of subscale scores alongside total scores. Construct replicability indices (H) demonstrated that the general factor (H =0.722) and Generalist View (H =0.713) were well-defined constructs likely to replicate across samples, while the Individualist View showed lower replicability (H =0.553). Factor determinacy scores were excellent for the general factor (0.966) and Generalist View (0.972), and adequate for Individualist View (0.883) (Supplementary Table 4).
Based on these bifactor diagnostics, we recommend a multidimensional scoring approach: researchers should compute and report both the total score (mean of all nine items) to capture overall maximizing-minimizing orientation and the Generalist View subscale score (Items 1–4) to assess philosophical orientations toward medical intervention. The Individualist View subscale (Items 6–10), given its lower omega hierarchical subscale value and construct replicability, should be interpreted cautiously and primarily in conjunction with the total score rather than as a standalone indicator (Figure 3).
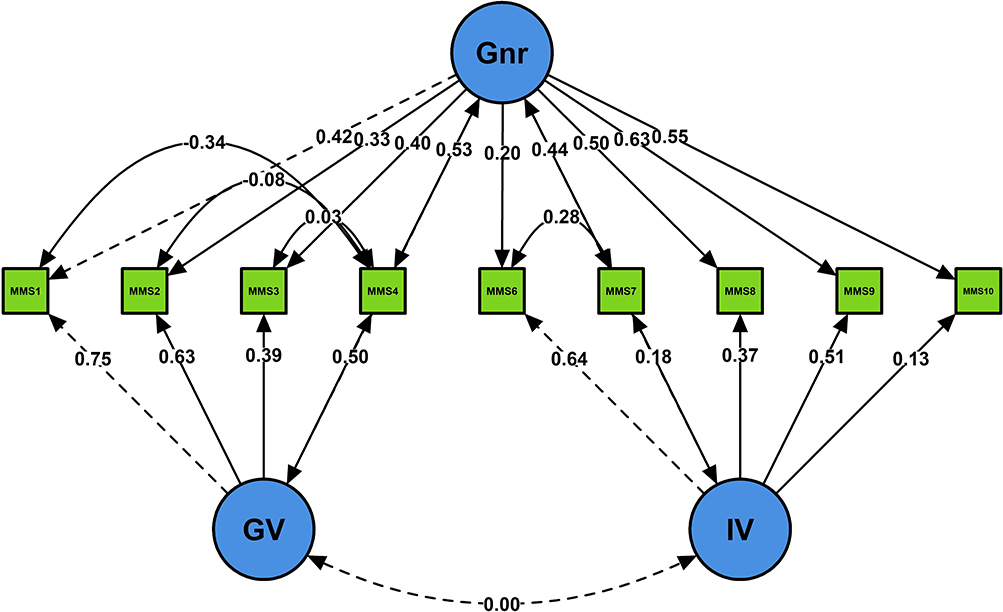 |
Figure 3 Standardized factor loadings for the bifactor model of the nine-item Turkish Medical Maximizer-Minimizer Scale. Gnr = General factor loading on all items; GV = Generalist View specific factor (Items 1–4); IV = Individualist View specific factor (Items 6–10). Solid lines indicate positive loadings; dashed lines indicate negative or non-significant loadings. The bifactor model demonstrated excellent fit (CFI =0.997, TLI =0.993, RMSEA =0.021, SRMR =0.025). |
The full bifactor model demonstrated excellent fit to the data and is displayed in Figure 3; standardized factor loadings for all items are presented in Supplementary Table 3. Standardized factor loadings on the general factor ranged from.20 (MMS6) to.63 (MMS8), with seven of nine items showing loadings above.40, indicating substantial shared variance attributed to the general medical maximizing-minimizing construct. The Generalist View (GV) specific factor loadings ranged from.39 (MMS3) to.75 (MMS1), while the Individualist View (IV) specific factor loadings ranged from.13 (MMS10) to.64 (MMS6). The pattern of loadings suggests that MMS1-4 contribute unique variance beyond the general factor that is specific to proactive healthcare-seeking attitudes, while MMS6-10 contribute additional variance specific to individualized treatment preferences. Correlated error terms between theoretically related items (MMS1-MMS4, MMS6-MMS7) were retained based on theoretical considerations and improved model fit. The orthogonal relationship between the general and specific factors is a defining characteristic of bifactor models, ensuring that the specific factors capture residual variance independent of the general construct (Figure 3).
Measurement invariance of the bifactor models across demographic groups was evaluated through sequential model comparisons, as summarized in Table 4.
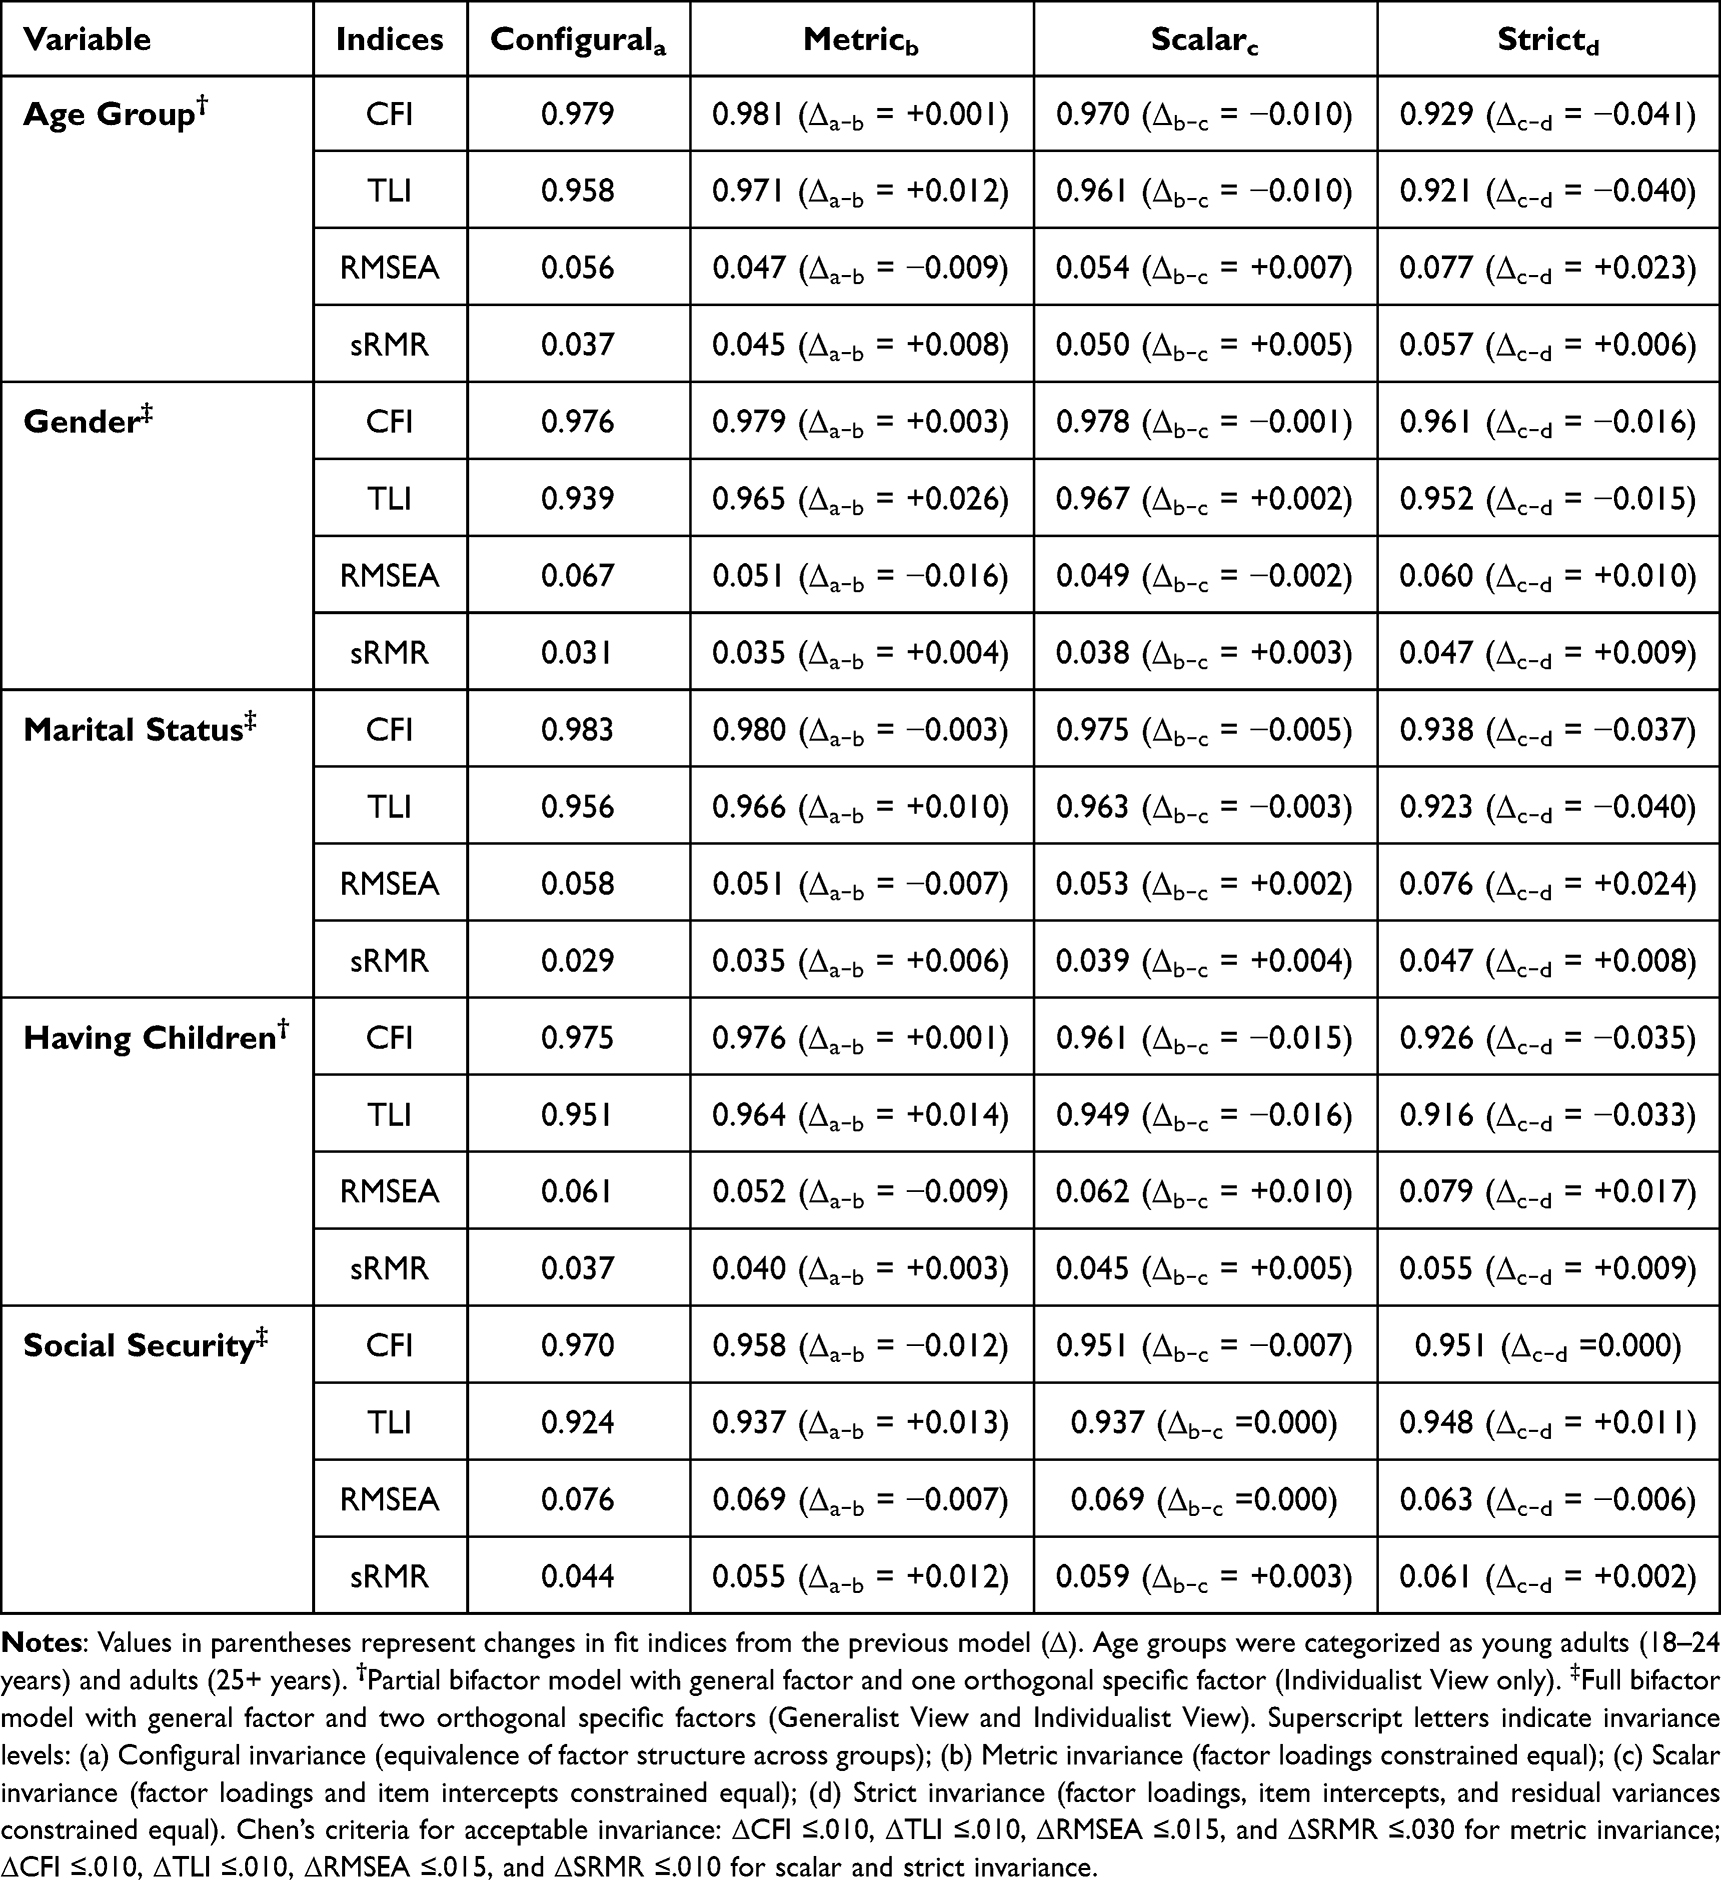 |
Table 4 Measurement Invariance Testing for the Turkish MMS Across Demographic Groups |
Invariance was evaluated using Chen’s criteria,40 which suggest that ΔCFI ≤.010, ΔTLI ≤.010, ΔRMSEA ≤.015, and ΔSRMR ≤.030 for metric invariance, and ΔCFI ≤.010, ΔTLI ≤.010, ΔRMSEA ≤.015, and ΔSRMR ≤.010 for scalar and strict invariance. Full bifactor models achieved converged for gender, marital status, and social security groups, while partial bifactor models (with only the Individualist View as a specific factor) were used for age groups and having children due to convergence issues with the full model. Notably, several other demographic variables (education level, occupation, and income level) exhibited convergence problems across all tested model specifications (full bifactor, partial bifactor, second-order, and two-factor correlated models), likely attributable to insufficient sample sizes within certain subgroups or unbalanced group distributions, and were therefore excluded from invariance testing. Across the five successfully tested demographic variables, configural invariance was supported, with all models demonstrating acceptable fit (CFI ≥.970, TLI ≥.924, RMSEA ≤.076, SRMR ≤.044). Metric invariance was generally supported across groups, with ΔCFI values ranging from −0.012 to.003 and ΔRMSEA values ranging from −0.016 to −0.007, all meeting Chen’s criteria. Scalar invariance was also supported for most groups, with ΔCFI ranging from −0.015 to −0.001 and ΔRMSEA ranging from −0.002 to.010. However, strict invariance (equal residual variances) was not consistently supported across demographic groups. The transition from scalar to strict invariance resulted in substantial decreases in model fit, with ΔCFI values ranging from −0.041 to.000 and ΔRMSEA increases ranging from −0.006 to.024. Notably, age groups (ΔCFI = −0.041), having children (ΔCFI = −0.035), and marital status (ΔCFI = −0.037) showed the largest deteriorations in fit at the strict level, exceeding ΔCFI criterion (Table 4).
Convergent and discriminant validity of the Medical Maximizer–Minimizer Scale were assessed through correlations with theoretically related constructs, presented in Table 5.
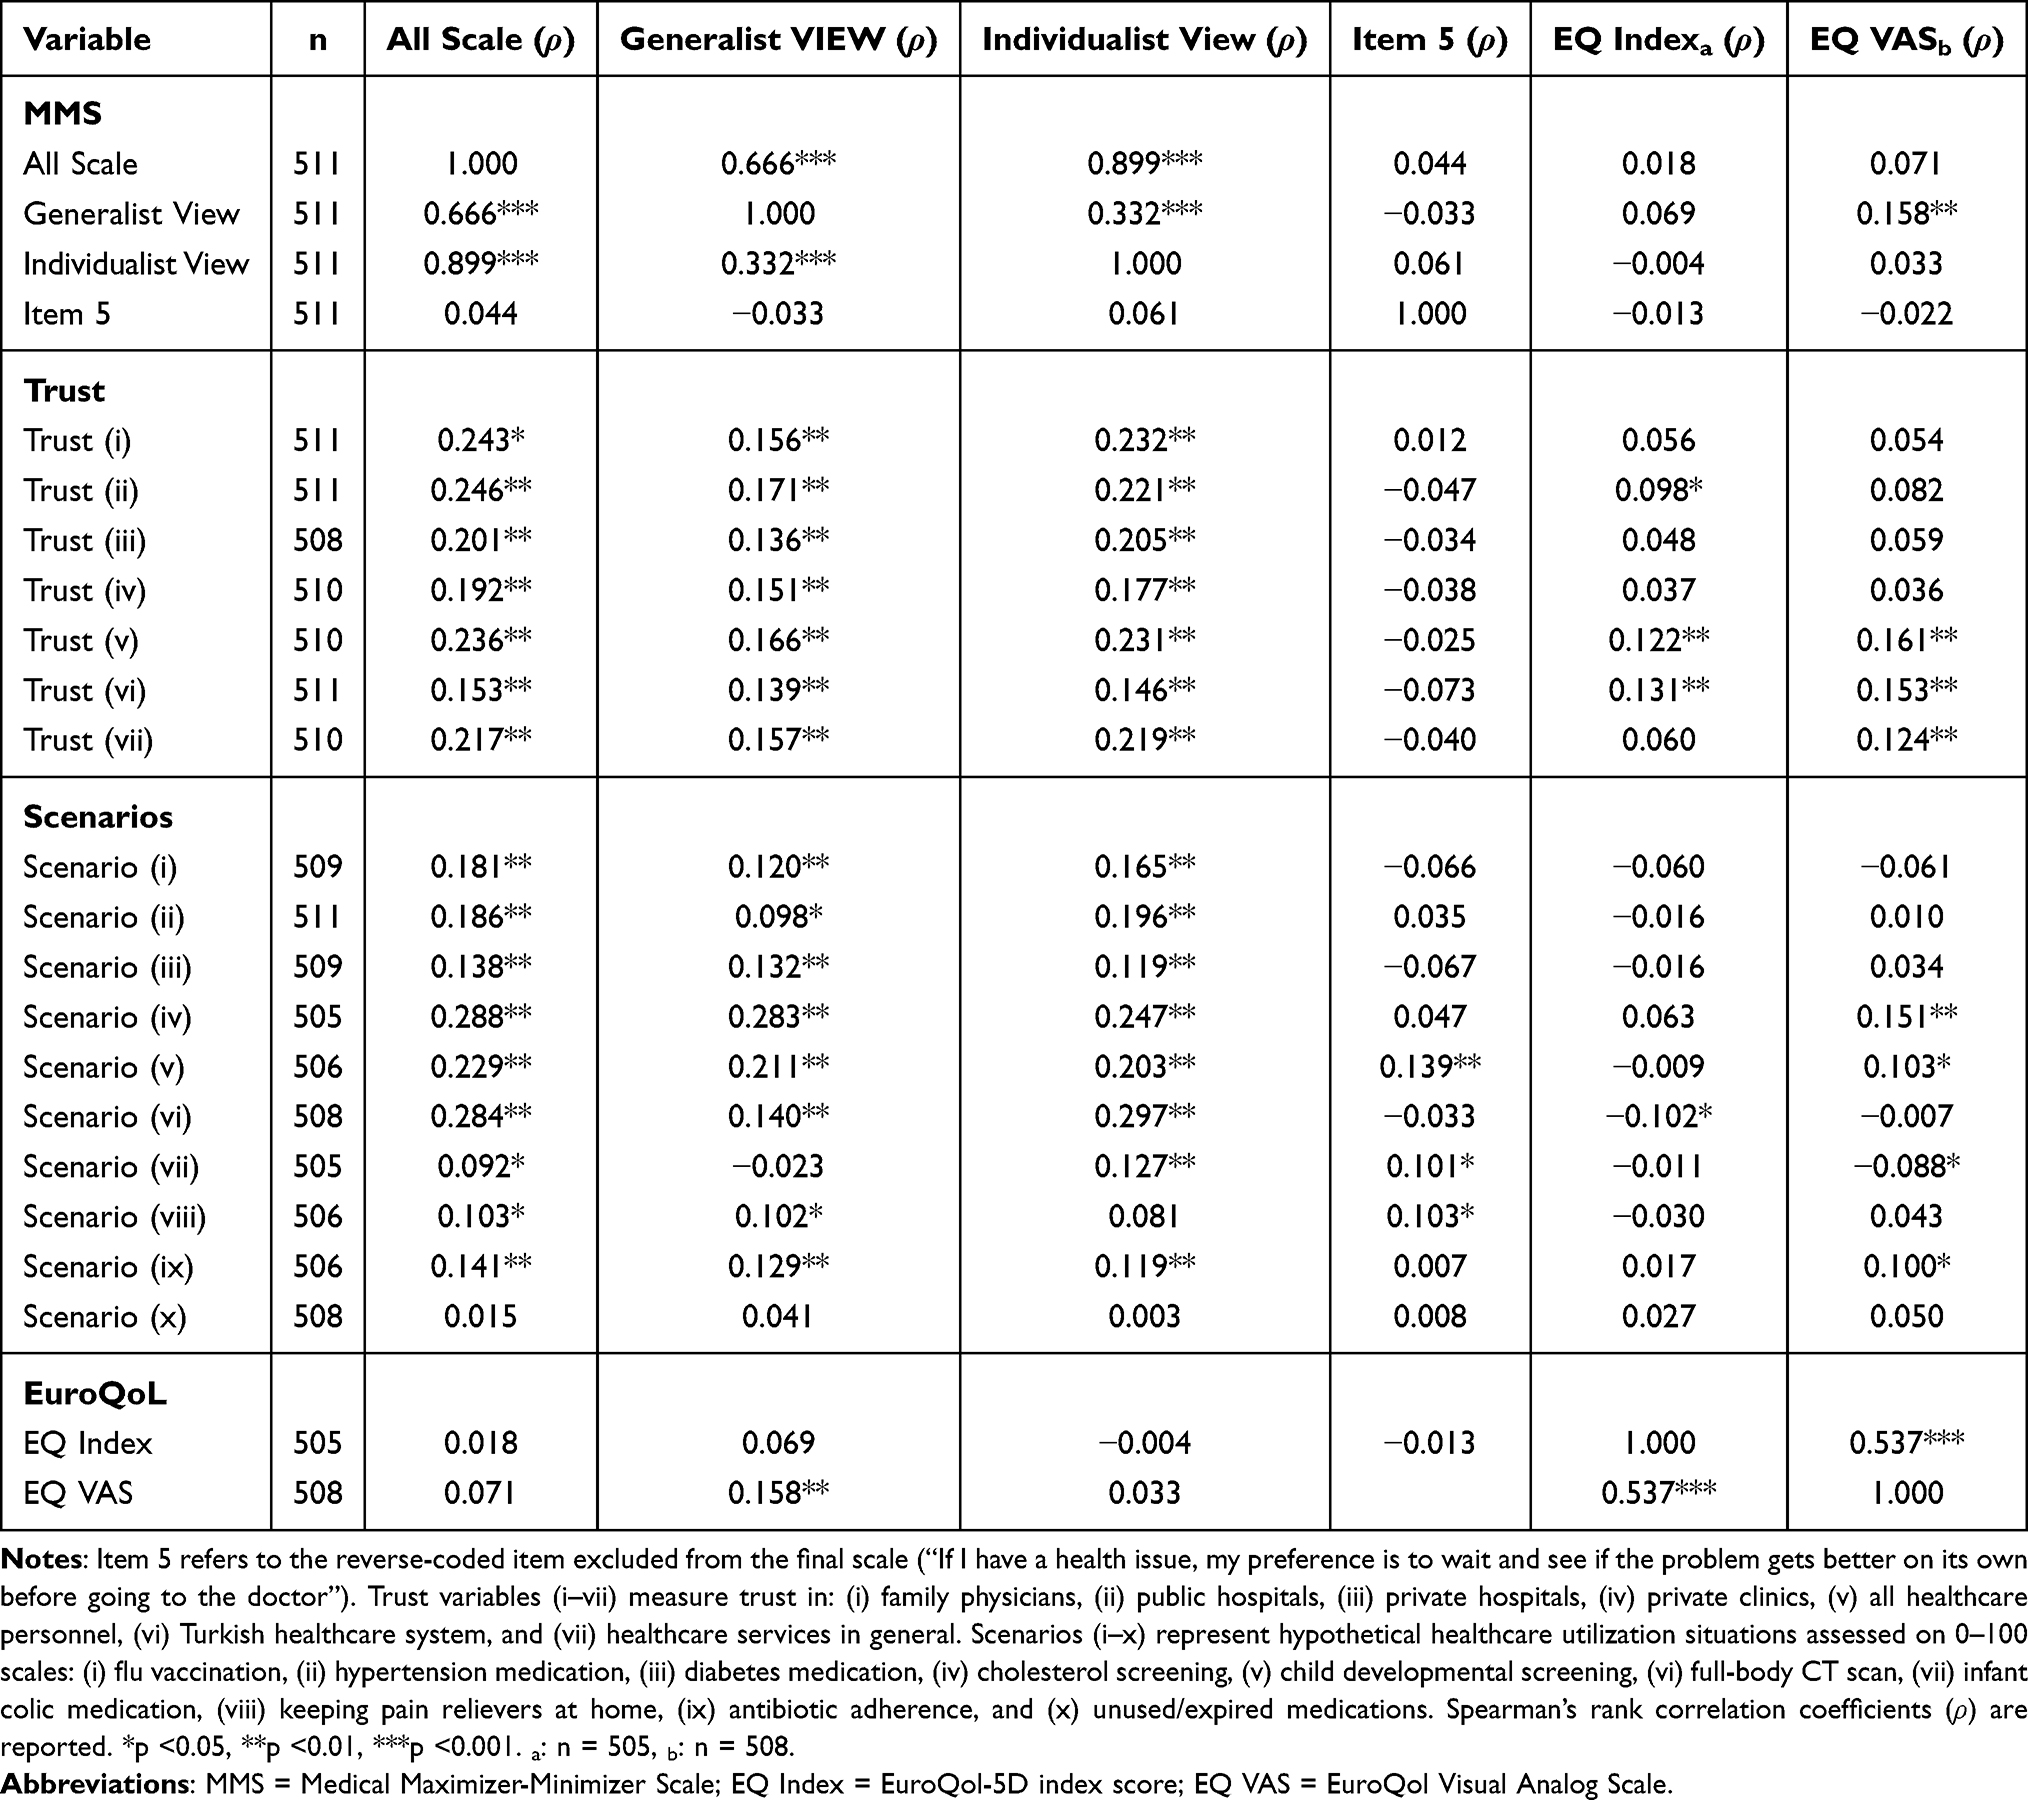 |
Table 5 Correlations Between MMS, Healthcare Trust, Scenarios, and Health-Related Quality of Life |
The MMS showed moderate positive correlations with healthcare trust (r =0.15–0.25, p <0.01) and scenario-based utilization intentions (r =0.09–0.29), with strongest associations for screening-related scenarios (Table 5). Correlations with health-related quality of life were weak and mostly nonsignificant (EQ-5D index: r = −0.004–0.07; EQ-VAS: r =0.03–0.16), supporting discriminant validity. Item 5 showed near-zero correlations with most variables, further supporting its exclusion.
Group differences in medical maximizer–minimizer orientations were examined across demographic characteristics and healthcare utilization patterns, as shown in Table 6.
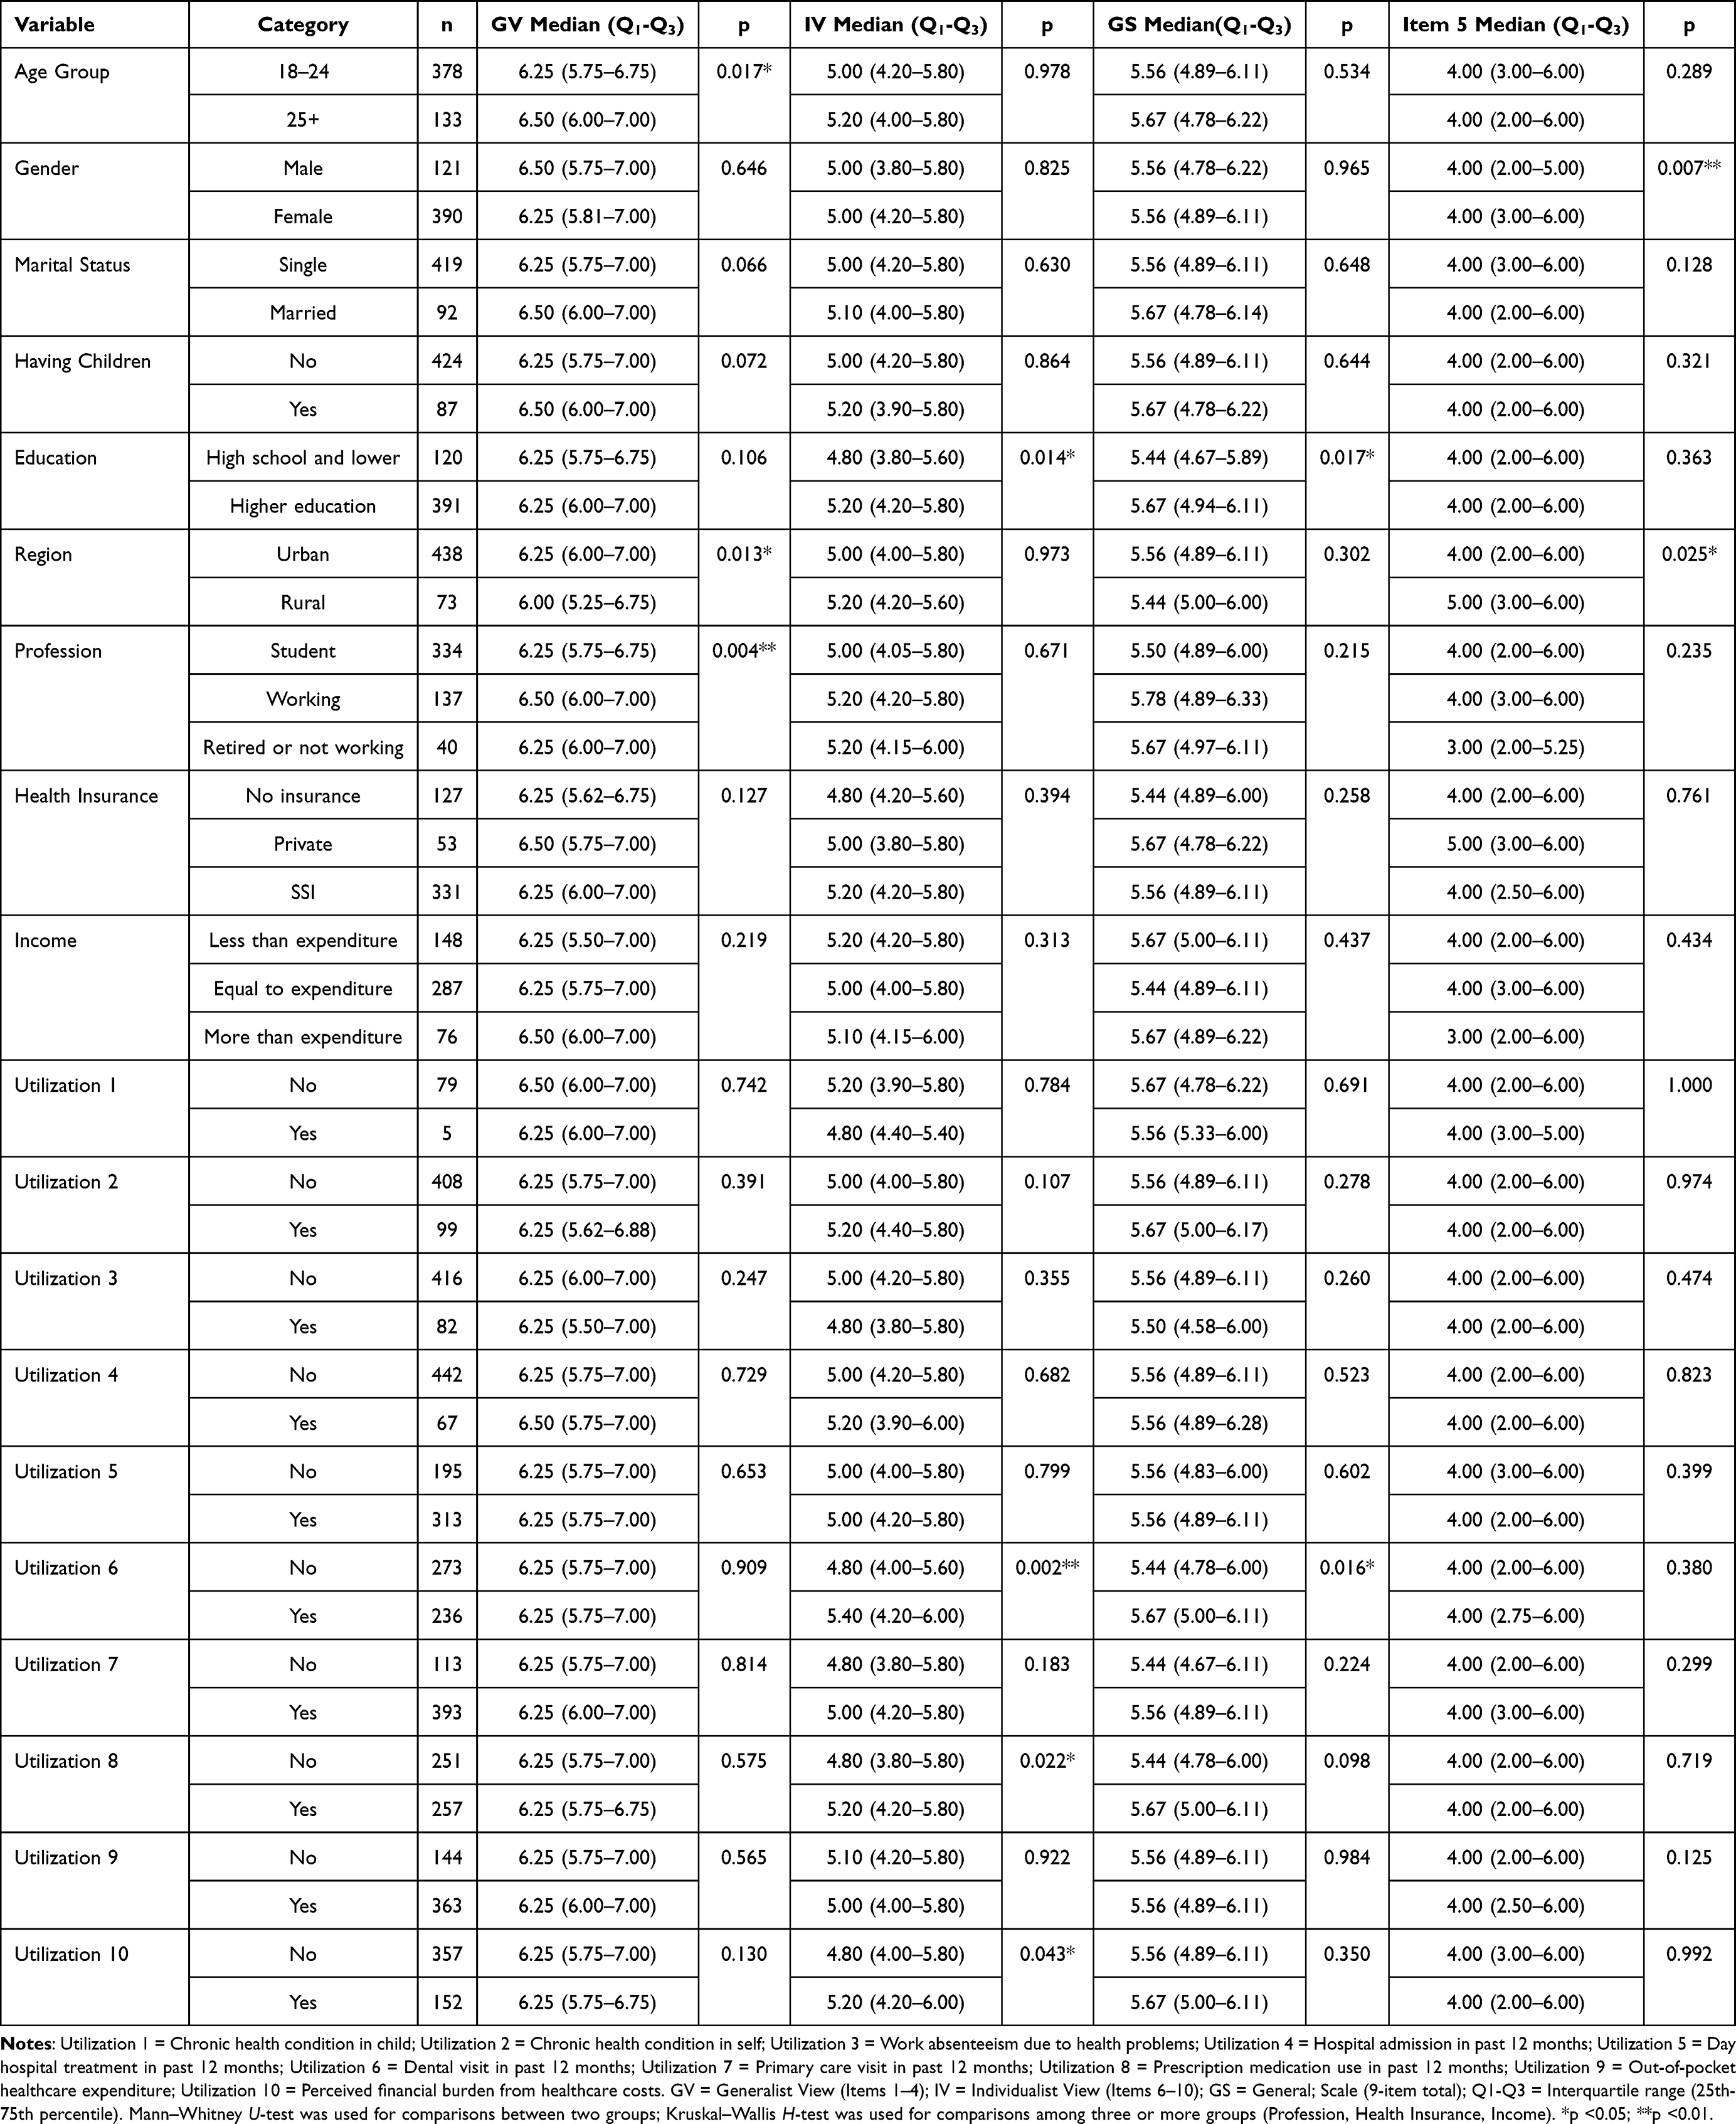 |
Table 6 Comparisons of MMS Scores Across Demographic and Healthcare Utilization Groups |
Significant demographic differences emerged selectively across MMS dimensions. Age group was significantly associated with the Generalist View (p = 0.017), with adults aged 25 and older (Median = 6.50) reporting higher scores than young adults aged 18–24 (Median = 6.25). Place of residence also differentiated Generalist View scores (p = 0.013), with urban residents scoring higher than rural residents. Profession showed a significant association with the Generalist View (p = 0.004), with employed individuals (Median = 6.50) exhibiting higher maximizing tendencies than students (Median = 6.25). Education level was significantly associated with the Individualist View (p = 0.014) and the General Scale (p = 0.017), with individuals holding higher education degrees reporting greater maximizing orientations. Gender, marital status, parental status, health insurance type, and income level did not show statistically significant differences across any MMS dimension (Table 6).
Healthcare utilization patterns revealed selective associations with maximizer-minimizer orientations, predominantly through the Individualist View dimension. Individuals who reported dental visits in the past 12 months scored significantly higher on the Individualist View (p = 0.002) and the General Scale (p = 0.016). Prescription medication use was significantly associated with higher Individualist View scores (p = 0.022). Perceived financial burden from healthcare costs was also associated with higher Individualist View scores (p = 0.043). Chronic health conditions, hospital admissions, primary care visits, and other utilization indicators did not reach statistical significance. Notably, Item 5 (the excluded reverse-coded item) showed inconsistent patterns across groups with weak and mostly non-significant associations, further validating the decision to exclude it from the final scale (Table 6).
Discussion
The Turkish version of the MMS revealed a robust bifactor structure in the Turkish sample and demonstrated psychometric properties consistent with the original scale. It appears that the MMS significantly captures attitudinal differences related to healthcare services and help-seeking intentions in the Turkish sample, while positioning itself as a distinct construct separate from health status indicators. For the Generalist View, which captures the “general healthcare-seeking orientation” in MMS dimensions, age, place of residence, and occupation axes were important. In our sample, the age group characterized by UNESCO as young adults39 had partially lower generalist view levels as they showed lower health-seeking tendency compared to older age groups. Older age groups seek/use healthcare services more than the general population;1 this occurs due to increasing needs with age (chronic disease burden, functional loss) and they have grasped the importance of healthcare services;41 in this respect, it provided an expected result for discriminant validity. In terms of healthcare service utilization, urban residents are generally more inclined,42 and the Generalist View was able to capture this urban-rural distinction. On the other hand, remarkably, Individualist View showed stronger relationships with healthcare service utilization behaviors compared to Generalist View, particularly among those who reported dental visits and prescription drug use. Additionally, the slightly higher level among those experiencing healthcare expenditure burden suggests that it may be more closely related to recent healthcare service utilization and treatment-seeking practices, while also supporting the theoretical distinction between the two factors. While Individualist View reflects concrete and action-oriented preferences directly related to health-seeking behaviors, Generalist View represents more abstract philosophical orientations toward medical intervention and therefore may not be directly reflected in healthcare service utilization.18
The differentiated relationship patterns between factors strongly support the construct validity of the bifactor structure.43 The fact that Individualist View scores exhibit stronger relationships with healthcare service utilization behaviors compared to the General Score demonstrates that this factor explains significant additional variance in behavioral prediction beyond the general factor.44 This theoretically consistent finding is attributable to the fact that Individualist View items directly refer to personal health-seeking behaviors, thus capable of establishing proximal relationships with real-world utilization indicators,45 whereas GV items measure abstract philosophical attitudes toward the intrinsic value of medical intervention, and the influence of these beliefs on utilization occurs through a more distal pathway mediated by cognitive processes—a situation that reflects the well-known attitude-behavior distinction in health psychology literature.46 The General Score’s significant relationships with education level and dental visits support the presence of a common maximization factor loading on all items. However, causal interpretation of these relationships requires caution. Education and health literacy may be associated with maximization tendencies, but prior evidence suggests that stronger preferences for more health care can also be observed among individuals with lower health literacy and lower educational attainment. Accordingly, the direction of these associations cannot be assumed to be unidirectional and may reflect complex, potentially reciprocal pathways.24,46–50 These patterns suggest the two dimensions are clinically meaningful: behavioral interventions46 may suit those with high Individualist View scores, while educational strategies51,52 may be more appropriate for high Generalist View scores.
The moderate positive relationships of the MMS with trust in the health system and providers support the expected convergent validity of the scale in a consistent direction. Particularly in the literature, it is expected to predict usage intentions in “action-oriented” contexts such as individuals’ screening decisions, and this is explained by the maximization tendency’s resistance to information and the minimization tendency’s sensitivity to information.53 In our current study, the emergence of the strongest connections with scenario-based healthcare utilization intentions particularly in situations involving screening and advanced testing (eg, cholesterol screening and whole-body CT scanning) provides evidence for a nuanced interpretation of the maximization-trust relationship. It demonstrates that the positive relationship between high maximization tendency and trust in the health system can coexist with rational decision-making and the tendency to be protected from misinformation, but at the same time, high trust in medical authority may lead individuals to more easily accept low-value or unnecessary screening/tests.22 While maximizers’ trust in healthcare may reduce susceptibility to misinformation, it may also increase the likelihood of accepting low-value screening or testing, thereby potentially increasing exposure to overdiagnosis and overtreatment.54
Relationships with health-related quality of life indicators are weak and mostly non-significant, with only a small but significant relationship detected between Generalist View and subjective health perception. These results are consistent with findings from the original MMS validation study: Scherer et al also reported minimal relationships between health status measured with SF-12 and MMS and demonstrated that medical maximization-minimization tendencies are a construct distinguishable from health status or system access.18 Our current findings replicate this discriminant validity in the Turkish sample, confirming that maximization-minimization preferences reflect a disposition/preference-based construct independent of objective health level. This independence is theoretically logical: maximization tendencies respond to the question “how do I approach illness situations?” rather than “how sick am I?”—this distinction is critically important for the clinical use of the scale, because high maximization scores should not be confused with being ill, but rather should be interpreted as an approach style to health decisions.18,55 On the other hand, the scale’s demonstration of significant but not high correlations with attitudes and behavioral tendencies such as trust and health-seeking intention is another indicator of construct validity: these relationships are strong enough to show that maximization-minimization preferences are connected to real-world behaviors, yet weak enough to reveal that the scale is not redundant with these variables and measures a unique construct.56,57 With this balanced relationship profile, the MMS has proven that it captures the maximization-minimization construct both independently from other health variables and meaningfully related to them.
The exclusion of Item 5 (“When I have a health problem, I prefer to wait to see if it gets better on its own before going to the doctor”) can be interpreted as a theoretically and culturally meaningful finding rather than a purely psychometric artifact. Item 5 was the only reverse-scored item in the original MMS and showed consistently weak and unstable performance across exploratory and confirmatory analyses in the Turkish sample. While this item loaded acceptably in the original US validation study,18 its differential performance suggests cross-cultural variation in how the “wait-and-see” approach is interpreted. In Turkish healthcare culture, prompt medical consultation and family involvement in health-related decisions are highly normative, which may alter the meaning of delayed care-seeking compared to more individualistic contexts. This interpretation is supported by evidence from other cultural adaptations of the MMS.
In Turkish healthcare culture, prompt medical consultation and family involvement in health-related decisions are highly normative, which may alter the meaning of delayed care-seeking compared to more individualistic contexts. However, beyond cultural norms, the structural characteristics of the Turkish healthcare system may also contribute to the poor functioning of this item. The Turkish healthcare system operates through a centralized appointment system, which frequently results in waiting periods of six to eight weeks for specialist consultations in public facilities. In this context, the decision to “wait and see” before seeking medical care is often not a matter of personal preference or dispositional tendency, but rather a structural constraint imposed by system-level factors. Consequently, responses to Item 5 may reflect participants’ awareness of appointment availability rather than their underlying maximizing-minimizing orientation, rendering this item an unreliable indicator of the target construct. From this perspective, the failure of Item 5 to contribute meaningfully to either dimension is coherent with the operational realities of the Turkish healthcare system.58
A parallel pattern emerged with Item 4 (“If I get sick, I want to do something about it rather than just wait and see if it gets better”), which loaded on the Generalist View factor (alongside Items 1–3) in the Turkish sample rather than on the Individualist View factor as observed in the original American validation. In the original MMS structure, Items 1–3 captured abstract philosophical orientations emphasizing the intrinsic value of medical intervention—beliefs that treatment should be pursued regardless of demonstrated survival or quality-of-life benefits—while Item 4 was grouped with more concrete, action-oriented healthcare-seeking behaviors. However, Turkish respondents appear to interpret Item 4 as reflecting a general principle of personal responsibility in health matters rather than a specific behavioral preference. This interpretation aligns with the collectivist characteristics of Turkish society, where taking active responsibility for one’s health is viewed as a normative expectation and moral obligation rather than an individual behavioral choice. The same cultural dynamics that rendered Item 5 unstable—namely, that passive waiting is not perceived as a legitimate dispositional option—appear to have shifted Item 4 toward the more abstract, value-based Generalist View dimension. These structural findings have implications for the interpretation of the Individualist View subscale. The omega hierarchical subscale coefficient for the Individualist View indicated limited unique reliable variance beyond the general factor, suggesting that this dimension should not be interpreted as a standalone indicator. Certain items within this subscale exhibited notably weak contributions to the specific factor despite adequate contributions to the general maximizing-minimizing construct. Examining the content of these items offers culturally meaningful insights. Item 7, which assesses recommending physician consultations to family and friends, reflects a behavior that is nearly universal in Turkish collectivist culture—advising loved ones to seek medical care is a normative social expectation rather than an individual preference that differentiates maximizers from minimizers. Similarly, Item 10, which captures the abstract belief that more healthcare is inherently better, may function as a general value statement that most Turkish respondents endorse regardless of their specific healthcare-seeking behaviors. These items thus contribute to the overall maximizing orientation but fail to capture unique variance specific to individualized treatment preferences. This psychometric pattern may itself reflect cultural dynamics: in collectivist societies where healthcare decisions are often made in consultation with family members and where deference to physician authority is normative, purely individualistic healthcare-seeking behaviors may be less clearly differentiated from general orientations toward medical care. Items 6–10, which assess concrete behaviors such as immediately seeking prescriptions and preferring active treatment, may function less as markers of a distinct “individualist” dimension and more as behavioral expressions of the same underlying maximizing orientation captured by the general factor.
This interpretation is supported by evidence from other cultural adaptations of the MMS. Notably, the Chinese adaptation by Lai et al32 retained all 10 items, including Item 5, but identified a correlated two-factor structure rather than a bifactor model, which the authors attributed to Confucian values emphasizing conservative approaches and family-based decision-making. These divergent factor structures across US, Chinese, and Turkish contexts suggest that while the maximizer–minimizer construct reflects a broadly universal disposition, its dimensional expression and item functioning are shaped by cultural and healthcare system contexts. Additionally, the Swedish MMS translation has demonstrated predictive utility for COVID-19 protective behaviors, with minimizers showing reduced adherence to public health recommendations—extending the scale’s relevance beyond clinical settings.33 Importantly, despite the exclusion of Item 5, the remaining nine items continue to capture both poles of the maximizer-minimizer continuum. Lower scores on the retained items reflect minimizing tendencies—preference for less intervention and watchful waiting in non-urgent contexts—while higher scores reflect maximizing tendencies. The bipolar nature of the construct is thus preserved, as the scale assesses a preference continuum rather than categorical maximizer or minimizer status. The bifactor structure further ensures comprehensive coverage by distinguishing both the overarching dispositional orientation and its domain-specific manifestations through the Generalist View and Individualist View factors. Future research should examine whether alternative phrasings of the watchful-waiting concept—such as culturally adapted items that frame delayed care-seeking in terms of active self-monitoring or informed conservative management rather than passive avoidance—can better capture minimizing preferences in Turkish populations while maintaining content coverage of the full maximizing-minimizing continuum.
Measurement invariance testing across demographic characteristics—including age group, gender, marital status, parental status, and social security—showed that the scale maintained a consistent factor structure across all groups. Configural and metric invariance were fully supported, indicating that the underlying constructs were conceptualized similarly and that participants responded to items in a comparable manner across subgroups.59 Scalar invariance was also achieved for all demographic variables, suggesting that latent mean comparisons can be meaningfully conducted between these groups. Although strict invariance was not established, particularly among age groups, individuals with and without children, and different marital status categories, this limitation is not considered critical. As noted in prior methodological literature, residual variance equality is not required for valid mean-level comparisons, and achieving scalar invariance is generally sufficient for substantive interpretation.60 Therefore, the scale can be confidently used to compare latent mean scores across demographic groups in the Turkish population, while acknowledging that minor variations in residuals may reflect real demographic-specific response tendencies rather than measurement bias.
Scherer and Zikmund-Fisher developed a single-item maximizing-minimizing question that demonstrates moderate correlation with the MMS-10 and comparably predicts healthcare utilization.55 While this single-item question offers practical advantages for clinical screening and large-scale surveys, single-item measures are inherently limited due to increased measurement error and reduced sensitivity to individual differences.61 Our nine-item Turkish MMS provides an optimal balance between psychometric rigor and practical feasibility, representing a strong foundation for introducing this construct to the literature. More importantly, our bifactor structure reveals two distinct dimensions—Generalist View and Individualist View—that may require different intervention strategies in Turkish healthcare settings. The Generalist View factor (Items 1–4) captures broad philosophical orientations toward aggressive medical intervention regardless of demonstrated survival or quality-of-life benefits, reflecting the belief that medical action is inherently valuable. The Individualist View factor (Items 6–10), in contrast, reflects concrete behavioral manifestations of maximizing preferences in personal healthcare contexts. The complete scale integrates these two perspectives, providing a comprehensive assessment that captures both philosophical foundations and behavioral expressions.
Based on the bifactor diagnostics results, we recommend a multidimensional scoring approach. The general factor accounts for less than half of the common variance and omega hierarchical falls below conventional thresholds, indicating that reliance on total scores alone may obscure meaningful dimensional differences. Therefore, researchers and clinicians should compute and report both the total score (mean or sum of all nine items) to capture overall maximizing-minimizing orientation and the Generalist View subscale score (Items 1–4) to assess philosophical orientations toward medical intervention. The Generalist View subscale demonstrated adequate reliability indices and construct replicability, supporting its use as a standalone indicator. The Individualist View subscale (Items 6–10), given its lower reliability and construct replicability indices, should be interpreted cautiously and primarily in conjunction with the total score rather than as an independent indicator. When the research question concerns broad classification of patients as maximizers versus minimizers, the total score provides adequate summary information; however, when the goal is to understand specific intervention targets or predict domain-specific healthcare behaviors, reporting both total and Generalist View subscale scores offers greater precision and clinical utility.
Our study has several important limitations that should be acknowledged. First, as the first Turkish adaptation of the MMS, this study represents an initial validation that requires replication and extension in future research. Most notably, our convenience sampling strategy and snowball recruitment method limit the generalizability of our findings to the broader Turkish population The sample was predominantly young, with 378 participants (73.97%) aged 18–24 years, and highly educated, as 392 participants (76.5%) had attained higher education; moreover, 344 participants (67.0%) were university students. In contrast, older adults were markedly underrepresented, with only six participants (1.17%) aged 65 years or older. Given that healthcare utilization patterns and medical decision-making preferences may differ substantially in geriatric populations due to increased chronic disease burden and healthcare needs, future studies should specifically oversample older adults to evaluate the psychometric properties and clinical utility of the Turkish MMS in this important demographic group. Second, all healthcare utilization measures were based on self-report rather than medical records or administrative claims data, introducing potential recall bias, social desirability bias, and measurement error. Third, the cross-sectional design of our study precludes causal inferences regarding the directionality of associations between maximizing-minimizing preferences and demographic, attitudinal, or behavioral variables, and did not permit assessment of test-retest reliability, which should be examined in future longitudinal studies. Fourth, although scenario-based healthcare utilization intentions demonstrate strong predictive validity and are widely used in health decision-making research, they may not fully capture actual healthcare decisions in real clinical settings, where behaviors are influenced by multiple contextual factors including cost, access, physician recommendations, and family influence. Finally, although the exclusion of Item 5 was necessary due to cultural and construct validity considerations, this decision somewhat reduces direct comparability with studies using the full 10-item MMS; however, our psychometric analyses unequivocally support this decision, and the nine-item scale demonstrated robust psychometric properties across multiple validation criteria. Future research should aim to: (i) replicate these findings in more representative Turkish samples that include adequate representation of older adults, lower education groups, and diverse geographic regions; (ii) conduct external validation studies in independent clinical samples to establish predictive validity for actual healthcare utilization using objective data sources such as medical records or insurance claims; (iii) examine temporal stability through test-retest designs; and (iv) test culturally adapted rewording of Item 5 to determine whether alternative phrasings can capture minimizing preferences while maintaining cross-cultural comparability with the original 10-item MMS.
Conclusion
The bifactor structure identified for the nine-item Turkish Medical Maximizer–Minimizer Scale supports the multidimensional nature of maximizing–minimizing preferences and contributes to the evaluation of this construct across cultural contexts. By distinguishing between the Generalist View, reflecting abstract orientations toward medical intervention, and the Individualist View, capturing more concrete healthcare-seeking tendencies, the Turkish MMS offers a nuanced measurement framework that extends beyond unidimensional representations. These findings address an important gap in the assessment of healthcare preferences in Türkiye and provide a validated basis for future research examining behavioral variation in healthcare use. Based on bifactor diagnostics indicating that the general factor accounts for less than half of the common variance, we recommend a multidimensional scoring approach: researchers should report both the total score to capture overall maximizing-minimizing orientation and the Generalist View subscale score (Items 1–4) as a reliable standalone indicator, while the Individualist View subscale should be interpreted in conjunction with the total score rather than independently.
From an applied perspective, the Turkish MMS may function as a descriptive tool to support research on patient–physician communication, shared decision-making, and healthcare utilization patterns, particularly in primary care and preventive settings. However, implications for clinical intervention and policy development should be interpreted cautiously, as the present study does not directly test implementation strategies. Future longitudinal and comparative studies are needed to evaluate the stability, predictive validity, and cross-system generalizability of maximizing–minimizing preferences, as well as the effectiveness of tailored communication or decision-support approaches.
Abbreviations
AGFI, Adjusted Goodness of Fit Index; AIC, Akaike Information Criterion; AVE, Average Variance Extracted; BIC, Bayesian Information Criterion; CAIC, Consistent Akaike Information Criterion; CFA, Confirmatory Factor Analysis; CFI, Comparative Fit Index; CI, Confidence Interval; CR, Composite Reliability; CT, Computed Tomography; EBIC, Extended Bayesian Information Criterion; ECV, Explained Common Variance; ECVI, Expected Cross-Validation Index; EFA, Exploratory Factor Analysis; EGA, Exploratory Graph Analysis; EQ-5D-5L, EuroQol-5 Dimension-5 Level; EQ-VAS, EuroQol Visual Analog Scale; GFI, Goodness of Fit Index; GLASSO, Graphical Least Absolute Shrinkage and Selection Operator; GS, General Scale; GV, Generalist View; ICC, Intraclass Correlation Coefficient; IFI, Incremental Fit Index; IV, Individualist View; MMS, Medical Maximizer-Minimizer Scale; NFI, Normed Fit Index; OECD, Organization for Economic Co-operation and Development; PGFI, Parsimony Goodness of Fit Index; PUC, Percentage of Uncontaminated Correlations; RFI, Relative Fit Index; RMSEA, Root Mean Square Error of Approximation; SD, Standard Deviation; SMD, Standardized Mean Difference; SRMR, Standardized Root Mean Square Residual; SSI, Social Security Institution; TEFI, Total Entropy Fit Index; TLI, Tucker-Lewis Index.
Funding
The Article Processing Charge (APC) for this publication was partially supported by Acibadem Mehmet Ali Aydınlar University under its institutional open access publication support program. The funder had no role in the study design, data collection and analysis, decision to publish, or preparation of the manuscript.
Disclosure
The authors report no conflicts of interest in this work.
References
1. Yılmaz S, Boz C, Özsarı SH, et al. Effects of neurological disorders on health expenditure and economic output: dynamic panel analysis for OECD countries. Systems. 2025;13(7):521. doi:10.3390/systems13070521
2. Sorenson C. Medical technology as a key driver of rising health expenditure: disentangling the relationship. Clinicoecon Outcomes Res. 2013;223. doi:10.2147/CEOR.S39634
3. Rahman FF. Indonesia’s healthcare landscape: embracing innovation in the new health regime. Curr Med Res Opin. 2024;40:929–24. doi:10.1080/03007995.2024.2349732
4. Shah SA, Safian N, Ahmad S, et al. Unmet healthcare needs among elderly Malaysians. J Multidiscip Healthc. 2021;14:2931–2940. doi:10.2147/JMDH.S326209
5. Guasoni P, Huang Y-J. Consumption, investment and healthcare with aging. Finance Stoch. 2019;23(2):313–358. doi:10.1007/s00780-019-00383-6
6. Oakes AH, Radomski TR. Reducing low-value care and improving health care value. JAMA. 2021;325(17):1715. doi:10.1001/jama.2021.3308
7. Saini V, Brownlee S, Elshaug AG, et al. Addressing overuse and underuse around the world. Lancet. 2017;390(10090):105–107. doi:10.1016/S0140-6736(16)32573-9
8. Hofmann B. Addressing the overuse-underuse paradox in healthcare. Med Health Care Philos. 2025;28:679–92.doi:10.1007/s11019-025-10287-2
9. Elshaug AG, Rosenthal MB, Lavis JN, et al. Levers for addressing medical underuse and overuse: achieving high-value health care. Lancet. 2017;390(10090):191–202. doi:10.1016/S0140-6736(16)32586-7
10. Ellen ME, Wilson MG, Vélez M, et al. Addressing overuse of health services in health systems: a critical interpretive synthesis. Health Res Policy Syst. 2018;16:48. doi:10.1186/s12961-018-0325-x
11. Ellenbogen MI, Wiegand AA, Austin JM, et al. Reducing overuse by healthcare systems: a positive deviance analysis. J Gen Intern Med. 2023;38(11):2519–2526. doi:10.1007/s11606-023-08060-3
12. Shaik T, Mahmood R, Kanagala SG, et al. Lab testing overload: a comprehensive analysis of overutilization in hospital-based settings. Bayl Univ Med Cent Proc. 2024;37:312–316. doi:10.1080/08998280.2023.2288788
13. Kim DD, Fendrick AM. Projected savings from reducing low-value services in medicare. JAMA Health Forum. 2025;6:e253050. doi:10.1001/jamahealthforum.2025.3050
14. Zhang Y, Liu Y, Luo Z, et al. The effect of overuse by primary healthcare institutions on medical expenses: an empirical study from the western regions of China. Front Public Health. 2025;13:1588806.doi:10.3389/fpubh.2025.1588806
15. Glasziou P, Straus S, Brownlee S, et al. Evidence for underuse of effective medical services around the world. Lancet. 2017;390(10090):169–177. doi:10.1016/S0140-6736(16)30946-1
16. Ferrer RA, Klein WM. Risk perceptions and health behavior. Curr Opin Psychol. 2015;5:85–89. doi:10.1016/j.copsyc.2015.03.012
17. Cho M-K, Cho Y-H. Role of perception, health beliefs, and health knowledge in intentions to receive health checkups among Young Adults in Korea. Int J Environ Res Public Health. 2022;19:13820. doi:10.3390/ijerph192113820
18. Scherer LD, Caverly TJ, Burke J, et al. Development of the medical maximizer-minimizer scale. Health Psychol. 2016;35:1276–1287. doi:10.1037/hea0000417
19. Lutter JI, Szentes B, Wacker ME, et al. Are health risk attitude and general risk attitude associated with healthcare utilization, costs and working ability? Results from the German KORA FF4 cohort study. Health Econ Rev. 2019;9:26. doi:10.1186/s13561-019-0243-9
20. Lu J, Dong Y, Zhang X, et al. The relationship between public risk preference and the underuse or overuse of preventive health services in the information age. Prev Med Rep. 2024;41:102727. doi:10.1016/j.pmedr.2024.102727
21. Djulbegovic B, Elqayam S, Dale W. Rational decision making in medicine: implications for overuse and underuse. J Eval Clin Pract. 2018;24:655–665. doi:10.1111/jep.12851
22. Groopman J, Hartzband P. Your Medical Mind: How to Decide What Is Right for You. New York: NY: Penguin; 2011.
23. Elshaug AG. Combating overuse and underuse in health care. The Common Wealth Fund. Available from: https://www.commonwealthfund.org/publications/journal-article/2017/feb/combating-overuse-and-underuse-health-care.
24. Pickles K, Scherer LD, Cvejic E, et al. Preferences for more or less health care and association with health literacy of men eligible for prostate-specific antigen screening in Australia. JAMA Network Open. 2021;4(10):e2128380. doi:10.1001/jamanetworkopen.2021.28380
25. Cinaroglu S, Çalışkan Z. Distributive pattern of health services utilization under public health reform and promotion in Turkey. Value Health Reg Issues. 2022;31:25–33. doi:10.1016/j.vhri.2022.01.005
26. Sahin A, Akici A, Aydin V, et al. Variation of antibiotic consumption and its correlated factors in Turkey. Eur J Clin Pharmacol. 2017;73(7):867–873. doi:10.1007/s00228-017-2229-z
27. Şengül H, Bulut A. Determination of the relationship between physician trust, medical mistrust, and self-confidence in the health services provided in Turkey. J Hum Sci. 2020;17:1222–1234. doi:10.14687/jhs.v17i4.6095
28. Bilgin N, Kutlu A. Turkish validity and reliability of the individual cultural values scale on nurses. J Res Nurs. 2022;27:467–477. doi:10.1177/17449871211045220
29. DiLorenzo TA, Dornelas EA, Fischer EH. Predictive validity of the attitudes toward medical help-seeking scale. Prev Med Rep. 2015;2:146–148. doi:10.1016/j.pmedr.2015.02.004
30. Ghosal J, Dutta A, Kshatri JS, et al. Development, validation & pilot testing of a questionnaire to assess healthcare seeking behaviour, healthcare service utilization & out-of-pocket expenditure of particularly vulnerable tribal groups of Odisha, India. Indian J Med Res. 2023;157:412–420. doi:10.4103/ijmr.ijmr_3570_21
31. Kıraç R, Öztürk YE. Health seeking behavior: scale development study. Süleyman Demirel Üniversitesi Vizyoner Dergisi. 2021;12:224–234. doi:10.21076/vizyoner.754526
32. Lai F, Pei L, Yue S, et al. Translation and validation of the Chinese version of medical maximizer-minimizer scale: a cross-sectional study. BMJ Open. 2021;11:e042432. doi:10.1136/bmjopen-2020-042432
33. Tinghög G, Strand L. Medical decision style and COVID-19 behavior. Med Decis Mak. 2022;42:776–782. doi:10.1177/0272989X221079354
34. Beaton DE, Bombardier C, Guillemin F, et al. Guidelines for the process of cross-cultural adaptation of self-report measures. Spine. 2000;25(24):3186–3191. doi:10.1097/00007632-200012150-00014
35. Sousa VD, Rojjanasrirat W. Translation, adaptation and validation of instruments or scales for use in cross‐cultural health care research: a clear and user‐friendly guideline. J Eval Clin Pract. 2011;17:268–274. doi:10.1111/j.1365-2753.2010.01434.x
36. Turkish Statistical Institute. Yaşam Memnuniyeti Araştırması. Republic of Türkiye, Turkish Statistical Institute; 2024. Available from: https://data.tuik.gov.tr/Bulten/Index?p=Yasam-Memnuniyeti-Arastirmasi-2024-53785.
37. Turkish Statistical Institute. Türkiye Health Survey, 2022. Republic of Türkiye, Turkish Statistical Institute; 2022. Available from: https://data.tuik.gov.tr/Bulten/Index?p=Turkiye-Saglik-Arastirmasi-2022-49747.
38. Herdman M, Gudex C, Lloyd A, et al. Development and preliminary testing of the new five-level version of EQ-5D (EQ-5D-5L). Qual Life Res. 2011;20:1727–1736. doi:10.1007/s11136-011-9903-x
39. UNESCO. Youth. Available from: https://www.unesco.org/en/youth.
40. Chen FF. Sensitivity of goodness of fit indexes to lack of measurement invariance. Struct Equation Model. 2007;14:464–504. doi:10.1080/10705510701301834
41. Aydin GZ, Özer Ö, Özkan O. Examination of health-seeking behavior, e-health literacy, and successful aging in older people. J Hum Behav Soc Environ. 2025;35:366–376. doi:10.1080/10911359.2024.2302498
42. Iya-Benson JN, Ukweh IH, Ukweh ON, Oku AO. Comparative assessment of health status and health-seeking behaviour of household heads in Rural and Urban Areas of Abia State, Nigeria. Texila Int J Public Health. 2024;12:1–12.
43. Reise SP, Moore TM, Haviland MG. Bifactor models and rotations: exploring the extent to which multidimensional data yield univocal scale scores. J Pers Assess. 2010;92:544–559. doi:10.1080/00223891.2010.496477
44. Reise SP, Bonifay WE, Haviland MG. Scoring and modeling psychological measures in the presence of multidimensionality. J Pers Assess. 2013;95:129–140. doi:10.1080/00223891.2012.725437
45. Taghikhah FR, Jabbari A, Desouza KC, et al. Understanding delayed diabetes diagnosis: an agent-based model of health-seeking behavior. Med Decis Mak. 2025;45:399–425. doi:10.1177/0272989X251326908
46. Sheeran P, Webb TL, Gollwitzer PM, et al. Self-regulation of affect-health behavior relations. In: Affective Determinants of Health Behavior. Oxford University Press; 2018:90–114.
47. Mott N, Wang T, Miller J, et al. Medical maximizing–minimizing preferences in relation to low-value services for older women with hormone receptor-positive breast cancer: a qualitative study. Ann Surg Oncol. 2021;28(2):941–949. doi:10.1245/s10434-020-08924-6
48. Evron JM, Reyes-Gastelum D, Banerjee M, et al. Role of patient maximizing-minimizing preferences in thyroid cancer surveillance. J clin oncol. 2019;37(32):3042–3049. doi:10.1200/JCO.19.01411
49. Sørensen K, Levin-Zamir D, Duong TV, et al. Building health literacy system capacity: a framework for health literate systems. Health Promot Int. 2021;36(Supplement_1):i13–i23. doi:10.1093/heapro/daab153
50. Rangan V. Influence of social factors on health behavior. In: Behavioral Economics and Neuroeconomics of Health and Healthcare. 2024:153–180.
51. Chiu AS, Hoxha I, Jensen CB, et al. Medical maximizing preferences and beliefs about cancer among US adults. JAMA Network Open. 2024;7(6):e2417098. doi:10.1001/jamanetworkopen.2024.17098
52. Smith KT, Monti D, Mir N, et al. Access is necessary but not sufficient: factors influencing delay and avoidance of health care services. MDM Policy Pract. 2018;3(1). doi:10.1177/2381468318760298
53. Scherer LD, Kullgren JT, Caverly T, et al. Medical maximizing-minimizing preferences predict responses to information about prostate-specific antigen screening. Med Decis Mak. 2018;38(6):708–718. doi:10.1177/0272989X18782199
54. Hoffmann TC, Del Mar C. Clinicians’ expectations of the benefits and harms of treatments, screening, and tests. JAMA Intern Med. 2017;177(3):407. doi:10.1001/jamainternmed.2016.8254
55. Scherer LD, Zikmund-Fisher BJ. Eliciting medical maximizing-minimizing preferences with a single question: development and validation of the MM1. Med Decis Mak. 2020;40(4):545–550. doi:10.1177/0272989X20927700
56. Zhu W. Which should it be called: convergent validity or discriminant Validity? Res Q Exerc Sport. 2000;71(2):190–194. doi:10.1080/02701367.2000.10608897
57. Clark LA, Watson D. Constructing validity: basic issues in objective scale development. In:Methodological Issues and Strategies in Clinical Research.
58. Ünal E, Yılmaz S. Healthcare sector dynamics in Turkey (2002–2022): trends, breakpoints, and policy implications (Privatization in the Hospital Sector). Healthcare. 2025;13(6):622. doi:10.3390/healthcare13060622
59. Protzko J. Invariance: what does measurement invariance allow us to claim? Educ Psychol Meas. 2025;85(3):458–482. doi:10.1177/00131644241282982
60. Vandenberg RJ, Lance CE. A review and synthesis of the measurement invariance literature: suggestions, practices, and recommendations for organizational research. Organ Res Methods. 2000;3(1):4–70. doi:10.1177/109442810031002
61. Goetz C, Coste J, Lemetayer F, et al. Item reduction based on rigorous methodological guidelines is necessary to maintain validity when shortening composite measurement scales. J Clin Epidemiol. 2013;66(7):710–718. doi:10.1016/j.jclinepi.2012.12.015
 © 2026 The Author(s). This work is published and licensed by Dove Medical Press Limited. The
full terms of this license are available at https://www.dovepress.com/terms
and incorporate the Creative Commons Attribution
- Non Commercial (unported, 4.0) License.
By accessing the work you hereby accept the Terms. Non-commercial uses of the work are permitted
without any further permission from Dove Medical Press Limited, provided the work is properly
attributed. For permission for commercial use of this work, please see paragraphs 4.2 and 5 of our Terms.
© 2026 The Author(s). This work is published and licensed by Dove Medical Press Limited. The
full terms of this license are available at https://www.dovepress.com/terms
and incorporate the Creative Commons Attribution
- Non Commercial (unported, 4.0) License.
By accessing the work you hereby accept the Terms. Non-commercial uses of the work are permitted
without any further permission from Dove Medical Press Limited, provided the work is properly
attributed. For permission for commercial use of this work, please see paragraphs 4.2 and 5 of our Terms.