Back to Journals » Journal of Multidisciplinary Healthcare » Volume 16
Psychometric Evaluation of the Grit Psychological Resources Scale (GPRS)
Authors Schimschal SE ![]() , Cleary M, Kornhaber RA
, Cleary M, Kornhaber RA ![]() , Barnett T, Visentin DC
, Barnett T, Visentin DC ![]()
Received 15 December 2022
Accepted for publication 16 March 2023
Published 5 April 2023 Volume 2023:16 Pages 913—925
DOI https://doi.org/10.2147/JMDH.S401652
Checked for plagiarism Yes
Review by Single anonymous peer review
Peer reviewer comments 3
Editor who approved publication: Dr Scott Fraser
Sarah E Schimschal,1 Michelle Cleary,2 Rachel A Kornhaber,3 Tony Barnett,1 Denis C Visentin4
1Centre for Rural Health, School of Health Sciences, University of Tasmania, Launceston, Tasmania, Australia; 2School of Nursing, Midwifery & Social Sciences, CQUniversity, Sydney, New South Wales, Australia; 3School of Nursing, University of Tasmania, Sydney, New South Wales, Australia; 4School of Health Sciences, University of Tasmania, Sydney, New South Wales, Australia
Correspondence: Sarah E Schimschal, Centre for Rural Health, School of Health Sciences, Locked Bag 1322, Launceston, Tasmania, 7250, Australia, Email [email protected]
Background: Psychological resources have been shown to play a prominent role in buffering against stress and are associated with various positive constructs, including grit, defined as having the disposition to pursue long-term goals with both passion and perseverance.
Objective: The objective of this study was to validate a new scale developed to measure the psychological resources of grit.
Methods: A quantitative research study was conducted online with an international sample of 277 adults from a range of professional backgrounds. The psychometric properties of the 20-item Grit Psychological Resources Scale (GPRS) were evaluated by performing tests of reliability and validity.
Results: Reliability tests provided evidence of high internal consistency (α = 0.91) and test–retest reliability (r = 0.75). Demographic variables did not significantly predict scores or influence survey completion. Face, content and convergent validity provided additional psychometric support for the GPRS with this sample. Confirmatory factor analysis results supported a second-order model with four sub-scales. The first-order factors loaded highly onto the second-order factor, with correlations ranging from 0.80 to 0.97.
Conclusion: The GPRS showed satisfactory psychometric properties, indicating that the scale is a reliable and valid instrument for measuring the psychological resources of grit. This scale can be used to identify more targeted developmental approaches for personal and professional growth. Further, the tool enables information to be gathered on changes pre- and post-improvement initiatives to assess their effectiveness in training and continuing education.
Keywords: grit, psychological resources, psychometrics, reliability, validity, factor analysis
Introduction
Grit is defined as the consistent pursuit of long-term goals, despite setbacks, adversity and challenges.1 Favourable outcomes are thought to be associated with one’s consistency of interest (passion) and perseverance of effort (perseverance) toward higher-order goals.2 Grittier individuals are adept at realigning lower-order activities and plans to facilitate the achievement of desired outcomes, often many years later. People with high levels of grit are reported to experience less stress and burnout, greater job satisfaction and retention,3,4 and improved capacity for positive leadership.5 As individuals, businesses, and the larger global community navigate the post-COVID-19 era, goal-oriented capabilities are increasingly important for recovery from psychosocial and economic impact.6,7 Recent studies have raised questions regarding the predictive value of grit, especially concerning the passion facet.8,9 These findings suggest that more work is needed to better understand the construct, its predictors and effects. In contrast, other studies support the construct,10,11 indicating a need to consider the psychological resources of grit and influence on passion and perseverance.
Psychological resources include personal characteristics, such as attributes (self-determination and optimism) and skills (communication and problem solving), that are valued and conserved or expanded to help buffer against stress.12 In addition to providing a protective role, psychological resources can enhance health and wellbeing.13 In the context of grit, psychological resources may enhance people’s ability to better cope with stressful situations and find multiple pathways to persevere with their passions, rather than giving up or changing directions as seen in less gritty people.14 People with more resources are also likely to be well received in the workplace, as businesses work to strengthen their resolve against future health and economic challenges.15 As such, research on identifying and measuring psychological resources that can contribute to higher levels of grit has significant practical implications. For example, resources may help people persevere at work and with career goals in industries that place complex demands on professionals, such as healthcare and nursing.16
Informed by Duckworth’s17 previous work on grit, which identified four psychological resources of grit, interest, purpose, practice and hope, the authors have proposed a model outlining sixteen attributes associated with these resources.18 Although there are many scales that measure the attributes of interest, in general these instruments assess the concepts broadly and do not specifically assess behaviour in the context of grit. Thus, a new scale called the Grit Psychological Resources Scale, or GPRS, was developed by the authors. The intent of the GPRS is to assess the extent to which an individual has accumulated psychological resources of grit.
Construction of the GPRS scale is detailed in a previous paper.19 Two extensive literature reviews on grit and related concepts provided the theoretical and conceptual framework. Namely, a concept analysis of grit was performed to identify attributes, antecedents and consequences of grit.20 The results of this concept analysis informed the development of an integrated model for the psychological resources of grit.18 Definitions and behavioural descriptions for the model elements were then generated and used to create a pool of potential scale items. Insights were also elicited from existing scales on wording, instructions and response options. The Delphi technique was then used with a panel of 30 experts to evaluate 100 items for content and face validity. Over a series of three online surveys, the expert panel rated and agreed on 20 items for the final GPRS.19 The aim of this study was to evaluate the psychometric properties of the GPRS.
Method
A quantitative study was conducted with adults aged 18 years and over. Participants completed online surveys at two time points, three months apart, between December 2020 and May 2021. The data collected was used to perform psychometric testing of the GPRS, including internal consistency, test–retest reliability, regression analyses, convergent validity and confirmatory factor analysis. The study complies with the Declaration of Helsinki and was approved by the University of Tasmania Social Sciences Human Research Ethics Committee, reference number S0023721 (H-72893).
Participants
Participants were invited to take part in the study through the first author’s professional networks, social media platforms, online communities, emails and snowball sampling techniques (people sharing pages and posts). The study aimed to recruit the recommended sample size of 10 respondents for each scale item, which equated to at least 200 participants.21 Study invitations included an internet link that directed people to the first online survey stored in a secure web-based application (REDCap 12.4.8). All participants were required to be over 18 years old and received an information sheet about the study and the option to have any questions answered before providing informed consent to participate.
Data Collection
The surveys set up in REDCap required participants to answer each question before proceeding to the next question, thus reducing the chance of missing data. In the first survey, participants were asked to answer demographic questions for group-level analysis, the GPRS, and four additional scales selected to test convergent validity. Three months later, participants were asked to complete the GPRS to assess test–retest reliability.
Measures
The questionnaire battery consisted of the GPRS and four other scales associated with the nomological network of the psychological resources of grit.
Grit Psychological Resources Scale (GPRS)
The GPRS consists of 20 positively worded items with four sub-scales: interest, purpose, practice, and hope. The following instructions for completion of the scale were provided:
For the statements below, indicate your level of agreement on the scale provided. When responding, consider your behaviour in general. Think about current behaviour – not how you think you should or want to be. If your behaviour is considerably different at work, select the response that best reflects you outside work. There are no right or wrong answers.
The response options were “1 = very strongly disagree”, “2 = strongly disagree”, “3 = disagree”, “4 = neutral”, “5 = agree”, “6 = strongly agree”, and “7 = very strongly agree”. Psychometric properties of the GPRS are reported in the present paper.
Passion Scale
The Passion Scale is a 17-item scale that assesses harmonious passion (HP) and obsessive passion (OP).22 There are six items for each subscale of passion and five items to identify the presence of passion. For example, “This activity is in harmony with the other activities in my life” (HP), “I have difficulties controlling my urge to do my activity” (OP), and “I spend a lot of time doing this activity” (presence of passion). Responses are made on a 7-point Likert scale ranging from 1 (do not agree at all) to 7 (very strongly agree). Vallerand et al's22 original paper reported acceptable levels of reliability in four studies, with Cronbach’s alpha values ranging from 0.71 to 0.84 and 0.85 to 0.92 for the HP and OP sub-scales, respectively. Good psychometric properties were also reported for this scale across different languages and in the context of various activities in data from 19 studies.23
Multidimensional Persistence Scale (MPS)
The MPS is a 13-item scale that assesses three dimensions of persistence: persistence despite difficulty (PDD; eg, “I keep on going when the going gets tough”), persistence despite fear (PDF; eg, “I tend to face my fears”), and inappropriate persistence (IP; eg, “Sometimes I find myself continuing to do something, even when there is no point in carrying on”).24 Responses are made on a 7-point Likert scale ranging from 1 (strongly disagree) to 7 (strongly agree). The MPS demonstrated acceptable reliability, with Cronbach’s alpha values for the PDD, PDF and IP sub-scales of 0.85, 0.93, and 0.76, respectively.24
Life Engagement Test (LET)
The LET is a 6-item scale that assesses purpose in life; eg, “To me, the things I do are all worthwhile”.25 Responses are made on a 5-point Likert scale ranging from 1 (strongly disagree) to 5 (strongly agree). Psychometric evaluation found the LET to be stable across gender, age, ethnicity, and time. Cronbach’s alpha values were satisfactory, ranging from 0.72 to 0.87 across eight samples.25
Hope Scale
The Hope Scale, labelled The Future Scale for administration purposes, is a 12-item scale that assesses hope in terms of a person’s sense of successful agency (eg, “I energetically pursue my goals”) and pathways (eg, “I can think of many ways to get out of a jam”) to achieve goals.26 Responses are made on an 8-point Likert scale ranging from 1 (definitely false) to 8 (definitely true). Testing of The Hope Scale across six samples yielded acceptable results for reliability, with Cronbach’s alpha values ranging from 0.74 to 0.84 for total scores and 0.71 to 0.76 and 0.63 to 0.80 for the agency and pathway sub-scales, respectively.26
Statistical Analyses
SPSS for Mac 28.0 was used to perform all statistical analyses, except for CFA, which was conducted using Stata/BE 17.0 for Mac. Before conducting analyses, data were screened for errors and the distribution of scores, including normality. Additionally, total scores were calculated, and the age and country demographic variables collapsed into groups. The psychometric properties of the GPRS were examined using several tests for reliability and validity. Cronbach’s alpha was used for internal consistency.27 An alpha coefficient of 0.70 is considered acceptable; however, above 0.80 is preferred for the psychometric evaluation of scales.28 Test–retest reliability was assessed using the Pearson’s r correlation, with higher values indicating higher reliability.29 Regression tests assessed if demographic variables influenced GPRS score and survey completion.
Content and face validity were established during scale construction. A theoretical model for the psychological resources of grit informed construction of the initial bank of items. Content validation was strengthened by a Delphi study whereby 30 experts rated items for inclusion in the GPRS according to the extent to which statements reflected the domains of interest; ie, psychological resources. The Delphi process also provided evidence of face validity. Readability was assessed using the Microsoft Word for Mac version 16.46. Flesch Reading Ease scores between 70 and 80 are acceptable for the adult general public and a Flesch-Kincaid Grade Level of 8 indicates the text can be understood by 13 to 14-year-olds.30 The Pearson’s r correlation was used to assess the relationship between other scales that measure conceptually similar concepts, with higher correlations considered evidence for convergent validity.31
Confirmatory factor analysis (CFA) was also conducted to examine scale validity. For scale development, exploratory factor analysis (EFA) can be used to establish the latent structure before verifying the relationship with CFA. However, given that the factor structure for the GPRS was established in prior theoretical and empirical studies (conceptual model and Delphi study), only CFA was performed.32 The following fit indices and thresholds were used to evaluate models:
- Chi-square test (X2), non-significant p-values suggest good fit.33
- Root mean square error of approximation (RMSEA), values ≤0.08 indicates reasonable fit34 and 0.08–0.10 indicates mediocre fit.35
- Akaike information criterion (AIC)36 and Bayesian information criterion (BIC),37 smaller values are considered better fit.
- Comparative fit index (CFI)38 and Tucker-Lewis index (TLI),39 values ≥0.90 considered acceptable fit.
- Standardized root mean squared residual (SRMR),40 values close to 0.08 suggest good fit.
- Factor loadings of ≥0.32 can be interpreted, ≥0.45 fair, ≥0.55 good, ≥0.63 very good, ≥0.71 excellent.41,42 A cut-off of 0.3 was used in this study to retain items.
Results
Sample Characteristics
A total of 277 participants completed the first survey, and of these, 173 completed the second survey three months later (retention rate = 62.5%). Table 1 shows the demographic characteristics of the participants completing the first survey. Over half of participants (61%) were aged between 40 and 59 years (mean age = 47.2, SD 11.7) and three-quarters (77%) were female. Participants who were employed (240) worked in various industries, with over one-third in education and training (35%), with others in professional, scientific and technical services (19%), and healthcare and social assistance (14%). Nearly two-thirds of participants held postgraduate qualifications (60%), followed by undergraduate (24%) and vocational (11%). Of those currently undertaking study (98), most were pursuing postgraduate qualifications (61%). Participants were located in 37 countries across seven geographic regions, with the highest proportion (61%) residing in Oceania. Table 2 shows the descriptive statistics of the scales used in this study.
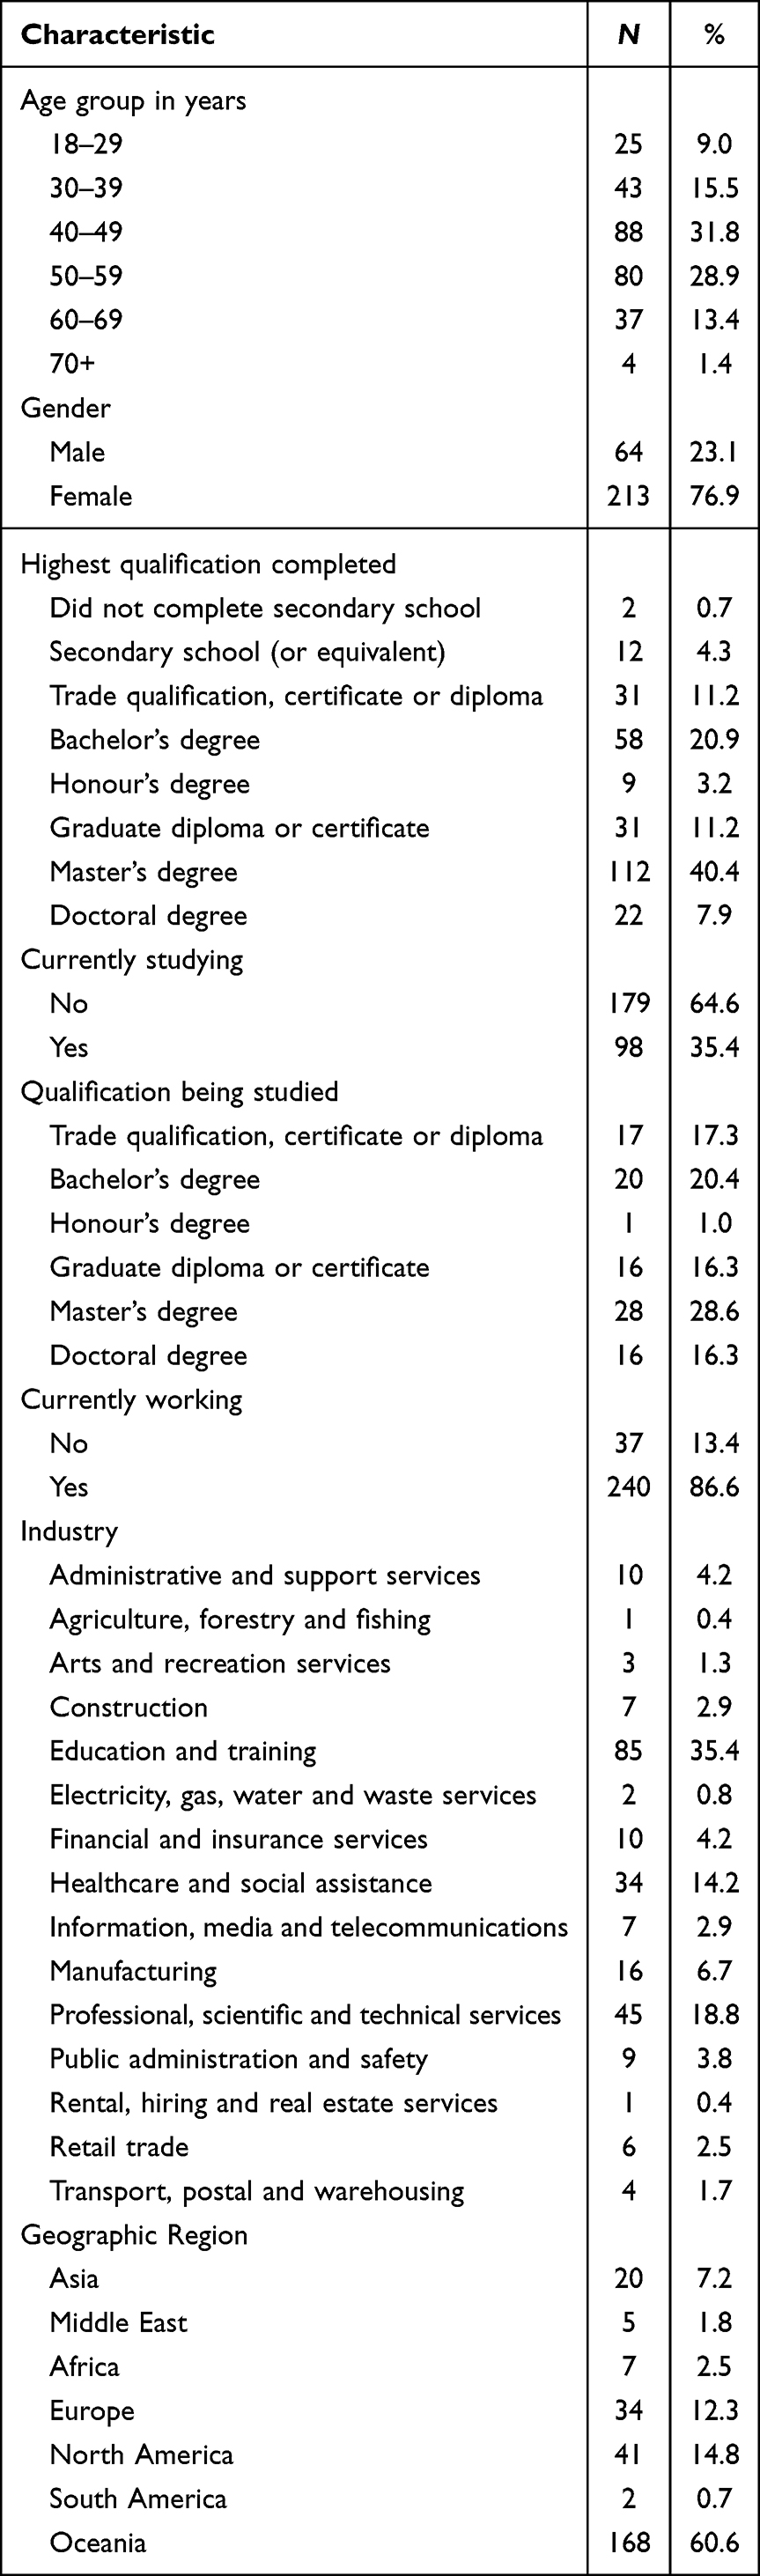 |
Table 1 Participant Demographics |
 |
Table 2 Descriptive Statistics of the Study Scales (N = 277) |
Reliability
Table 3 presents the means and standard deviations for each item of the GPRS. The Cronbach’s alpha was 0.906 (0.909 for survey 2), suggesting very good internal consistency.28 Of the 277 participants who completed the first survey, 173 (66%) also completed a second survey three months later. The Pearson’s r correlation coefficient between Time 1 and Time 2 was 0.75, p = < 0.001, providing evidence of test–retest reliability.29
 |
Table 3 GPRS Items, Means and Standard Deviations |
Table 4 shows results of linear regression analyses predicting GPRS score based on age, gender and qualification. Univariate linear regression showed that age did not significantly predict GPRS score on the first survey (Β = 0.004, p > 0.05). Likewise, there was no significant relationship with gender (Β = 0.052, p > 0.05) or qualification (Β = 0.100, p > 0.05). Multivariate linear regression yielded similar results to the univariate analyses, F (3, 273) = 1.22, p > 0.05.
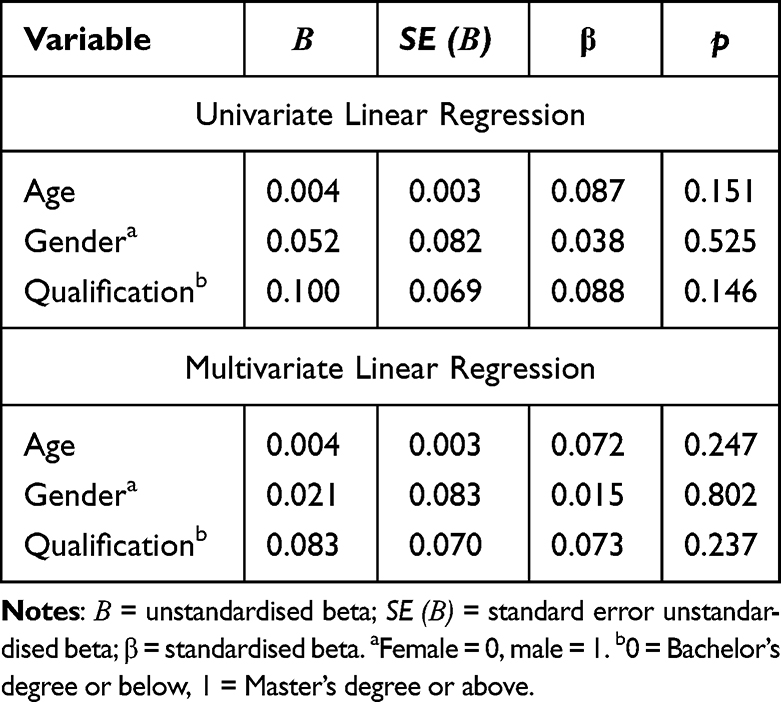 |
Table 4 Univariate and Multivariate Linear Regression Analyses Predicting GPRS Score Based on Age, Gender and Qualification (N = 277) |
Table 5 presents results of logistic regression analyses predicting likelihood of completing the second survey based on age, gender and qualification. Univariate logistic regression did not reveal any significant association with age (OR = 1.01, p > 0.05) or gender (OR = 0.78, p > 0.05) on completion of the second survey. The odds of completing the second survey for participants who had completed a Master’s degree or above was 1.57 (95% CI, 0.96 to 2.57) times that of those with a Bachelor’s degree or below, although the result was not significant. Multivariate logistic regression yielded similar results to univariate analyses, X2 (3, N = 277) = 5.92, p > 0.05, including the predictive effect of qualification (OR = 1.59). Results from the regression analyses provide further support for scale reliability.
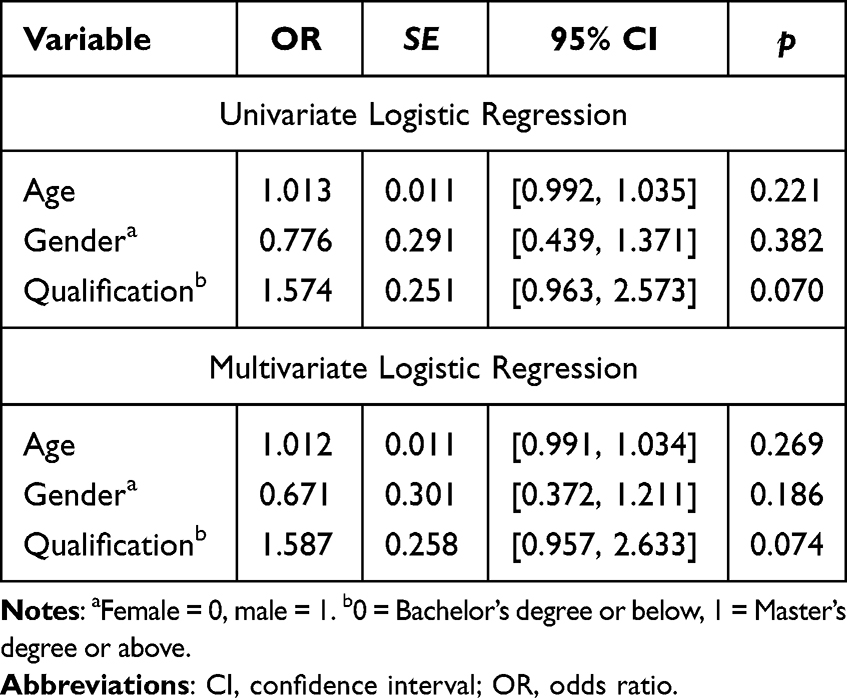 |
Table 5 Univariate and Multivariate Logistic Regression Analyses Predicting Likelihood of Completing the Second Survey Based on Age, Gender and Qualification (N = 277) |
Validity
Content validity and face validity were established during the development of the GPRS, with experts agreeing on the final scale items. The Flesch Reading Ease score was 55.8 and the Flesch-Kincaid Grade Level was 8.1, which indicates that adults in the general public should understand the scale.30 There were positive moderate correlations (Pearson’s r) between the GPRS and the passion (r = 0.34), persistence (r = 0.49), LET (r = 0.51) and hope scales (r = 0.67). All correlations were statistically significant demonstrating convergent validity (see Table 6).
 |
Table 6 Pearson’s r Correlations Between Scales That Measure Similar Constructs (N = 277) |
Confirmatory Factor Analysis
Nine model variations that the data could meet were selected and tested, including first, second and third-order models as follows:
- Model 1 was a first-order model with five items loading onto each of four factors (interest, purpose, practice, and hope). The factors were allowed to correlate with each other.
- Model 2 was a first-order model with ten items loading onto each of two factors (passion and perseverance). The factors were allowed to correlate with each other.
- Model 3 was a first-order model with all the items loaded onto one factor (grit psychological resources).
- Model 4 was a second-order model with four first-order factors (interest, purpose, practice, and hope; five items loaded onto each factor) and one second-order factor (grit psychological resources). The first-order factors were allowed to correlate with each other.
- Model 5 was a second-order model with two first-order factors (passion and perseverance; 10 items loaded onto each factor) and one second-order factor (grit psychological resources). The first-order factors were allowed to correlate with each other.
- Model 6 was a third-order model with four first-order factors (interest, purpose, practice, and hope; five items loaded onto each factor), two second-order factors (passion and perseverance) and one third-order factor (grit psychological resources). The first-order factors were allowed to correlate with each other. The two second-order factors were also allowed to correlate with each other.
- Model 7 was a second-order model with four first-order factors (interest, purpose, practice, and hope; five items loaded onto each factor) and one second-order factor (grit psychological resources).
- Model 8 was a second-order model with two first-order factors (passion and perseverance; 10 items loaded onto each factor) and one second-order factor (grit psychological resources).
- Model 9 was a third-order model with four first-order factors (interest, purpose, practice, and hope; five items loaded onto each factor), two second-order factors (passion and perseverance) and one third-order factor (grit psychological resources).
Table 7 shows the fit indices for models 1, 2, 3 and 7. The other five models did not converge, indicating they did not fit the data. All the first-order models (1, 2 and 3) and one second-order model (7) showed acceptable SRMR values. The RMSEA values for the four models compared for fit fell within the average range. However, SRMR values arguably yield more accurate rejection rates.43 The AIC and BIC values were similar, with the lowest values preferred (model 1 and 7). Likewise, the CFI and TFI values did not vary much between models and were below the suggested cut-off. Overall, when considering both the theoretical and conceptual background for this research, model 7 is the preferred model.
 |
Table 7 Confirmatory Factor Analysis Fit Indices for the GPRS (N = 277) |
Figure 1 shows the standardised factor loadings and error variances of model 7. The factor loadings for items were all ≥0.49, with only one exception (0.3), 15 (75%) were >0.55 and 10 (50%) were ≥0.63. Loadings onto respective factors ranged from 0.49 to 0.63 for interest, 0.30 to 0.85 for purpose, 0.64 to 0.68 for practice, and 0.54 to 0.63 for hope. The loadings between the first-order factors and second-order factor were high: 0.90 for interest, 0.80 for purpose, 0.97 for practice, and 0.91 for hope. These findings provide further psychometric support for the second-order model, which yields a total score with four sub-scales.
 |
Figure 1 Confirmatory factor analysis: the preferred model (Model 7). |
Scoring and Interpretation
The average grit psychological resources (GPR) score is calculated by summing all the statement responses and dividing the total by 20. Possible scores range from 1 to 7 and indicate the GPR level as follows:
- Score of less than 2 indicates very low GPR = level 1, undeveloped.
- Score of 2 to less than 3 indicates low GPR = level 2, foundational.
- Score of 3 to less than 4 indicates low-moderate GPR = level 3, intermediate.
- Score of 4 to less than 5 indicates moderate-high GPR = level 4, developed.
- Score of 5 to less than 6 indicates high GPR = level 5, well-developed.
- Score of 6 to 7 indicates very high GPR = level 6, advanced.
The score levels and descriptors may be used to provide feedback on current GPR status and articulate meaningful changes over time.
The average subscale scores are calculated by summing the statement responses for each psychological resource and dividing the total by 5: statements 1 to 5 for interest, statements 6 to 10 for purpose, statements 11 to 15 for practice, and statements 16 to 20 for hope. Subscale scores can be interpreted similarly to the GPR score and used to provide more detailed information on developmental opportunities. In addition, given that one’s perceived GPR may be influenced by the surrounding environment, separate instructions have been developed for administering the scale in the workplace. At a workplace level, respondents can answer from an individual perspective (ie, behaviour when doing work that contributes to individual goals) or team perspective (ie, behaviour when doing work that contributes to team goals).
Discussion
This study aimed to evaluate the psychometric properties of the GPRS. Evidence of reliability was supported by two primary types of evidence: internal consistency and test–retest reliability.44 The GPRS showed high internal consistency.28 Evidence of test–retest reliability was also established, indicating that scores are stable across time.29 Further evidence of scale reliability was sought by considering the potential influence of demographic variables via standard multiple regression and logistic regression. Age, gender and qualification did not significantly predict scores or influence the completion of the second survey. However, a more heterogeneous sample may have yielded different results and should be explored in future studies.45 Taken together, the tests of reliability indicate that the GPRS is stable and consistent; ie, measuring the variables as intended.44
Evidence of validity was supported by several types of evidence including scale content (face and content validity), item response processes (reading ease and understandability), association with other instruments (convergent validity), internal structure (CFA), and interpretation of scale scores.44 Three previous studies established the theoretical and conceptual basis for creation of the GPRS, and face and content validity. The Flesch reading ease and Flesch-Kincaid grade level indicated that the scale would be suitable for general population adults.30 Additionally, analysis revealed significant moderate correlations between the GPRS with other similar scales, indicating the scale accounts for new and unique variation beyond what is already established in the current literature.46
Confirmatory factor analysis provided support for four models, with all items loading well onto their respective factors and correlations between factors suggesting a strong association. Considering the results of fit indices, together with the theoretical and conceptual background for this study, the second-order model (model 7) was superior to the other three first-order models. The preferred model has four first-order factors (interest, purpose, practice, and hope) that load onto a second-order factor (grit psychological resources). Overall, the results from the psychometric evaluation demonstrate that the GPRS is a reliable and valid instrument with which to assess the psychological resources of grit that an individual or team has accumulated.
Limitations and Future Research
The scale has only been tested on adults and the psychometric properties on children are unknown. A gold standard does not exist for measuring the psychological resources of grit, so a complete assessment of validity was not possible. The sample consisted largely of females aged between 40 and 60 with university qualifications. Thus, scores may vary with different populations. The study used self-report questionnaires to obtain information and respondents may not have answered truthfully or accurately.47 Future studies should include more heterogeneous samples, including equal representation of gender and age and more diverse educational backgrounds. The scale’s predictive, concurrent and discriminant validity could be investigated further. Finally, the scale could be translated into other languages to enable psychometric evaluation in non-English speaking countries.
Practical Implications
The GPRS provides an instrument that leaders, coaches, educators, and practitioners can easily administer to assess the level of psychological resources accumulated by an individual or team. This information can inform where to focus development efforts and, in turn, help to maximise the use of available resources for building capabilities. Furthermore, we expect this scale to be useful in understanding how the psychological resources of grit contribute to enabling more passion and perseverance for long-term goals.1 It can also be used to understand the role of psychological resources in behavioural change.48 For example, in the workplace, can they predict improved performance, and how can they influence other important metrics, including retention, engagement and culture? The scale could also inform which positive psychology interventions, such as those for character strengths49 and other development approaches like coaching,50 are suitable In addition, the scale provides some flexibility for use in teams, where team participants may complement each other’s strengths and weaknesses among the subscale scores. Finally, it can be used to gather information on the effect development initiatives are having at an individual, team and organisational level. The GPRS is publicly available for use, provided the authors and original source are correctly attributed (see Supplementary File).
Conclusion
The results of this study provide evidence for the structural stability of the 20-item GPRS. Scale development is an ongoing process and further study is required to evaluate additional types of validity. Additional testing should also involve more diverse populations. Using the GPRS with individuals or teams to assess the level of psychological resources accumulated will enable more targeted development of capabilities for goal achievement. Moreover, insights from GPRS scores can assist with evaluating personal and professional development.
Acknowledgment
The authors would like to acknowledge that this research was supported by an Australian Government Research Training Program (RTP) Scholarship.
Disclosure
The authors report no conflicts of interest in this work.
References
1. Southwick DA, Tsay C-J, Duckworth AL. Grit at work. Res Organ Behav. 2019;39:100126. doi:10.1016/j.riob.2020.100126
2. Eskreis-Winkler L, Gross J, Duckworth A. Grit: sustained self-regulation in the service of superordinate goals. In: Vohs KD, Baumeister RF, editors. Handbook of Self-Regulation: Research, Theory and Applications.
3. Dugan R, Hochstein B, Rouziou M, Britton B. Gritting their teeth to close the sale: the positive effect of salesperson grit on job satisfaction and performance. J Pers Sell Sales Manag. 2019;39(1):81–101. doi:10.1080/08853134.2018.1489726
4. Seguin C. A survey of nurse leaders to explore the relationship between grit and measures of success and well-being. Article. J Nurs Adm. 2019;49(3):125–131. doi:10.1097/NNA.0000000000000725
5. Schimschal SE, Lomas T. Gritty leaders: the impact of grit on positive leadership capacity. Psychol Rep. 2019;122(4):1449–1470. doi:10.1177/0033294118785547
6. Shah H. COVID-19 recovery: science isn’t enough to save us. Nature. 2021;591(7851):503–504. doi:10.1038/d41586-021-00731-7
7. Oldekop JA, Horner R, Hulme D, et al. COVID-19 and the case for global development. World Dev. 2020;134:105044. doi:10.1016/j.worlddev.2020.105044
8. Ponnock A, Muenks K, Morell M, Yang JS, Gladstone JR, Wigfield A. Grit and conscientiousness: another jangle fallacy. J Res Pers. 2020;89:104021. doi:10.1016/j.jrp.2020.104021
9. Credé M, Tynan MC, Harms PD. Much ado about grit: a meta-analytic synthesis of the grit literature. J Pers Soc Psychol. 2017;113(3):492–511. doi:10.1037/pspp0000102
10. Tang X, Wang M-T, Guo J, Salmela-Aro K. Building grit: the longitudinal pathways between mindset, commitment, grit, and academic outcomes. J Youth Adolesc. 2019;48(5):850–863. doi:10.1007/s10964-019-00998-0
11. Lam KKL, Zhou M. Grit and academic achievement: a comparative cross-cultural meta-analysis. J Educ Psychol. 2022;114(3):597–621. doi:10.1037/edu0000699
12. Hobfoll SE. Social and psychological resources and adaptation. Rev Gen Psychol. 2002;6(4):307–324. doi:10.1037/1089-2680.6.4.307
13. Taylor SE, Kemeny ME, Reed GM, Bower JE, Gruenewald TL. Psychological resources, positive illusions, and health. Am Psychol. 2000;55(1):99–109. doi:10.1037/0003-066X.55.l.99
14. Luthans KW, Luthans BC, Chaffin TD. Refining grit in academic performance: the mediational role of psychological capital. J Manag Educ. 2019;43(1):35–61. doi:10.1177/1052562918804282
15. de Lucas Ancillo A, Del Val Núñez MT, Gavrila SG. Workplace change within the COVID-19 context: a grounded theory approach. Econ Res Ekon Istraz. 2021;34(1):2297–2316. doi:10.1080/1331677X.2020.1862689
16. Kelly LA, Gee PM, Butler RJ. Impact of nurse burnout on organizational and position turnover. Nurs Outlook. 2021;69(1):96–102. doi:10.1016/j.outlook.2020.06.008
17. Duckworth A. Grit: The Power of Passion and Perseverance. Ebury; 2016.
18. Schimschal SE, Visentin D, Kornhaber R, Cleary M. Achieving long-term goals amidst uncertainty: an integrative model for the psychological resources of grit. J Contin Educ Nurs. 2022;53(8):355–363. doi:10.3928/00220124-20220706-06
19. Schimschal SE, Visentin D, Kornhaber R, Barnett T, Cleary M. Development of a scale to measure the psychological resources of grit in adults. Nurs Health Sci. 2022;24(3):752–763. doi:10.1111/nhs.12973
20. Schimschal SE, Visentin D, Kornhaber R, Cleary M. Grit: a concept analysis. Issues Ment Health Nurs. 2021;42(5):495–505. doi:10.1080/01612840.2020.1814913
21. Boateng GO, Neilands TB, Frongillo EA, Melgar-Quiñonez HR, Young SL. Best practices for developing and validating scales for health, social, and behavioral research: a primer. review. Front Public Health. 2018;6:1–18. doi:10.3389/fpubh.2018.00149
22. Vallerand RJ, Blanchard C, Mageau GA, et al. Les passions de l’ame: on obsessive and harmonious passion. J Pers Soc Psychol. 2003;85(4):756–767. doi:10.1037/0022-3514.85.4.756
23. Marsh HW, Vallerand RJ, Lafrenière M-AK, et al. Passion: does one scale fit all? Construct validity of two-factor passion scale and psychometric invariance over different activities and languages. Psychol Assess. 2013;25(3):796–809. doi:10.1037/a0032573
24. Howard MC, Crayne MP. Persistence: defining the multidimensional construct and creating a measure. Pers Individ Dif. 2019;139:77–89. doi:10.1016/j.paid.2018.11.005
25. Scheier MF, Wrosch C, Baum A, et al. The life engagement test: assessing purpose in life. J Behav Med. 2006;29(3):291–298. doi:10.1007/s10865-005-9044-1
26. Snyder CR, Harris C, Anderson JR, et al. The will and the ways: development and validation of an individual-differences measure of hope. J Pers Soc Psychol. 1991;60(4):570. doi:10.1037/0022-3514.60.4.570
27. Cronbach LJ. Coefficient alpha and the internal structure of tests. Psychometrika. 1951;16(3):297–334. doi:10.1007/BF02310555
28. Nunnally JC. Psychometric Theory. McGraw-Hill; 1978.
29. Rousson V, Gasser T, Seifert B. Assessing intrarater, interrater and test–retest reliability of continuous measurements. Stat Med. 2002;21(22):3431–3446. doi:10.1002/sim.1253
30. Readable. Flesch reading ease and the Flesch Kincaid grade level blog; 2022. Available from: https://readable.com/readability/flesch-reading-ease-flesch-kincaid-grade-level/.
31. Churchill GA. A paradigm for developing better measures of marketing constructs. J Mark Res. 1979;16(1):64–73. doi:10.2307/3150876
32. Brown TA. Confirmatory Factor Analysis for Applied Research.
33. Cochran WG. The χ2 test of goodness of fit. Ann Math Stat. 1952;23(3):315–345. doi:10.1214/aoms/1177729380
34. Browne MW, Cudeck R. Alternative ways of assessing model fit. Sociol Methods Res. 1992;21(2):230–258. doi:10.1177/0049124192021002005
35. MacCallum RC, Browne MW, Sugawara HM. Power analysis and determination of sample size for covariance structure modeling. Psychol Methods. 1996;1(2):130–149. doi:10.1037/1082-989X.1.2.130
36. Cavanaugh JE, Neath AA. The Akaike information criterion: background, derivation, properties, application, interpretation, and refinements. WIREs Comput Stat. 2019;11(3):e1460. doi:10.1002/wics.1460
37. Neath AA, Cavanaugh JE. The Bayesian information criterion: background, derivation, and applications. WIREs Comput Stat. 2012;4(2):199–203. doi:10.1002/wics.199
38. Bentler PM. Comparative fit indexes in structural models. Psychol Bull. 1990;107(2):238–246. doi:10.1037/0033-2909.107.2.238
39. Tucker LR, Lewis C. A reliability coefficient for maximum likelihood factor analysis. Psychometrika. 1973;38(1):1–10. doi:10.1007/BF02291170
40. Hu L, Bentler PM. Cutoff criteria for fit indexes in covariance structure analysis: conventional criteria versus new alternatives. Struct Equ Modeling. 1999;6(1):1–55. doi:10.1080/10705519909540118
41. Comrey AL, Lee HB. A First Course in Factor Analysis.
42. Tabachnick BG, Fidell LS. Using Multivariate Statistics.
43. Shi D, Maydeu-Olivares A, Rosseel Y. Assessing fit in ordinal factor analysis models: SRMR vs. RMSEA. Struct Equ Modeling. 2020;27(1):1–15. doi:10.1080/10705511.2019.1611434
44. DeVellis RF, Thorpe CT. Scale Development: Theory and Applications.
45. Clark LA, Watson D. Constructing validity: basic issues in objective scale development. Psychol Assess. 1995;7(3):309–319. doi:10.1037/1040-3590.7.3.309
46. Campbell DT, Fiske DW. Convergent and discriminant validation by the multitrait-multimethod matrix. Psychol Bull. 1959;56(2):81–105. doi:10.1037/h0046016
47. Lelkes Y, Krosnick J, Marx D, Judd C, Park B. Complete anonymity compromises the accuracy of self-reports. J Exp Soc Psychol. 2012;48(6):1291–1299. doi:10.1016/j.jesp.2012.07.002
48. Duckworth AL, Gross JJ. Behavior change. Organ Behav Hum Decis Process. 2020;161:39–49. doi:10.1016/j.obhdp.2020.09.002
49. Parks AC, Schueller S. The Wiley Blackwell Handbook of Positive Psychological Interventions. Wiley; 2014.
50. Whitmore J. Coaching for Performance: The Principles and Practice of Coaching and Leadership.
 © 2023 The Author(s). This work is published and licensed by Dove Medical Press Limited. The
full terms of this license are available at https://www.dovepress.com/terms
and incorporate the Creative Commons Attribution
- Non Commercial (unported, 3.0) License.
By accessing the work you hereby accept the Terms. Non-commercial uses of the work are permitted
without any further permission from Dove Medical Press Limited, provided the work is properly
attributed. For permission for commercial use of this work, please see paragraphs 4.2 and 5 of our Terms.
© 2023 The Author(s). This work is published and licensed by Dove Medical Press Limited. The
full terms of this license are available at https://www.dovepress.com/terms
and incorporate the Creative Commons Attribution
- Non Commercial (unported, 3.0) License.
By accessing the work you hereby accept the Terms. Non-commercial uses of the work are permitted
without any further permission from Dove Medical Press Limited, provided the work is properly
attributed. For permission for commercial use of this work, please see paragraphs 4.2 and 5 of our Terms.
Recommended articles
Development and Validation of a Patient-Reported Outcome Measure for Fingernail and Toenail Conditions: The NAIL-Q
Klassen AF, Rae C, O'Malley M, Breitkopf T, Algu L, Mansouri J, Brown CR, Wang Y, Lipner SR
Clinical, Cosmetic and Investigational Dermatology 2023, 16:3091-3105
Published Date: 27 October 2023
Research and Evaluation of a Cyberchondria Severity Scale in a Chinese Context
Wang D, Sun L, Shao Y, Zhang X, Maguire P, Hu Y
Psychology Research and Behavior Management 2023, 16:4417-4429
Published Date: 1 November 2023
Psychometric Properties Assessment and Determinants of the Health Services OutPatient Experience (HSOPE) Among Chinese Outpatients: A Cross-Sectional Study
Chen W, Zhou L, Zeng Q, Luo Q, Liao W, Fong DYT, Li J, Ye ZJ, Nie A, Li Y, Guo Z, Li J
Patient Preference and Adherence 2025, 19:3261-3274
Published Date: 22 October 2025
Validation of Basque “Test of Adherence to Inhalers” in Asthma and Chronic Obstructive Pulmonary Disease
Mestre D, Orive M, Gascón M, Bilbao-González A, González-Hernández N, Dorado-Arenas S, Aramburu A, Quintana JM
Patient Preference and Adherence 2025, 19:4051-4061
Published Date: 12 December 2025
Development and Preliminary Validation of an Oral Health Multidisciplinary Team Nurse Competency Scale
Jiang Y, Wu S, Dong Y, Zhong K, Cao L
Journal of Multidisciplinary Healthcare 2026, 19:605940
Published Date: 30 May 2026