")
Back to Journals » Neuropsychiatric Disease and Treatment » Volume 18
Psychometric and Clinical Evaluation of the Clinician (VQIDS-C5) and Self-Report (VQIDS-SR5) Versions of the Very Quick Inventory of Depressive Symptoms
Authors Rush AJ , Madia ND, Carmody T, Trivedi MH
Received 2 October 2021
Accepted for publication 20 January 2022
Published 17 February 2022 Volume 2022:18 Pages 289—302
DOI https://doi.org/10.2147/NDT.S342457
Checked for plagiarism Yes
Review by Single anonymous peer review
Peer reviewer comments 2
Editor who approved publication: Dr Roger Pinder
A John Rush,1– 3 Nancy D Madia,4 Thomas Carmody,5 Madhukar H Trivedi6,7
1Department of Psychiatry, Texas Tech University Health Science Center, Midland, TX, USA; 2Department of Psychiatry and Behavioral Sciences, Duke University School of Medicine, Durham, NC, USA; 3Duke-National University of Singapore, Singapore; 4Texas Tech University Health Sciences Center Permian Basin, Odessa, TX, USA; 5Department of Population and Data Science, University of Texas Southwestern Medical Center, Dallas, TX, USA; 6Peter O’Donnell Jr. Brain Institute, University of Texas Southwestern Medical Center, Dallas, TX, USA; 7Department of Psychiatry, University of Texas Southwestern Medical Center, Dallas, TX, USA
Correspondence: Madhukar H Trivedi, Center for Depression Research and Clinical Care, University of Texas Southwestern Medical Center, 5323 Harry Hines Blvd., Dallas, TX, 75390-9119, USA, Tel +1 214-648-0188, Fax +1 214-648-0167, Email [email protected]
Purpose: Evaluate the psychometric properties of the 5-item Very Quick Inventory of Depressive Symptomatology self-report and clinician-rated versions (VQIDS-SR5/VQIDS-C5), compare their relative performance, create crosswalks between their total scores and other accepted depressive symptom ratings, and define clinically relevant depressive symptom severity thresholds and categorical outcomes for both versions.
Patients and Methods: The Sequenced Treatment Alternatives to Relieve Depression trial obtained baseline and exit 17-item Hamilton Rating Scale for Depression (HRSD17) and 30-item Inventory of Depressive Symptomatology – Clinician-rated scores, and baseline and visit-wise QIDS-SR16 and QIDS-C16 ratings from the first treatment step (citalopram). The VQIDS-C5 and the VQIDS-SR5 items (sad mood, self-outlook, involvement, fatigue, psychomotor slowing) (each rated 0– 3), extracted from the corresponding 16-item ratings, were selected to best reflect the 6-item HRSD (HRSD6) (exclusive of anxiety). Classical Test Theory (CTT) and Item-Response Theory (IRT) analyses assessed psychometric features. IRT analyses produced total score crosswalks between the VQIDS5, QIDS-C16, QIDS-SR16 and HRSD6. Clinically relevant VQIDS symptom severity thresholds and treatment outcomes were estimated based on cross-walks from the parent QIDS16 ratings.
Results: Both VQIDS versions were unifactorial with acceptable internal consistencies (Cronbach’s alphas > 0.80), item-total correlations (0.57– 0.74) by CCT, and strong IRT item performance. Based on QIDS16 severity thresholds (none 0– 5; mild 6– 10; moderate 11– 15; severe 16– 20; and very severe 21– 27), comparable thresholds were 0– 2; 3– 5; 6– 9; 9– 12; and > 12 for VQIDS-C5, and 0– 2; 2– 5; 6– 8; 9– 12; and > 12 for VQIDS-SR5. Kappa values were acceptable in comparing categories of outcomes (eg, no benefit, remission, etc) based on VQIDS and corresponding QIDS categories.
Conclusion: The VQIDS-C5 and VQIDS-SR5 assess selected core depressive symptoms with psychometrically acceptable properties. Theelf-report and clinician-rated versions provide virtually identical information, symptom severity thresholds and symptom change categories. Both are as sensitive to change as the corresponding QIDS16, making them suitable for use in busy practices.
Keywords: depression, self-report, psychometrics, rating scales, QIDS, symptoms
Plain Language Summary
A short questionnaire to measure depressive symptoms would be easier for patients to take either on paper or by smartphone and provide a quick status check to their clinicians. The authors developed the 5-item Very Quick Inventory of Depressive Symptomatology patient self-rating (VQIDS-SR5) and clinician-rating (VQIDS-C5) using five questions from the 16-item QIDS16. This study was conducted to determine whether these measures are accurate and suitable for the purposes mentioned above.
This study used data from outpatients 18–75 years of age with major depressive disorder treated for up to 14 weeks with citalopram and who completed measures of depressive symptoms, including the QIDS16 versions at baseline and each treatment visit. The researchers extracted the VQIDS5 items from the completed QIDS16 versions and compared the information to that from the full QIDS16 versions and other depression rating scales.
Findings indicated that both the self-report and clinician versions of the VQIDS possess nearly identical score ranges for categories of depressive symptom severity (mild, moderate, etc) and treatment outcomes (response, remission, etc.). Both VQIDS detect symptom changes as well as the 16-item QIDS16.
The VQIDS5 versions are suitable for rating patient depressive symptoms and for remote monitoring or telepsychiatry visits. Patients could complete the VQIDS-SR5 on their smartphone to monitor their depression and to provide that information to their clinicians. How well the VQIDS5 assesses depression in juveniles or the elderly, and how it compares to other symptom severity ratings deserves study.
Introduction
Measurement-Based Care (MBC) improves the outcomes of patients with depression,1 but its implementation faces challenges,2 including changing the workflow and practice management habits of clinicians and fears of increased time requirements. On the other hand, patients and/families are often eager to participate in their own care. If armed with appropriate information and easy-to-use measurement tools, they often undertake habit change and increase participation in their own care.
Presently, the self-reported 9-item Patient Health Questionnaire (PHQ-9) is a widely used tool for assessing depressive symptom severity and treatment outcome.3 The PHQ-9 was devised as a screening tool for a major depressive episode (MDE) based on the Diagnostic and Statistical Manual IV.4 The PHQ-9 uses a 2-week observation period and asks about the pervasiveness rather than the severity of depressive symptoms (eg, “over the last 2 weeks, how much have you been bothered by any of the following problems?”). Criterion depressive symptoms do wax and wane in severity. Thus, a patient with severe insomnia occurring only on a few nights/week might find the rating to be challenging. The 2-week assessment period could also make detection of change more sluggish than scales that use shorter assessment periods. While the PHQ-9 does assess all symptomatic criteria that define an MDE, its nine items may make administration by smartphone longer than is necessary to gauge the core symptoms of depression, dysphoria and anhedonia.
To develop a more user-friendly depressive symptom rating tool for potential smartphone use, we created the Very Quick Inventory of Depressive Symptomatology (VQIDS5).5 The VQIDS5 includes 5 items from the 16-item Quick Inventory of Depressive Symptomatology (QIDS16)6 that best approximate the 6 items on Bech’s 6-item Hamilton Rating Scale for Depression (HRSD6).7 A variety of clinical trials with depressed outpatients found that the HRSD6 total score accounted for more than half of the variance in overall depressive symptom outcome provided by the 17-item HRSD (HRSD17) total score,8–10 thereby providing a briefer assessment of depressive symptom outcome. The resulting VQIDS self-report (VQIDS-SR5) and clinician-rated (VQIDS-C5) include sad mood, self-outlook, involvement, fatigue, and psychomotor slowing. Unlike the HRSD6, however, neither version of the VQIDS5 nor the original QIDS16 ratings included an anxiety item. Anxiety, however, is not a criterion symptom of an MDE, and that item had the smallest loading in the principal component analysis8 of the HRSD6, likely because some MDEs are characterized by high anxiety and others are not.11
Initially, we evaluated both the clinician-rated and self-report versions of the VQIDS in a sample of outpatients with chronic or recurrent MDD being treated in psychiatric and primary care settings in the Combining Medications to Enhance Depression Outcomes (CO-MED) study.12 The VQIDS-SR5 and the VQIDS-C5 were unifactorial and were at least as sensitive to change as the longer 16-item QIDS-SR16 and QIDS-C16 ratings. The need for replication in an independent sample was recognized.5
The current report further evaluated the psychometric features of the VQIDS-SR5 and VQIDS-C5; created crosswalks between their total scores and those of the QIDS-SR16, QIDS-C16 and HRSD6; established symptom severity (eg, none, mild, moderate, etc) and recommended various outcome categories (eg, no benefit, partial response, response without remission, and remission). We also compared the proportions of patients that fell into these various outcome categories based on the VQIDS ratings with those that fell into those categories based on the QIDS-SR16, QIDS-C16 and HRSD6.
Materials and Methods
This report employed data obtained from the first treatment step in the Sequenced Treatment Alternatives to Relieve Depression (STAR*D) trial (NCT00021528). The STAR*D protocol and procedures were approved by the Institutional Review Board at the University of Texas Southwestern Medical Center (National Coordinating Center), the University of Pittsburgh (data coordinating center), and each participating center and clinic, according to the Declaration of Helsinki. All participants provided written informed consent before data collection and trial entry. The rationale, methods, and design of STAR*D are detailed elsewhere.13
Overall, 14 regional Centers across the United States oversaw protocol implementation at public or private sector clinical sites that provide primary (N=18) or psychiatric (N=23) outpatient care. This was an open treatment, rater blinded, multistep treatment trial that used an equipoise stratified randomization.13
Participants
Outpatients (18–75 years of age) with single or recurrent nonpsychotic major depressive disorder who were seeking care (as opposed to enrolling symptomatic volunteers) were eligible if their baseline HRSD17 total score was at least 14 and their clinicians decided that outpatient antidepressant medication was appropriate.
Diagnostic and Outcome Measures
The diagnosis of nonpsychotic major depressive disorder was made by the clinician but confirmed using a DSM-IV criterion symptom checklist. An initial HRSD17, QIDS-C16 and QIDS-SR16 were collected. Telephone interviews were conducted to obtain the HRSD17, which was the primary outcome. A missing exit HRSD17 was declared to be non-remission. Secondary outcomes included the QIDS-SR16 and QIDS-C16 collected at baseline and at each treatment visit.
This report used the HRSD6 (derived from its parent scale, the HRSD17), the VQIDS-C5 and VQIDS-SR5 (derived from the QIDS-C16 and QIDS-SR16, respectively), and the 30-item Inventory of Depressive Symptomatology (IDS-C30)14 as outcome measures. Details and psychometric properties on each of the scales can be found elsewhere.5–7,10,14,15
Treatment
In this first treatment step, once-a-day citalopram was prescribed with the aim of reaching symptom remission, defined as a QIDS-C16 score ≤5 at a maximum dose of 60mg/d. Dosing recommendations were flexible and based on MBC procedures as informed by the Frequency, Intensity, and Burden of Side Effects Ratings (FIBSER)16 and the QIDS-C16 scores at each treatment visit.
The protocol recommended treatment visits at 2, 4, 6, 9, and 12 weeks with an optional week 14 visit if needed. After an optimal trial, remitters and responders could enter the 12-month naturalistic follow-up, though all responders who did not achieve remission were encouraged to enter the second treatment step. Participants could discontinue citalopram before 12-weeks if 1) they experienced intolerable side effects, 2) an optimal dose increase was not possible due to side effects or participant choice, or 3) significant symptoms (QIDS-C16 score ≥9) were present after 9 weeks at maximally tolerated doses. Patients could opt to move to the next treatment level if they had intolerable side effects or if the QIDS-C16 score was >5 after an adequate trial in terms of dose and duration.
Concomitant Medications
Concomitant treatments for current general medical conditions and for citalopram side effects were permitted based on clinical judgment. Stimulants, anticonvulsants, antipsychotics, alprazolam, non-protocol antidepressants (except trazodone ≤200 mg at bedtime for insomnia), and depression-targeted psychotherapies were proscribed.
Statistical Analysis
The VQIDS-C5 and VQIDS-SR5 total scores were computed from the appropriate subset of items of the QIDS-C16 and QIDS-SR16, respectively. Also, the HRSD6 was taken from items of the HRSD17. To be included in an analysis, participants must have had all items for all scales used in the analysis. The QIDS-C16 and QIDS-SR16 were collected at intervals from baseline to the end of Level 1. Visit windows, which extend from 1 week before to 1 week after weeks 2, 4, and 6, were created based on visit date. The HRSD17 and IDS-C30 were collected only at baseline and exit from this treatment step. Exit analyses included the HRSD17 and IDS-C30 at exit and the last available QIDS-C16 and QIDS-SR16 up to week 14.
Internal consistency of the VQIDS-C5 and VQIDS-SR5 was assessed using Cronbach’s alpha17 and item-total correlations (corrected for item/total overlap) using Spearman correlations18 at the exit assessment.
Item Response Theory (IRT)19 methods were implemented in MULTILOG20 using Samejima’s graded IRT model.21 The assumption of uni-dimensionality necessary for IRT methods was determined by principal component analysis with the number of dimensions determined by parallel analysis where dimensionality is assessed by comparing eigenvalues from the real dataset to eigenvalues from simulated datasets with randomly generated uncorrelated variables.22 See Supplement for details. Exit measurements were used for the QIDS-C16, QIDS-SR16, VQIDS-C5, VQIDS-SR5, and HRSD6.
IRT analyses were used to compare the remaining measures using the test information function, which enables one to compare the precision of two or more measures across all levels of symptom severity. Also, we created tables that enable conversion of VQIDS-C5 and VQIDS-SR5 total scores into total scores on the other measures with equivalent levels of depression using the exit assessment. The procedure of Orlando et al23 (and associated software) was used to derive an IRT score (measure of depression scaled to a mean 0 and standard deviation 1) for each possible total score on each of the scales. Item scores with the same IRT score were then equated.
The percent of participants with various levels of improvement from baseline to weeks 2, 4, 6, and exit were reported. The levels of improvement were applied to all scales and were as follows: no meaningful benefit (≤35% improvement), partial response (>35% improvement and <50% improvement), response (≥50% improvement) without remission, and remission HRSD6 ≤3, VQIDS-C5 ≤2, VQIDS-SR5 ≤2). These levels of improvement in depressive symptoms were based on established clinical consensus24 and empirical reports (see for example Conway et al25 and Dunlop et al26). The numerical remission thresholds for each measure were similarly based on clinical convention (eg, HRSD17 ≤7; QIDS-C16 ≤5; QIDS-SR16 ≤5)27 or on the equivalent values arrived at by IRT for the brief versions (eg, HRSD6 ≤3, VQIDS-C5 ≤2, VQIDS-SR5 ≤2). The strength of agreement between each pair of measures was assessed by kappa statistic for remission vs no remission, response (with or without remission) vs no response, and benefit (over 35% improvement) vs no benefit 35% or less improvement). Sensitivity of the measures to change over time was assessed by computing the percent change from baseline to weeks 2, 4, 6, and exit. Differences in percent change between each pair of measures was tested using paired t-test.28
Results
In the STAR*D trial, 4045 participants enrolled into Level 1 and had some baseline data. The number of participants with all QIDS16, HRSD17, and IDS-C30 items at exit was 2493, while the number of participants with all items at both baseline and exit was 2352. The number of participants with all QIDS-C16 and QIDS-SR16 items for weeks 2, 4, and 6 were 2732, 2273, and 1984, respectively.
CTT Properties of VQIDS-C5 and VQIDS-SR5
Cronbach’s alphas (based on last visit data during citalopram treatment, which could have been up to 14 weeks following baseline) were 0.86 for the VQIDS-C5 and the VQID-SR5; and 0.87 for the QIDS-C16 and the QIDS-SR16. Corresponding Cronbach’s alpha values were 0.87 for the HRSD17, 0.86 for the HRSD6 and 0.92 for the IDS-C30. All values fell within an acceptable range.17
Table 1 summarizes the Spearman item-total correlations computed at exit. To avoid inflating these correlations, each specific item was removed from the total score when its item total correlation was calculated. For example, if sad mood was included in the total score, the correlation of sad mood with the total would be artificially inflated. To avoid this, sad mood was removed from the total.
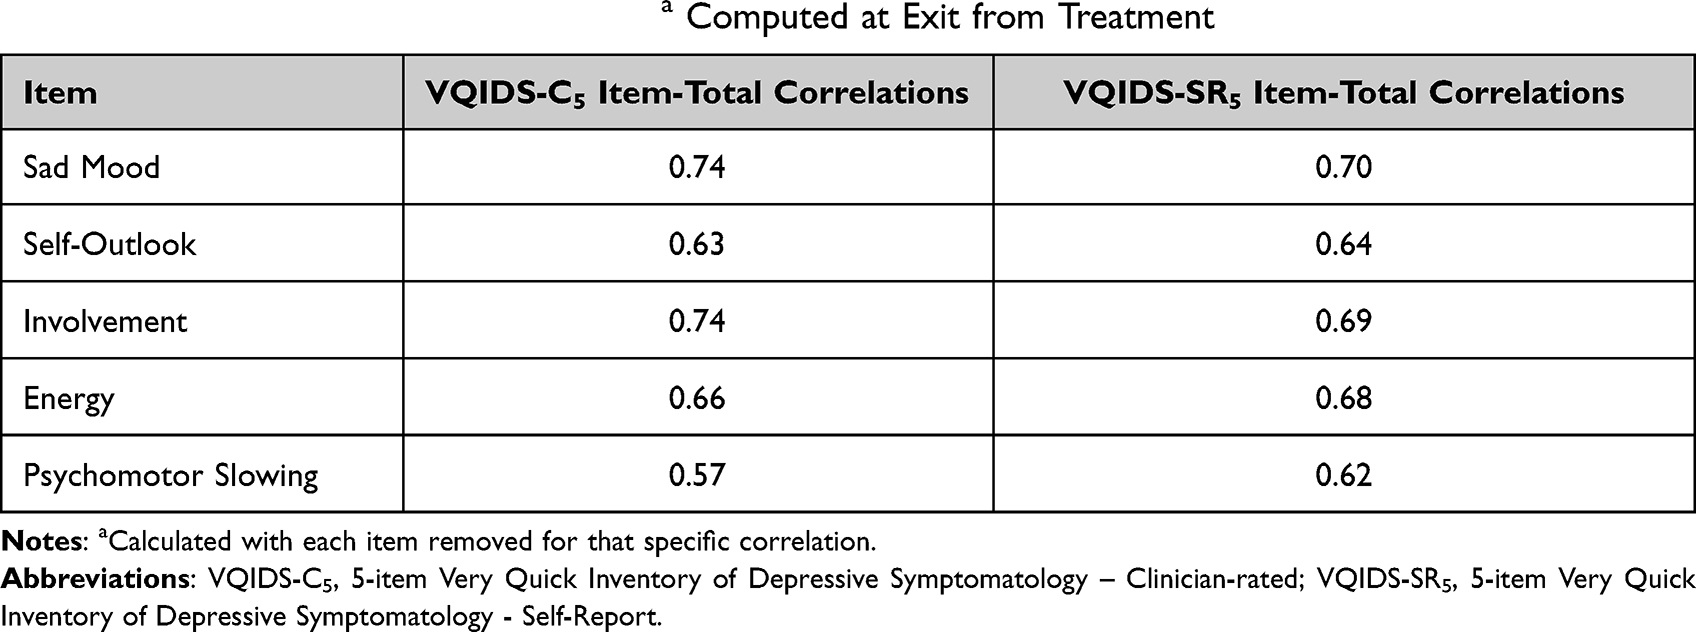 |
Table 1 Item-Total Spearman Correlationsa Computed at Exit from Treatment |
IRT Properties of VQIDS-C5 and VQIDS-SR5
Assessment of dimensionality of the measures by parallel analysis showed the HRSD17 and IDS-C30 did not satisfy the uni-dimensionality assumption as each scale was determined to have three dimensions and these measures were excluded. All other measures were unidimensional (Tables S1 and S2 of Supplement). Table 2 summarizes the IRT properties of both VQIDS ratings. The “A” value measures the strength of association between the item and the overall amount of depression (larger values indicate a stronger association). The “B” parameters (B1, B2, B3) indicate the level of depression at which there is a 50% probability of being at one level versus higher levels. Thus, the B1 parameter indicates the standardized level of depression at which a participant is as likely to be at “0” versus “1”, “2”, or “3”. The B2 parameter indicates the level at which “0” or “1” is as likely to be endorsed as “2” or “3”. Likewise, the B3 parameter indicates the level at which “0”, “1”, or “2” is as likely as “3”. Higher values of the “B” parameters indicate that levels of the item are endorsed by those with higher levels of depression.
 |
Table 2 VQIDS-C5 and VQIDS-SR5 Item Response Theory Parameters (n=2493) |
Figure 1 shows the test information function for all of the measures deemed to be unidimensional. All measures provide the most precise estimates of depression around a theta of one, which corresponds to a level of depression severity of about 1 standard deviation above average. Between 1 and 2 standard deviations above average, QIDS-SR16 had the most precise estimates followed by QIDS-C16, HRSD6, VQIDS-SR5, and VQIDS-C5.
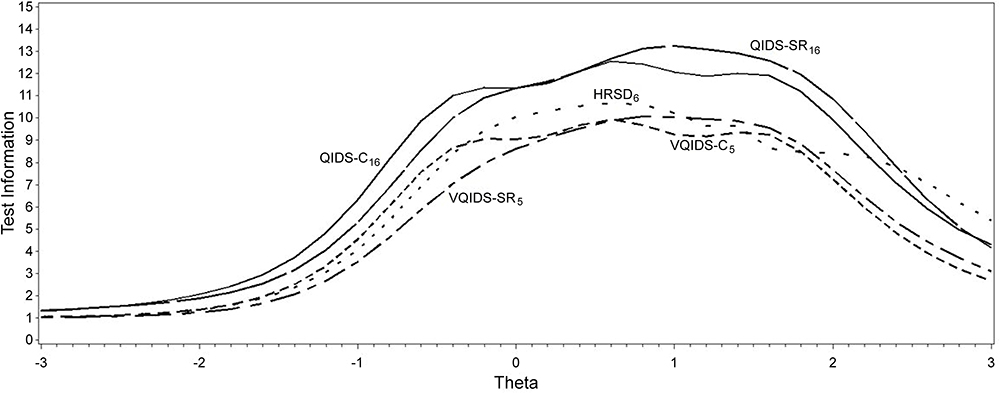 |
Figure 1 Test information function for all unidimensional measures. Abbreviations: HRSD6, 6-item Hamilton Rating Scale for Depression; QIDS-C16, 16-item Quick Inventory of Depressive Symptomatology – Clinician rated; QIDS-SR16, 16-item Quick Inventory of Depressive Symptomatology – Self-Report; VQIDS-C5, 5-item Very Quick Inventory of Depressive Symptomatology – Clinician rated; VQIDS-SR5, 5-item Very Quick Inventory of Depressive Symptomatology – Self-Report. |
Conversion Tables
Table 3 uses the IRT results to provide crosswalks between total scores for the VQIDS-C5 and the HRSD6, QIDS-C16, and QIDS-SR16. Table 4 does the same for the VQIDS-SR5. Table 5 shows how the categories of depressive symptom severity previously established for the QIDS-C16 and QIDS-SR16 are related to the VQIDS-C5 and VQIDS-SR5 total scores. For example, a VQIDS-C5 or a VQIDS-SR5 score of 6 or more establishes a threshold for at least a moderate depression, as does a 9 or more threshold for severe depression. For the VQIDS-C5, a 9 reflects a moderate or severe depression, while for the VQIDS-SR5 a 2 is compatible with no or very mild depression.
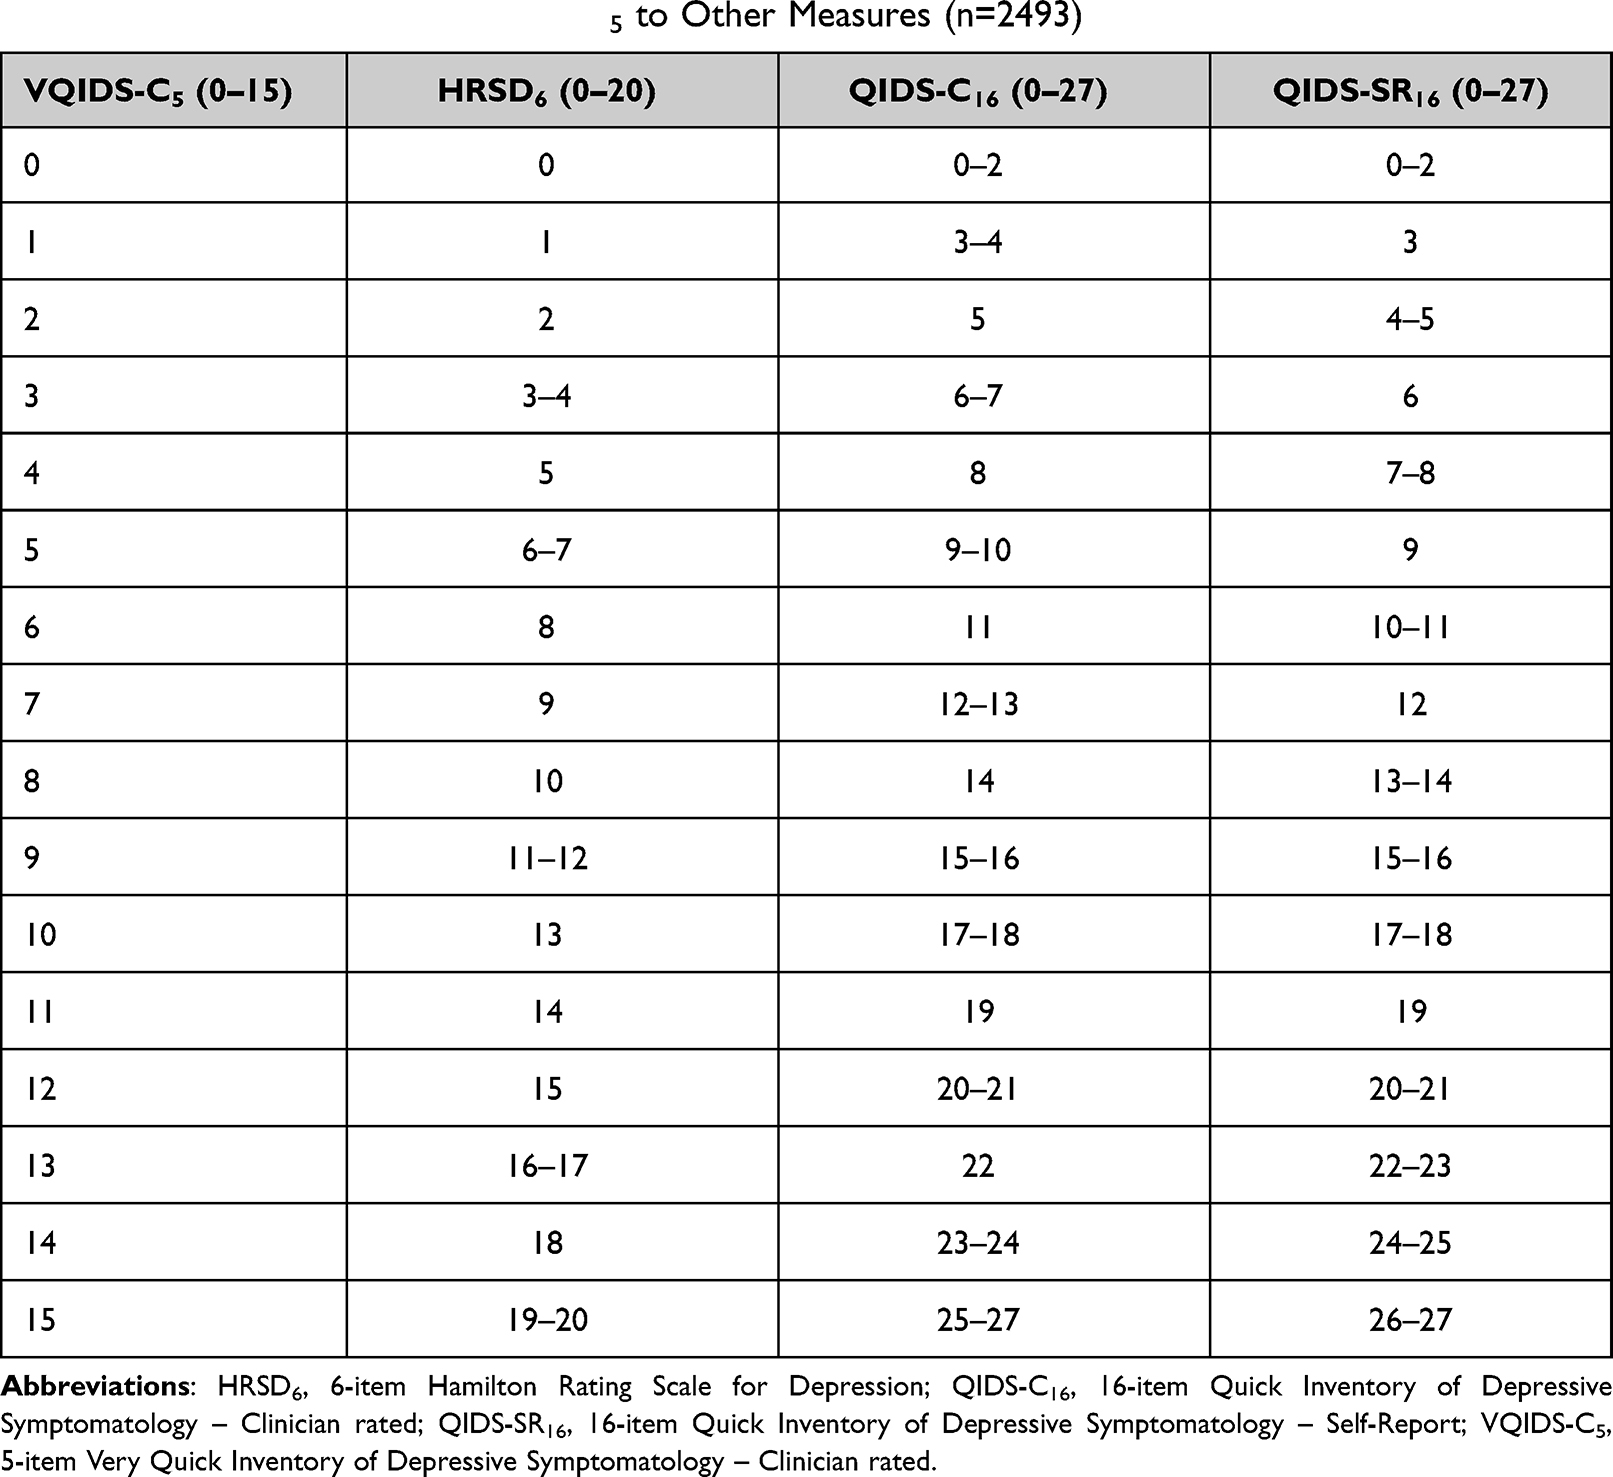 |
Table 3 Conversion Table of VQIDS-C5 to Other Measures (n=2493) |
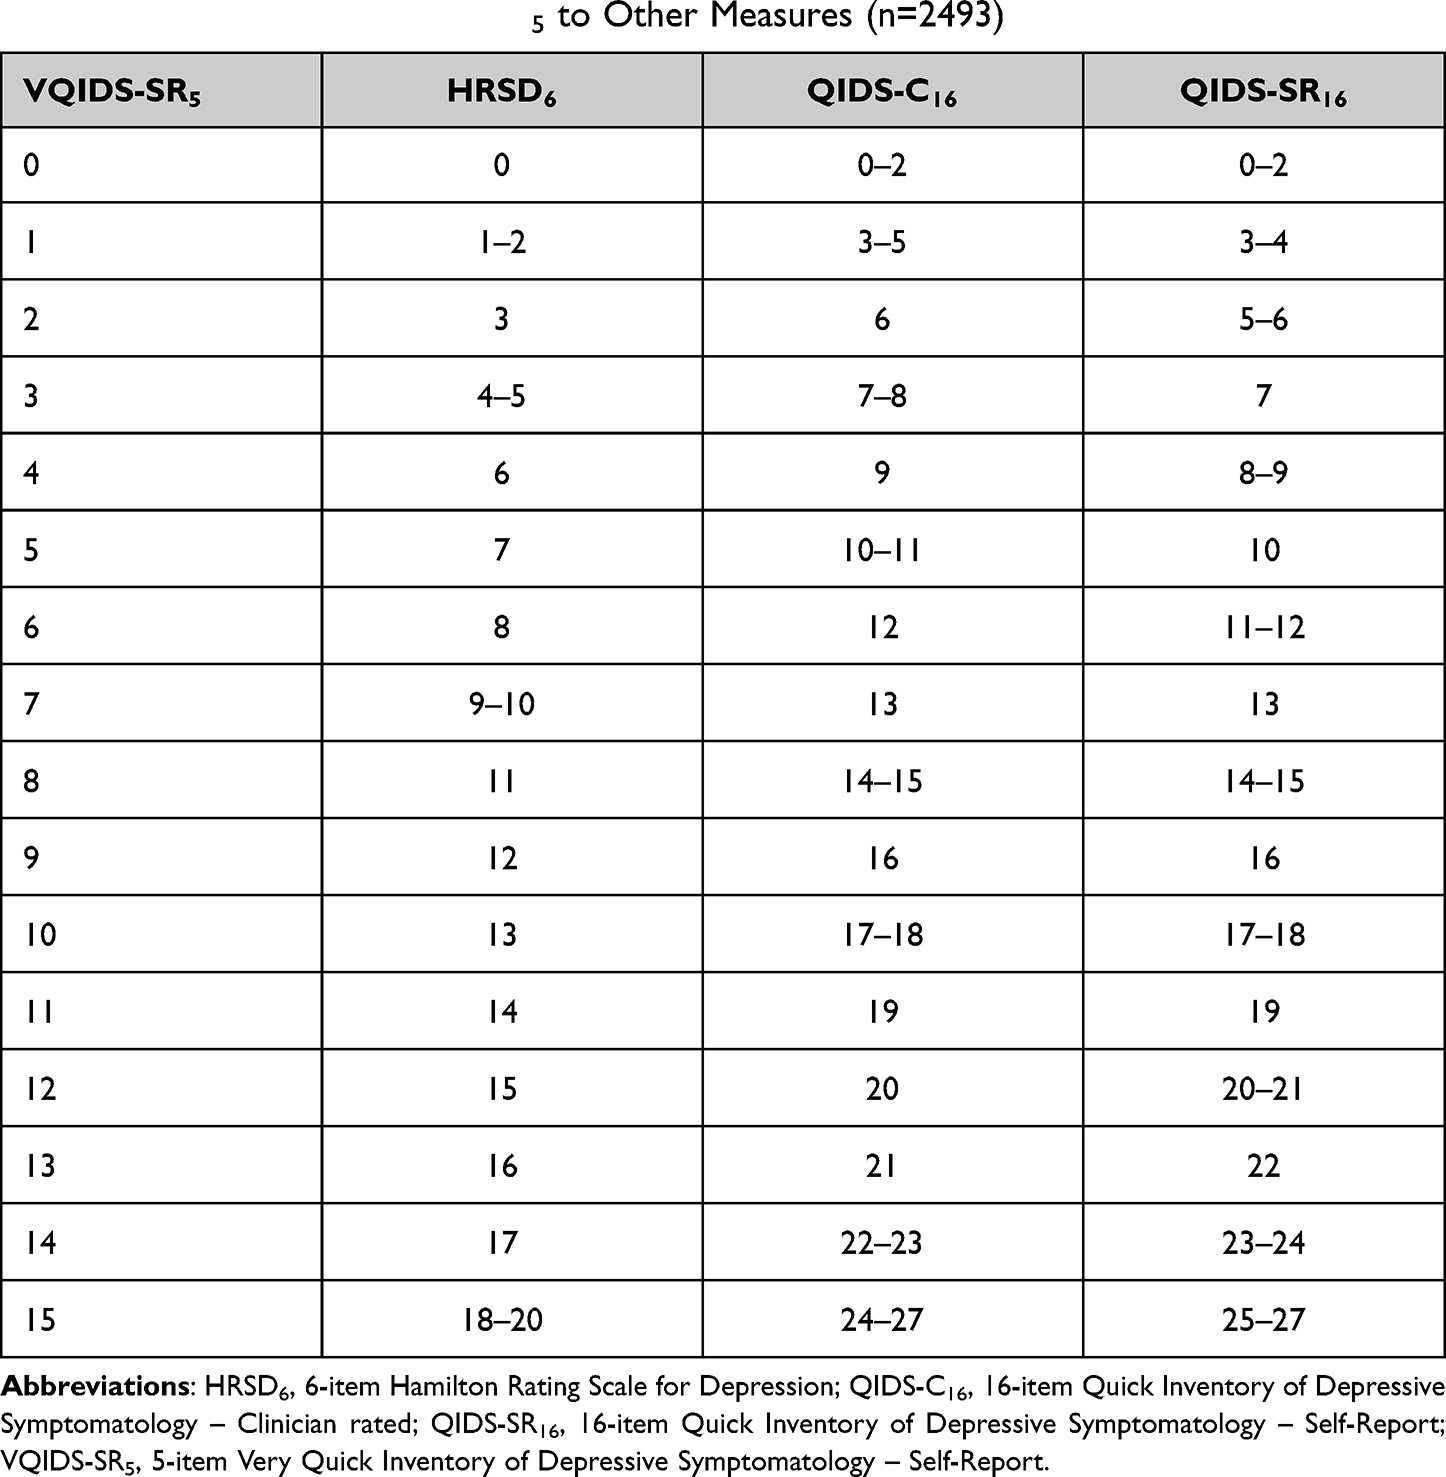 |
Table 4 Conversion of VQIDS-SR5 to Other Measures (n=2493) |
 |
Table 5 Categories of Depressive Symptom Severity |
Comparisons for Categories of Benefit
Commonly accepted categories of benefit are defined by remission or symptom changes from baseline. Benefit categories include no meaningful benefit (<35% reduction); partial response (35% to 50% reduction); response without remission (≥50% reduction from baseline but no remission), and remission. These definitions were applied to data compiled at weeks 2, 4, 6 and exit. The remission category was defined as a score of ≤2 on the VQIDS-SR5 or VQIDS-C5, a score of ≤5 on the QIDS-C16 or QIDS-SR16, a score of ≤7 on the HRSD17, a score of ≤3 on the HRSD6, and a score of ≤12 on the IDS-C30. Figure 2A and B show how the QIDS-C16 and VQIDS-C5, and the QIDS-SR16 and VQIDS-SR5, respectively, were related in defining the population at various post-baseline measurement occasions. Overall, the longer measure categories were comparable to those formed by the VQIDS categories. Additional information can be found in Supplementary Table 1A-D.
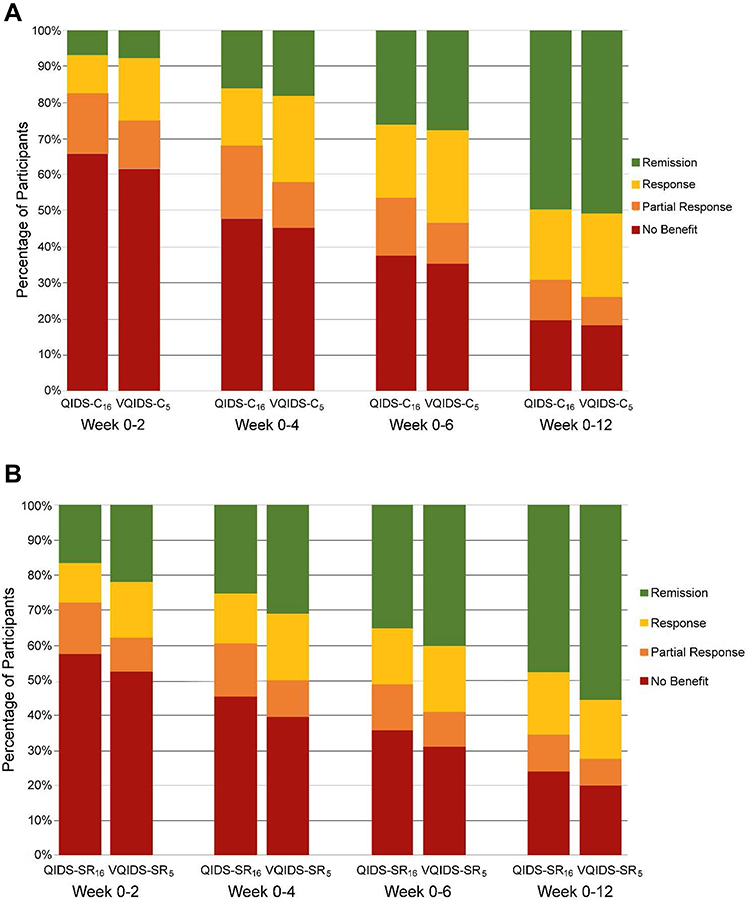 |
Figure 2 Comparative level of benefit between the QIDS and the VQIDS. (A) QIDS-C16 and VQIDS-C5 level of benefit. (B) QIDS-SR16 and VQIDS-SR5 level of benefit. Abbreviations: QIDS-C16, 16-item Quick Inventory of Depressive Symptomatology – Clinician rated; VQIDS-C5, 5-item Very Quick Inventory of Depressive Symptomatology – Clinician rated; QIDS-SR16, 16-item Quick Inventory of Depressive Symptomatology – Self-Report; VQIDS-SR5, 5-item Very Quick Inventory of Depressive Symptomatology – Self-Report. |
Tables 6–8 show the degree of agreement between the QIDS-C16 and VQIDS-C5, and between the QIDS-SR16 and VQIDS-SR5, as assessed by kappa statistic for the following categories of benefit: (remission vs no remission, response (with or without remission) vs no response, and benefit vs no benefit) from baseline to week 2, week 4, and week 6, respectively. Table 9 includes the comparison among measures collected at baseline and exit. Overall, there was substantial agreement among measures from baseline to week 2, week 4, and week 6 (ranging from 0.622 to 0.743, 0.669 to 0.749, and 0.709 to 0.780, respectively), and moderate to high agreement among measures collected at baseline and exit (0.599 to 0.866).
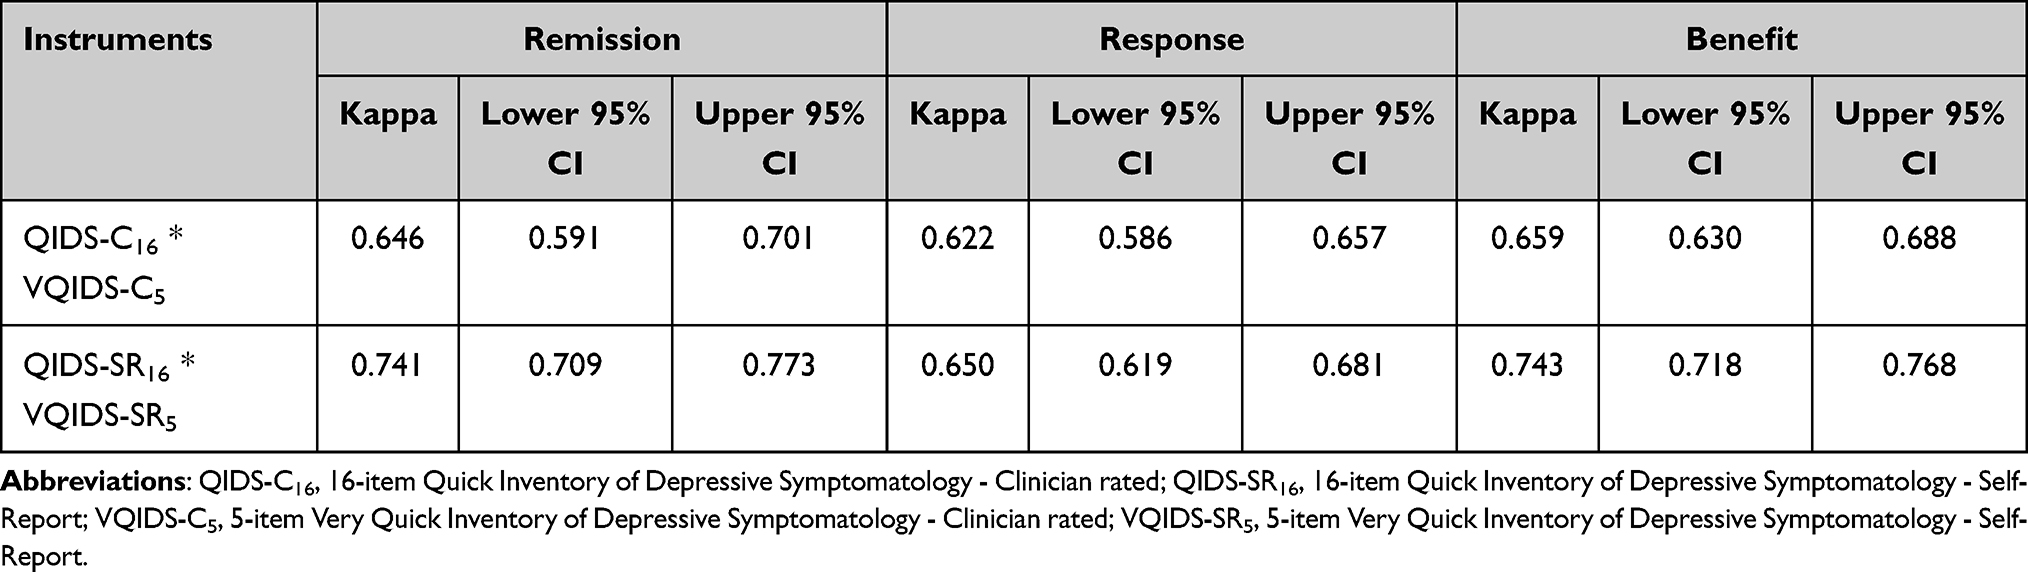 |
Table 6 Strength of Agreement for Remission, Response, and Benefit (Baseline to Week 2) (n=2732) |
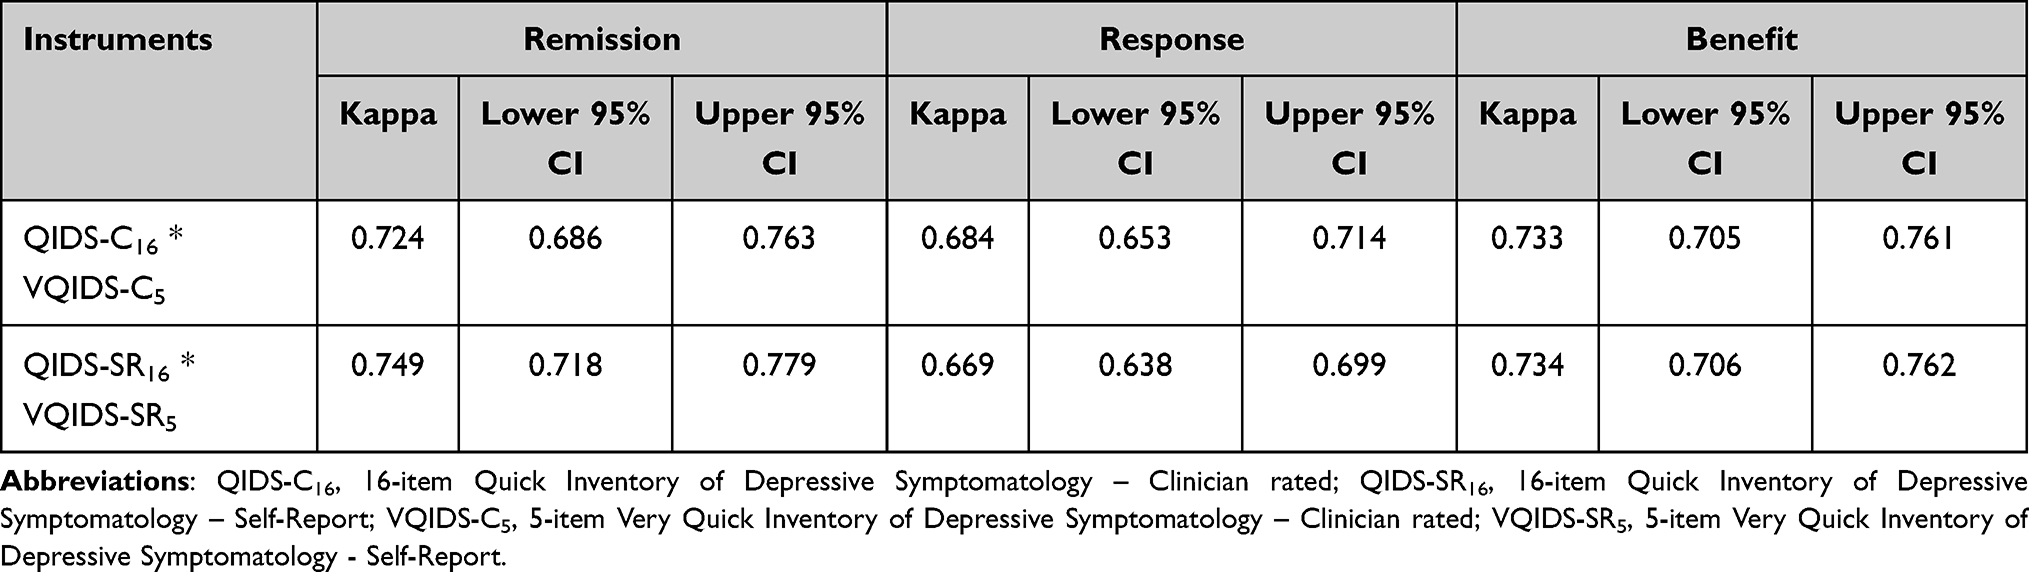 |
Table 7 Strength of Agreement for Remission, Response, and Benefit (Baseline to Week 4) (n=2273) |
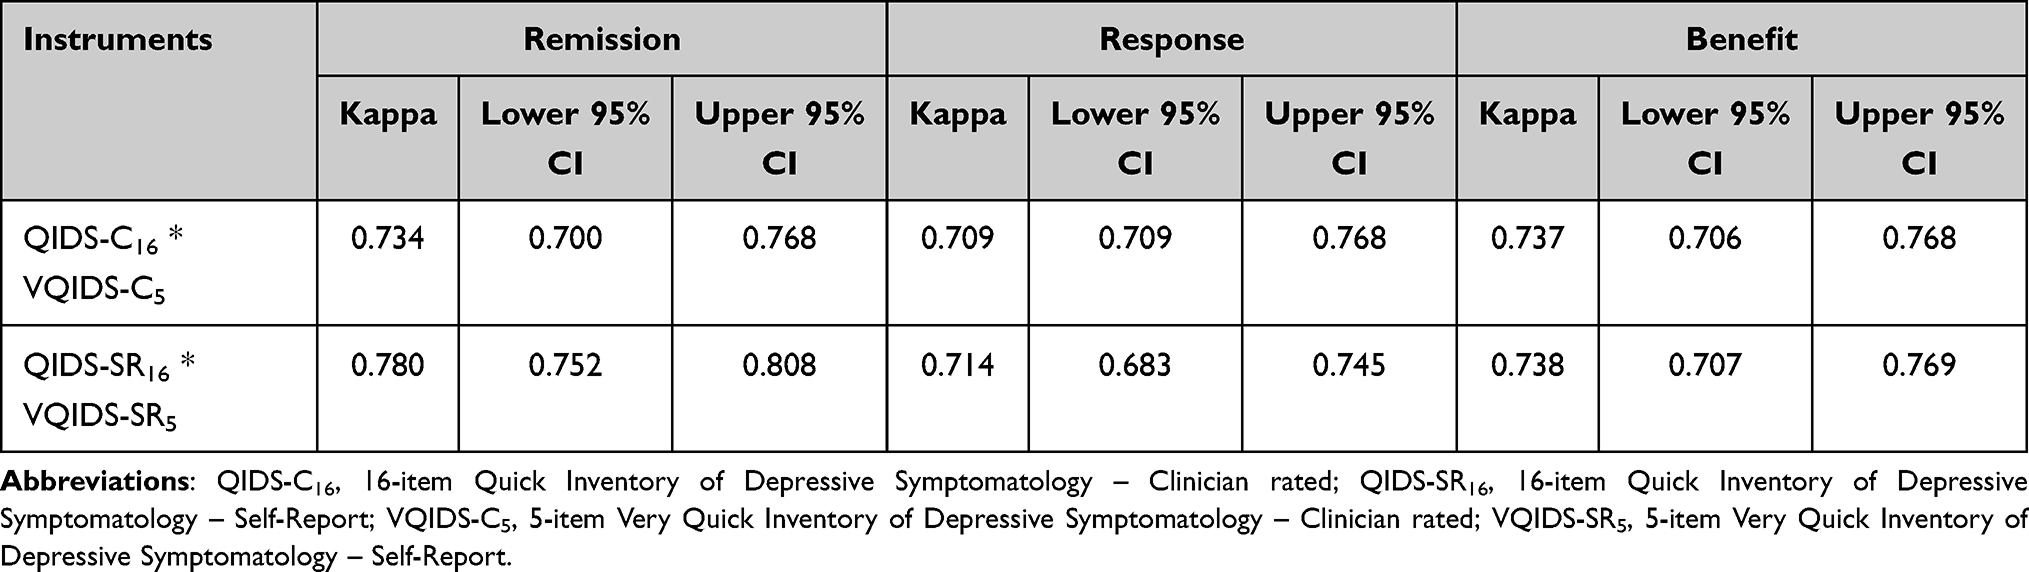 |
Table 8 Strength of Agreement for Remission, Response, and Benefit (Baseline to Week 6) (n=1984) |
 |
Table 9 Strength of Agreement for Remission, Response, and Benefit (Baseline to Exit) (n=2352) |
Table 10 shows the comparative sensitivity of the QIDS-C16 and VQIDS-C5 to change over time as assessed by the percent change from baseline to Weeks 2, 4, 6, and exit. Table 11 does the same for the QIDS-SR16 and the VQIDS-SR5. Percent change and mean differences among the various measures obtained at baseline and exit can be found in Supplementary Table 2.
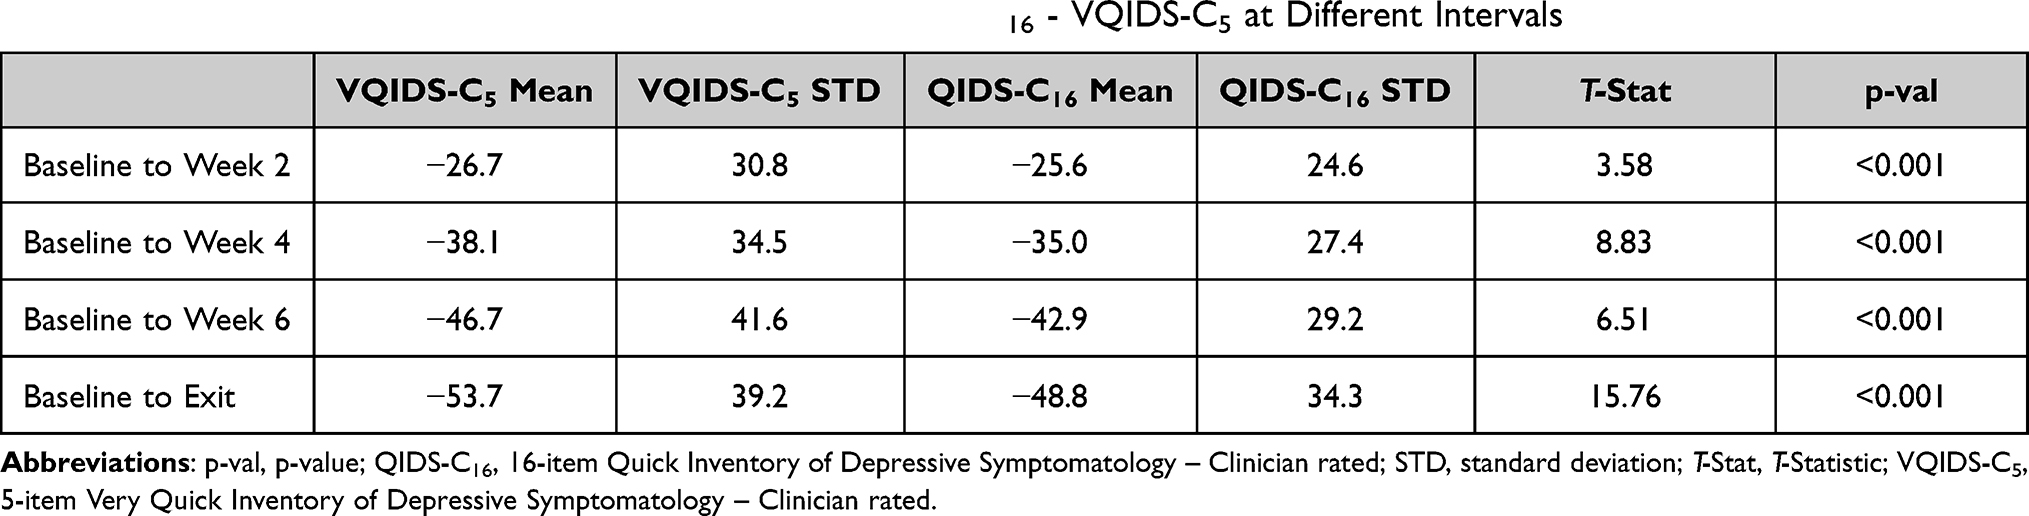 |
Table 10 Percent Change and Mean Differences Among QIDS-C16 - VQIDS-C5 at Different Intervals |
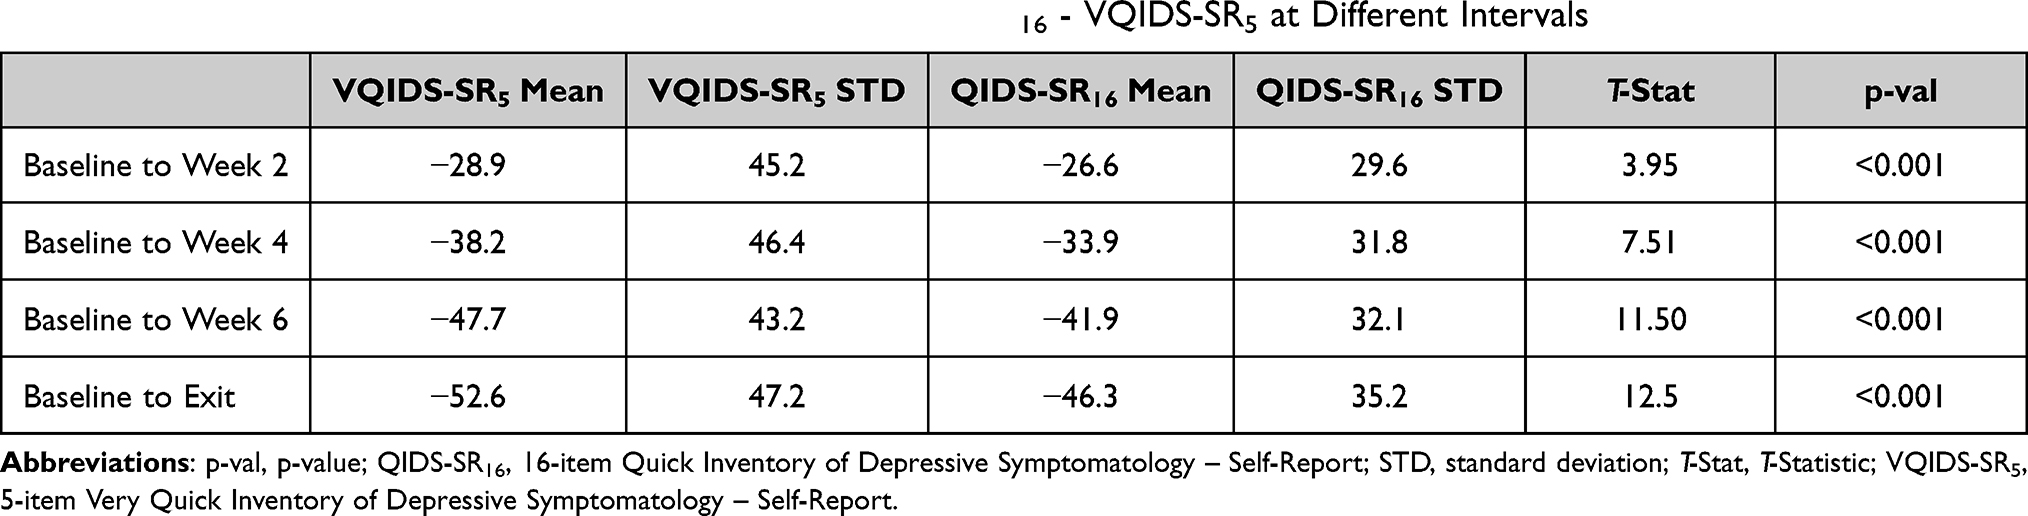 |
Table 11 Percent Change and Mean Differences Among QIDS-SR16 - VQIDS-SR5 at Different Intervals |
Discussion
This report, based on a large representative sample of adults with nonpsychotic major depressive disorder treated in primary and psychiatric care settings, found that both the VQIDS-C5 and VQIDS-SR5 were unifactorial and had acceptable psychometric properties based on CTT and IRT analyses. Internal consistency (Cronbach’s alpha values) and item-total correlations were acceptable IRT analyses revealed a substantial relationship between each of the 5 items and overall depression severity for the VQIDS-C5 and even more so for the VQIDS-SR5. Individual item responses using IRT analysis were also satisfactory.
The IRT analyses also established symptom severity categories (none, mild, moderate, severe, very severe) for each VQIDS based on the accepted symptom severity categories for the QIDS-C16 and QIDS-SR16.6 The thresholds used to define the above five severity categories (0–5; 6–10; 11–15; 16–20; 21+) led to virtually identical thresholds for the VQIDS-C5 and the VQIDS-SR5. The resulting VQIDS-C5 categories were 0–2 (none), 3–5 (mild), 6–9 (moderate), 9–12 (severe) and >12 (very severe). The resulting VQIDS-SR5 categories were 0–2 (none), 2–5 (mild), 6–8 (moderate), 9–12 (severe) and >12 (very severe).
The QIDS-C16 and VQIDS-C5 identified comparable proportions of patients at exit with the commonly accepted categories of no benefit (19.6% vs 18.2%), partial response (11.2% vs 8.0%), response without remission (19.4% vs 22.9%) and remission (49.9% vs 50.9%), respectively. For the QIDS-SR16 and VQIDS-SR5, the proportions were also comparable at exit: no benefit (24.1% vs 20.1%), partial response (10.6% vs 7.5%), response without remission (17.5% vs 16.7%), and remission (47.8% vs 55.8%), respectively. Kappa statistics revealed substantial agreement between the VQIDS and the QIDS outcome categories (eg, no meaningful benefit vs some benefit; response vs no response; remission vs no remission, etc).
The study results confirm and extend our initial evaluation of the VQIDS-C5 and VQIDS-SR5 in a sample of opportunity of chronically and/or recurrently depressed outpatients treated in primary care or specialty settings.5 Both this and our prior report establish that the VQIDS-C5 and the VQIDS-SR5 are unifactorial and have acceptable psychometric properties. Further, each VQIDS is as sensitive to change as the corresponding (clinician or self-report) longer QIDS ratings, based on the comparison of outcome categories at 2, 4, and 6 weeks post-baseline.
These results have implications for practice. Since the clinician and self-report versions of the VQIDS were very closely related in this report and in our prior report, it is reasonable to expect that the self-report would be sufficient in most adult depressed outpatients to estimate the overall severity of depressive symptoms as opposed to the potentially more time-consuming clinician-rated version. Since each 5-item VQIDS is as sensitive to change as the longer 16-item (9 domains) QIDS, the VQIDS could be used as a quick check on symptom status, even via smartphone.
The categories of benefit are essential to clinical decision-making and with either VQIDS these categories align nicely with those established for the QIDS. Thus, when clinicians need to decide to what degree the patient has benefited, either the VQIDS self-report or clinician rating is sufficient. In addition, the degree of benefit can be translated into commonly accepted thresholds for improvement using the QIDS. Interestingly, the VQIDS-SR5 identified a slightly greater proportion of participants that fell under the response, response without remission, and remission categories as early as week 2, which is reassuring in that the self-report is seemingly not more sluggish in detecting change than the clinician rating.
In busy practices, the VQIDS could be used weekly for remote monitoring or telePsychiatry visits, which could shorten the time to make treatment type and dosing decisions, especially if combined with a brief measure of global side effect burden such as the the FIBSER. That is, the VQIDS could facilitate the implementation of MBC. That a self-report could suffice, at least in outpatients, is reassuring because patients can then learn to monitor their own depressions and provide that information in an easily transmitted form whether by paper or digital means. In addition, for those who have greater challenges in self-report, family members can use these tools to assess patient status and communicate with their clinician in a timely fashion.
While the VQIDS (SR or C) were not designed to screen for MDE, their use in this regard deserves study. The scales include both of the essential symptoms (interest and sadness). If they are both scored 0, an MDE cannot be present. Both VQIDS can also assess whether there is a sufficient degree of symptom severity for mild MDE (VQIDS of ≥3) or moderate (VQIDS ≥6) depression (see Tables 3–5 above). The performance of the VQIDS as screening tools deserves study.
There are several study limitations. Both VQIDS ratings were based on items extracted from the QIDS parent rating, which likely inflates the agreement between the VQIDS and QIDS total scores. A comparison of the VQIDS-C5 and VQIDS-SR5 with other depression ratings, such as the Montgomery–Åsberg Depression Rating Scale29 or the Beck Depression Inventory,30 at each visit over the course of acute treatment is needed to compare the VQIDS sensitivity to change against longer, more widely accepted depressive symptom ratings beyond the QIDS itself. Further, the generalizability of present results is limited to adult outpatients with non-psychotic major depression. It remains to be determined whether the VQIDS-C5 and VQIDS-SR5 display analogous psychometric properties in patients with psychotic or bipolar depression, inpatients, adolescents, and those over 75 years of age. Although the VQIDS scales were unidimensional it remains to be seen if they exhibit longitudinal measurement invariance.31 Further, there are no established population norms for either the VQIDS-C5 or VQIDS-SR5. A further minor limitation is that the visit-wise QIDS-C16 and QIDS-SR16, and thus the VQIDS derived from them, were collected by clinicians or participants entering their responses on a laptop keyboard.32 Thus, neither a paper and pencil nor a smartphone version has been tested.
Conclusions
In summary, the VQIDS-SR5 and the VQIDS-C5 are unifactorial scales with acceptable psychometric properties that provide reliable, clinically informative estimates of overall depressive symptom severity. Each measure is as sensitive to change as the corresponding QIDS-SR16 and QIDS-C16 from which each VQIDS was derived. Either version is suitable as a brief tool to monitor depressive symptoms over time.
Abbreviations
CO-MED, Combining Medications to Enhance Depression Outcomes; CTT, Classical Test Theory; FIBSER, Frequency, Intensity, and Burden of Side Effects Ratings; HRSD6, 6-item Hamilton Rating Scale for Depression; HRSD17, 17-item Hamilton Rating Scale for Depression; IDS-C30, Inventory of Depressive Symptomatology; IRT, Item-Response Theory; MDE, Major Depressive Episode; PHQ-9, 9-item Patient Health Questionnaire; p-val, p-value; QIDS-C16, 16-item Quick inventory of Depressive Symptomatology – Clinician-rated; QIDS-SR16, 16-item Quick inventory of Depressive Symptomatology – Self-Rated; STAR*D, Sequenced Treatment Alternatives to Relieve Depression; STD, standard deviation; T-Stat, T-Statistic; VQIDS, Very Quick inventory of Depressive Symptomatology; VQIDS-C5, 5-item Very Quick inventory of Depressive Symptomatology – Clinician-rated; VQIDS-SR5, 5-item Very Quick inventory of Depressive Symptomatology – Self-Rated.
Licensing
Licensing and distribution of the VQIDS is managed by Mapi Research Trust on behalf of the copyright holder, University of Texas Southwestern Medical Center. At the time of publishing, the VQIDS is available without charge to non-commercial users. Requests for information and licensing of the VQIDS should be submitted through Mapi Research Trust’s ePROVIDE platform (https://eprovide.mapi-trust.org/).
Acknowledgments
The authors gratefully acknowledge the editorial support of Jon Kilner, MS, MA (Pittsburgh). The authors also wish to thank the participants, families, staff, and colleagues who made this project possible, and Kathryn Forbes for administrative support.
Author Contributions
Drs Rush, Madia, and Carmody participated in study concept and design. Dr Carmody had full access to all the data in the study and takes responsibility for the integrity of the data and the accuracy of the data analysis. All authors participated in acquisition, analysis, or interpretation of data; all authors participated in drafting and in critical revision of the manuscript for important intellectual content. Dr Trivedi obtained funding. All authors made substantial contributions to conception and design, acquisition of data, or analysis and interpretation of data; took part in drafting the article or revising it critically for important intellectual content; agreed to submit to the current journal; gave final approval of the version to be published; and agree to be accountable for all aspects of the work.
Funding
The STAR*D trial was funded by NIMH under contract N01 MH-90003 to the University of Texas Southwestern Medical Center at Dallas. Forest Pharmaceuticals, GlaxoSmithKline, Organon, and Wyeth Pharmaceuticals provided medications for this trial at no cost. This work was also supported in part through the Hersh Foundation (Principal investigator, M.H. Trivedi) and the Center for Depression Research and Clinical Care (P.I.: Trivedi).
Disclosure
Dr Rush has received consulting fees from Alkermes, Compass Inc., Curbstone Consultant LLC, Emmes Corp., Evecxia Therapeutics, Inc., Holmusk, Johnson and Johnson (Janssen), Liva-Nova, Neurocrine Biosciences Inc., Otsuka-US; speaking fees from Liva-Nova, Johnson and Johnson (Janssen); and royalties from Guilford Press and the University of Texas Southwestern Medical Center, Dallas, TX (for the Inventory of Depressive Symptoms and its derivatives). He is also named co-inventor on two patents: US Patent No. 7,795,033: Methods to Predict the Outcome of Treatment with Antidepressant Medication, Inventors: McMahon FJ, Laje G, Manji H, Rush AJ, Paddock S, Wilson AS; and US Patent No. 7,906,283: Methods to Identify Patients at Risk of Developing Adverse Events During Treatment with Antidepressant Medication, Inventors: McMahon FJ, Laje G, Manji H, Rush AJ, Paddock S. Dr Madia reports no financial relationships with commercial interests. Dr. Carmody has received consulting fees from Alkermes, Compass Inc. Dr Trivedi is or has been an advisor/consultant and received fees from: Acadia Pharmaceuticals, Inc., Axsome Therapeutics, Alkermes Inc., Biogen MA Inc., Circular Genomics Inc., GH Research Limited, Heading Health Inc., Janssen, Legion Health Inc, Merck Xharp & Dohme Corp., Mind Medicine (MindMed) Inc., Neurocrine BioSciences Inc., Noema Pharma AG, Orexo US Inc., Otsuka American Pharmaceutical Inc., Otsuka Canada Pharmaceutical Inc, Otsuka Pharmaceutical Development & Commercialization Inc., SAGE Therapeutics, Takeda Pharmaceutical Company Ltd., Titan Pharmaceuticals, Inc. The authors report no other conflicts of interest in this work.
References
1. Guo T, Xiang YT, Xiao L, et al. Measurement-based care versus standard care for major depression: a randomized controlled trial with blind raters. Am J Psychiatry. 2015;172(10):1004–1013. doi:10.1176/appi.ajp.2015.14050652
2. Martin-Cook K, Palmer L, Thornton L, et al. Setting measurement-based care in motion: practical lessons in the implementation and integration of measurement-based care in psychiatry clinical practice. Neuropsychiatr Dis Treat. 2021;17:1621–1631. doi:10.2147/NDT.S308615
3. Kroenke K, Spitzer RL, Williams JB. The PHQ-9: validity of a brief depression severity measure. J Gen Intern Med. 2001;16(9):606–613. doi:10.1046/j.1525-1497.2001.016009606.x
4. Bell CC. Diagnostic and Statistical Manual of Mental Disorders: DSM-IV. Washington, DC: American Psychiatric Association; 1994.
5. De La Garza N, Rush AJ, Grannemann BD, Trivedi MH. Toward a very brief self-report to assess the core symptoms of depression (VQIDS-SR5. Acta Psychiatr Scand. 2017;135(6):548–553. doi:10.1111/acps.12720
6. Rush AJ, Trivedi MH, Ibrahim HM, et al. The 16-item Quick Inventory of Depressive Symptomatology (QIDS), clinician rating (QIDS-C), and self-report (QIDS-SR): a psychometric evaluation in patients with chronic major depression. Biol Psychiatry. 2003;54(5):573–583. doi:10.1016/S0006-3223(02)01866-8
7. Bech P, Gram LF, Dein E, et al. Quantitative rating of depressive states. Acta Psychiatr Scand. 1975;51(3):161–170. doi:10.1111/j.1600-0447.1975.tb00002.x
8. Bech P, Fava M, Trivedi MH, Wisniewski SR, Rush AJ. Factor structure and dimensionality of the two depression scales in STAR*D using level 1 datasets. J Affect Disord. 2011;132(3):396–400. doi:10.1016/j.jad.2011.03.011
9. Kyle PR, Lemming OM, Timmerby N, et al. The validity of the different versions of the Hamilton depression scale in separating remission rates of placebo and antidepressants in clinical trials of major depression. J Clin Psychopharmacol. 2016;36(5):453–456. doi:10.1097/JCP.0000000000000557
10. Hamilton M. A rating scale for depression. J Neurol Neurosurg Psychiatry. 1960;23(1):56–62. doi:10.1136/jnnp.23.1.56
11. Fava M, Rankin MA, Wright EC, et al. Anxiety disorders in major depression. Compr Psychiatry. 2000;41(2):97–102. doi:10.1016/S0010-440X(00)90140-8
12. Rush AJ, Trivedi MH, Stewart JW, et al. Combining medications to enhance depression outcomes (CO-MED): acute and long-term outcomes of a single-blind randomized study. Am J Psychiatry. 2011;168(7):689–701. doi:10.1176/appi.ajp.2011.10111645
13. Rush AJ, Trivedi MH, Wisniewski SR, et al. Acute and longer-term outcomes in depressed outpatients requiring one or several treatment steps: a STAR*D report. Am J Psychiatry. 2006;163(11):1905–1917. doi:10.1176/ajp.2006.163.11.1905
14. Rush AJ, Gullion CM, Basco MR, Jarrett RB, Trivedi MH. The Inventory of Depressive Symptomatology (IDS): psychometric properties. Psychol Med. 1996;26(3):477–486. doi:10.1017/S0033291700035558
15. Gibbons RD, Clark DC, Kupfer DJ. Exactly what does the Hamilton depression rating scale measure? J Psychiatr Res. 1993;27(3):259–273. doi:10.1016/0022-3956(93)90037-3
16. Wisniewski SR, Rush AJ, Balasubramani GK, et al. Self-rated global measure of the frequency, intensity, and burden of side effects. J Psychiatr Pract. 2006;12(2):71–79. doi:10.1097/00131746-200603000-00002
17. Cronbach LJ. Coefficient alpha and the internal structure of tests. Psychometrika. 1951;16(3):297–334. doi:10.1007/BF02310555
18. Dodge Y. Spearman rank correlation coefficient. In: The Concise Encyclopedia of Statistics. New York: Springer New York; 2008:502–505.
19. Franzen MD. Item response theory. In: Kreutzer JS, DeLuca J, Caplan B, editors. Encyclopedia of Clinical Neuropsychology. New York: Springer New York; 2011:1362.
20. Thissen D, Chen WH, Bock RD. MULTILOG 7 for Windows: Multiple Category Item Analysis and Test Scoring Using Item Response Theory [Computer Program]. Lincolnwood, IL: Scientific Software International; 2003.
21. Samejima F. Graded response model. In: Van Der Linden WJ, MHambleton RK, editors. Handbook of Modern Item Response Theory. New York: Springer; 1997:85–100.
22. Dinno A. Implementing Horn’s parallel analysis for principal component analysis and factor analysis. Stata J. 2009;9(2):291–298. doi:10.1177/1536867X0900900207
23. Orlando M, Sherbourne CD, Thissen D. Summed-score linking using item response theory: application to depression measurement. Psychol Assess. 2000;12(3):354–359. doi:10.1037/1040-3590.12.3.354
24. Rush AJ, Kraemer HC, Sackeim HA, et al. Report by the ACNP Task Force on response and remission in major depressive disorder. Neuropsychopharmacology. 2006;31(9):1841–1853. doi:10.1038/sj.npp.1301131
25. Conway CR, Kumar A, Xiong W, et al. Chronic vagus nerve stimulation significantly improves quality of life in treatment-resistant major depression. J Clin Psychiatry. 2018;79(5). doi:10.4088/JCP.18m12178.
26. Dunlop BW, Kelley ME, Aponte-Rivera V, et al. Effects of patient preferences on outcomes in the Predictors of Remission in Depression to Individual and Combined Treatments (PReDICT) study. Am J Psychiatry. 2017;174(6):546–556. doi:10.1176/appi.ajp.2016.16050517
27. Kraemer HC, Frank E, Kupfer DJ. Moderators of treatment outcomes: clinical, research, and policy importance. JAMA. 2006;296(10):1286–1289. doi:10.1001/jama.296.10.1286
28. McDonald JH. Handbook of Biological Statistics.
29. Montgomery SA, Asberg M. A new depression scale designed to be sensitive to change. Br J Psychiatry. 1979;134(4):382–389. doi:10.1192/bjp.134.4.382
30. Beck AT, Ward CH, Mendelson M, Mock J, Erbaugh J. An inventory for measuring depression. Arch Gen Psychiatry. 1961;4(6):561–571. doi:10.1001/archpsyc.1961.01710120031004
31. Fried EI, van Borkulo CD, Epskamp S, et al. Measuring depression over time … Or not? Lack of unidimensionality and longitudinal measurement invariance in four common rating scales of depression. Psychol Assess. 2016;28(11):1354–1367. doi:10.1037/pas0000275
32. Rush AJ, Fava M, Wisniewski SR, et al. Sequenced treatment alternatives to relieve depression (STAR*D): rationale and design. Control Clin Trials. 2004;25(1):119–142. doi:10.1016/S0197-2456(03)00112-0
 © 2022 The Author(s). This work is published and licensed by Dove Medical Press Limited. The
full terms of this license are available at https://www.dovepress.com/terms.php
and incorporate the Creative Commons Attribution
- Non Commercial (unported, v3.0) License.
By accessing the work you hereby accept the Terms. Non-commercial uses of the work are permitted
without any further permission from Dove Medical Press Limited, provided the work is properly
attributed. For permission for commercial use of this work, please see paragraphs 4.2 and 5 of our Terms.
© 2022 The Author(s). This work is published and licensed by Dove Medical Press Limited. The
full terms of this license are available at https://www.dovepress.com/terms.php
and incorporate the Creative Commons Attribution
- Non Commercial (unported, v3.0) License.
By accessing the work you hereby accept the Terms. Non-commercial uses of the work are permitted
without any further permission from Dove Medical Press Limited, provided the work is properly
attributed. For permission for commercial use of this work, please see paragraphs 4.2 and 5 of our Terms.