Back to Journals » Journal of Inflammation Research » Volume 16
Psoriasis and Leprosy: An Arcane Relationship
Authors Ge G, Shang J, Gan T, Chen Z, Pan C, Mei Y ![]() , Long S, Wu A, Wang H
, Long S, Wu A, Wang H ![]()
Received 8 February 2023
Accepted for publication 18 May 2023
Published 14 June 2023 Volume 2023:16 Pages 2521—2533
DOI https://doi.org/10.2147/JIR.S407650
Checked for plagiarism Yes
Review by Single anonymous peer review
Peer reviewer comments 2
Editor who approved publication: Professor Ning Quan
Gai Ge,1 Jingzhe Shang,2,3 Tian Gan,1 Zhiming Chen,1 Chun Pan,1 Youming Mei,1 Siyu Long,4 Aiping Wu,2,3 Hongsheng Wang1,5,6
1Laboratory of Mycobacteria, Institute of Dermatology, Chinese Academy of Medical Sciences and Peking Union Medical College, Nanjing, People’s Republic of China; 2Center for Systems Medicine, Institute of Basic Medical Sciences, Chinese Academy of Medical Sciences & Peking Union Medical College, Beijing, People’s Republic of China; 3Suzhou Institute of Systems Medicine, Suzhou, People’s Republic of China; 4Department of Dermatology, Beijing Chao-Yang Hospital & Capital Medical University, Beijing, People’s Republic of China; 5National Center for Sexually Transmitted Disease and Leprosy Control, China Centers for Disease Control and Prevention, Nanjing, People’s Republic of China; 6Centre for Global Health, School of Public Health, Nanjing Medical University, Nanjing, People’s Republic of China
Correspondence: Hongsheng Wang, Institute of Dermatology, Chinese Academy of Medical Sciences and Peking Union Medical College, No. 12 Jiang-wang-miao Street, Nanjing, Jiangsu Province, People’s Republic of China, Tel/Fax +86 258 5478953, Email [email protected]
Purpose: Psoriasis (Ps) and leprosy are chronic inflammatory skin disorders, characterised by enhanced innate and adaptive immunity. Ps and leprosy rarely coexist. The molecular immune mechanism of the Ps and leprosy rarely coexistence is unclear.
Patients and Methods: RNA-sequencing (RNA-seq) was performed on 20 patients with Ps, 5 adults with lepromatous leprosy (L-lep), and 5 patients with tuberculoid leprosy (T-lep) to analyse the differentially expressed genes (DEGs) between them. Moreover, the biological mechanism of Ps and leprosy was explored by Kyoto Encyclopedia of Genes and Genomes (KEGG) analysis, Gene Ontology (GO) analysis, Gene Set Enrichment Analysis analysis, and protein–protein interaction (PPI) analyses. Finally, 13 DEGs of 10 skin biopsies of Ps patients, 6 samples of L-lep patients, 6 samples of T-lep patients and 5 healthy controls were confirmed by quantitative real-time polymerase chain reaction (qRT-PCR).
Results: The PPI network was constructed and primarily associated with immune response, IL-17 signalling, and Toll-like receptor pathway between Ps and leprosy. Th17 markers (interleukin (IL)- 19, IL-20, IL-36A, IL-36G, IL-22, IL-17A, and lipocalin-2 (LCN2) had higher expression in Ps than in L-lep and T-lep, whereas macrophage biomarkers (CLEC4E and TREM2), SPP1, and dendritic cell (DC)-related hallmarks (ITGAX) and TNF-a had significantly lower expression across Ps and T-lep than in L-lep.
Conclusion: To put it simply, Ps patients with IL-17A, IL-19, IL-20, IL-36A, IL-36G, and IL-22 in conjunction with LCN2 with up-graduated expression might be not susceptible to L-lep. However, high levels of CLEC4E, TREM2, and SPP1 in L-lep patients indicated that they unlikely suffered from Ps.
Keywords: psoriasis, leprosy, Th17 cell, macrophage, IL-17A, CLEC4E
Introduction
Psoriasis (Ps) is a long time inflammatory cutaneous disorder characterised by enhanced innate and adaptive immunity. Leprosy, or Hansen’s disease, is a chronic and debilitating contagious disease result from the non-cultivable bacillus Mycobacterium leprae and Mycobacterium lepromatosis.1,2 Leprosy primarily impairs the skin and peripheral nerves and is associated with deformity, mutilation, and social isolation.3,4 Tuberculoid leprosy (T-lep) represents the host’s antimicrobial response, which restricts the pathogen. At the opposite end, lepromatous leprosy (L-lep) suggests susceptibility to disseminated infection, with abundant lesions and numerous bacilli.5 Coexistence of Ps and leprosy is rare in literature.6,7 The factors implicated in the rarity of this coexistence are epidemiology, genetics, and immunology.8
According to epidemiological research, the highest prevalence rates of Ps have been observed in Europe,9 where leprosy has almost disappeared.10 Globally, there were133802 new cases at the end of 2021. This finding corresponded with a prevalence rate of 16.9 per million population. Brazil, India, and Indonesia continued to report more than 10000 new cases each, accounting for 74.5% of the new cases detected worldwide in 2021.11 Bassukas et al12 suggested that resisting infection by Mycobacterium leprae may have been the evolutionary advantage that support the expansion of some Ps-associated endotypes and people susceptible to leprosy are not susceptible to Ps, and vice versa. And the global epidemiological variation in Ps prevalence involves closely with that of historical mortality from epidemics of invasive streptococcal infections, disclosing that the Ps genotype could confer a degree of protection from mortality in the epidemics.13 To put it in a few words, the inflammatory disease Ps and infectious disease leprosy play an opposite role in the process of biological evolution.
Genetic researchers have discovered that HLA-Cw*06, HLA-DR B1*04, IL23R, IL12B, ZFP36 ring finger protein-like 1 genes are susceptible to Ps and leprosy, but the susceptibility sites of these genes play inverse roles. The gene PSORS1, which corresponds to the HLA class I HLA-Cw*0602 allele, has been universally correlated with more than 50% of the Ps patients.14 In addition, the genetically confirmed increased resistance of Ps patients to bacterial infections seems to be involved to HLA-Cw*06 associated haplotypes.15 However, HLA-C gene polymorphisms have also been related with the susceptibility of leprosy16 and a statistically remarkable negative correlation between the HLA-Cw*06 locus and leprosy has been verified in Indian patients.17 Other data demonstrate HLA-DRB1*10 is correlated with susceptibility to leprosy and HLA-DRB1*04 is linked with resistance, both in the Brazilian and Vietnamese people.18 A non-synonymous nucleotide substitution in the IL23R gene (rs76418789) leads to inefficient expression of IL-23 receptor,19 resulting in impaired Th17 cell development and showing a protective role in Ps but a risk role in leprosy. Moreover, rs6871626 and rs6887695 in the IL12B gene could overexpress the heterodimeric subunit of IL-23,20,21 which may intensify the IL-23/Th17 pathway, but they play antagonistic roles in the development of Ps and leprosy. ZFP36 ring finger protein-like 1 regulates the pathogenesis of Ps by influencing TNF-a generation and the reproduction and apoptosis of keratinocytes. The association between rs1465788 in ZFP36 ring finger protein-like 1 with praecox Ps in the han Chinese suggests that the SNP in Ps and leprosy may play pleiotropic role.22
According to immunology research, many of the characteristics of inherited and acquired immunity in Ps are similar to that of T-lep against mycobacterium, which can restrict the regeneration of leprosy.23 The differentiation of Th17 cells and enhanced IL-17 response play key roles in Ps pathogenesis. The disease-specific T-cell phenotypes were mostly of a Th17/Tc17 subpopulation in Ps, and their numbers were correlated with the severity scores of diseases.24,25 There were three anti-IL-17 biologics currently in use for Ps therapy.26 Conversely, some researchers believe that IL-17 immune response plays a protective role in leprosy. The mRNA of IL-17A in L-lep patients has an opposite linear correlation with bacterial loads. And active leprosy is correlated with defective expression of IL-17, and hyperproduction of IL-10 and TGF-β, disclosing defective host-protective cytokines and overexpression of host-impairing hallmarks respectively.27 Additionally, nerve involvement in leprosy results in damage of dermatic nerve fibers and deficiency of neuropeptides such as substance P, which may play a functional role in Ps. The difference of neurogenic inflammatory responses in two diseases suggested that Ps patients may be protected from developing leprosy.28
Both PS and leprosy are multifactorial diseases and transcriptome studies can help in better understanding their pathogenesis. The present study aimed to estimate the difference in the expression of the key molecules and immune response in Ps, L-lep, and T-lep lesions in China through comparative genomics and qRT-PCR.
Materials and Methods
Study Design and Samples Collection
We enrolled 20 patients with plaque-type Ps, 5 patients with L-lep, and 5 patients with T-lep in the Institute of Dermatology, Chinese Academy of Medical Sciences for RNA-seq (Table S1). In view of recurrence, leprosy reaction, reluctance to take samples and loss of follow-up, we just collected the samples during half a year. Punch biopsies were collected from 10 Ps patients, 6 L-lep patients, 6 T-lep patients and 5 healthy controls from to for qRT-PCR conducted under institutionally reviewed board-approved protocols. Skin samples were collected directly into RNA Later reagent (Ambion) and then frozen at −80°C until further use. Ps and leprosy patients without available prior treatment history were eligible if their diagnosis was confirmed by clinical and histopathological findings.29 The exclusion standards were immunodeficiency, use of biologics within 12 weeks prior to the study, having systemic steroids and immunosuppressants, antibiotics or phototherapy within 4 weeks, or topical medication within the previous 2 weeks. Written informed consent form was signed and the project was conducted in adherence with the ethics committee of the Institute of Dermatology, Chinese Academy of Medical Sciences and Peking Union Medical College.
Isolation and Purification of RNA
Skin biopsies were obtained from the trunk or thighs of healthy controls, Ps and leprosy patients. The skin biopsies were trimmed by scissors into pieces, added to tissue lysis buffer containing 1% β-mercaptoethanol and then crushed to break up. Total RNAs from tissues were isolated and purified with a RNeasy® Micro Kit (Qiagen, Hilden, Germany) according to the manufacturer’s recommendation. The concentration of RNAs was measured by the Nanodrop 2000C spectrophotometer (Thermo Scientific, Ottawa, America).
Performance of RNA-Seq
RNA-seq experiment of RNAs from the skin samples of Ps and leprosy was implemented on Illumina HiSeq X Ten platform (Illumina, USA) to be analysed by comparing the gene expression in the samples of Ps versus L-lep and Ps versus T-lep. The data presented in the study are deposited in the BioProject repository (see Data Sharing Statement).
Analysis of Data
The transcriptome data were analyzed with Genetic Analysis Software for statistical computation and visualization. Data normalization was conducted across and within the arrays using per gene and per chip normalization. Raw data acquired by high throughput sequencers possibly include low-quality reads and adaptor. For reliable and accurate analysis results, background correction was conducted on the raw data. After low-quality reads were deleted, valid reads were mapped to a reference genome and genes with Spliced Transcripts Alignment to a Reference. Principal component analysis (PCA) was conducted for gene expression levels. Genetic quantitative and differential analysis were conducted by High-throughput sequence. The expression of gene was calculated via Fragments per kilobase of transcript per million fragments mapped.
Recognition of DEGs
DEGs were calculated by comparing the expression of gene in the skin samples. Under varieties of comparison conditions, DEGs were analysed by DESeq2 (1.16.1) software on the basis of the fragments per kilobase of transcript per million fragments mapped values of different transcripts under each condition. The DEGs were then filtrated by the absolute fold change and false discovery rate-adjusted p-values. Genes with absolute fold change ≥ 1 and false discovery rate-adjusted p-values <0.05 were regarded as the statistical criteria.
Functional Annotation of DEGs
Enrichment analyses of GO and KEGG pathway were performed to unveil the related biological functions and signal pathways correlated with DEGs. Based on the three categories of cellular components, molecular functions, and biological processes, GO analysis by clusterProfiler R package was used to classify and annotate the genes. KEGG analysis was performed to further figure out the biological pathways and specific immune functions of DEGs. The corresponding p values and q values in GO and KEGG enrichment analyses were scored. Q value ≤0.01 was regarded as the statistical criteria and significant enrichment.
Analysis of Immune Cells Profile
The component of Immune cells was forecasted via Immune Cell Compositions (ImmuCC) and Gene Set Enrichment Analysis. Score of Immune cells was calculated by analysing the specific gene-expression characteristics of immune cells to forecast cell phenotypes. Results were drawn via R package heatmap and ggplot.
Analysis of PPI
String (Search Tool for the Retrieval of Interaction Gene/Proteins) database (https://string-db.org/) is a database for querying interactions between proteins. This database covers the largest number of species and has the largest interaction information. String database was used for PPI analysis of DEGs, and KEGG enrichment results and local net enrichment results of submitted genes were obtained. The results are generated via cytoscape for the final network diagram.
Confirmation of DEGs by qRT-PCR
Total RNAs were extracted by the RNeasy® Micro Kit (Qiagen, Hilden, Germany) from the tissues of 5 healthy control, 10 Ps patients, 6 L-lep and 6 T-lep patients. Total RNAs were converted to cDNA with HiScript® III 1st Strand cDNA Synthesis Kit (Vazyme, China). qRT-PCR was performed using the appropriate primers and ChamQTM Universal SYBRR qPCR Master Mix (Vazyme, China) and analysed by a LightCycler® 480 II (Roche, America). Each gene used β-actin as the internal reference, and the 2−(ΔΔCT) method was used to calculate the fold change of target genes. The primer sequences for qRT-PCR are listed in Table S2.
Statistical Analyses
We performed DEG analysis using RNA-Seq data to identify genes with significant differential expression amongst Ps, L-lep, and T-lep. Statistical significance was set at 5% false discovery rate. PCA was then performed on the remaining DEGs using R software. Pathway analysis was performed based on the KEGG analysis database (www.genome.jp/kegg/). One-way ANOVA test was used to calculate P values for the qRT-PCR. P < 0.05 was considered significant. Figures was drafted using GraphPad Prism 8 (GraphPad, San Diego, CA, USA). All results were expressed as mean ± standard deviation.
Results
Tissue samples were obtained from lesional skin of patients with Ps (n = 20), L-lep (n = 5), and T-lep (n = 5) and profiled using an RNA-seq method that screened more than 10000 transcripts and 13 DEGs, followed by qRT-PCR analysis of disease-related immunity.
The Function and Pathway Enrichment of DEGs Were Analysed Across Ps and Leprosy
Lesional biopsy samples from patients with Ps, T-lep and L-lep were obtained for the determination of gene-expression profiles: Ps (n = 20), T-lep (n = 5), and L-lep (n = 5). PCA showed that specimens from the same disease samples clustered together, and different diseases were clearly separated (Figure 1A). A total of 6936 DEGs were identified, and 3531 genes (1971 upregulated and 1560 downregulated) were differentially expressed in Ps versus T-lep. Conversely, 6458 genes (3957 upregulated and 2501 downregulated) were differentially expressed in Ps versus L-lep (Figure 1B). The upregulated pathways in Ps than those of L-lep and T-lep included the IL-17 signalling pathway, NABA matrixsome-associated pathways, and tissue morphogenesis. The downregulated pathways in Ps versus leprosy included the response to interferon-gamma, phagosome, positive regulation of hydrolase activity, antigen processing, and presentation and negative regulation of immune system process (Figure 1C).
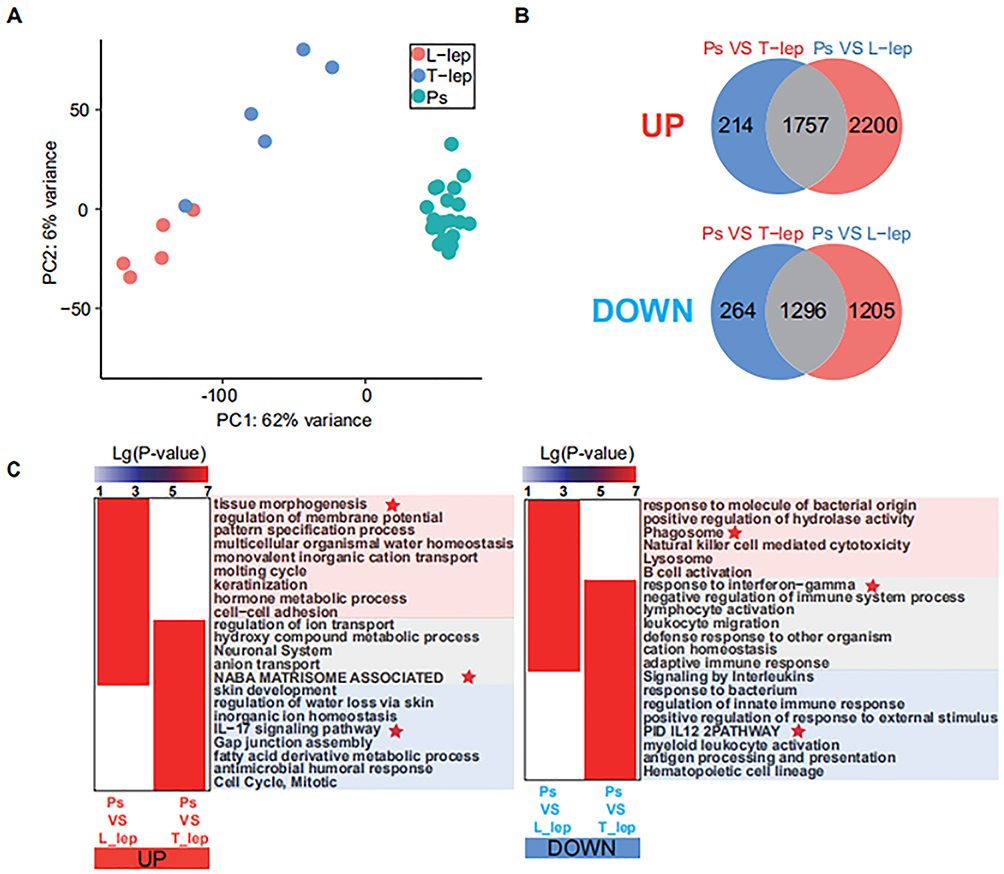 |
Figure 1 Differential distribution of Ps, T-lep and L-lep. Abbreviations: Ps, psoriasis; T-lep, tuberculoid leprosy; L-lep, lepromatous leprosy; DEGs, differentially expressed genes. Notes: (A) Filtered gene-expression profiles from Ps patients (n = 20), T-lep patients (n = 5), and L-lep patients (n = 5). Biopsy specimens were displayed using Principal-component analysis. (B) Venn diagram depicting DEGs that were unique to either Ps or leprosy and DEGs common amongst Ps versus T-lep and Ps versus L-lep. (C) Genes and pathways that were significantly up-regulated (left) or down-regulated (right) in Ps compared with that of L-lep and T-lep, respectively. Red stars mean highlighting display. |
Skin Lesions Showed Higher Levels of Th17 in Ps in Comparison to L-Lep
A total of 24 differential subtypes were confirmed amongst Ps, T-lep, and L-lep (Figure 2A). The signatures for Th17 cells, neutrophils, and CD4+ T cells were prominent in Ps than those of leprosy, especially L-lep. Macrophage, dendritic cells (DCs), CD8+ T cells, Th1 cells, and T helper cells except for Th17 cells were highly expressed in leprosy patients, although they had relatively low expression in Ps. The macrophage signature was the strongest in L-lep lesions, in line with the role of macrophage and DC in activating T cell responses as part of cell-mediated immunity in leprosy patients (Figure 2B).
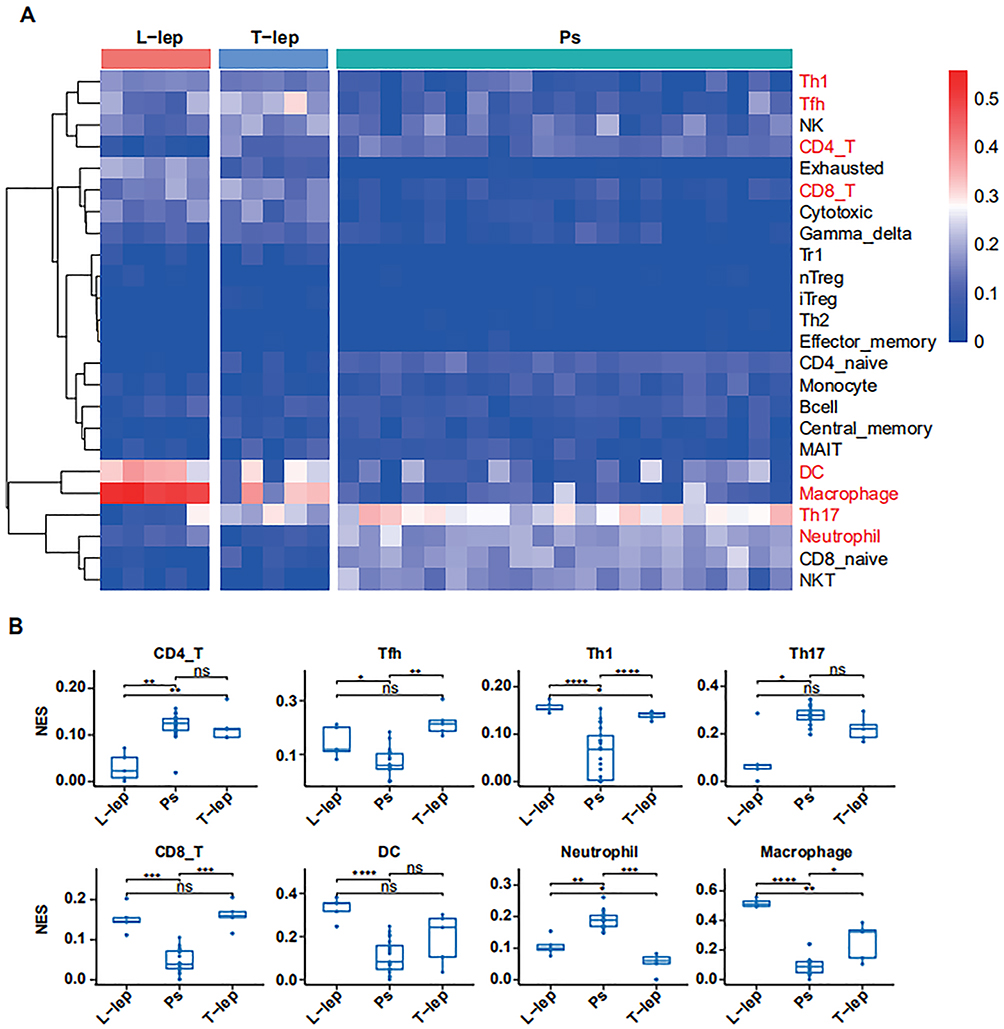 |
Figure 2 Immune cell signatures in Ps, T-lep, and L-lep. Abbreviations: Ps, psoriasis; T-lep, tuberculoid leprosy; L-lep, lepromatous leprosy; NES, normalised enrichment score; ns, no significance. Notes: (A) Heatmap of enrichment of immune-cell components across Ps, T-lep, and L-lep patients. Color represents the enrichment ratio across each row, with red as high and blue as low relative enrichment. (B) Boxplots showing estimated proportions of immune-cell subsets in Ps, T-lep, and L-lep patients. ****P < 0.0001, ***P < 0.001, **P < 0.01, *P < 0.05. |
Genes and Pathway Analyses Highlighted the Enrichment of Disease-Specific Axes
In the Ps/L-lep and Ps/T-lep group, integration of the functional pathway analysis of upregulated genes such as IL-19, IL-36A, and IL-17A identified pathways related to Th17 cell and neutrophil signatures, including “Th17 cell differentiation”, “Jak-STAT signalling pathway”, and “nucleotide-binding oligomerisation domain-like receptor signalling pathway” (Figure 3A). In the Ps versus L-lep and Ps versus T-lep’ lesions proportional median downregulated list, we noted a collection of genes (C-type lectin receptor 4e (CLEC4E), triggering receptor expressed on myeloid cells 2 (TREM2), and secreted phosphoprotein 1 (SPP1)) encoding macrophage function associated with “Natural killer cell mediated cytotoxicity”, “T cell receptor signalling pathway”, “TNF signalling pathway”, and “cytokine-cytokine receptor interaction” (Figure 3B).
 |
Figure 3 Specific networks for Ps versus T-lep and Ps versus L-lep. Gene ontology, Kyoto Encyclopedia of Genes and Genomes analysis, and reactome analyses were performed. Abbreviations: Ps, psoriasis; T-lep, tuberculoid leprosy; L-lep, lepromatous leprosy. Notes: (A) The top 100 upregulated genes of the proportional median list for Ps/T-lep and Ps/L-lep groups. (B) Downregulated immune molecular profiles in the Ps/L-lep and Ps/T-lep groups. Red highlighted represents upregulated genes, blue highlighted means downregulated genes, green highlighted denotes immune functions, yellow highlighted shows cell type, and gray lines represent connections between genes and immune functions and/or cell types. |
Distinct Immune Marker mRNA Levels Were Elevated in Lesional Psoriatic and Leprosy Skin
To validate the RNA-seq data and assess key immune markers, we evaluated 13 genes through qRT-PCR from Ps, leprosy and Control skin (Table 1). The relative expression of IL-19, IL-20, IL-36A, IL-36G, IL-22, IL-17A, and lipocalin 2 (LCN2) in Ps were 1770.743 ± 1127.302, 108.431 ± 32.497, 372.959 ± 226.343, 22.016 ± 6.061, 21.916 ± 17.320, 26.922 ± 26.087, and 17.784 ± 11.379, respectively and the fold changes of CLEC4E, TREM2, SPP1, and ITGAX in L-lep were 1725.321 ± 1189.338, 327.128 ± 248.275, 227.187 ± 145.595, and 23.309 ± 12.318, respectively. In the Ps group, the levels of Th17 markers (IL-19, IL-20, IL-36A, IL-36G, IL-22, IL-17A, IL-17F, and LCN2) were higher and macrophage/DC-related hallmarks (CLEC4E, ITGAX and TREM2), SPP1, and TNF-a were higher than those in the L-lep group with statistical significance (P < 0.05), similar to in Gene Set Enrichment Analysis (Figure 4).
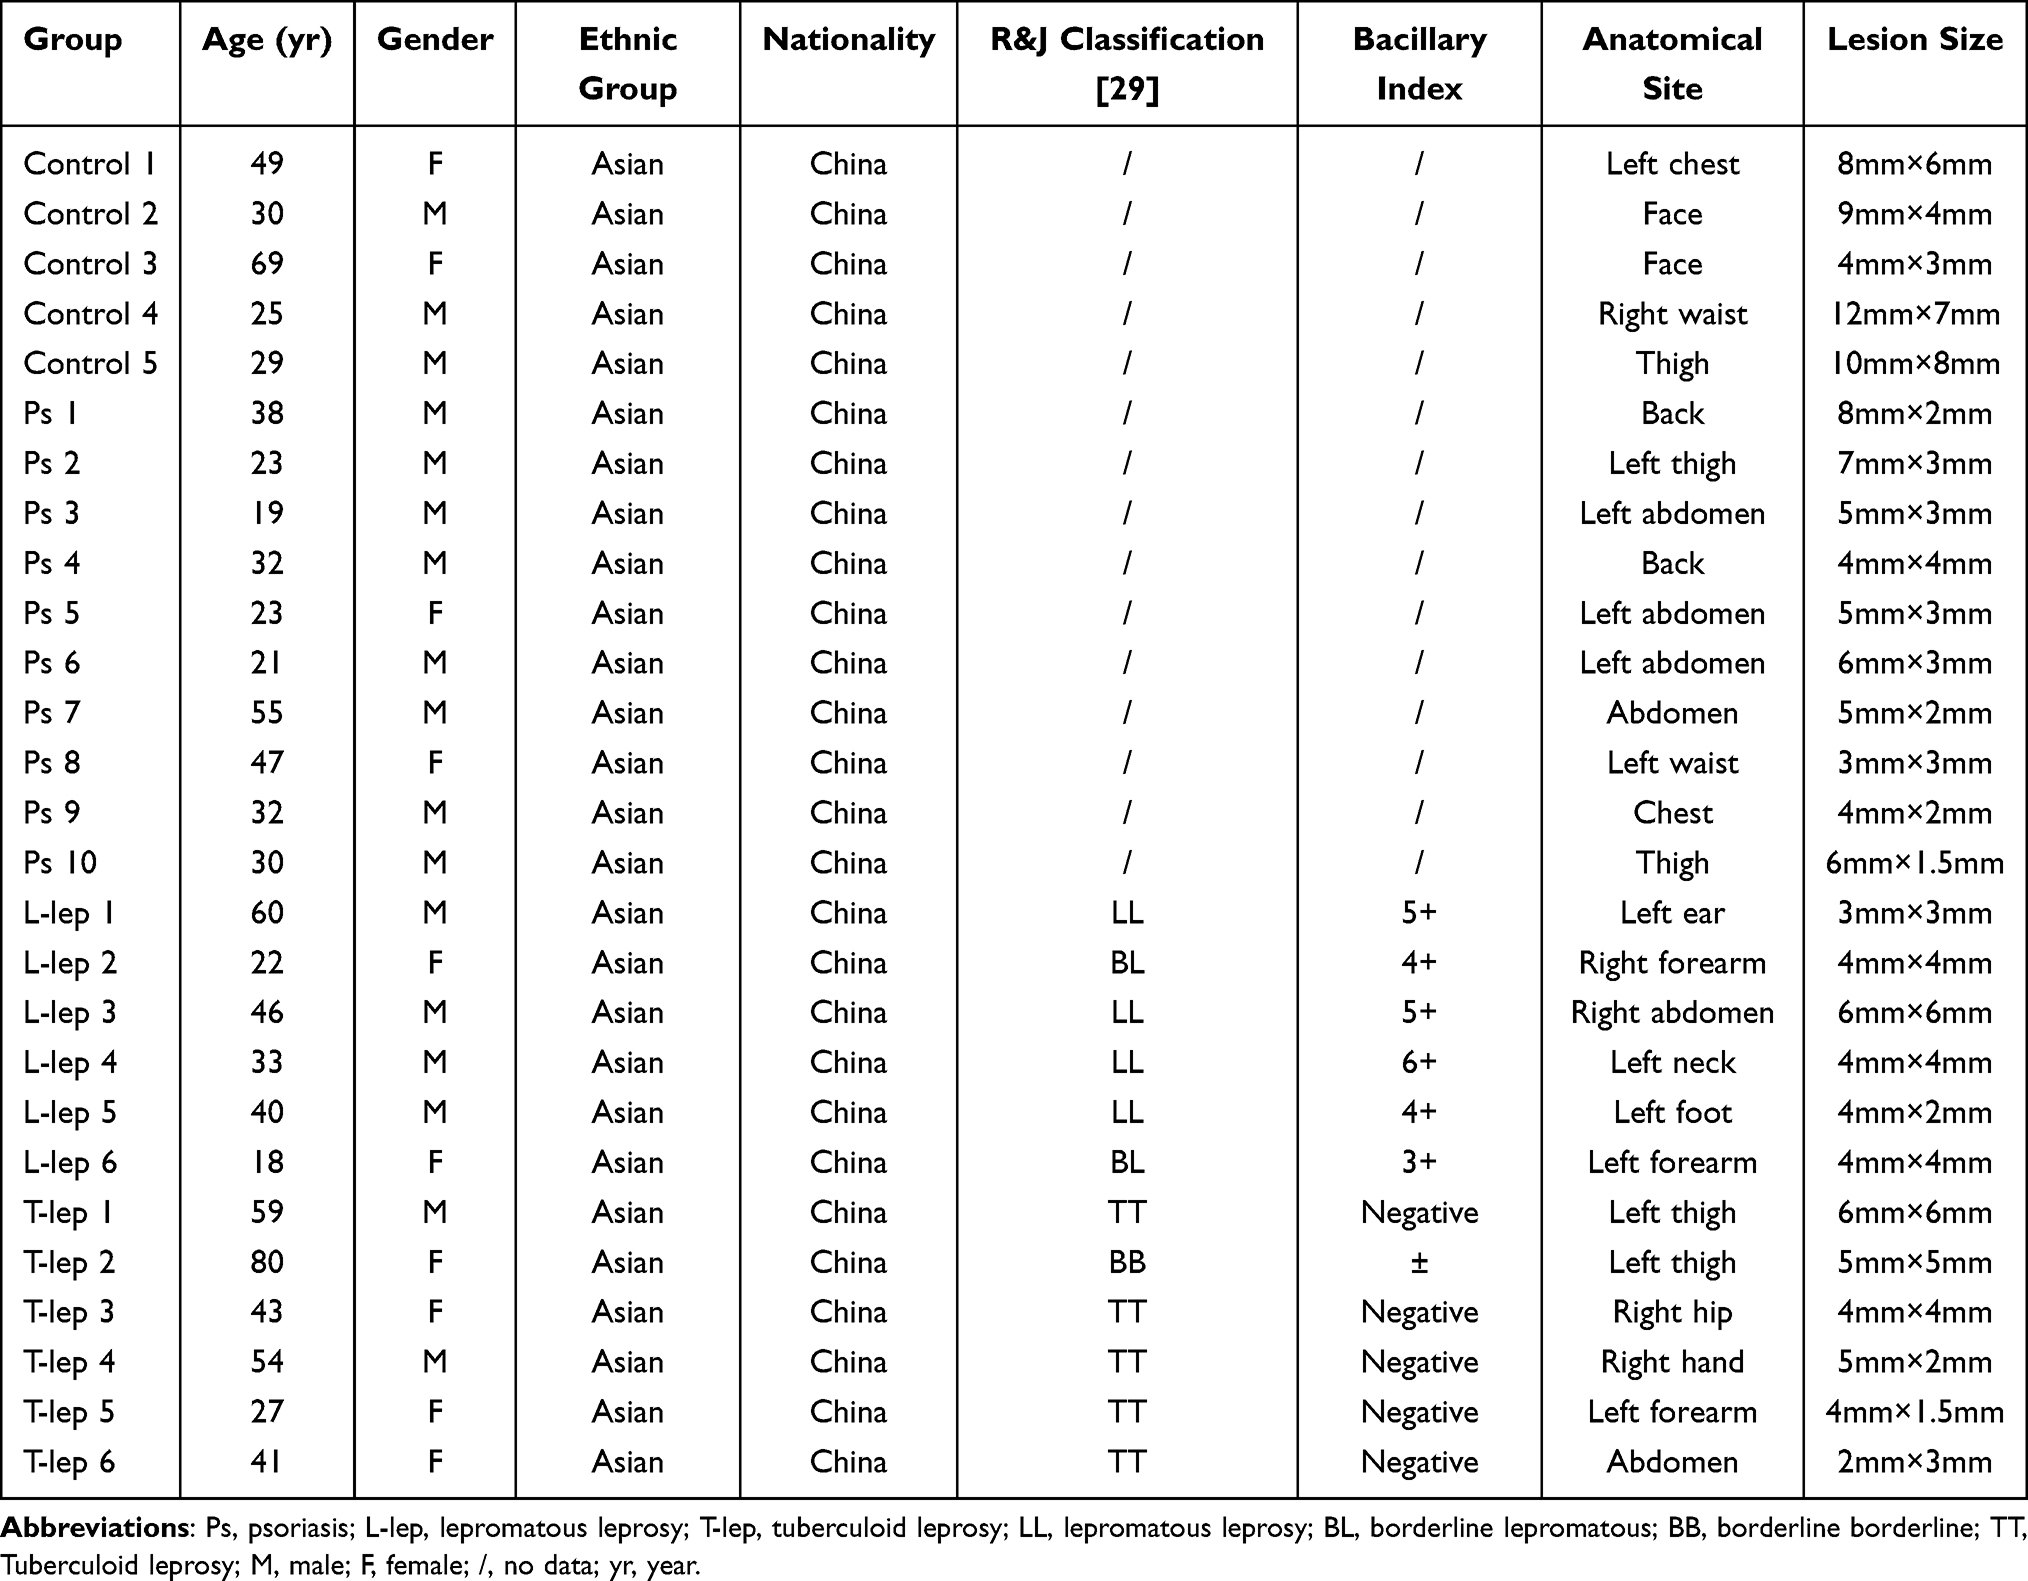 |
Table 1 Clinical and Demographic Characteristics of Patients for qRT-PCR |
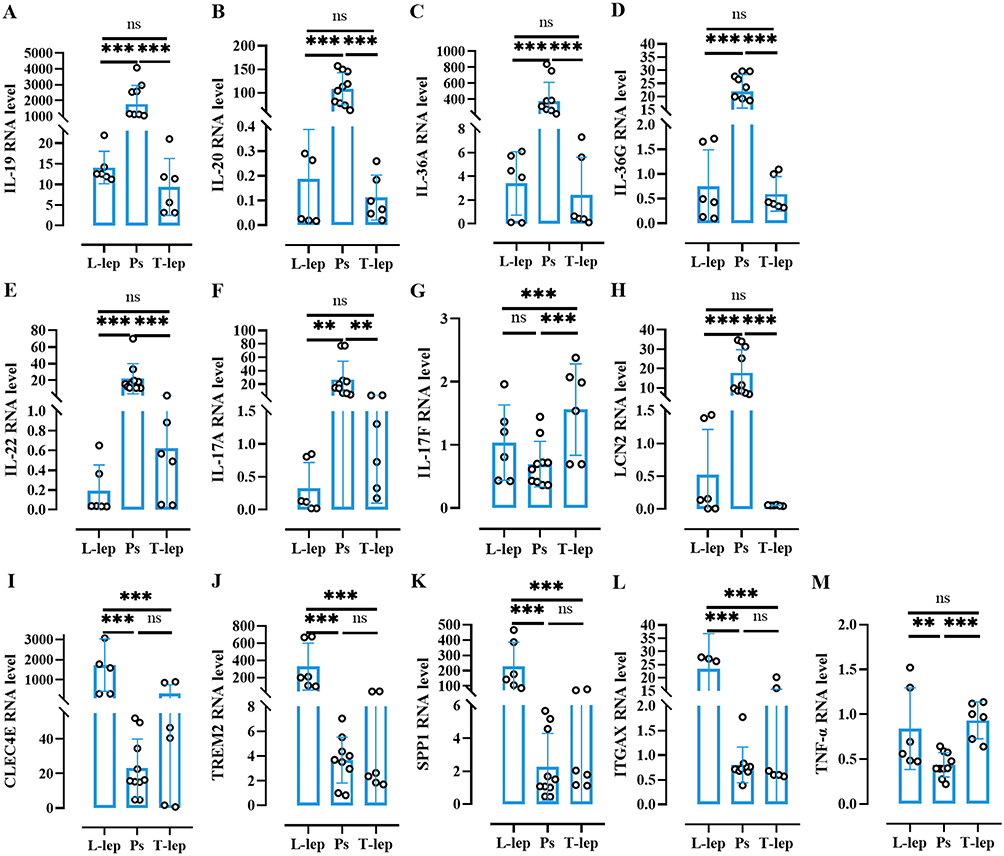 |
Figure 4 Cellular and immune biomarkers in Ps, T-lep, and L-lep. Abbreviations: Ps, psoriasis; T-lep, tuberculoid leprosy; L-lep, lepromatous leprosy; ns, no significance. Notes: (A–M) Fold changes of 13 markers (IL-19, IL-20, IL-36A, IL-36G, IL-22, IL-17A, IL-17F, and LCN2; CLEC4E, TREM2, SPP1, ITGAX, and TNF-a) detected in lesional psoriatic and leprosy by qRT-PCR. Bars indicate mean ± SEM. ***P < 0.001, **P < 0.01. |
Discussion
We successfully defined the molecular phenotypes and pathways of Ps and leprosy from the immunity point, identifying risk markers that demonstrated antagonistic associations with Ps, T-lep and L-lep.
Ps is a long-time condition result from cutaneous cells multiplying faster relative to normal caused by a dysregulated immune response. Mechanistically, psoriatic lesions due to the hyperproliferation and disturbed differentiation of epidermal keratinocytes intrigued by immune mediators of the IL-23/Th17 axis and IL-22/Th22 pathway.30 Regarding cytokines, IL-19, IL-20 and IL-24 are signal via IL-20 receptors and consist of a subgroup within the IL-10 cytokine family. IL-19, as a component of the IL-23/IL-17 axis, cements the IL-17A action and may be a molecule for the activity of the axis in chronic inflammatory disorders. Strikingly, IL-17A strengthens a cascade of effects, including the robust expression of IL-19 in mankind and mice.31 Consequently, the IL-36 circuit, when activated in plaque Ps,32 tends to be hyperactive in pustular forms. These inflammatory circuits multiply one another, with IL-17 response strengthening IL-36 production and activation, thereby creating interacting and self-sustaining inflammatory circuits in Ps.26 IL-22 is the main effector biomarker of Th22 cells and belongs to the IL-10 family.33 IL-22 is essential for inflammatory responses and is intricate in the pathogenesis of Ps. IL-22 gene expression is correlated with the balance between signal transducer and activator of transcription (STAT) 3 and STAT1 activation. Bai et al34 reveal that the heterozygous mutation of the STAT1 gene triggers the elevation of IL-22 and IL-17 A expression in CD4+ T cells, as well as much severer skin inflammation and higher levels of STAT3 activation in an imiquimod-induced murine Ps model. Specific targeting of the noncanonical transcription factor STAT3 activation by IL-22 could serve to treat Ps-like skin inflammation.35 The above cytokine networks in Ps have been demonstrated by the therapeutic effectiveness of cytokine-blocking biologics, including antibodies against TNF-α, IL-23/IL-12p40, anti-IL-23p19, IL-17A, and IL-17 receptor.26
In leprosy, lesions from TT have a higher frequency of CD4+ IL-17A+ cells relative to those from LL and higher levels of IL-17A and IL-1β are revealed in serum from paucibacillary in comparison to multibacillary patients denoting a role for IL-17A in restricting bacterial regeneration.36 Surprisingly, IL-22 may play a decisive role in leprosy immunity. The Th22 subset has been discovered in leprosy. Particularly, IL-22 can excite the production of calgranulin A and Rab7 proteins, contributing to increased intracellular Ca2+ levels and leading to improved phagolysosomal fusion.37 In the current study, the level of IL-19, IL-20, IL-36A, IL-36G, and IL-22 were lower in L-lep than in T-lep and Ps. We found that high IL-19, IL-20, IL-36A, IL-36G, and IL-22 expression in Ps were the natural selection for L-lep.
In our research, LCN2 had lower expression in L-lep and T-lep than in Ps. LCN2 is primarily derived from neutrophils, keratinocytes, CD4+ T cells, and macrophages. The Th17‐associated markers lipocalin 2 (LCN2) were able to differentiate Ps from hidradenitis suppurativa accurately.38 Notably, LCN2 may be a marker of Ps with mounting expression in psoriatic skin compared with healthy skin,39 but it may not be a reliable indicator of inflammation, severity of Ps, or efficacy of anti-Ps treatment. Mechanistically, LCN2 may need to synergise with certain stimuli or, as a downstream gene in the Th17 pathway, it may need a pre-existing Th17 inflammation to augment the features of Ps.40 Moreover, LCN2 knockdown attenuates Ps-like symptoms, suppress inflammatory response, and cease keratinocyte proliferation.41 Conversely, LCN2 limits the bacterial growth as a result of sequestering-iron-containing siderophores. In vitro, neutrophils deliver LCN2 to mycobacterium-infected macrophages early in infection, thereby augmenting the availability of intracellular iron and accordingly facilitating mycobacterial growth. Mice lacking the gene are reportedly more susceptible to bacterial infection relative to the wild type.42 Therefore, low LCN2 expression in L-lep and T-lep was the natural selection for Ps.
Leprosy has a spectrum of clinical manifestations and highly depends on the host’s immune response. Innate immunity also contributes to leprosy immunity. In T-lep, the activation of the classical signal by M1 macrophages leads to the expression of tumour necrosis factor (TNF)-a, IFN-γ, and inducible nitric oxide synthase, triggering the multiplication of free radicals that clear Bacillus.43 Moreover, L-lep shows a superiority of M2 macrophages that promote the production of IL-10 and transforming growth factor-β, causing immunosuppressive response.44 TNF may have antimycobacterial and immunopathologic effects.45 Lydakis et al46 present a case of development of L-lep following the administration of etanercept (TNF-a antagonist) for psoriatic arthritis. However, Ps induced by TNF-α inhibitor is a paradoxical reaction.47 Although TNF-a plays protective role in leprosy, we found that TNF-a levels were comparable amongst the Ps, L-lep, and T-lep groups, meaning it was the risk factor and not the determining factor in Ps.
CLEC4E encodes macrophage-inducible C-type lectin (Mincle) receptors on macrophages, DCs, monocytes, and neutrophils. Mincle recognises trehalose-6,6’-dimycolate in the mycobacterial cell wall and signals for the inherent immune system to respond to infection.48 Moreover, Mincle is the key switch for the transition of macrophages from cytokine production to high nitric oxide expression. Besides its stimulatory role on Toll-like receptor-mediated transcription, Mincle enhances the translation of key genes required for nitric oxide synthesis by p38 and eIF5A hypusination, resulting in granuloma resolution.49 Furthermore, the pattern-recognition receptors Mincle and nucleotide-binding oligomerization domain 2 uniquely interact with mycobacteria and synergistically drive immunological functions.50 The current findings of the novel role of CLEC4E in inducing autophagy is required for the control of Mycobacterium tuberculosis growth.51 We first found that the CLEC4E was positively correlated with leprosy, especially L-lep. The higher level of CLEC4E in L-lep relative to Ps and T-lep revealed that Ps and T-lep patients with low levels of CLEC4E were not susceptible to L-lep.
TREM2 is an activating receptor of the Ig-superfamily that combines lipids and disseminates intracellular signals via the adaptor DNAX-activating protein of 12 kDa (DAP12).52 TREM2 macrophages robustly aggregate in L-lep lesions in comparison to the T-lep samples. Morphologically, the spatial-seq data of the gene-expression pattern in TREM2 macrophages implies that these cells are programmed to transport and process lipids, and that they contain the foamy macrophages that characterised L-lep.5,53 Functionally, the DAP12-associated TREM2 recognized mycobacterial cell-wall mycolic acid-containing lipids and implied mycobacteria controlling host immunity via TREM2. Furthermore, TREM2 deletion enhances Mincle-induced macrophage activation in vitro and inflammation in vivo and accelerates the elimination of mycobacterial infection. Therefore, mycobacteria harnesses TREM2 for immune evasion.54 We found for the first time that the TREM2 level was higher in L-lep than in T-lep and Ps, suggesting that L-lep patients with high levels of TREM2 unlikely suffered from Ps and T-lep.
SPP1, exerts a T-helper type 1 cytokine function, regulating inflammatory cell accumulation and function. SPP1 was increased in Ps patients and may serve as a biomarker of some lipid abnormalities in them. Frenzel et al55 found that SPP1 may modulate Ps-like inflammation by altering lymphocyte distribution in skin and draining lymph nodes, as well as by inducing the IL-17 expression of inflammatory T cells. And, full-length and protease-cleaved products of SPP1 are elevated in infectious diseases.56 Nonetheless, we found that SPP1 had higher production in L-lep than in Ps as detected by RNA-seq and qRT-PCR. We found for the first time that the level of SPP1 was higher in L-lep than in T-lep and Ps, indicating that L-lep patients with high levels of SPP1 were not susceptible to Ps and T-lep.
The limitation of this study is a few leprosy patients were encompassed. However, we added enough samples of psoriasis, and deliver complete discrimination between psoriasis and leprosy with accurate detection of disease-associated cytokines and pathways. This may provide a useful way for studying cutaneous disease in clinical trials.
Conclusion
In conclusion, Ps and L-lep are two distinct diseases immunologically. High IL-17A, IL-19, IL-20, IL-36A, IL-36G, IL-22, and LCN2 expression in Ps and T-lep might be the natural selection for L-lep, and L-lep patients with high levels of CLEC4E, TREM2, and SPP1 might be not susceptible to Ps and T-lep. Together, the immunological observation finds scientific evidence and paves the way for further investigations of the molecular mechanisms of Ps and leprosy.
Data Sharing Statement
The data presented in the study are deposited in the BioProject repository, accession numbers PRJNA915254. The data presented in this work are available upon request from the corresponding author.
Ethical Approval
The approvals were obtained from the institutional ethical committee of the Institute of Dermatology, Chinese Academy of Medical Sciences and Peking Union Medical College (2014-KY-003). All procedures were carried out in accordance with the principles of the Helsinki Declaration. Written informed consent was obtained from all patients.
Acknowledgments
The authors acknowledge the contributions of all the scientists in this area and apologize for failing to cite any work due to constraints of space.
Author Contributions
All authors made a significant contribution to the work reported, whether that is in the conception, study design, execution, acquisition of data, analysis and interpretation, or in all these areas; took part in drafting, revising or critically reviewing the article; gave final approval of the version to be published; have agreed on the journal to which the article has been submitted; and agree to be accountable for all aspects of the work.
Funding
This study was supported by grants from the National Key R&D Program of China (grant number 2019YFE0113300), National Natural Science Foundation of China (grant numbers 81972950, 82173431, 82103748), the Nanjing Incubation Program for National Clinical Research Center (grant number 2019060001), Chinese Academy of Medical Sciences Innovation Fund for Medical Science (2022-I2M-C&T-B-094).
Disclosure
The authors report no conflicts of interest in this work.
References
1. Sharma R, Singh P, McCoy RC, et al. Isolation of mycobacterium lepromatosis and development of molecular diagnostic assays to distinguish mycobacterium leprae and M. lepromatosis. Clin Infect Dis. 2020;71:e262–e269. doi:10.1093/cid/ciz1121
2. Du Toit A. Circulating leprosy in the wild. Nat Rev Microbiol. 2022;20:2. doi:10.1038/s41579-021-00653-1
3. Tomaselli PJ, Dos SD, Dos SA, et al. Primary neural leprosy: clinical, neurophysiological and pathological presentation and progression. Brain. 2022;145:1499–1506. doi:10.1093/brain/awab396
4. Maymone M, Laughter M, Venkatesh S, et al. Leprosy: clinical aspects and diagnostic techniques. J Am Acad Dermatol. 2020;83:1–14. doi:10.1016/j.jaad.2019.12.080
5. Ma F, Hughes TK, Teles R, et al. The cellular architecture of the antimicrobial response network in human leprosy granulomas. Nat Immunol. 2021;22:839–850. doi:10.1038/s41590-021-00956-8
6. Sheikh UA, Hill C. Case Report: leprosy and Psoriasis: a Rare Coexistence. Am J Trop Med Hyg. 2020;103:206–208. doi:10.4269/ajtmh.19-0646
7. Li J, Fu X, Sun L, Xue X, Liu H, Zhang F. Case report: lepromatous leprosy and psoriasis: an uncommon coincidence. Am J Trop Med Hyg. 2023;108:317–319. doi:10.4269/ajtmh.22-0324
8. Froes LJ, Trindade M, Sotto MN. Immunology of leprosy. Int Rev Immunol. 2022;41:72–83. doi:10.1080/08830185.2020.1851370
9. Greb JE, Goldminz AM, Elder JT, et al. Psoriasis. Nat Rev Dis Primers. 2016;2:16082. doi:10.1038/nrdp.2016.82
10. Ploemacher T, Faber WR, Menke H, Rutten V, Pieters T. Reservoirs and transmission routes of leprosy; A systematic review. PLoS Negl Trop Dis. 2020;14:e8276. doi:10.1371/journal.pntd.0008276
11. Anonymous. Global leprosy (Hansen disease) update, 2021: moving towards interruption of transmission. Week Epidemiol Rec. 2022;2022:97.
12. Bassukas ID, Gaitanis G, Hundeiker M. Leprosy and the natural selection for psoriasis. Med Hypotheses. 2012;78:183–190. doi:10.1016/j.mehy.2011.10.022
13. McFadden JP, Baker BS, Powles AV, Fry L. Psoriasis and streptococci: the natural selection of psoriasis revisited. Br J Dermatol. 2009;160:929–937. doi:10.1111/j.1365-2133.2009.09102.x
14. Nair RP, Stuart PE, Nistor I, et al. Sequence and haplotype analysis supports HLA-C as the psoriasis susceptibility 1 gene. Am J Hum Genet. 2006;78:827–851. doi:10.1086/503821
15. Henseler T, Christophers E. Disease concomitance in psoriasis. J Am Acad Dermatol. 1995;32:982–986. doi:10.1016/0190-9622(95)91336-x
16. Alter A, Huong NT, Singh M, et al. Human leukocyte antigen class I region single-nucleotide polymorphisms are associated with leprosy susceptibility in Vietnam and India. J Infect Dis. 2011;203:1274–1281. doi:10.1093/infdis/jir024
17. Shankarkumar U, Ghosh K, Badakere S, Mohanty D. Novel HLA Class I alleles associated with Indian leprosy patients. J Biomed Biotechnol. 2003;2003:208–211. doi:10.1155/S1110724303210019
18. Da SS, Mazini PS, Reis PG, et al. HLA-DR and HLA-DQ alleles in patients from the south of Brazil: markers for leprosy susceptibility and resistance. Bmc Infect Dis. 2009;9:134. doi:10.1186/1471-2334-9-134
19. Bloch Y, Bouchareychas L, Merceron R, et al. Structural activation of pro-inflammatory human cytokine IL-23 by cognate IL-23 receptor enables recruitment of the shared receptor IL-12Rbeta1. Immunity. 2018;48:45–58. doi:10.1016/j.immuni.2017.12.008
20. Gunter NV, Yap B, Chua C, Yap WH. Combining understanding of immunological mechanisms and genetic variants toward development of personalized medicine for psoriasis patients. Front Genet. 2019;10:395. doi:10.3389/fgene.2019.00395
21. Nakajima T, Yoshifuji H, Shimizu M, et al. A novel susceptibility locus in the IL12B region is associated with the pathophysiology of Takayasu arteritis through IL-12p40 and IL-12p70 production. Arthritis Res Ther. 2017;19:197. doi:10.1186/s13075-017-1408-8
22. Wang H, Wang C, Wang Z, et al. Identification of ZFP36L1 as an early-onset psoriasis risk gene demonstrates opposite associations with leprosy and psoriasis in the Chinese population. J Eur Acad Dermatol Venereol. 2020;34:e520–e523. doi:10.1111/jdv.16437
23. Rosenberg EW, Noah PW, Skinner RJ. Psoriasis is a visible manifestation of the skin’s defense against micro-organisms. J Dermatol. 1994;21:375–381. doi:10.1111/j.1346-8138.1994.tb01758.x
24. Zhang B, Roesner LM, Traidl S, et al. Single-cell profiles reveal distinctive immune response in atopic dermatitis in contrast to psoriasis. Allergy. 2022. doi:10.1111/all.15486
25. Puig L, Costanzo A, Munoz-Elias EJ, et al. The biological basis of disease recurrence in psoriasis: a historical perspective and current models. Br J Dermatol. 2022;186:773–781. doi:10.1111/bjd.20963
26. Griffiths C, Armstrong AW, Gudjonsson JE, Barker J. Psoriasis. Lancet. 2021;397:1301–1315. doi:10.1016/S0140-6736(20)32549-6
27. Attia EA, Abdallah M, El-Khateeb E, et al. Serum Th17 cytokines in leprosy: correlation with circulating CD4(+) CD25 (high)FoxP3 (+) T-regs cells, as well as down regulatory cytokines. Arch Dermatol Res. 2014;306:793–801. doi:10.1007/s00403-014-1486-2
28. Pai VV, Kikkeri NN, Athanikar SB, Rao R. Psoriasis and leprosy: a mystifying coexistence. Cutis. 2013;92:E3–E4.
29. Rodrigues JI, Gresta LT, Noviello ML, Cartelle CT, Lyon S, Arantes RM. Leprosy classification methods: a comparative study in a referral center in Brazil. Int J Infect Dis. 2016;45:118–122. doi:10.1016/j.ijid.2016.02.018
30. Ghoreschi K, Balato A, Enerback C, Sabat R. Therapeutics targeting the IL-23 and IL-17 pathway in psoriasis. Lancet. 2021;397:754–766. doi:10.1016/S0140-6736(21)00184-7
31. Ha HL, Wang H, Claudio E, Tang W, Siebenlist U. IL-20-receptor signaling delimits IL-17 production in psoriatic inflammation. J Invest Dermatol. 2020;140:143–151. doi:10.1016/j.jid.2019.06.127
32. Johnston A, Xing X, Guzman AM, et al. IL-1F5, -F6, -F8, and -F9: a novel IL-1 family signaling system that is active in psoriasis and promotes keratinocyte antimicrobial peptide expression. J Immunol. 2011;186:2613–2622. doi:10.4049/jimmunol.1003162
33. Ouyang W, O’Garra A. IL-10 Family Cytokines IL-10 and IL-22: from basic science to clinical translation. Immunity. 2019;50:871–891. doi:10.1016/j.immuni.2019.03.020
34. Bai L, Fang H, Xia S, et al. STAT1 activation represses IL-22 gene expression and psoriasis pathogenesis. Biochem Biophys Res Commun. 2018;501:563–569. doi:10.1016/j.bbrc.2018.05.042
35. Michiels C, Puigdevall L, Cochez P, et al. A targetable, noncanonical signal transducer and activator of transcription 3 activation Induced by the Y-less region of IL-22 receptor orchestrates imiquimod-induced psoriasis-like dermatitis in mice. J Invest Dermatol. 2021;141:2668–2678. doi:10.1016/j.jid.2021.04.016
36. Santos MB, de Oliveira DT, Cazzaniga RA, et al. Distinct roles of Th17 and Th1 cells in inflammatory responses associated with the presentation of paucibacillary leprosy and leprosy reactions. Scand J Immunol. 2017;86:40–49. doi:10.1111/sji.12558
37. de Lima SE, de Sousa JR, de Sousa AT, et al. New immunologic pathways in the pathogenesis of leprosy: role for Th22 cytokines in the polar forms of the disease. J Am Acad Dermatol. 2015;72:729–730. doi:10.1016/j.jaad.2014.11.023
38. Navrazhina K, Renert-Yuval Y, Frew JW, et al. Large-scale serum analysis identifies unique systemic biomarkers in psoriasis and hidradenitis suppurativa. Br J Dermatol. 2022;186:684–693. doi:10.1111/bjd.20642
39. Abdel HR, Samir N, Safwat M, Rashed L, Soliman M. Tissue lipocalin-2 in psoriasis: is it a marker of metabolic disturbance or a possible marker of therapeutic efficacy after narrow band ultraviolet B? J Dermatolog Treat. 2020;31:519–523. doi:10.1080/09546634.2019.1605141
40. Hau CS, Kanda N, Tada Y, et al. Lipocalin-2 exacerbates psoriasiform skin inflammation by augmenting T-helper 17 response. J Dermatol. 2016;43:785–794. doi:10.1111/1346-8138.13227
41. Wang H, Xu Y, Jin M, Li H, Li S. miR-383 reduces keratinocyte proliferation and induces the apoptosis in psoriasis via disruption of LCN2-dependent JAK/STAT pathway activation. Int Immunopharmacol. 2021;96:107587. doi:10.1016/j.intimp.2021.107587
42. Dahl SL, Woodworth JS, Lerche CJ, et al. Lipocalin-2 Functions as Inhibitor of Innate Resistance to Mycobacterium tuberculosis. Front Immunol. 2018;9:2717. doi:10.3389/fimmu.2018.02717
43. Simoes QJ, de Almeida FA, de Souza AT, et al. Transforming growth factor beta and apoptosis in leprosy skin lesions: possible relationship with the control of the tissue immune response in the Mycobacterium leprae infection. Microbes Infect. 2012;14:696–701. doi:10.1016/j.micinf.2012.02.010
44. Shapouri-Moghaddam A, Mohammadian S, Vazini H, et al. Macrophage plasticity, polarization, and function in health and disease. J Cell Physiol. 2018;233:6425–6440. doi:10.1002/jcp.26429
45. Whitworth LJ, Troll R, Pagan AJ, et al. Elevated cerebrospinal fluid cytokine levels in tuberculous meningitis predict survival in response to dexamethasone. Proc Natl Acad Sci U S A. 2021:118. doi:10.1073/pnas.2024852118
46. Lydakis C, Ioannidou D, Koumpa I, et al. Development of lepromatous leprosy following etanercept treatment for arthritis. Clin Rheumatol. 2012;31:395–398. doi:10.1007/s10067-011-1903-2
47. Mazloom SE, Yan D, Hu JZ, et al. TNF-alpha inhibitor-induced psoriasis: a decade of experience at the Cleveland Clinic. J Am Acad Dermatol. 2020;83:1590–1598. doi:10.1016/j.jaad.2018.12.018
48. Lu X, Nagata M, Yamasaki SM. 20 years of a versatile sensor of insults. Int Immunol. 2018;30:233–239. doi:10.1093/intimm/dxy028
49. Lee WB, Kang JS, Choi WY, et al. Mincle-mediated translational regulation is required for strong nitric oxide production and inflammation resolution. Nat Commun. 2016;7:11322. doi:10.1038/ncomms11322
50. Dube JY, McIntosh F, Behr MA. Mice dually disrupted for nod2 and mincle manifest early bacteriological control but late susceptibility during mycobacterium tuberculosis infection. Front Immunol. 2022;13:862992. doi:10.3389/fimmu.2022.862992
51. Pahari S, Negi S, Aqdas M, Arnett E, Schlesinger LS, Agrewala JN. Induction of autophagy through CLEC4E in combination with TLR4: an innovative strategy to restrict the survival of Mycobacterium tuberculosis. Autophagy. 2020;16:1021–1043. doi:10.1080/15548627.2019.1658436
52. Ulland TK, Song WM, Huang SC, et al. TREM2 maintains microglial metabolic fitness in alzheimer’s disease. Cell. 2017;170:649–663. doi:10.1016/j.cell.2017.07.023
53. Jaitin DA, Adlung L, Thaiss CA, Weiner A, Amit I. Lipid-associated macrophages control metabolic homeostasis in a trem2-dependent manner. Cell. 2019;2019:178.
54. Iizasa E, Chuma Y, Uematsu T, et al. TREM2 is a receptor for non-glycosylated mycolic acids of mycobacteria that limits anti-mycobacterial macrophage activation. Nat Commun. 2021;12:2299. doi:10.1038/s41467-021-22620-3
55. Frenzel DF, Borkner L, Scheurmann J, Singh K, Scharffetter-Kochanek K, Weiss JM. Osteopontin deficiency affects imiquimod-induced psoriasis-like murine skin inflammation and lymphocyte distribution in skin, draining lymph nodes and spleen. Exp Dermatol. 2015;24:305–307. doi:10.1111/exd.12649
56. Hattori T, Iwasaki-Hozumi H, Bai G, et al. Both full-length and protease-cleaved products of osteopontin are elevated in infectious diseases. Biomedicines. 2021;9:1006. doi:10.3390/biomedicines9081006
 © 2023 The Author(s). This work is published and licensed by Dove Medical Press Limited. The
full terms of this license are available at https://www.dovepress.com/terms
and incorporate the Creative Commons Attribution
- Non Commercial (unported, 3.0) License.
By accessing the work you hereby accept the Terms. Non-commercial uses of the work are permitted
without any further permission from Dove Medical Press Limited, provided the work is properly
attributed. For permission for commercial use of this work, please see paragraphs 4.2 and 5 of our Terms.
© 2023 The Author(s). This work is published and licensed by Dove Medical Press Limited. The
full terms of this license are available at https://www.dovepress.com/terms
and incorporate the Creative Commons Attribution
- Non Commercial (unported, 3.0) License.
By accessing the work you hereby accept the Terms. Non-commercial uses of the work are permitted
without any further permission from Dove Medical Press Limited, provided the work is properly
attributed. For permission for commercial use of this work, please see paragraphs 4.2 and 5 of our Terms.
Recommended articles
Bimekizumab for the Treatment of Psoriasis: A Review of the Current Knowledge
Ruggiero A, Potestio L, Camela E, Fabbrocini G, Megna M
Psoriasis: Targets and Therapy 2022, 12:127-137
Published Date: 8 June 2022
Long-Term Efficacy and Safety of Guselkumab for Moderate to Severe Psoriasis: A 3-Year Real-Life Retrospective Study
Megna M, Potestio L, Fabbrocini G, Ruggiero A
Psoriasis: Targets and Therapy 2022, 12:205-212
Published Date: 14 July 2022
Resveratrol Ameliorates Imiquimod-Induced Psoriasis-Like Mouse Model via Reducing Macrophage Infiltration and Inhibiting Glycolysis
Wang Y, Qi C, Feng F, Hu X, Zhao N, Zhao J, Di T, Meng Y, Yang D, Zhu H, Zhang X, Li P, Wang Y
Journal of Inflammation Research 2023, 16:3823-3836
Published Date: 30 August 2023
Preliminary Investigation and Therapeutic Efficacy Determination of a Novel Anti-IL-17A Antibody, Indikizumab
Patra AK, Nayak S, Moharana A, Ojha P, Das SK, Akhtar J, Giri B, Singh S
Biologics: Targets and Therapy 2024, 18:257-271
Published Date: 17 September 2024
Indole-3-Lactic Acid Attenuates IMQ-Induced Psoriasiform Dermatitis in Mice via AhR-Dependent Suppression of IL-17A
Meng Z, Ren J, Lai Y, Lu S, Wu H, Jiang Y, Zhang Z, Tan G, Shi Z
Psoriasis: Targets and Therapy 2026, 16:585731
Published Date: 27 March 2026