")
Back to Journals » Journal of Inflammation Research » Volume 16
Prognostic Value of Combined LMR and CEA Dynamic Monitoring in Postoperative Colorectal Cancer Patients
Authors Chen S, Zhang J, Qian C, Qi X, Mao Y, Lu T
Received 13 June 2023
Accepted for publication 12 September 2023
Published 22 September 2023 Volume 2023:16 Pages 4229—4250
DOI https://doi.org/10.2147/JIR.S422500
Checked for plagiarism Yes
Review by Single anonymous peer review
Peer reviewer comments 3
Editor who approved publication: Professor Ning Quan
Shan Chen,1 Jie Zhang,1 Chengjia Qian,2 Xiaowei Qi,3 Yong Mao,1 Tingxun Lu1
1Department of Oncology, Affiliated Hospital of Jiangnan University, Wuxi, Jiangsu Province, 214122, People’s Republic of China; 2Department of Gastrointestinal Surgery, Affiliated Hospital of Jiangnan University, Wuxi, Jiangsu Province, 214122, People’s Republic of China; 3Department of Pathology, Affiliated Hospital of Jiangnan University, Wuxi, Jiangsu Province, 214122, People’s Republic of China
Correspondence: Tingxun Lu, Department of Oncology, Affiliated Hospital of Jiangnan University, 1000, Hefeng Road, Wuxi, 214122, Jiangsu, People’s Republic of China, Email [email protected]
Purpose: We aim to investigate the clinical significance of dynamic changes in the lymphocyte-to-monocyte ratio (LMR) and neutrophil-lymphocyte ratio (NLR) in peripheral blood at different time points combined with CEA in the prediction of postoperative-recurrence-in-patients with colorectal cancer (CRC).
Patients and Methods: This study collected 357 patients with stage I–III CRC between 2016 and April 2018. The dynamic changes from preoperative to postoperative LMR (p-LMR-p) and NLR (p-NLR-p) were analyzed using COX regression for multivariate analysis. Logistic regression was used to investigate whether the dynamic changes from post-treatment to pre-end of follow-up LMR (p-LMR-f) and NLR (p-NLR-f) were independent risk factors for CRC recurrence and to construct a predictive model. Internal validation using bootstrapping was performed to validate the discrimination ability of the model. The models’ discriminative effect, calibration degree, and clinical utility were assessed.
Results: In both the total cohort and the adjuvant therapy group, the dynamic changes of p-LMR-p (High-High vs Low-Low: p=0.006; HR:2.210, 95% CI: 1.256– 3.890) were found to be independent prognostic factors for recurrence-free survival (RFS) in CRC patients. Additionally, logistic regression analysis revealed that N stage, CEA, LMR of pre-end of follow-up (f-LMR), and p-LMR-f were independent risk factors for CRC recurrence. In the total cohort, the p-LMR-f had an area under the curve (AUC) of 0.704, with a sensitivity of 64% and a specificity of 75.3%. By combining p-LMR-f with CEA, a predictive model was constructed, which showed an AUC of 0.913 (0.986– 0.913) in the total cohort and an AUC of 0.924 (0.902– 0.924) in the adjuvant therapy group during internal validation using bootstrapping.
Conclusion: Dynamic changes in LMR can be used to predict the prognosis of CRC and serve as a biomarker for predicting CRC recurrence. Combined with CEA, it can improve the predictive performance for detecting CRC recurrence.
Keywords: colorectal cancer, postoperative recurrence, predictive model, inflammatory markers
Introduction
Colorectal cancer (CRC) is one of the most common malignant tumors, accounting for approximately 10% of all new malignant tumors and 9.2% of deaths worldwide, ranking third in incidence and second in mortality of all malignant tumors, respectively.1 With the development of treatment technology, the morbidity and mortality rates in developed countries are decreasing, but the morbidity rates in the rest of the countries continue to increase. It is estimated that in 2030, the number of new cases and deaths will exceed 2.2 million and 1.1 million, respectively, and the age of onset will gradually become younger.2–4 The primary treatment for colorectal cancer patients is radical surgery and postoperative adjuvant chemotherapy. Even so, 40% of patients will relapse after radical surgery. Recurrence often manifests as local recurrence, distant metastasis, and metachronous cancer.5 Of these, 80% of patients will relapse recur within two years, and 95% will relapse recur within five years. Therefore, long-term follow-up examinations are required after radical surgical treatment, often requiring repeated serological CEA, invasive colorectal microscopy, and imaging to monitor the patient’s disease status. However, the above tests often have disadvantages such as invasive operation, high economic burden, and poor patient compliance. Therefore, there is an urgent need for an examination modality with clinical reproducibility, easy detection, and economic features for monitoring the disease status of patients after radical surgery and predicting patient prognosis.
The persistent increase of inflammatory cells and mediators in the TME often indicates tumor progression.6 Studies show that complete blood count ratios may help understand TME.7,8 For example, inflammation-related markers [peripheral blood lymphocyte-monocyte ratio (LMR), neutrophil-lymphocyte ratio (NLR), platelet-lymphocyte ratio (PLR), etc.] can indirectly reflect changes in immune cells in the TME.7,9,10 Most previous studies on inflammation-related markers have focused on the predictive value of diseases such as CRC, breast cancer, and pancreatic cancer.11–15 Meanwhile, the UK and the Netherlands studies have found the value of inflammatory biomarkers for early CRC identification.16,17 Additionally, studies have found that longitudinal changes in preoperative to post-treatment NLR and LMR can be prognostic factors for CRC.14,18 However, no studies have been reported on whether dynamic changes in LMR and NLR from post-treatment to pre-end of follow-up can be used as a biological marker in CRC recurrence patients, whether dynamic changes in LMR and NLR combined with CEA can improve the diagnostic value of CEA in clinical recurrence further investigation.
This study aims to assess the value of dynamic changes in LMR and NLR or combined with CEA at different time points (pre-operative, post-treatment, pre-end of follow-up) in clinical recurrence and prediction of prognosis in CRC patients and to explore an efficient and convenient, non-invasive, economical, and reproducible biological marker to monitor the disease status of CRC patients.
Materials and Methods
Study Population
Clinical data from 357 patients with stage I–III CRC admitted from January 2016 to April 2018 were included in this study from the Affiliated Hospital of Jiangnan University. Inclusion criteria: pathological diagnosis of CRC, confirmed clinical stage I–III according to the TNM staging of AJCC 2017 8th edition, with complete blood count for different longitudinal periods, such as pre-operative, post-treatment, pre-end of follow-up (relapse or no relapse), and CEA data. Exclusion criteria: inflammatory bowel disease-related CRC, familial adenomatous polyposis, history of other malignancies, hematologic disorders, autoimmune disorders, history of schistosomiasis, being in an acute infection state (elevated inflammatory markers), and patients after neoadjuvant therapy were not included in this study. This study was a retrospective study and the informed consent of all patients was obtained before the study. The Ethics Committee of the Affiliated Hospital of Jiangnan University approved this research. To ensure patient privacy, all selected patients were identified by patient number and did not involve personal information.
Data Collection
Data were collected for each patient at three different time points, including absolute neutrophil count, absolute peripheral blood lymphocyte count, absolute monocyte count, and CEA. Data Collection Period: half a month preoperative, two months after surgery (without postoperative adjuvant treatment), or within two months after postoperative adjuvant therapy, and two months before the time of recurrence or within one year before the end of non-recurrence follow-up. All patients were followed up for at least five years or until disease recurrence. Disease recurrence was assessed primarily by serologic tumor marker monitoring and confirmed by imaging or pathologic biopsy. Recurrence-free survival (RFS) was defined as the length of time from radical surgery to confirmation of disease recurrence or the end of follow-up.
Statistical Analysis
The optimal cut-off values of LMR, NLR, and CEA are obtained based on the receiver operating characteristic curve (ROC) and the Youden index. Categorical variables were analyzed using the χ2 test and Fisher’s exact test. We divided patients into four distinct groups for both the LMR and NLR based on the preoperative and post-treatment values: low preoperative value to low post-treatment value (Low-Low), high preoperative value to high post-treatment value (High-High), low preoperative discount to high post-treatment value (Low-High), and high preoperative value to low post-treatment value (High-Low). Further classification of post-treatment LMR (pos-LMR) or NLR (pos-NLR) and pre-end of follow-up LMR (f-LMR) or NLR (f-NLR) into Low-Low, High-High, Low-High, and High-Low subgroups was conducted. Kaplan -Meier survival curves were generated and then compared by Log rank testing. The multivariate Cox regression analysis adjusted the model for prognostic clinicopathological factors significantly associated with RFS in univariate analysis. Logistic regression analysis assessed independent risk factors associated with recurrence in CRC patients. Model fitting, nomogram presentation, model validation, and evaluation of prediction effectiveness were performed using the R.4.1.2 programming software. All statistical tests were two-sided; p-values less than 0.05 were considered statistically significant. All analyses used IBM SPSS software version 26 and R (Version 4.1.2).
Results
Baseline Characteristics of CRC Patients
A total of 723 patients underwent post-radical CRC surgery from January 2016 to April 2018: 141 patients with missing preoperative or post-treatment data, One case of CRC associated with inflammatory bowel disease, 47 patients undergoing neoadjuvant therapy before surgery, three patients with autoimmune disorders, 47 patients in an infected state, 68 patients with a history of other cancers, 11 patients with parasitic infections, three patients with familial adenomatous polyposis, and 45 patients with missing follow-up. Three hundred fifty-seven patients met the inclusion criteria. Two hundred thirty-eight patients received adjuvant therapy, while 119 cases underwent surgery alone (Figure 1).
 |
Figure 1 Flow chart of the patient cohort based on inclusion and exclusion criteria. Abbreviations: LMR, lymphocyte-to-monocytes ratio; n, number. |
The total cohort was predominantly male patients (58.3%) (Table 1). The primary site of the tumor was primarily the left-sided colon (42.1%); however, in the adjuvant therapy group, the majority of cases are focused on rectal cancer (45.8%) (Supplementary Table 1). Tissue differentiation was predominantly moderately differentiated adenocarcinoma (51.5%), and most patients had T stage 4 (67.4%), and most patients did not have lymph node metastasis (59.7%). Low LMR group were mainly observed in the pre-LMR and pos-LMR, and recurrence was observed in 37.8% and 35.8% of patients in the Low group. The High group (33.1%) showed a predominance of f-LMR, while 71.4% of patients in the Low group experienced recurrence. The dynamics of LMR were dominated by the Low-Low group (p-LMR-p:40.9%, p-LMR-f:20.7%). However, regarding pre-NLR and pos-NLR, the Low group is predominant (82.6%/92.2%) (Table 1). As for pre-to-post treatment NLR (p-NLR-p), the High-High group (69.7%) is mainly represented. On the other hand, post-treatment to the pre-end of follow-up NLR (p-NLR-f) is evenly distributed between the Low-Low group (17.4%) and the High-High group (19.9%) (Table 1). There were 114 (31.8%) patients who relapsed during follow-up. Specific patient baseline characteristics are shown in Table 1, Supplementary Tables 1 and 2.
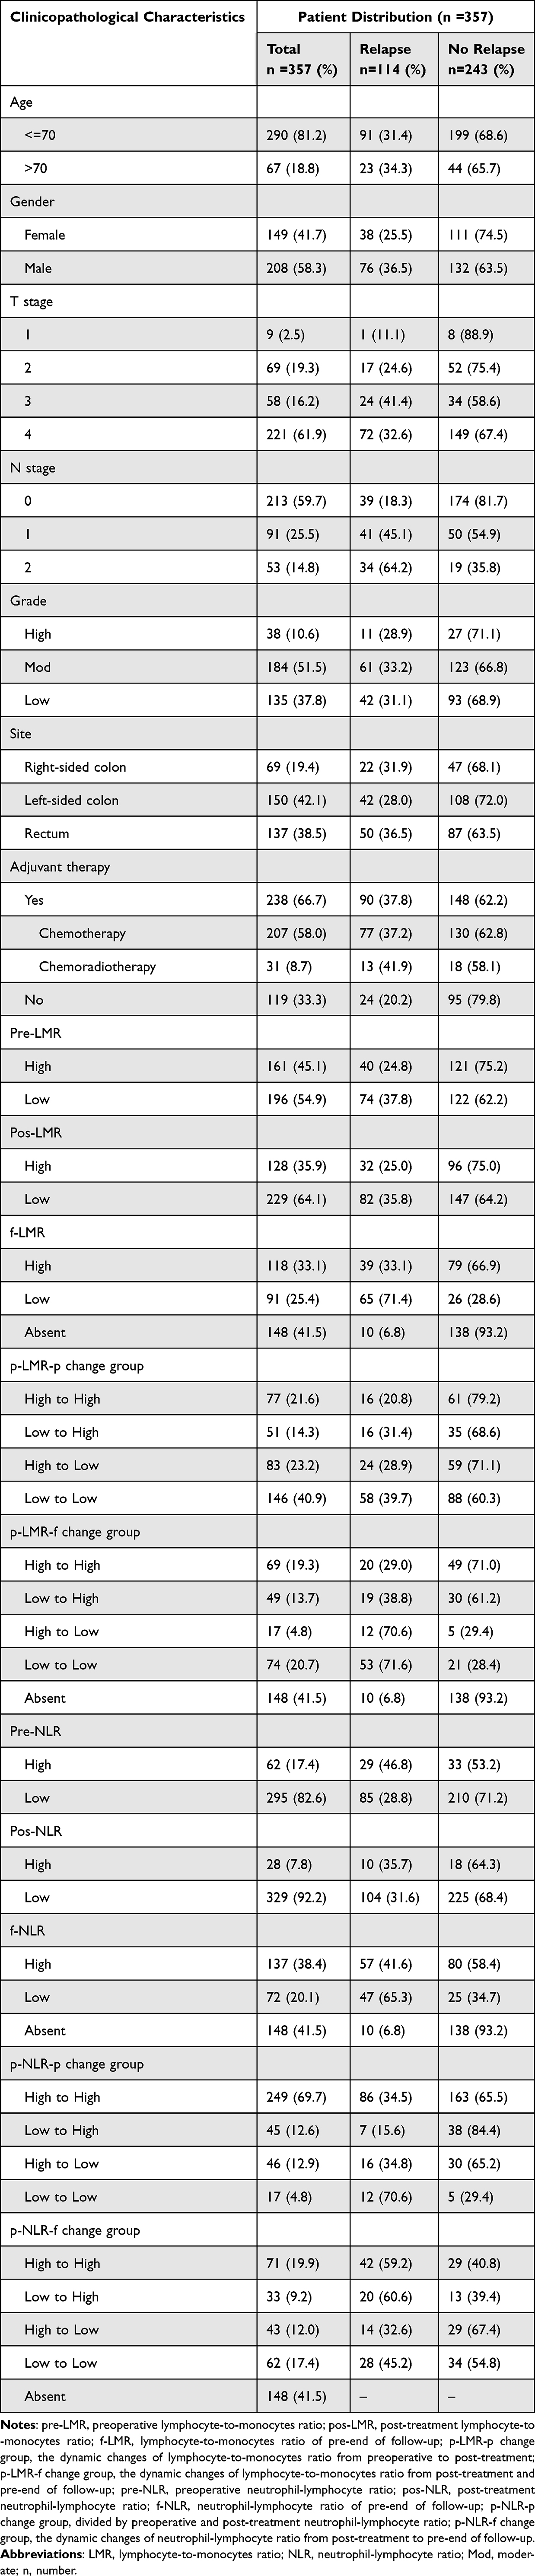 |
Table 1 Baseline Clinicopathologic Characteristics of Patients |
We evaluated longitudinal changes in LMR and NLR from radical surgery to recurrence at multiple time points, including pre-operative, post-treatment, and pre-end of follow-up. The optimal cut-off values of CEA, LMR, and NLR at different time points were obtained based on the ROC curve and the Youden index; the optimal cut-off values are shown for different time points in Supplementary Table 3, with LMR or NLR ≥cut-off as the High group and <cut-off as the Low group (original data of LMR are shown in Supplementary Table 4).
However, in our analysis, we found that in the COX univariate analysis, pre-NLR (p=0.002) in the total cohort, pre-NLR (p=0.007) and p-NLR-p (Low-Low vs High-High: p=0.014) in the adjuvant therapy group were statistically significant (Table 2). After adjusting for confounding factors, in the overall cohort, pre-NLR (hazard ratio (HR): 2.039, 95% confidence interval (CI): 1.331–3.122; p=0.001) still remained statistically significant. In the adjuvant therapy group, pre-NLR (HR: 2.114, 95% CI: 1.317–3.394; p=0.002) and p-NLR-p (High-High vs High-Low: HR:2.060, 95% CI: 1.208–3.514; p=0.008) were identified as prognostic risk factors for CRC (Supplementary Table 5). However, in the logistic analysis, p-NLR-f did not show statistical significance in the total cohort and the adjuvant therapy group (Table 3). Therefore, our subsequent analysis will mainly focus on the correlation between dynamic changes in LMR and CRC recurrence.
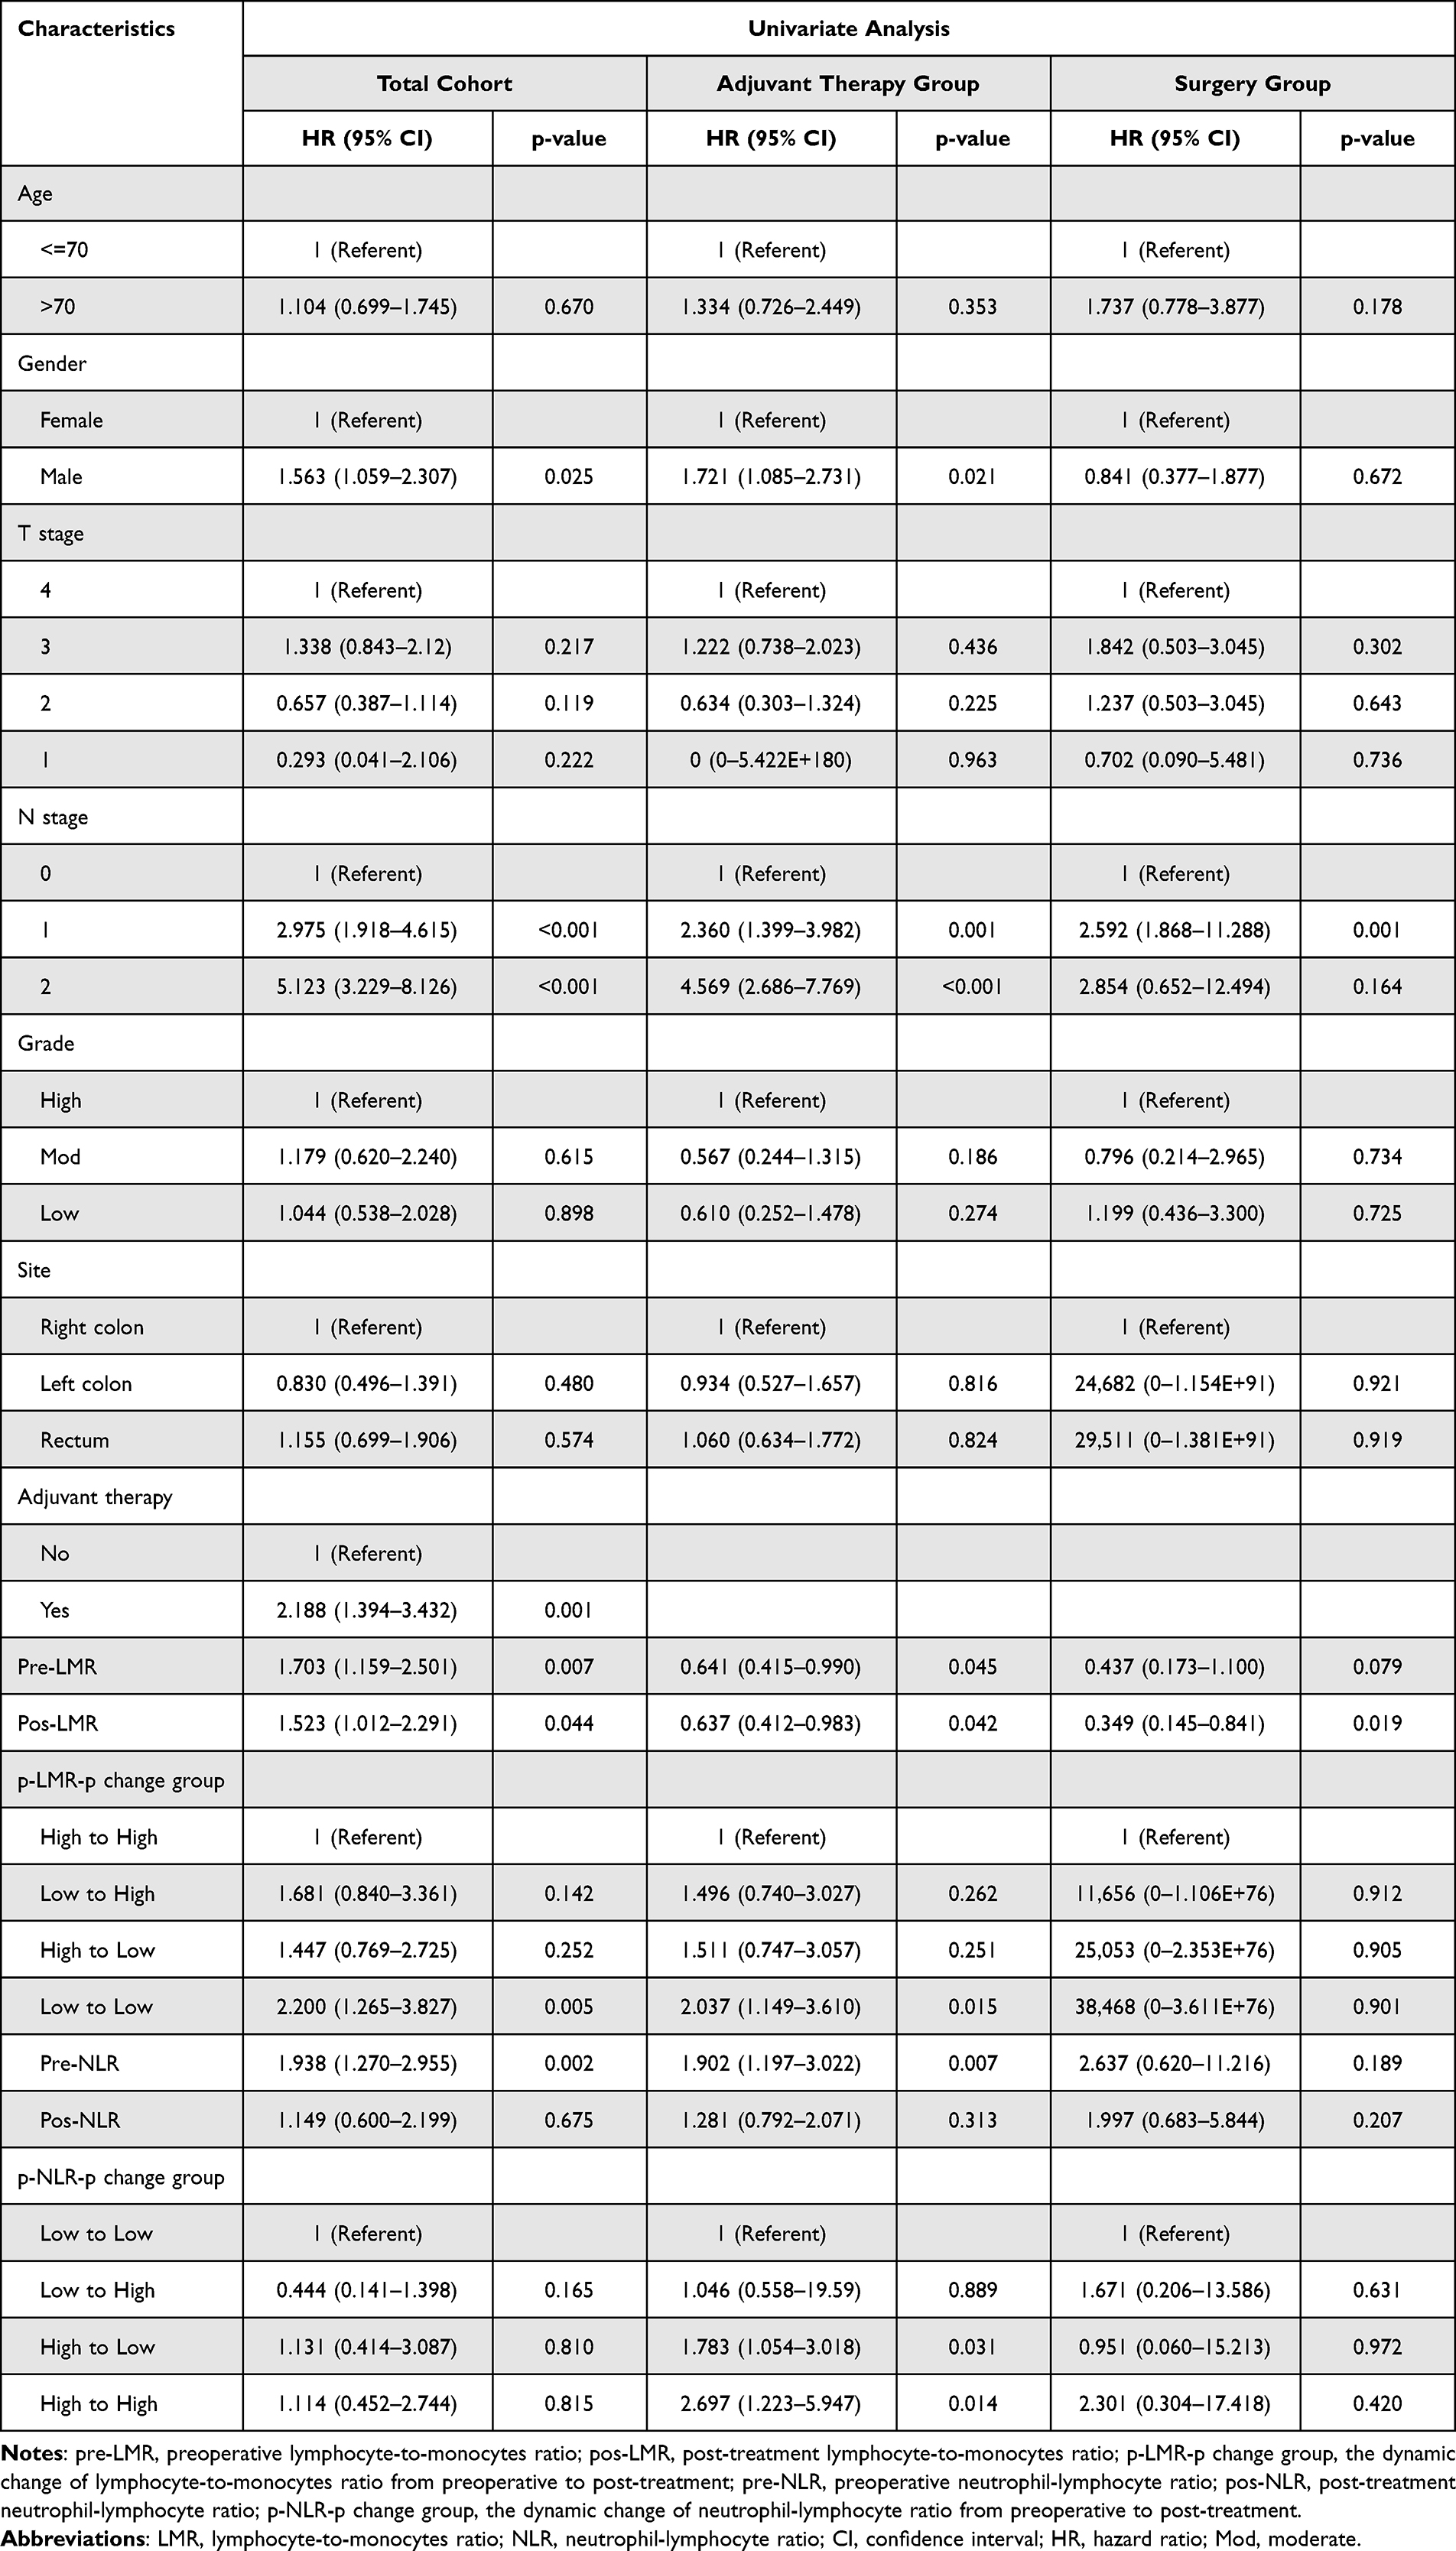 |
Table 2 Univariate Cox Proportional-Hazard Regression Analysis of Patients’ Recurrence-Free Survival |
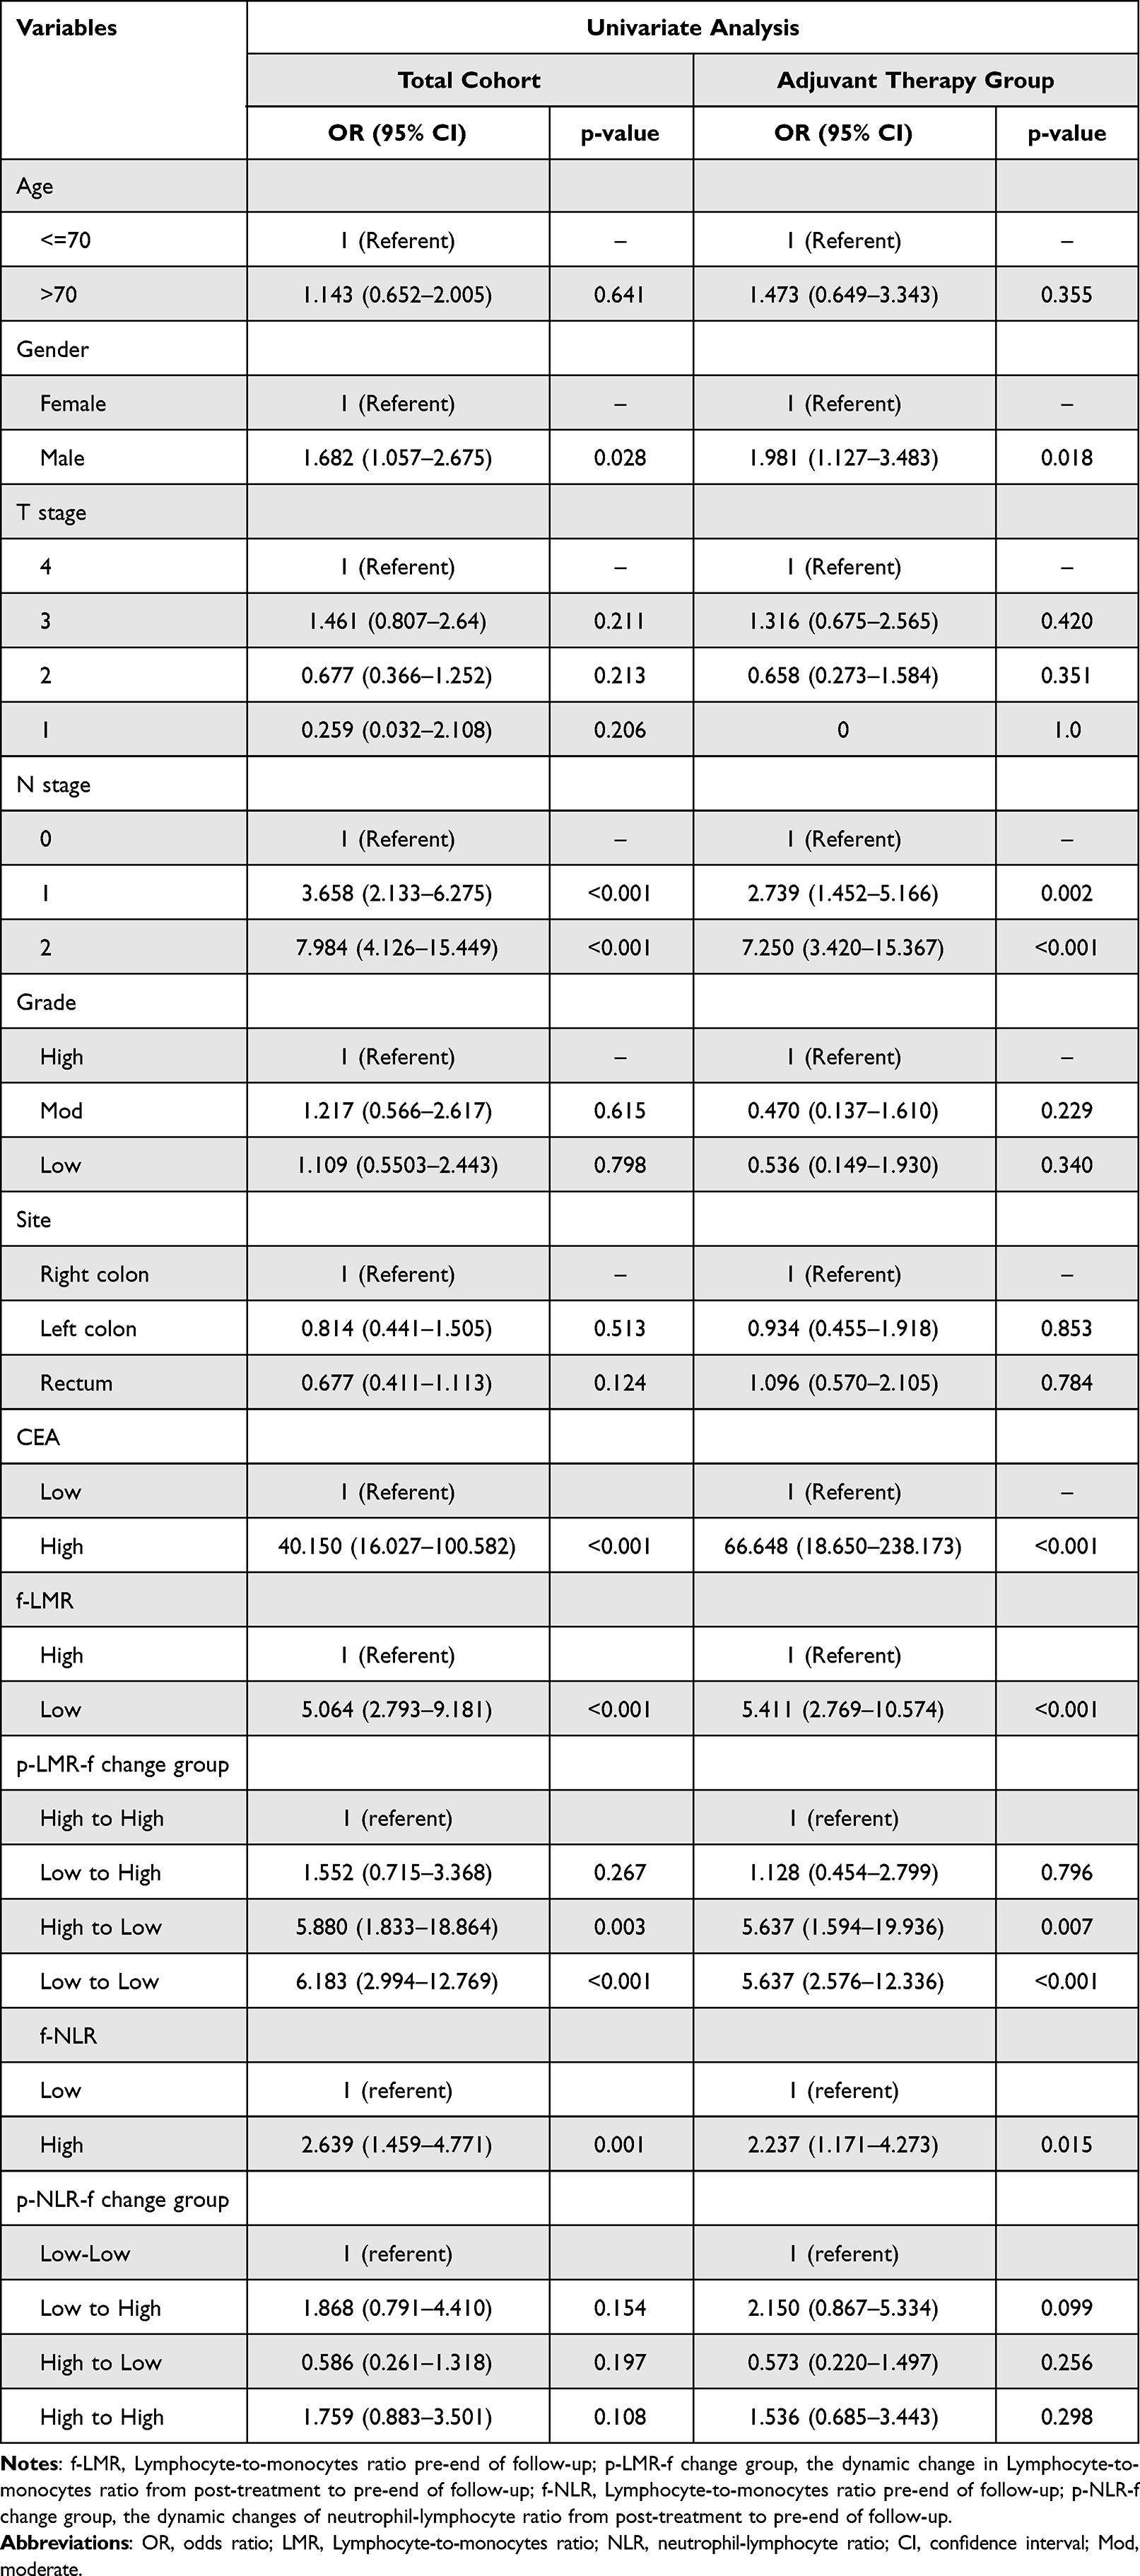 |
Table 3 The Result of the Univariate Logistic Regression Analysis |
Correlation Between Dynamic Changes in LMR and Clinicopathological Characteristics of CRC Patients
In the total cohort, the dynamic changes in p-LMR-p were found to be related to patients’ age (p=0.004) and gender (p=0.006) (Table 4). However, the age (p=0.096) and gender (p=0.061) of the patients in the adjuvant therapy group did not show statistical significance (Supplementary Table 6). Firstly, in the total cohort, the Low-Low group was more likely to be male (47.6%, 99/208), and most were older than 70 years (56.7%, 38/67) (Table 4). Additionally, the adjuvant therapy group and the radical surgery group also exhibited similar characteristics (Supplementary Tables 6 and 7). Secondly, in the total cohort, patients in the Low-Low group had primary tumor sites mainly in the left hemicolectomy (42.7%, 64/150) and right-sided colon (43.5%, 30/69), mainly in T stage 3 (48.3%, 28/58) and T stage 4 (44.3%, 98/221) (Table 4). However, in the surgery group, the primary sites of tumors were predominantly the left colon (43.8%, 35/80) and rectum (46.4%, 13/28) (Supplementary Table 7). Finally, in the total cohort, the proportion of patients receiving adjuvant therapy and those undergoing surgery alone is similar in the Low-Low group. In contrast, the High-High group was more inclined to receive chemotherapy (25.2%, 60/238). In the adjuvant therapy group, patients in the Low-Low group were more prone to receive chemotherapy (41.1%, 85/207) (Supplementary Table 6). There was no significant correlation between the N stage of the primary tumor and the degree of pathological differentiation in the whole group (Table 4, Supplementary Tables 6 and 7).
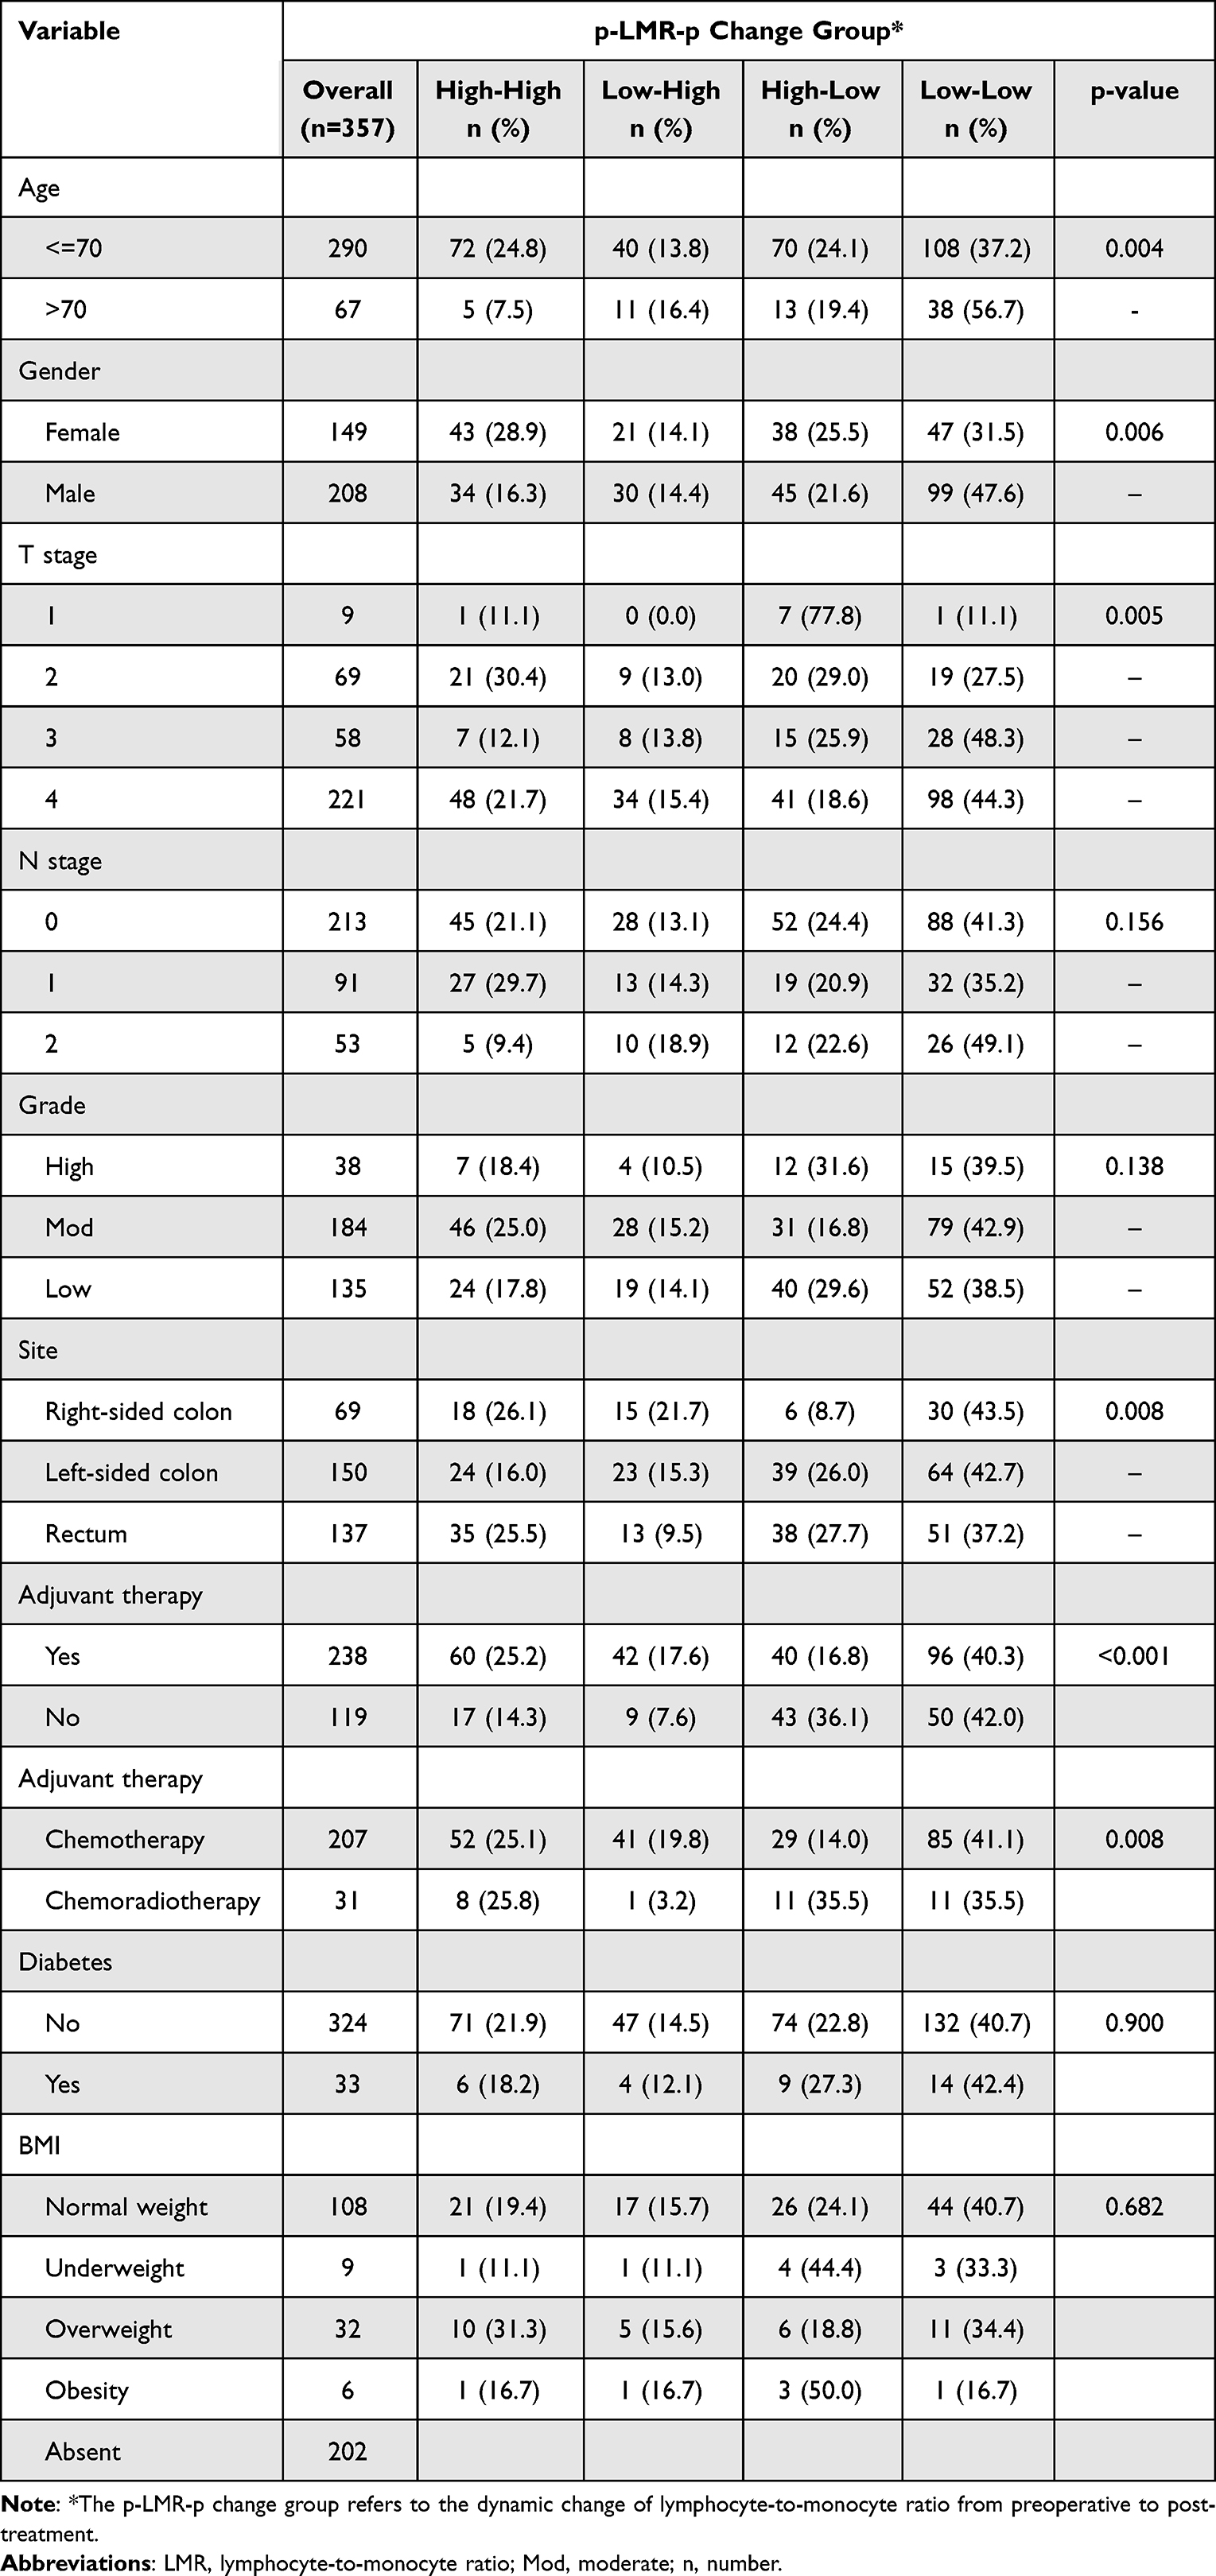 |
Table 4 Baseline Clinicopathologic Characteristics of the Dynamic Changes in p-LMR-p of CRC Patients |
We found that the dynamic changes in LMR from post-treatment to pre-end of follow-up (p-LMR-f) were associated with patients’ gender (p<0.001) in the total cohort (Table 5). Firstly, the Low-Low group was more often seen in males (44%, 55/125), while the High-High group was more commonly observed in females (48.8%, 41/84). Secondly, the dynamic changes in p-LMR-f were correlated with T stage (p=0.047), N stage (p=0.011), and CEA level (p=0.006), but not with patients’ age (p=0.05), tumor differentiation (p=0.784) and primary tumor site (p=0.204). However, in the adjuvant therapy group, there is a significant statistical correlation between the p-LMR-f and patients’ age (p=0.029), N stage (p=0.010), gender (p=0.002), and CEA levels (p=0.008) (Supplementary Table 8).
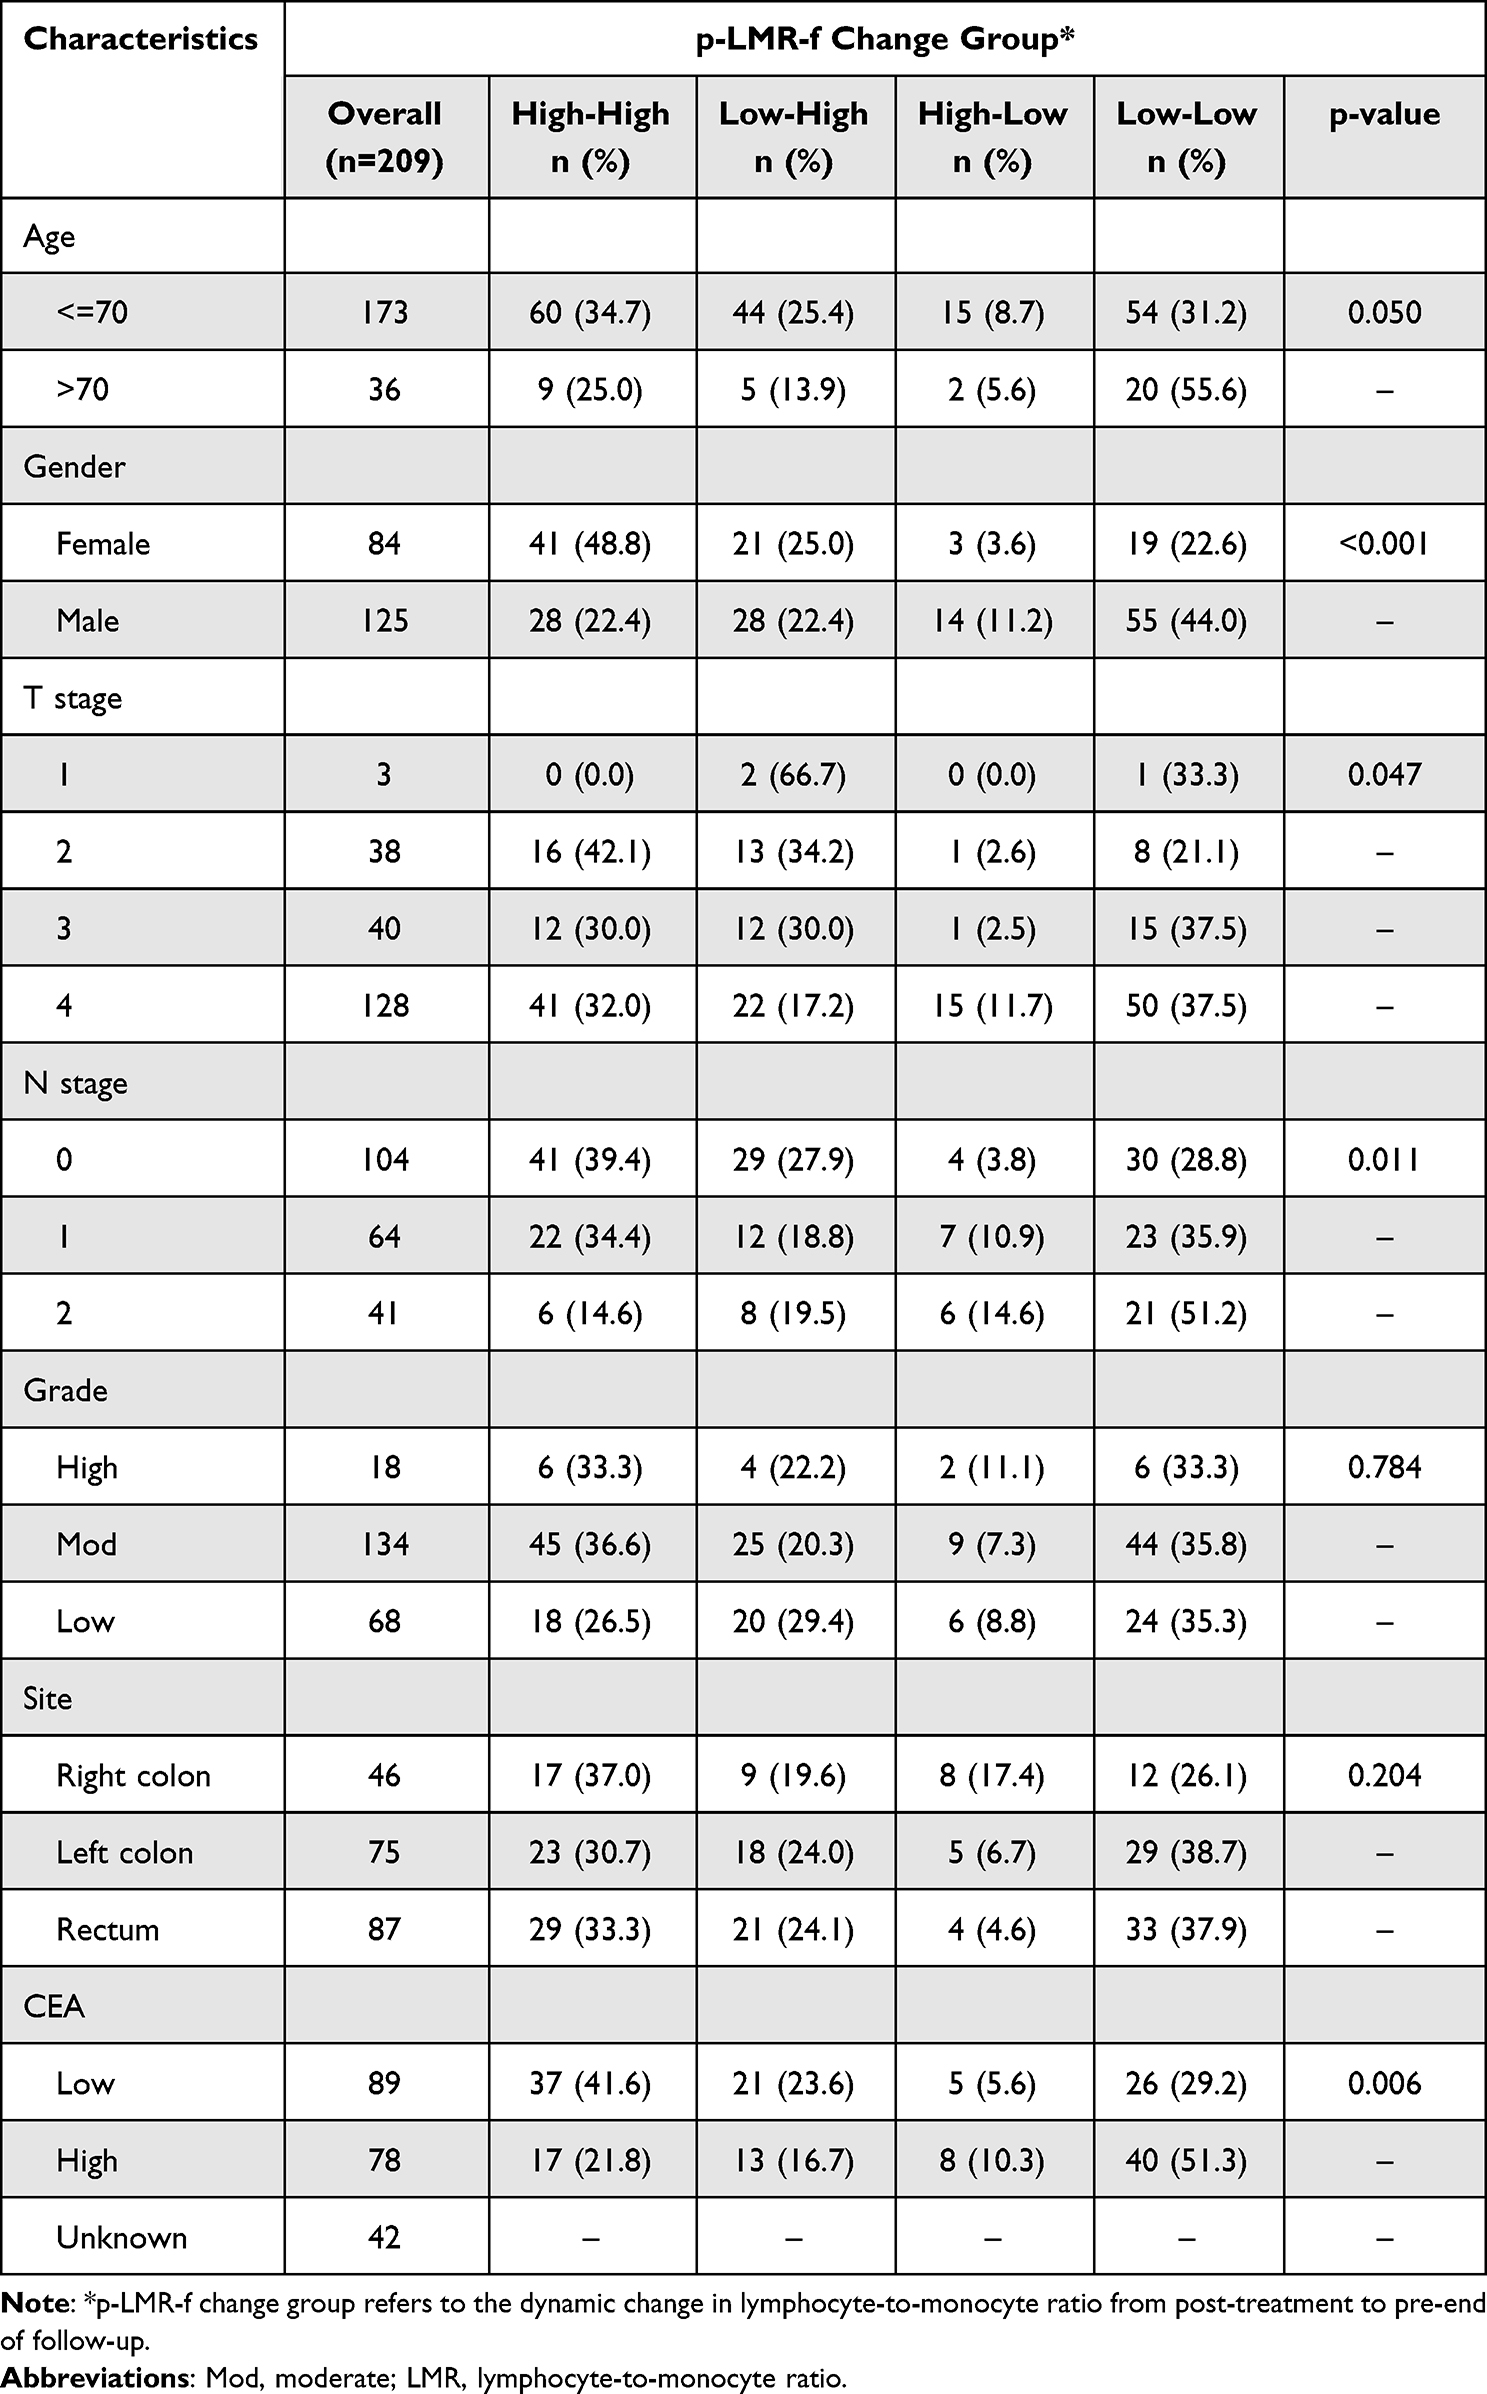 |
Table 5 Baseline Clinicopathologic Characteristics of the Dynamic Changes in p-LMR-f of CRC Patients |
In the total cohort, T-stage was more often seen in T3 (37.5%, 15/40) / T4 (37.5%, 50/128) and N-stage was more often seen in N1 (35.9%, 23/64) and N2 (51.2%, 21/41) in the Low-Low group, whereas in the High-High group, N stage was more often seen in N0 (39.4%, 41/104). The primary tumor sites of patients in the Low-Low group were primarily found in the left colon (38.7%, 29/75) and rectum (37.9%, 33/87). In contrast, the High-High group had a similar proportion of distribution in different tumor primary sites. Finally, the dynamic changes in p-LMR-f were also strongly correlated with CEA (p=0.006), with higher CEA in the Low-Low group compared to other subgroups (51.3%, 40/78). In comparison, CEA in the High-High group was likelier to be below the optimal cut-off value (41.6%, 37/89) (Table 5). The abovementioned features are also observed in the adjuvant therapy group (Supplementary Table 8).
Dynamic Change in LMR from Pre-Operative to Post-Treatment is an Independent Prognostic Factor for Clinical Recurrence in CRC Patients
In the total cohort and the adjuvant therapy group, univariate analysis of COX regression revealed a significant association between preoperative LMR (pre-LMR, overall cohort, p=0.007; adjuvant therapy group, p=0.045), pos-LMR (total cohort, p=0.044; adjuvant therapy group, p=0.042) and the dynamic changes in p-LMR-p (total cohort, p=0.005; adjuvant therapy group, p=0.015) with clinical recurrence in patients with CRC (Table 2). In the surgery group, pos-LMR (p=0.019) was identified as a prognostic factor for CRC recurrence, while pre-LMR (p=0.079) showed no statistical significance (Table 2). Additionally, the gender of patients (p=0.025), N stage (p<0.001), and adjuvant therapy (p=0.001) are statistically significant in the total cohort. Furthermore, gender (p=0.021) and N stage (p<0.001) are statistically significant in the adjuvant therapy group. However, in the surgery group, only the N stage showed statistical significance, while the lack of statistical significance for p-LMR-p may be due to a small sample size of positive cases (Table 2).
In the total cohort, after adjusting for patient sex, N stage, and receipt of adjuvant therapy, COX multivariate analysis revealed that pre-LMR (p=0.020; HR: 1.586, 95% CI: 1.075–2.339), pos-LMR (p=0.025; HR:1.615, 95% CI: 1.063–2.453), and the dynamic changes in p-LMR-p (High-High vs Low-Low: p=0.006; HR:2.210, 95% CI: 1.256–3.890) can serve as prognostic factors for CRC recurrence (Table 6). Furthermore, in the adjuvant therapy group, COX multivariate analysis revealed that pre-LMR (p=0.035; HR:1.611, 95% CI: 1.035–2.507) and the dynamic changes in p-LMR-p (High-High vs Low-Low: p=0.043; HR: 1.827, 95% CI: 1.018–3.278) showed statistical significance. However, after adjusting for confounding factors in the surgery group, only pos-LMR (p=0.046; HR: 2.474, 95% CI: 1.016–6.025) showed statistical significance (Table 6).
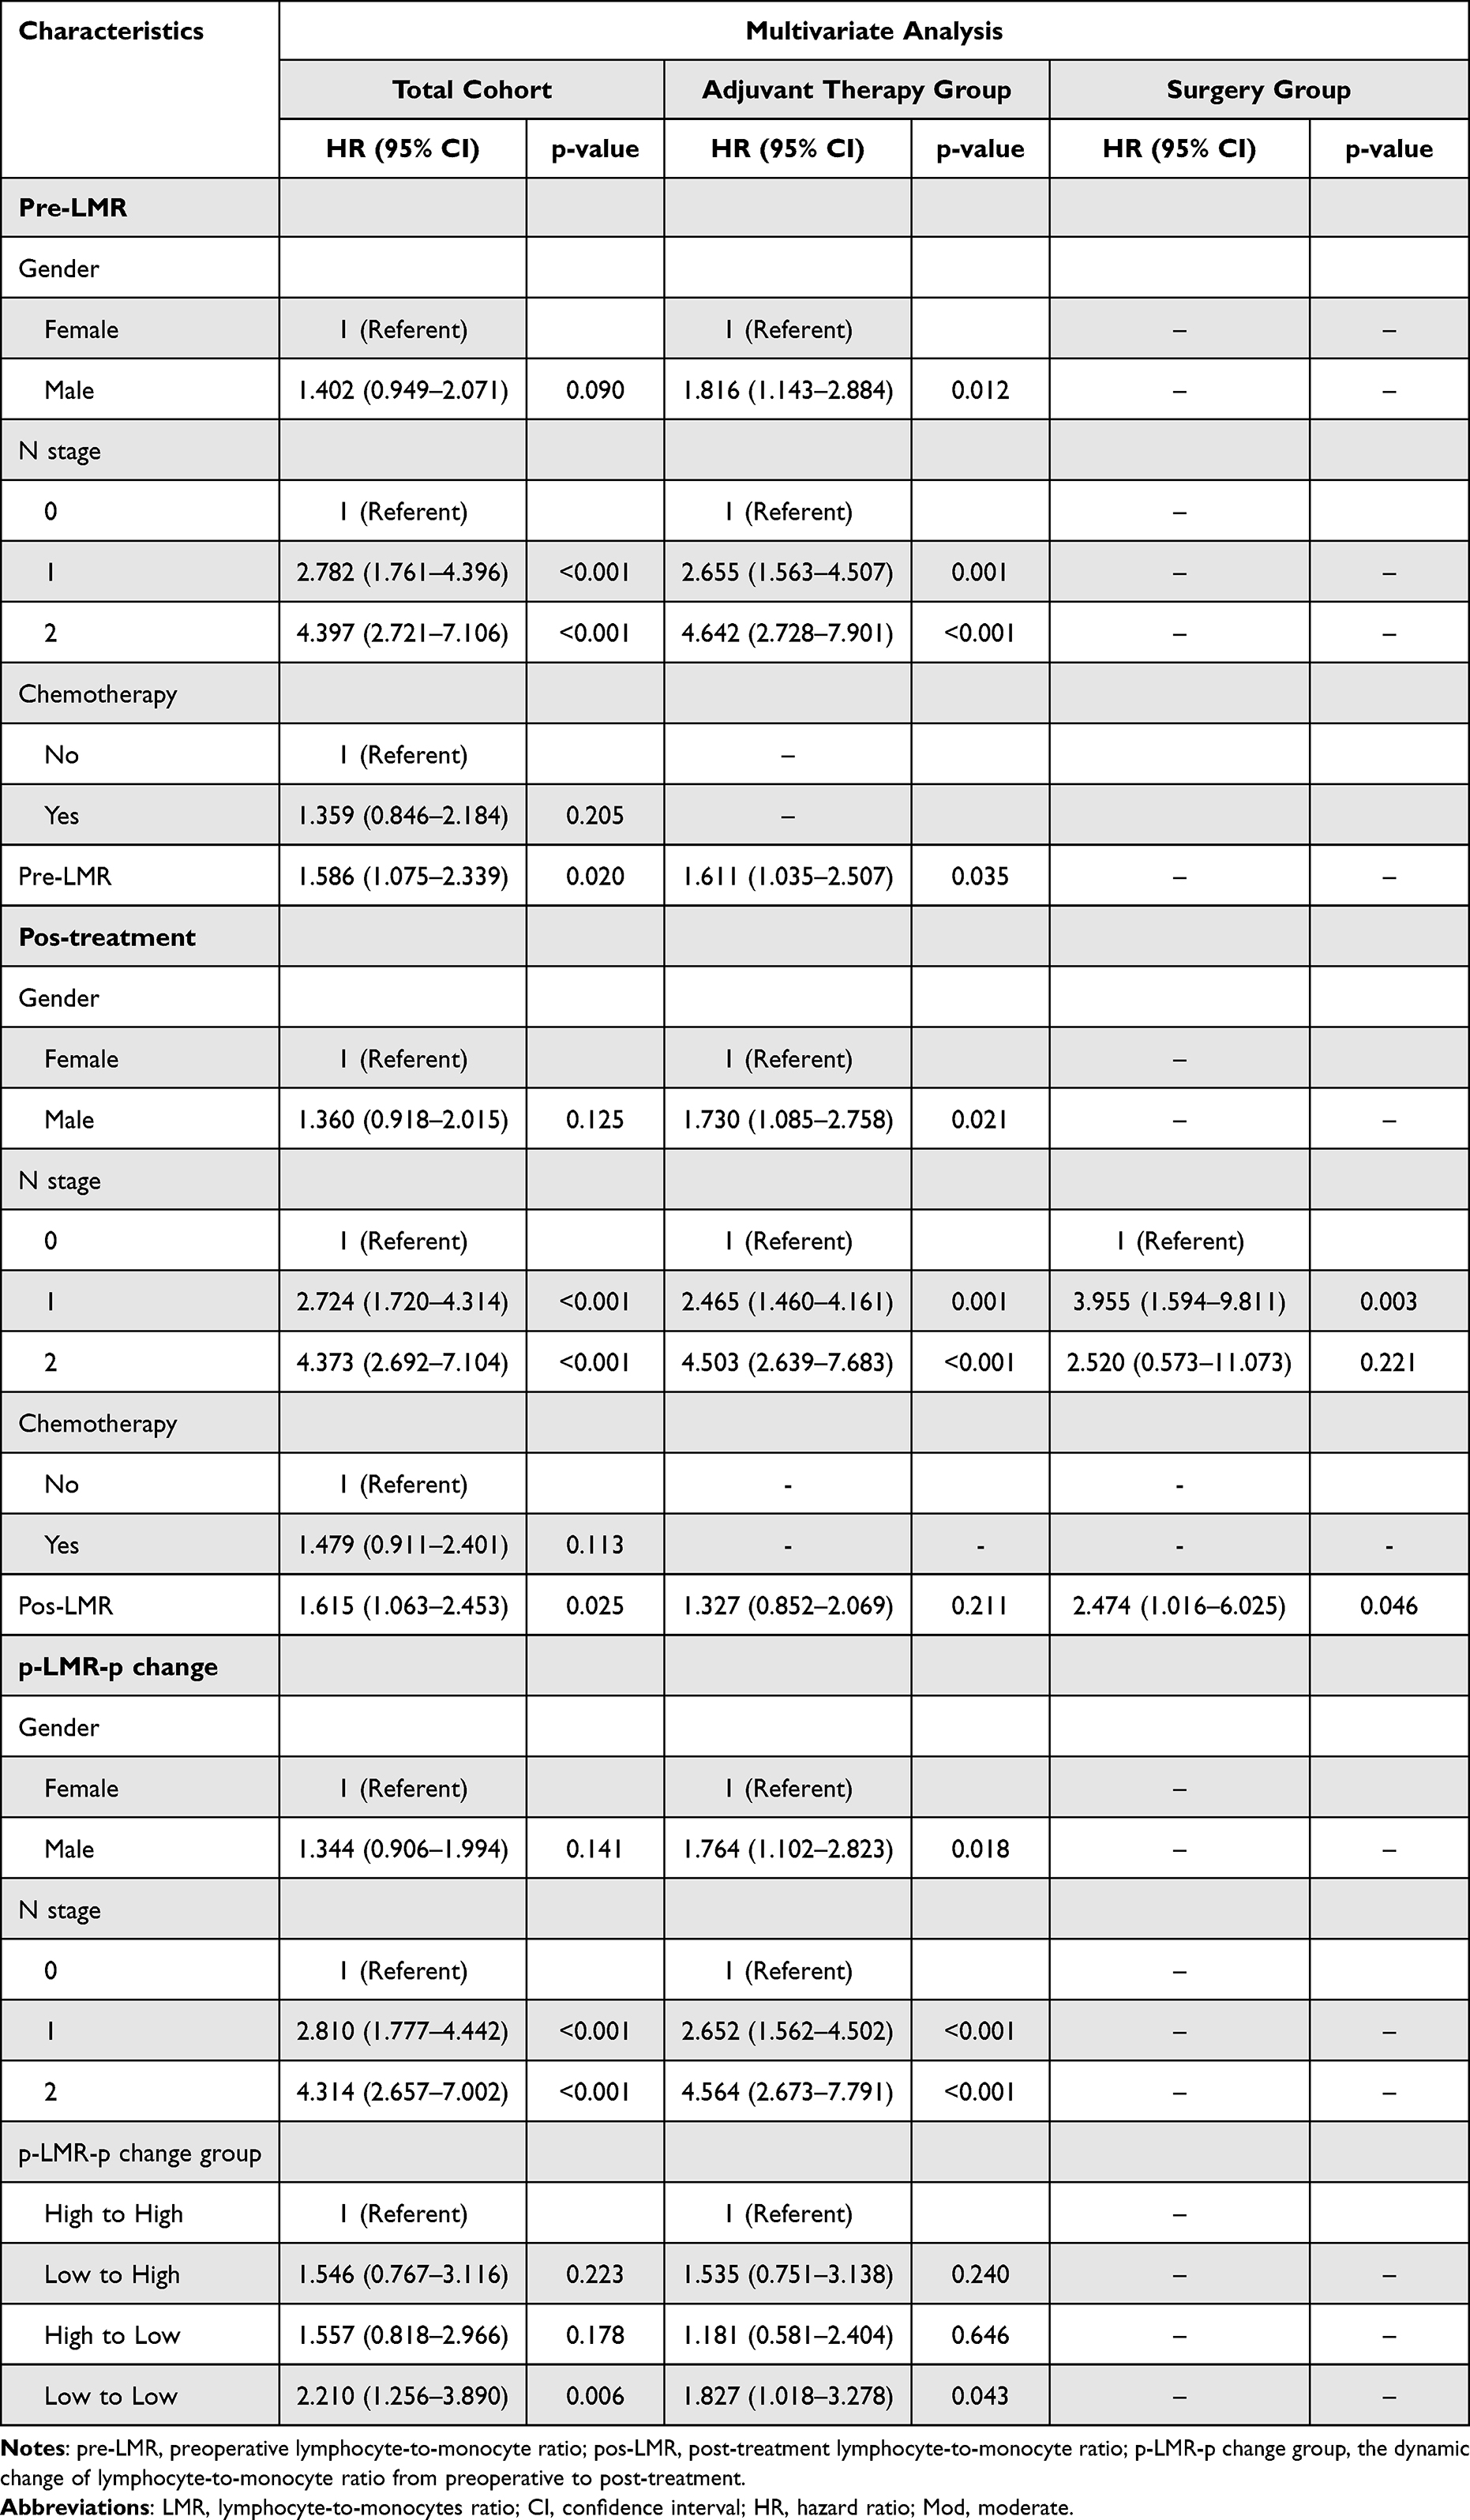 |
Table 6 Multivariate Cox Proportional-Hazard Regression Analysis of Patients’ Recurrence-Free Survival |
In the total cohort and the adjuvant therapy group, Kaplan-Meier curves showed that patients with low LMR had worse prognoses than those in high LMR (Figure 2). Additionally, in the p-LMR-p change group, patients in the High-High group had better prognosis than those in the Low-Low group. In the adjuvant therapy group, the 75% non-recurrence survival for the High-High group was 48.1 months, while it was 14.6 months for the Low-Low group. The Low-High group had a 75% non-recurrence survival of 19.5 months, and the High-Low group had a 75% non-recurrence survival of 24.5 months (Figure 2).
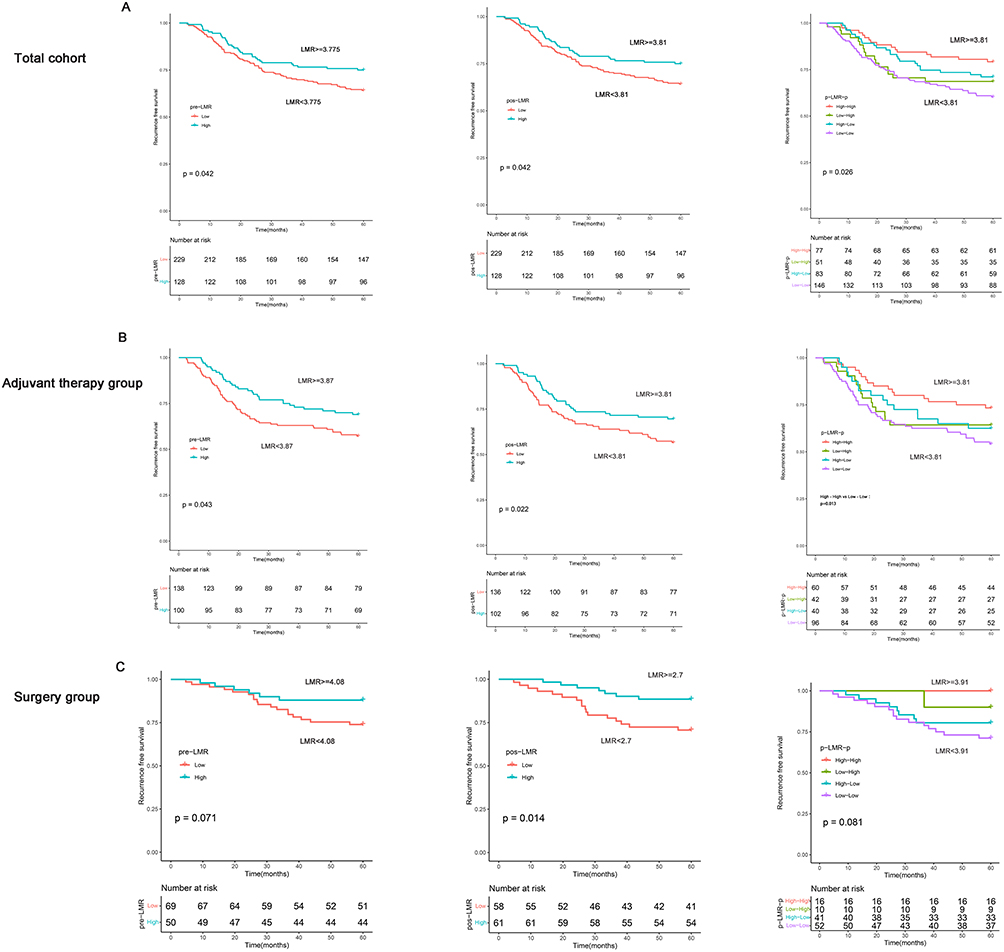 |
Figure 2 Kaplan Meier survival curves demonstrating the relationship between RFS and LMR. Abbreviations: pre-LMR, preoperative lymphocyte-to-monocytes ratio; pos-LMR, Lymphocytes-to-monocytes ratio post-treatment; p-LMR-p, the dynamic change of lymphocyte-to-monocyte ratio from preoperative to post-treatment; RFS, recurrence-free survival. Notes: (A) The relation between RFS and LMR (pre-LMR, pos-LMR, f-LMR) in the total cohort. (B) The connection between RFS and LMR (pre-LMR, pos-LMR, f-LMR) in the adjuvant therapy group. (C) The association between RFS and LMR (pre-LMR, pos-LMR, f-LMR) in the surgery group. |
Dynamic Changes in LMR Post-Treatment Until Relapse or the End of Follow-Up are Independent Risk Factors for Clinical Recurrence in CRC Patients
Further analysis can be done to investigate whether p-LMR-f can serve as a biomarker for the recurrence of CRC patients. In the total cohort and the adjuvant therapy group, logistic regression univariate analysis showed that the patient’s gender, N stage, CEA, f-LMR, and dynamic changes in p-LMR-f were associated with clinical recurrence in colorectal cancer patients (Table 3). After adjustment for confounding factors, N stage (N2 vs N0, odds ratio (OR) =6.439, 95% CI: 1.596–25.973, p=0.009), CEA (OR=60.866, 95% CI: 18.560–199.61, p<0.001), f-LMR (OR=4.069, 95% CI: 1.451–11.407, p=0.008), and dynamic changes in p-LMR-f were independent risk factors for clinical recurrence in patients with CRC (Table 7). In the p-LMR-f change groups, compared to the High-High group, the Low-Low group (OR=4.844, 95% CI: 1.416–16.572, p=0.012) and the High-Low group (OR=11.743, 95% CI: 1.349–102.214, p=0.026) were identified as independent risk factors for CRC recurrence (Table 7). Similar results were also observed in the adjuvant therapy group. Analysis was not performed in the surgical group due to a small sample size. Also, there was no multicollinearity among the variables. In the total cohort, the p-LMR-f has an area under the curve (AUC) of 0.704, with a sensitivity of 64% and a specificity of 75.3%. In the adjuvant therapy group, the p-LMR-f has an AUC of 0.70, with a sensitivity of 62.5% and a specificity of 75.2% (Supplementary Table 9).
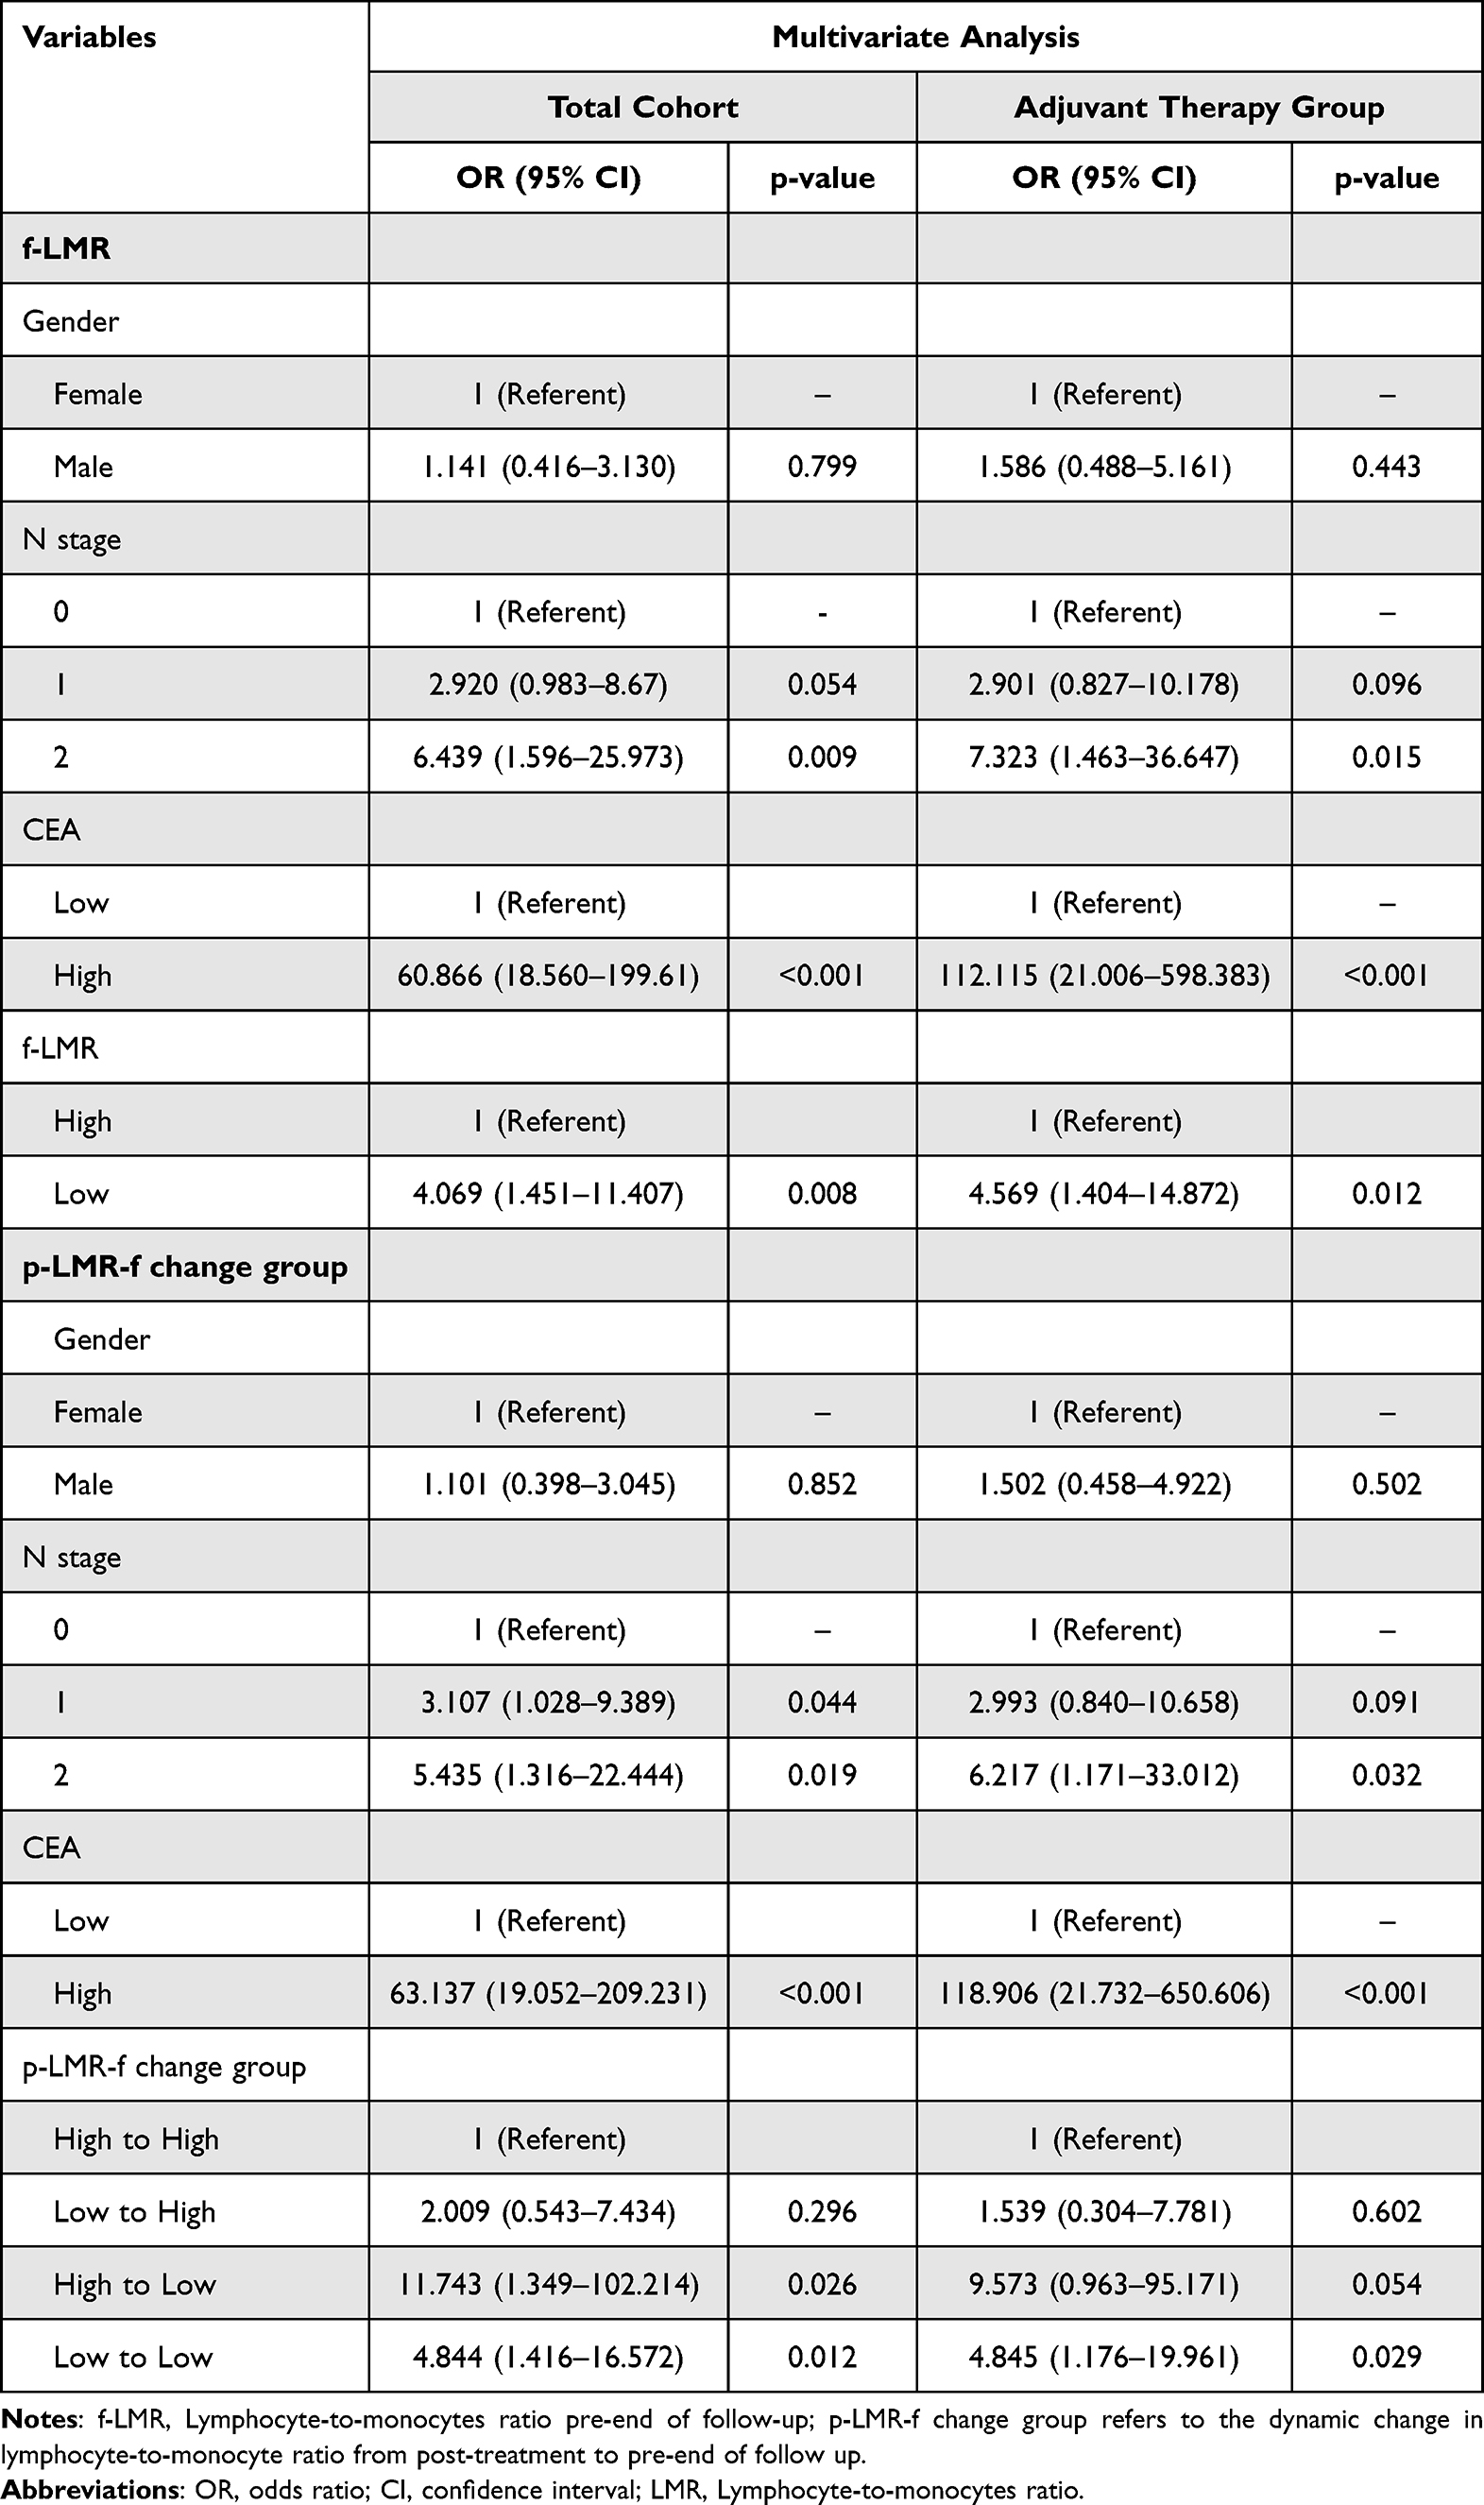 |
Table 7 The Result of the Multivariate Logistic Regression Analysis |
Two diagnostic models were constructed using CEA in combination with f-LMR and p-LMR-f, simultaneously building nomograms (Supplementary Figure 1). The model1 is CEA + p-LMR-f, and the model2 is CEA + f-LMR. The models were internally validated using the bootstrap method with a C-statistic of 0.913 (95% CI: 0.897–0.913) for the model1 (Figure 3A) and 0.904 (95% CI: 0.904–0.904) for the model2 (Figure 3B) in the total cohort. In the adjuvant therapy group, the model1 has a C-statistic of 0.924 (95% CI: 0.902–0.924) (Figure 3C), and the model2 has a C-statistic of 0.915 (95% CI: 0.915–0.915) (Figure 3D). The Model1 performs better than model2 in the calibration curve in the overall cohort and the adjuvant therapy group (Supplementary Figure 2).
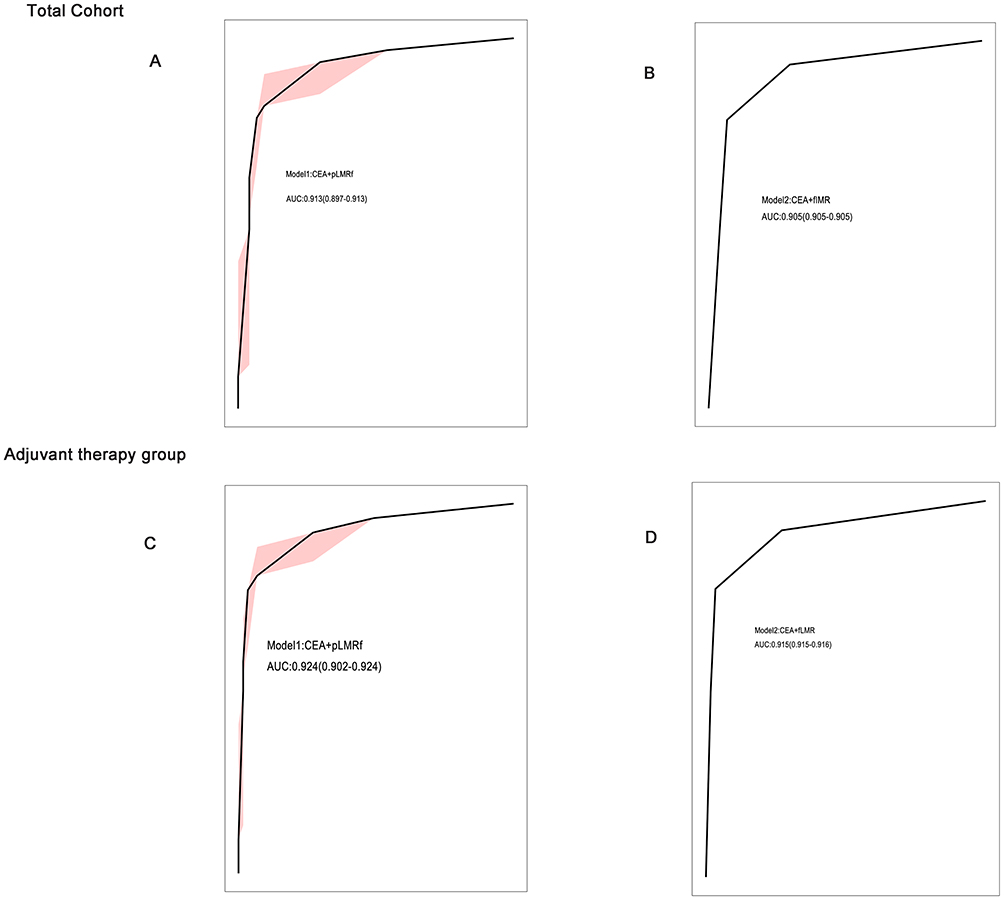 |
Figure 3 The results of ROC curve analysis of the model in the total cohort and adjuvant therapy group. Abbreviations: f-LMR, Lymphocyte-to-monocytes ratio pre-end of follow-up; p-LMR-f, the changes of lymphocyte-to-monocytes ratio from post-treatment to pre-end of follow-up; ROC, receiver operating characteristic; CI, confidence interval. Notes: The results of the ROC curve were obtained through internal validation of the model using the bootstrap method. (A) The ROC curve of model1 (CEA+ p-LMR-f) in the total cohort. (B) The entire cohort’s ROC curve of model2 (CEA + f-LMR). (C) The ROC curve of the model1 (CEA + p-LMR-f) in the adjuvant therapy group. (D) The ROC curve of the model2 (CEA + f-LMR) in the adjuvant therapy group. |
When the threshold probability is between 0.1 and 0.9, the net benefit is more excellent than “treat all” or “no treatment” or CEA alone when using the model1 and model2 prediction models to make clinical decisions. Also, the net benefit available for the model1 is higher than the model2 when the threshold probability is between 0.1 and 1.0 (Figure 4). Secondly, we analyzed the clinical efficiency of the model (Supplementary Figure 3). When the threshold probability was greater than 45% of the predicted score probability value in the model1 of the adjuvant therapy group, the prediction model showed that the population at high risk of CRC recurrence gave a high match to the actual CRC recurrence population. In summary, the model1 demonstrates better diagnostic performance than the model2 in both the total cohort and the adjuvant therapy group.
 |
Figure 4 The Decision Curve analysis (DCA) results of the prediction model. Abbreviations: f-LMR, Lymphocyte-to-monocytes ratio pre-end of follow-up; p-LMR-f, the changes of lymphocyte-to-monocytes ratio from post-treatment to pre-end of follow-up. Notes: (A) The results of the DCA of the prediction model in the total cohort. (B) The effects of the DCA of the prediction model in the adjuvant therapy group. model1, CEA+ p-LMR-f; model2, CEA+ f-LMR. |
Discussion
This study evaluated the potential value of dynamic changes in LMR in the dynamic monitoring recurrence after radical surgery in CRC patients. We found dynamic change in p-LMR-p was an independent prognostic factor for RFS in CRC patients. Additionally, the dynamic changes in p-LMR-f can be used as diagnostic biomarkers for CRC recurrence in the total cohort and adjuvant therapy group, AUC: 0.704, with a sensitivity of 64% and a specificity of 75.3%. The dynamic changes in p-LMR-f and the synergistic effect of CEA can improve the diagnostic performance for CRC recurrence. In the overall cohort, the AUC was 0.913 (95% CI: 0.897–0.913). In the adjuvant therapy group, the AUC was 0.924 (95% CI: 0.902–0.924).
The dynamic changes in LMR can serve as prognostic factors and predictive biomarkers for CRC recurrence. The underlying mechanism is likely that LMR indirectly reflects the variations in immune cells within the tumor microenvironment. The infiltration quantity and phenotype of immune cells in the tumor microenvironment can impact the prognosis and recurrence of CRC. Research has suggested a negative correlation between peripheral blood CD4+ T cells and the infiltration of CD4+ T cells in the tumor microenvironment of Gastric Cancer.19 The high group with CD4+T cell in peripheral blood showed better 5-year OS than the low group. The low CD4+ T cell infiltration group in tumor tissue demonstrated better 5-year OS than the high group.19 In colorectal cancer, there is a positive correlation between CD3+ T cells in the invasive front and tumor center and circulating CD3+ T cells (Spearman ρ=0.558 and ρ=0.496). Similarly, CD4+ T cells in the peripheral blood positively correlate with CD3+ T cells in the invasive front and tumor center (Spearman ρ=0.598 and ρ=0.637).20 Furthermore, CD8+ T cells in the invasive front and central tumor tissue correlate positively with peripheral blood CD4+ T cells (ρ=0.602 and ρ=0.591) and CD3+T cells (ρ=0.541 and ρ=0.515).20 Meanwhile, it was pointed out that the number of monocytes in blood was negatively correlated with the expression of CD3+ T cells in the tumor center.9
Furthermore, the mechanism by which LMR predicts CRC recurrence is also related to the functionality of lymphocytes and monocytes. Some studies indicated that lymphopenia was a poor prognostic indicator of disease.21,22 Lymphocytes have an anti-tumor effect by producing high levels of anti-tumor cytokines and cytotoxic molecules, inhibiting different oncogenic pathways (angiogenesis, epithelial-mesenchymal transition), and promoting apoptosis of tumor cells.23,24 However, the anti-tumor immune response of lymphocytes is negatively regulated by tumor cells and stromal cells such as M2-type TAM and tumor-associated fibroblasts.24 Inhibiting TAM activation to M2 type can increase the number of CD8+ T cells, enhance anti-tumor efficacy, and reshape the TME.25
Monocytes in peripheral blood can be recruited to the TME by chemokines and growth factors to differentiate into TAM, and M2-type TAM promotes tumor growth, angiogenesis, and suppressing anti-tumor immunity.7,10 In addition, TAM recruits myeloid-derived suppressor cells (MDSC) and T regulatory cells to the TME through chemokines CXCL12 and CCL22 to build an immunosuppressive microenvironment.7 Similarly, Shimura et al found a correlation between low LMR and MDSC, with the low LMR group having a higher proportion of MDSC than the high LMR group.26 While MDSC can be divided into mononuclear-MDSC and polymorphic MDSC, mononuclear-MDSC can differentiate into TAM, and polymorphic-MDSC can produce reactive oxygen species, inhibit T-cell function,27 promote T regulatory cell formation,28 and promote tumor progression.
We first analyzed the correlation between the dynamic changes in LMR and the clinicopathological characteristics of CRC patients. There is a correlation between p-LMR-p and age associated with age-related immune senescence. Immune senescence primarily manifests as a decline in the number and function of T cells.29 The dynamic changes in p-LMR-p were correlated with patients’ gender p=0.006), with males more often in the Low-Low group and females in the High-High group, in line with the findings of Lisanti’s,30 which indicated that women may have a more adaptive and innate immune system with higher phagocytic efficiency of neutrophils and macrophages than men.31 Regarding lymphocytes, the number of activated T cells and the proliferation of T cells were higher in women than in men.32 We found that dynamic changes in p-LMR-f were significantly correlated with the N stage, and T stage, which were accordant with pre-LMR alone.13 The study pointed out that positive infiltration of lymphatic vessels and low CD8+ T-cell content in pathological tumor tissue were independent risk factors for lymph node metastasis.33 Finally, the dynamic changes of p-LMR-p are correlated with the adjuvant treatment regimen (p=0.008). Radiotherapy primarily affects lymphocytes and can lead to decreased CD4+ T cells and increased CD8+ T cell levels in colorectal cancer.34 Chemotherapy, on the other hand, mainly leads to a decrease in peripheral blood B lymphocytes, with relatively minor effects on CD4+ T cells and CD8+ T cells.35 Furthermore, we found that in the low-low group of p-LMR-f, CEA levels were predominantly elevated. The study showed that elevated levels of CEA were negatively correlated with the expression of CD8+ T cells at the core of the tumor. In addition, studies have suggested that low LMR was associated with deficient mismatch repair (dMMR) or BRAF gene mutations,13 but gene mutations were not analyzed in this study.
We validated that the dynamic changes in p-LMR-p can serve as prognostic factors for determining the prognosis of CRC in the total cohort (High-High vs Low-Low, p=0.006; HR: 2.210, 95% CI: 1.256–3.890) and adjuvant therapy group (High-High vs Low-Low, p=0.043; HR:1.827, 95% CI: 1.018–3.278). Other studies have also confirmed that the dynamic changes in LMR are risk factors for CRC recurrence in stage III CRC, elevated (persistently high inflammatory) / normal (preoperatively low inflammatory state): HR: 2.04 (1.39–2.99), p<0.001; normalized (preoperatively high but postoperatively low inflammatory condition) / elevated: HR 0.60 (0.36–0.98), p<0.041.18 Meanwhile, Chan et al also found that dynamic changes in LMR were significantly associated with OS in CRC patients. Compared to the Low-Low group, the High-High group had an HR of 0.463 (95% CI: 0.324–0.0683).14 In addition, we found that the HR of p-LMR-p is higher than using pre-LMR or pos-LMR alone. This suggests that p-LMR-p can better identify high-risk individuals. Survival curves suggest that dynamic changes in p-LMR-p groups benefit the postoperative management of CRC. We observed that the Low-High group had a 75% recurrence-free survival of 24.5 months, followed by the High-Low group (19.5 months), close to the Low-Low group (14.6 months). This indicates that p-LMR-p can better distinguish high-risk patients and facilitate postoperative management than pre-LMR or pos-LMR alone.
We first established that dynamic changes in p-LMR-f are biomarkers for CRC recurrence. Logistic regression analysis revealed that dynamic changes in f-LMR or p-LMR-f are independent risk factors for CRC recurrence in patients. In the overall cohort, the p-LMR-f has an AOC of 0.704, with a sensitivity of 64% and a specificity of 75.3%. Due to the relatively poor diagnostic performance of p-LMR-f when used alone, we combined it with CEA in our study. CEA is commonly used to monitor the disease status of CRC patients dynamically. However, its clinical sensitivity is poor and does not allow for early detection of clinical recurrence in CRC patients.36,37 In this study, the optimal cut-off value of CEA was determined to be 4.1 ng/mL by the ROC curve and Youden index, consistent with previous studies.38
We developed the first predictive model for CRC recurrence by combining dynamic changes in p-LMR-f and CEA. Through internal bootstrap validation, we found that the combination of p-LMR-f and CEA significantly increased the area under the ROC curve (AUC: 0.913), with a sensitivity of 81.7% and specificity of 90.5%. The results of the decision curve analysis (DCA) for the prediction model show that the use of model1 yields higher net benefit compared to using CEA alone. The model1 improved diagnostic performance while avoiding the limitations of low specificity or sensitivity associated with a single biomarker. Additionally, LMR and CEA testing are simple, rapid, cost-effective, and demonstrate good reproducibility, making them ideal biomarkers for dynamic monitoring of disease progression. Meanwhile, in this study, we evaluated both p-LMR-p as a prognostic factor for CRC recurrence and the value of p-LMR-f in combination with CEA as a diagnostic biomarker for CRC recurrence. The dynamic changes in LMR can longitudinally monitor the recurrence of CRC after curative surgery.
Our study has the following limitations: studies have suggested that inflammatory biomarkers such as the fibrinogen-to-lymphocyte ratio (FLR) and NLR can be used to predict the recurrence of colorectal adenomas.39 It is known that some patients may develop metachronous adenomas after CRC surgery. However, we have not evaluated the changes in LMR after the occurrence of metachronous adenomas in post-CRC patients nor whether the presence of adenomas affects the diagnostic performance of LMR for CRC recurrence. Furthermore, due to a small sample size in the surgical group, we could not evaluate the diagnostic performance of p-LMR-f for CRC recurrence in the surgical group. Moreover, there is a correlation between radiotherapy and the dynamic changes of p-LMR-p. However, due to a small sample size of patients who received radiotherapy, the prognostic and diagnostic value of LMR in patients receiving radiotherapy plus chemotherapy was not further evaluated. Lastly, this study is retrospective from a single center without external validation. Further prospective studies are needed to validate our findings.
Conclusion
In summary, the dynamic changes of p-LMR-p are prognostic risk factors for CRC recurrence, while p-LMR-f can serve as a diagnostic biomarker for CRC recurrence. The combination of p-LMR-f and CEA can improve diagnostic performance. The longitudinal dynamic changes of LMR are beneficial for monitoring the disease status transition in CRC and facilitating adjustments in postoperative management plans for patients.
Acknowledgments
The authors acknowledge the assistance of their colleagues at the Affiliated Hospital of Jiangnan University. This study was supported by the National Natural Science Foundation of China (81600152), Jiangsu Province Natural Science Foundation (BK20160194), and Jiangsu Province Young Medical Talents (QNRC2016155).
Disclosure
The authors report no conflicts of interest in this work.
References
1. Ferlay J, Colombet M, Soerjomataram I, et al. Cancer statistics for the year 2020: an overview. Int J Cancer. 2021;149(4):778–789. doi:10.1002/ijc.33588
2. Siegel RL, Miller KD, Fuchs HE, Jemal A. Cancer statistics, 2022. CA Cancer J Clin. 2022;72(1):7–33. doi:10.3322/caac.21708
3. Arnold M, Sierra MS, Laversanne M, Soerjomataram I, Jemal A, Bray F. Global patterns and trends in colorectal cancer incidence and mortality. Gut. 2017;66(4):683–691. doi:10.1136/gutjnl-2015-310912
4. Li N, Lu B, Luo C, et al. Incidence, mortality, survival, risk factor and screening of colorectal cancer: a comparison among China, Europe, and northern America. Cancer Lett. 2021;522:255–268. doi:10.1016/j.canlet.2021.09.034
5. Kahi CJ, Boland CR, Dominitz JA, et al. Colonoscopy surveillance after colorectal cancer resection: recommendations of the US multi-society task force on colorectal cancer. Gastroenterology. 2016;150(3):758–768 e11. doi:10.1053/j.gastro.2016.01.001
6. Mantovani A, Allavena P, Sica A, Balkwill F. Cancer-related inflammation. Nature. 2008;454(7203):436–444. doi:10.1038/nature07205
7. Kim J, Bae JS. Tumor-associated macrophages and neutrophils in tumor microenvironment. Mediators Inflamm. 2016;2016:6058147. doi:10.1155/2016/6058147
8. Lippitz BE. Cytokine patterns in patients with cancer: a systematic review. Lancet Oncol. 2013;14(6):e218–e228. doi:10.1016/s1470-2045(12)70582-x
9. Guo GF, Wang YX, Zhou YX, et al. Immune cell concentrations among the primary tumor microenvironment in colorectal cancer patients predicted by clinicopathologic characteristics and blood indexes. J Immunother Cancer. 2019;7(1). doi:10.1186/s40425-019-0656-3
10. Condeelis J, Pollard JW. Macrophages: obligate partners for tumor cell migration, invasion, and metastasis. Cell. 2006;124(2):263–266. doi:10.1016/j.cell.2006.01.007
11. Aziz MH, Sideras K, Aziz NA, et al. The systemic-immune-inflammation index independently predicts survival and recurrence in resectable pancreatic cancer and its prognostic value depends on bilirubin levels: a Retrospective Multicenter Cohort Study. Ann Surg. 2019;270(1):139–146. doi:10.1097/SLA.0000000000002660
12. Moon G, Noh H, Cho IJ, Lee JI, Han A. Prediction of late recurrence in patients with breast cancer: elevated neutrophil to lymphocyte ratio (NLR) at 5 years after diagnosis and late recurrence. Breast Cancer. 2020;27(1):54–61. doi:10.1007/s12282-019-00994-z
13. Chan JCY, Chan DL, Diakos CI, et al. The lymphocyte-to-monocyte ratio is a superior predictor of overall survival in comparison to established biomarkers of resectable colorectal cancer. Ann Surg. 2017;265(3):539–546. doi:10.1097/Sla.0000000000001743
14. Chan JCY, Diakos CI, Chan DLH, et al. A longitudinal investigation of inflammatory markers in colorectal cancer patients perioperatively demonstrates benefit in serial remeasurement. Ann Surg. 2018;267(6):1119–1125. doi:10.1097/SLA.0000000000002251
15. Yamamoto T, Kawada K, Obama K. Inflammation-related biomarkers for the prediction of prognosis in colorectal cancer patients. Int J Mol Sci. 2021;22(15):8002. doi:10.3390/ijms22158002
16. Nost TH, Alcala K, Urbarova I, et al. Systemic inflammation markers and cancer incidence in the UK Biobank. Eur J Epidemiol. 2021;36(8):841–848. doi:10.1007/s10654-021-00752-6
17. Fest J, Ruiter R, Mulder M, et al. The systemic immune-inflammation index is associated with an increased risk of incident cancer-A population-based cohort study. Int J Cancer. 2020;146(3):692–698. doi:10.1002/ijc.32303
18. Yasui K, Shida D, Nakamura Y, Ahiko Y, Tsukamoto S, Kanemitsu Y. Postoperative, but not preoperative, inflammation-based prognostic markers are prognostic factors in stage III colorectal cancer patients. Br J Cancer. 2020;124(5):933–941. doi:10.1038/s41416-020-01189-6
19. You Q, Fang T, Yin X, et al. Serum CD4 is associated with the infiltration of CD4+T cells in the tumor microenvironment of gastric cancer. J Immunol Res. 2021;2021:1–13. doi:10.1155/2021/6539702
20. Hagland HR, Lea D, Watson MM, SØReide K. Correlation of blood T-cells to intratumoural density and location of CD3+ and CD8+ T-cells in colorectal cancer. Anticancer Res. 2017;37(2):675–684. doi:10.21873/anticanres.11363
21. Claude L, Perol D, Ray-Coquard I, et al. Lymphopenia: a new independent prognostic factor for survival in patients treated with whole brain radiotherapy for brain metastases from breast carcinoma. Radiother Oncol. 2005;76(3):334–339. doi:10.1016/j.radonc.2005.06.004
22. Ray-Coquard I, Cropet C, Van Glabbeke M, et al. Lymphopenia as a prognostic factor for overall survival in advanced carcinomas, sarcomas, and lymphomas. Cancer Res. 2009;69(13):5383–5391. doi:10.1158/0008-5472.Can-08-3845
23. Seliger B, Massa C. Modulation of lymphocyte functions in the microenvironment by tumor oncogenic pathways. Front Immunol. 2022;13:883639. doi:10.3389/fimmu.2022.883639
24. Farhood B, Najafi M, Mortezaee K. CD8(+) cytotoxic T lymphocytes in cancer immunotherapy: a review. J Cell Physiol. 2019;234(6):8509–8521. doi:10.1002/jcp.27782
25. Tan BH, Shi XJ, Zhang J, et al. Inhibition of Rspo-Lgr4 facilitates checkpoint blockade therapy by switching macrophage polarization. Cancer Res. 2018;78(17):4929–4942. doi:10.1158/0008-5472.Can-18-0152
26. Shimura T, Shibata M, Gonda K, et al. Prognostic impact of preoperative lymphocyte-to-monocyte ratio in patients with colorectal cancer with special reference to myeloid-derived suppressor cells. Fukushima J Med Sci. 2018;64(2):64–72. doi:10.5387/fms.2018-10
27. Yaping W, Zhe W, Zhuling C, et al. The soldiers needed to be awakened: tumor-infiltrating immune cells. Front Genet. 2022;13. doi:10.3389/fgene.2022.988703
28. Tesi RJ. MDSC; the most important cell you have never heard of. Trends Pharmacol Sci. 2019;40(1):4–7. doi:10.1016/j.tips.2018.10.008
29. Lewis ED, Wu D, Meydani SN. Age-associated alterations in immune function and inflammation. Prog Neuropsychopharmacol Biol Psychiatry. 2022;118:110576. doi:10.1016/j.pnpbp.2022.110576
30. Lisanti C, Basile D, Garattini SK, et al. The SAFFO Study: sex-related prognostic role and cut-off definition of Monocyte-to-Lymphocyte Ratio (MLR) in metastatic colorectal cancer. Cancers. 2023;15(1). doi:10.3390/cancers15010175
31. Conforti F, Pala L, Goldhirsch A. Different effectiveness of anticancer immunotherapy in men and women relies on sex-dimorphism of the immune system. Oncotarget. 2018;9(58):31167–31168. doi:10.18632/oncotarget.25795
32. Klein SL, Flanagan KL. Sex differences in immune responses. Nat Rev Immunol. 2016;16(10):626–638. doi:10.1038/nri.2016.90
33. Kitakaze M, Fujino S, Miyoshi N, et al. Tumor-infiltrating T cells as a risk factor for lymph node metastasis in patients with submucosal colorectal cancer. Sci Rep. 2023;13(1). doi:10.1038/s41598-023-29260-1
34. Wang Q, Li S, Qiao S, Zheng Z, Duan X, Zhu X. Changes in T lymphocyte subsets in different tumors before and after radiotherapy: a meta-analysis. Front Immunol. 2021;12. doi:10.3389/fimmu.2021.648652
35. Waidhauser J, Schuh A, Trepel M, Schmälter A-K, Rank A. Chemotherapy markedly reduces B cells but not T cells and NK cells in patients with cancer. Cancer Immunol Immunother. 2020;69(1):147–157. doi:10.1007/s00262-019-02449-y
36. Sorensen CG, Karlsson WK, Pommergaard HC, Burcharth J, Rosenberg J. The diagnostic accuracy of carcinoembryonic antigen to detect colorectal cancer recurrence - A systematic review. Int J Surg. 2016;25:134–144. doi:10.1016/j.ijsu.2015.11.065
37. Nicholson BD, Shinkins B, Mant D. Blood measurement of carcinoembryonic antigen level for detecting recurrence of colorectal cancer. JAMA. 2016;316(12):1310–1311. doi:10.1001/jama.2016.11212
38. Korner H, Soreide K, Stokkeland PJ, Soreide JA. Diagnostic accuracy of serum-carcinoembryonic antigen in recurrent colorectal cancer: a receiver operating characteristic curve analysis. Ann Surg Oncol. 2007;14(2):417–423. doi:10.1245/s10434-006-9060-6
39. He Q, Du S, Wang X, et al. Development and validation of a nomogram based on neutrophil-to-lymphocyte ratio and fibrinogen-to-lymphocyte ratio for predicting recurrence of colorectal adenoma. J Gastrointest Oncol. 2022;13(5):2269–2281. doi:10.21037/jgo-22-410
 © 2023 The Author(s). This work is published and licensed by Dove Medical Press Limited. The full terms of this license are available at https://www.dovepress.com/terms.php and incorporate the Creative Commons Attribution - Non Commercial (unported, v3.0) License.
By accessing the work you hereby accept the Terms. Non-commercial uses of the work are permitted without any further permission from Dove Medical Press Limited, provided the work is properly attributed. For permission for commercial use of this work, please see paragraphs 4.2 and 5 of our Terms.
© 2023 The Author(s). This work is published and licensed by Dove Medical Press Limited. The full terms of this license are available at https://www.dovepress.com/terms.php and incorporate the Creative Commons Attribution - Non Commercial (unported, v3.0) License.
By accessing the work you hereby accept the Terms. Non-commercial uses of the work are permitted without any further permission from Dove Medical Press Limited, provided the work is properly attributed. For permission for commercial use of this work, please see paragraphs 4.2 and 5 of our Terms.