Back to Journals » ClinicoEconomics and Outcomes Research » Volume 13
Productivity Loss and Associated Costs Among Patients with Transfusion-Dependent Thalassemia in Dubai, United Arab Emirates
Authors Alshamsi S ![]() , Hamidi S
, Hamidi S ![]() , Ozgen Narci H
, Ozgen Narci H
Received 17 August 2021
Accepted for publication 17 September 2021
Published 29 September 2021 Volume 2021:13 Pages 853—862
DOI https://doi.org/10.2147/CEOR.S334724
Checked for plagiarism Yes
Review by Single anonymous peer review
Peer reviewer comments 2
Editor who approved publication: Prof. Dr. Dean Smith
Shaikha Alshamsi,1 Samer Hamidi,2 Hacer Ozgen Narci3
1School of Health and Environmental Studies, Hamdan Bin Mohammed Smart University, Dubai, United Arab Emirates; 2School of Health and Environment Studies, Hamdan Bin Mohammed Smart University, Dubai, United Arab Emirates; 3Department of Health Management, Istinye University, Istanbul, Turkey
Correspondence: Shaikha Alshamsi
Hamdan Bin Mohammed Smart University, Academic City, Dubai, United Arab Emirates
Email [email protected]
Objective: The aim of this study was to assess the indirect burden of patients with transfusion-dependent thalassemia (TDT) in Dubai, the United Arab Emirates (UAE).
Methods: Adult patients with TDT were enrolled during blood transfusion sessions. Productivity loss for patients in the preceding four weeks was reported using the validated iMTA Productivity Cost Questionnaire (iPCQ).
Results: A total of 161 adult patients with TDT were included in the study. The annual total productivity loss cost at paid work among 79 employed patients was AED 17,230 (USD 4691) (95% CI: 12,302– 22,159), out of which absenteeism contributed AED 10,328 (USD 2812) and presenteeism contributed AED 6902 (USD 1879), whereas the annual total productivity loss cost at unpaid work was AED 4053 (USD 1104) (95% CI: 3471– 4661). The annual mean total indirect cost for paid and unpaid work was AED 21,283 (USD 5795). Monthly income, nationality, and having two and more disease complications were the significant predictors of higher productivity loss costs. Having previously had a splenectomy was a negative and significant predictor of productivity loss costs.
Conclusion: TDT was associated with substantial productivity loss and indirect costs in the UAE. Health policies that aim to control transfusion-dependent thalassemia effectively are necessary and could result in cost savings for patients and employers.
Keywords: productivity loss, friction cost approach, transfusion-dependent thalassemia, Dubai, United Arab Emirates
Introduction
Thalassemia has been recognized as a significant global and frequently-occurring monogenic disorder.1 Over 330,000 infants with genetic disorders are born annually, 56,000 of which are born with transfusion-dependent thalassemia (TDT) – 30,000 TDT sufferers need lifelong regular blood transfusions to live, while 5500 others die during the perinatal period as a result of α-thalassemia.2 Given this, the treatment of affected patients presents a considerable global disease burden.3
The most frequently observed hemoglobinopathy in the United Arab Emirates (UAE) was the α-thalassemia trait, with the highest carrier frequency worldwide (49%).4 The second-most frequent observed hemoglobinopathy was the HbA2 β-thalassemia trait, which presented at a frequency of 4.56%.5 The high prevalence of thalassemia carriers within the country remains a significant health problem, given that there will be a 25% risk of having a baby with TDT if both parents are carriers.6 Thus, the burden of TDT is expected to further grow, not only weighing heavily on the healthcare system, but on work productivity as well.
To our knowledge, existing information on productivity losses associated with TDT around the world is very limited. Few studies cover the indirect costs associated with the TDT. These studies have been reported for India, Italy, Iran, and Thailand. In Italy, a 2006 study estimated that the indirect cost caused by TDT was €37/patient/week (USD 47/patient/week).7 In Thailand, the average annual indirect cost was estimated as USD 229.60, representing nearly 24.2% of the total cost associated with thalassemia major in Thai children in 2005.8 In Iran, a 2015 study found that the average annual indirect cost amounted to USD 573.5.9 In India, a 2008 study calculated the indirect cost as either days lost from work or school – the study revealed that the average worker-days or school days lost for patients were 29.87 ± 18.5 and 19.07 ± 12.8 for those associated with sufferers of TDT.10 A large multinational study has also found that adults with TDT lose a mean of 2.1 paid working days monthly, while schoolchildren are reported to miss 2.8 days of school monthly.11
Productivity losses, and the associated costs among patients with TDT, are not known in Dubai, UAE. Thus, the objective of our analysis was to assess productivity loss caused by TDT, its costs via the friction cost method, and to identify the factors that potentially affect the costs associated with TDT patients.
Materials and Methods
Study Design
A retrospective cross-sectional study design was used to assess productivity loss and associated costs, and to identify the factors affecting the disease-related costs for patients with TDT. The productivity loss costs were estimated from the employer and patients’ perspective.
Patient Recruitment
Patients were recruited from the Dubai Thalassemia Center – the first specialized center in Dubai – and which covers the city of Dubai and the Northern Emirates. Patients were recruited during blood transfusion sessions between 4 December, 2019 and 6 February, 2020. All adult patients (aged more than 18 years) living in the UAE, and who have been diagnosed with β-thalassemia major, β-thalassemia intermedia, β-thalassemia /Hb E, and α-thalassemia intermedia (Hb H disease), and who have received regular blood transfusion for at least one year, were eligible for inclusion in the study. The study was approved by the Research Ethics Committee at Hamdan Bin Mohammed Smart University and the Dubai Scientific Research Ethics Committee (of the Dubai Health Authority). After explaining the study’s design and objectives, informed consent was obtained from participants, ensuring them of their right to withdraw at any time during the study.
Sample Size Calculation
A total of 424 adult patients were registered at the Dubai Thalassemia Center during the study period. The study’s eligible target population included 247 patients (after exclusions and pilot study). The sample size was calculated based on the following formula:12

By using this formula, and based upon a 5% margin of error and a 95% confidence interval for continuous data,13 a minimum of 153 patients with TDT were needed in order to conduct the study. Considering that 5% of the sample would be excluded from the analysis because of possible non-responses due to respondents’ health status, surveys were distributed via a randomized method among 161 patients during their blood transfusion sessions.
Data Collection
Productivity loss costs were estimated using the friction cost method in terms of productivity loss due to absenteeism, presenteeism, and unpaid work as a result of TDT, using the iMTA Productivity Cost Questionnaire (iPCQ).14 This is a validated questionnaire, and which was completed by adult patients (>18 years). The questions referred to the respondents’ preceding four weeks; to calculate the cost of productivity loss for one year, the observed patterns of measurement (four weeks) were extrapolated to one year.
The questionnaire consists of three modules:
- Lost productivity at paid work due to absenteeism, which refers to the productivity losses of the respondent due to absence from work during the past four weeks.
- Lost productivity at paid work due to presenteeism, which refers to the productivity losses of the respondent who is not fully functioning in the workplace due to illness during the past four weeks.
- Lost productivity at unpaid work, which refers to the productivity losses of the respondent due to inability to do unpaid work during the past four weeks.
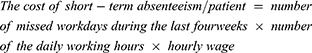
By using the iMTA Productivity Cost Questionnaire (iPCQ), the cost of productivity lost due to short-term absenteeism was calculated by multiplying the number of workdays missed during the past four weeks by the average number of hours worked per day and the cost price of productivity per hour (Equation 1). The annual cost of productivity lost due to short-term absenteeism was calculated by multiplying the result by 13 (52 weeks/year) (Equation 2).

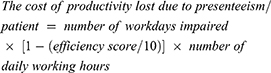
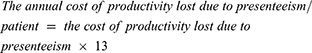
Presenteeism cost is calculated by multiplying the number of days worked while impaired by one minus the efficiency score, divided by 10, for the days via the standard cost price of productivity (Equation 3). The efficiency score ranged from 0 (unable to function) to 10 (do as much as would be able to do during a normal workday). The annual cost of productivity lost due to presenteeism was calculated by multiplying the result by 13 (Equation 4).
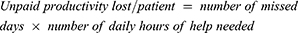
Unpaid productivity losses were determined by multiplying the number of days missed by the number of hours of help needed per day to make up for the work missed (Equation 5). The cost of unpaid productivity loss was calculated by multiplying the productivity loss by the standard hourly rate for household care (Equation 6). No official data were available regarding the standard hourly rate for household care, so average hourly wage data was used15 – the average hourly wage for housekeeping was AED 42.00 in 2019. The annual cost of unpaid productivity loss was calculated by multiplying the cost of unpaid productivity loss/patient by 13 (Equation 7).

As such, the total cost of productivity lost due to the disease per patient was calculated by adding the annual cost of productivity lost due to absenteeism per patient, the annual cost of productivity lost due to presenteeism/patient, and the annual cost of unpaid productivity loss per patient.
The total annual cost of productivity lost/patient = (Eq.2) + (Eq. 4) + (Eq. 7)
Data Analysis
Descriptive analysis was done by using mean and standard deviation for continuous variables with normally distributed data, along with the median and interquartile range to determine skewed data. Categorical variables were reported with absolute and relative frequencies. To study the significance of the difference, a Mann–Whitney U-test and a Kruskal–Wallis H-test was used for the continuous variables and the chi-square, respectively, with a Fisher exact probability test used for the categorical variables. To estimate the predictors associated with indirect costs, a generalized linear model with log link functions and gamma distribution was used. All assumptions of regression – such as collinearity, independence of residuals, linearity, outliers, and homoscedasticity – were checked and adjusted in cases of violations. All inferential tests were two-sided and utilized a 95% significance level. A p-value threshold of <0.05 was considered statistically significant. The data was analyzed in Stata/IC 16 (StataCorp, College Station, Texas 77845 USA).
Results
Demographic, Socioeconomic and Clinical Characteristics of TDT Patients
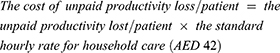
A total of 161 patients were included in the study. As indicated in Table 1, most of the patients (80.1%) fell into the 19–35 age group. More than half of patients (62.7%) were non-UAE nationals, with 27.4% of patients falling into the lowest annual household income quartile. The major type of thalassemia disease was β-thalassemia major (91.3%); furthermore, 97.5% of the 161 patients had complications associated with the disease. Deferasirox was the most common iron chelation therapy used in TDT patients (69.6%), and more than half of adult patients (60.2%) had severe serum ferritin levels (≥ 2000 ng/mL).
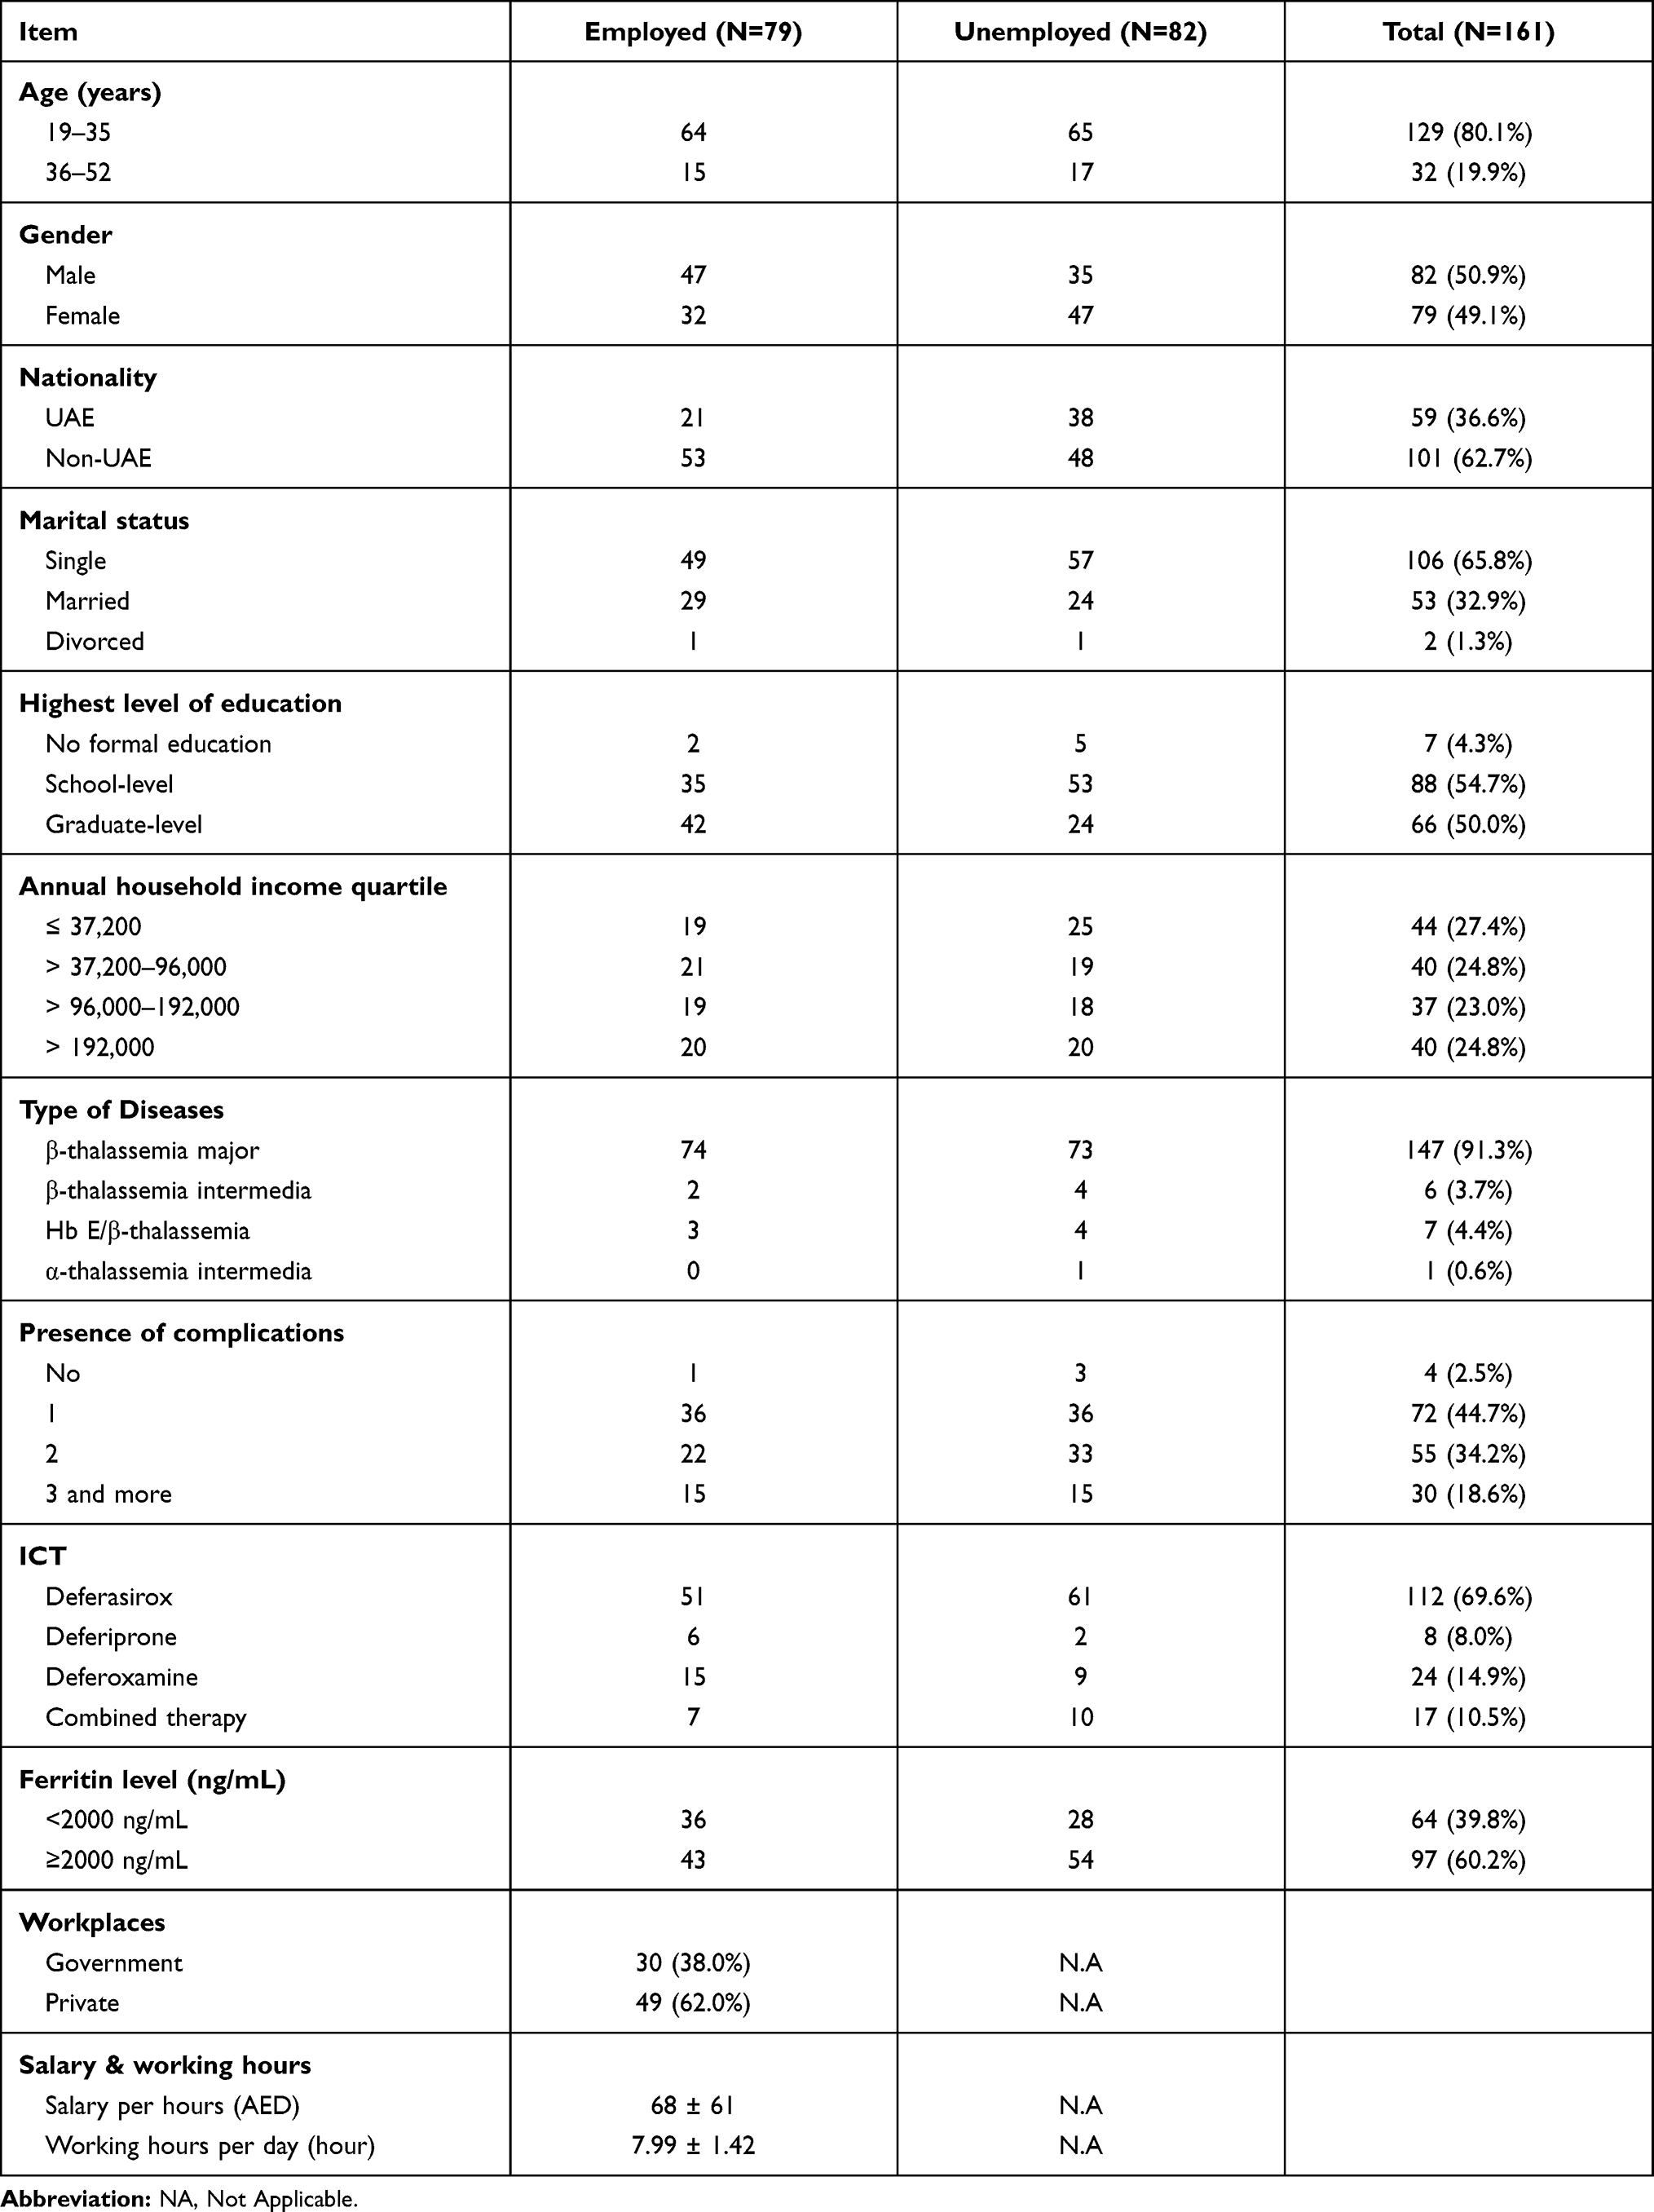 |
Table 1 Demographic, Socioeconomic, and Clinical Characteristics of TDT Patients |
Among the 161 adult patients, 82 (50.9%) were employed, and 49 (62.03%) of them belonged to the private sector, with the remainder working for government institutions. The mean salary per hour per employed patient was AED 68 ± 61 and the working hours per day per employed patient was reported as 7.99 ± 1.42 hours.
Absenteeism Costs Associated with TDT
The majority of employed patients (97.5%) missed work during the preceding four weeks. More than half of patients (73.4%) missed one working day during the preceding four weeks – the mean number of missed working days among those patients who reported short-term absenteeism from paid work was 1.53 ± 1.91 days. The mean cost of productivity loss due to short-term absenteeism per employed patient in the preceding four weeks was AED 795 (USD 215) (95% CI: 532–1057), and the annual mean absenteeism cost per employed patient was AED 10,328 (USD 2812) (95% CI: 6921–13,735) (Table 2).
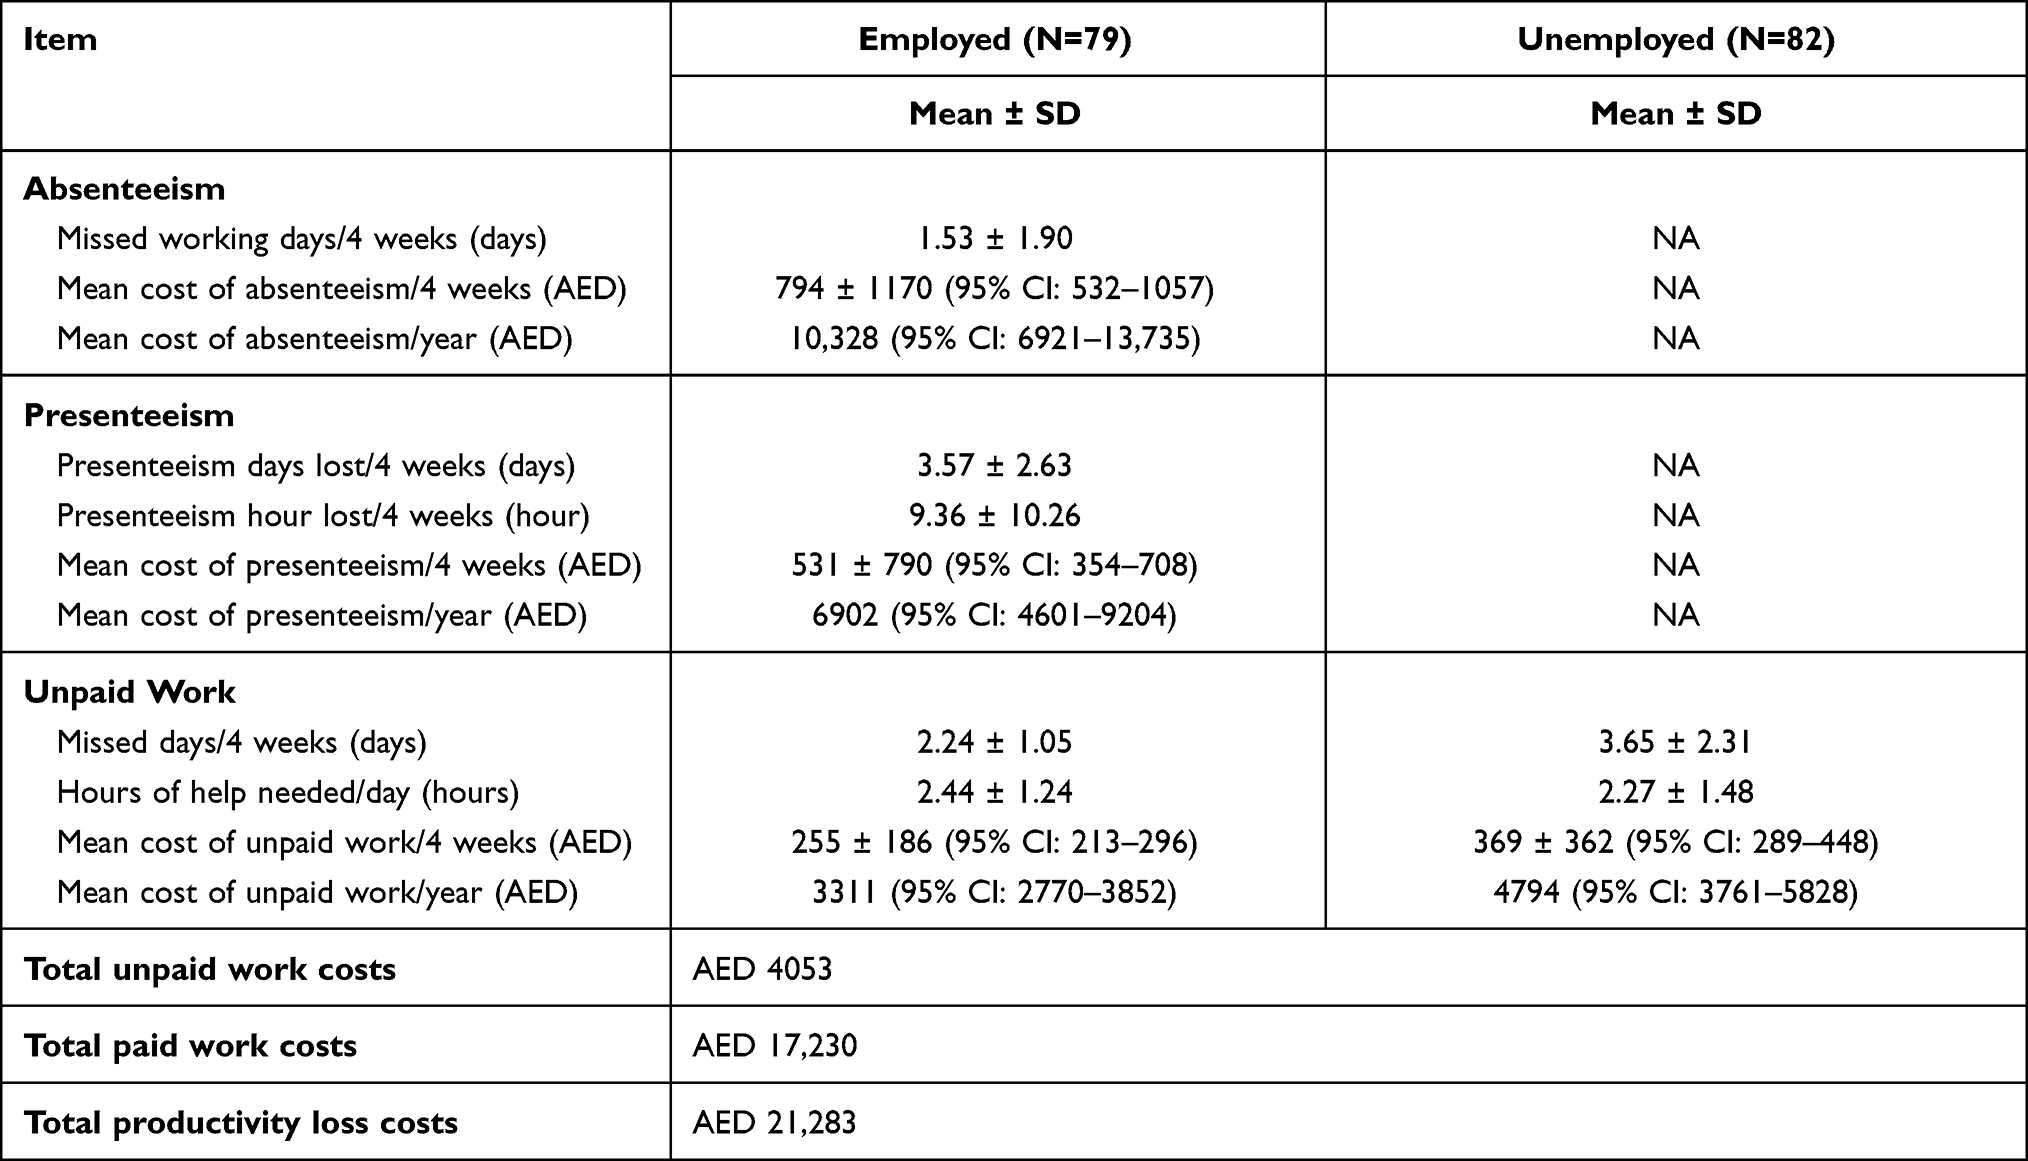 |
Table 2 Productivity Loss in TDT Patients Stratified According to Patients’ Employment Status |
Presenteeism Costs Associated with TDT
The mean number of days worked despite illness among the 79 employed patients who reported presenteeism at paid work in the preceding four weeks was 3.57 ± 2.63. The mean number of hours of lost productivity due to presenteeism was 9.36 ± 10.26, and the mean efficiency score of patients in the last four weeks was 6.84 ± 1.59. The mean cost of presenteeism in the preceding four weeks was AED 531 (USD 143) (95% CI: 354–708), and the annual mean cost of presenteeism per employed patients was AED 6902 (USD 1879) (95% CI: 4601–9204) (Table 2).
Unpaid Work Associated with TDT
93.7% of the employed patients were unable to do unpaid work due to health problems. The mean number of days of help needed was 2.24 ± 1.05, while the number of hours of help needed per day was 2.44 ± 1. The mean cost of unpaid productivity loss per four weeks was AED 255 (USD 69) (95% CI: 213–296), and the annual mean cost of unpaid productivity loss per employed patient was AED 3311 (USD 894) (95% CI: 2770–3852). All unemployed adult patients (100%) were unable to do unpaid work due to health problems. The mean number of days of help needed was 3.65 ± 2.31, and the number of hours of help needed per day to make up the work was 2.27 ± 1.48. The mean cost of unpaid productivity loss per four weeks was AED 369 (USD 107) (95% CI: 289–448), and the annual mean cost of unpaid productivity loss per unemployed patient was AED 4794 (USD 1294) (95% CI: 3761–5828) (Table 2).
The total productivity loss costs at a paying job among the 79 employed patients was AED 17,230 (USD 4691) (95% CI: 12,302–22,159), whereby absenteeism contributed to AED 10,328 (USD 2812) and presenteeism contributed to AED 6902 (USD 1879), whereas the total productivity loss costs for unpaid work among the 161 patients was AED 4053 (USD 1104) (95% CI: 3471–4661). The annual mean total of indirect costs for paid and unpaid work were AED 21,283 (USD 5795).
Relationship Between Demographic and Clinical Characteristics of TDT Patients and Indirect Costs
Bivariate analysis was used to study the association between productivity loss costs and TDT patients’ demographic and clinical characteristics. The demographic characteristics variables were age, gender, nationality, educational level, monthly income, and marital status. The analysis revealed that all demographic characteristics of TDT, with the exceptions of age and gender, were significantly associated with the costs involved in productivity loss (Table 3).
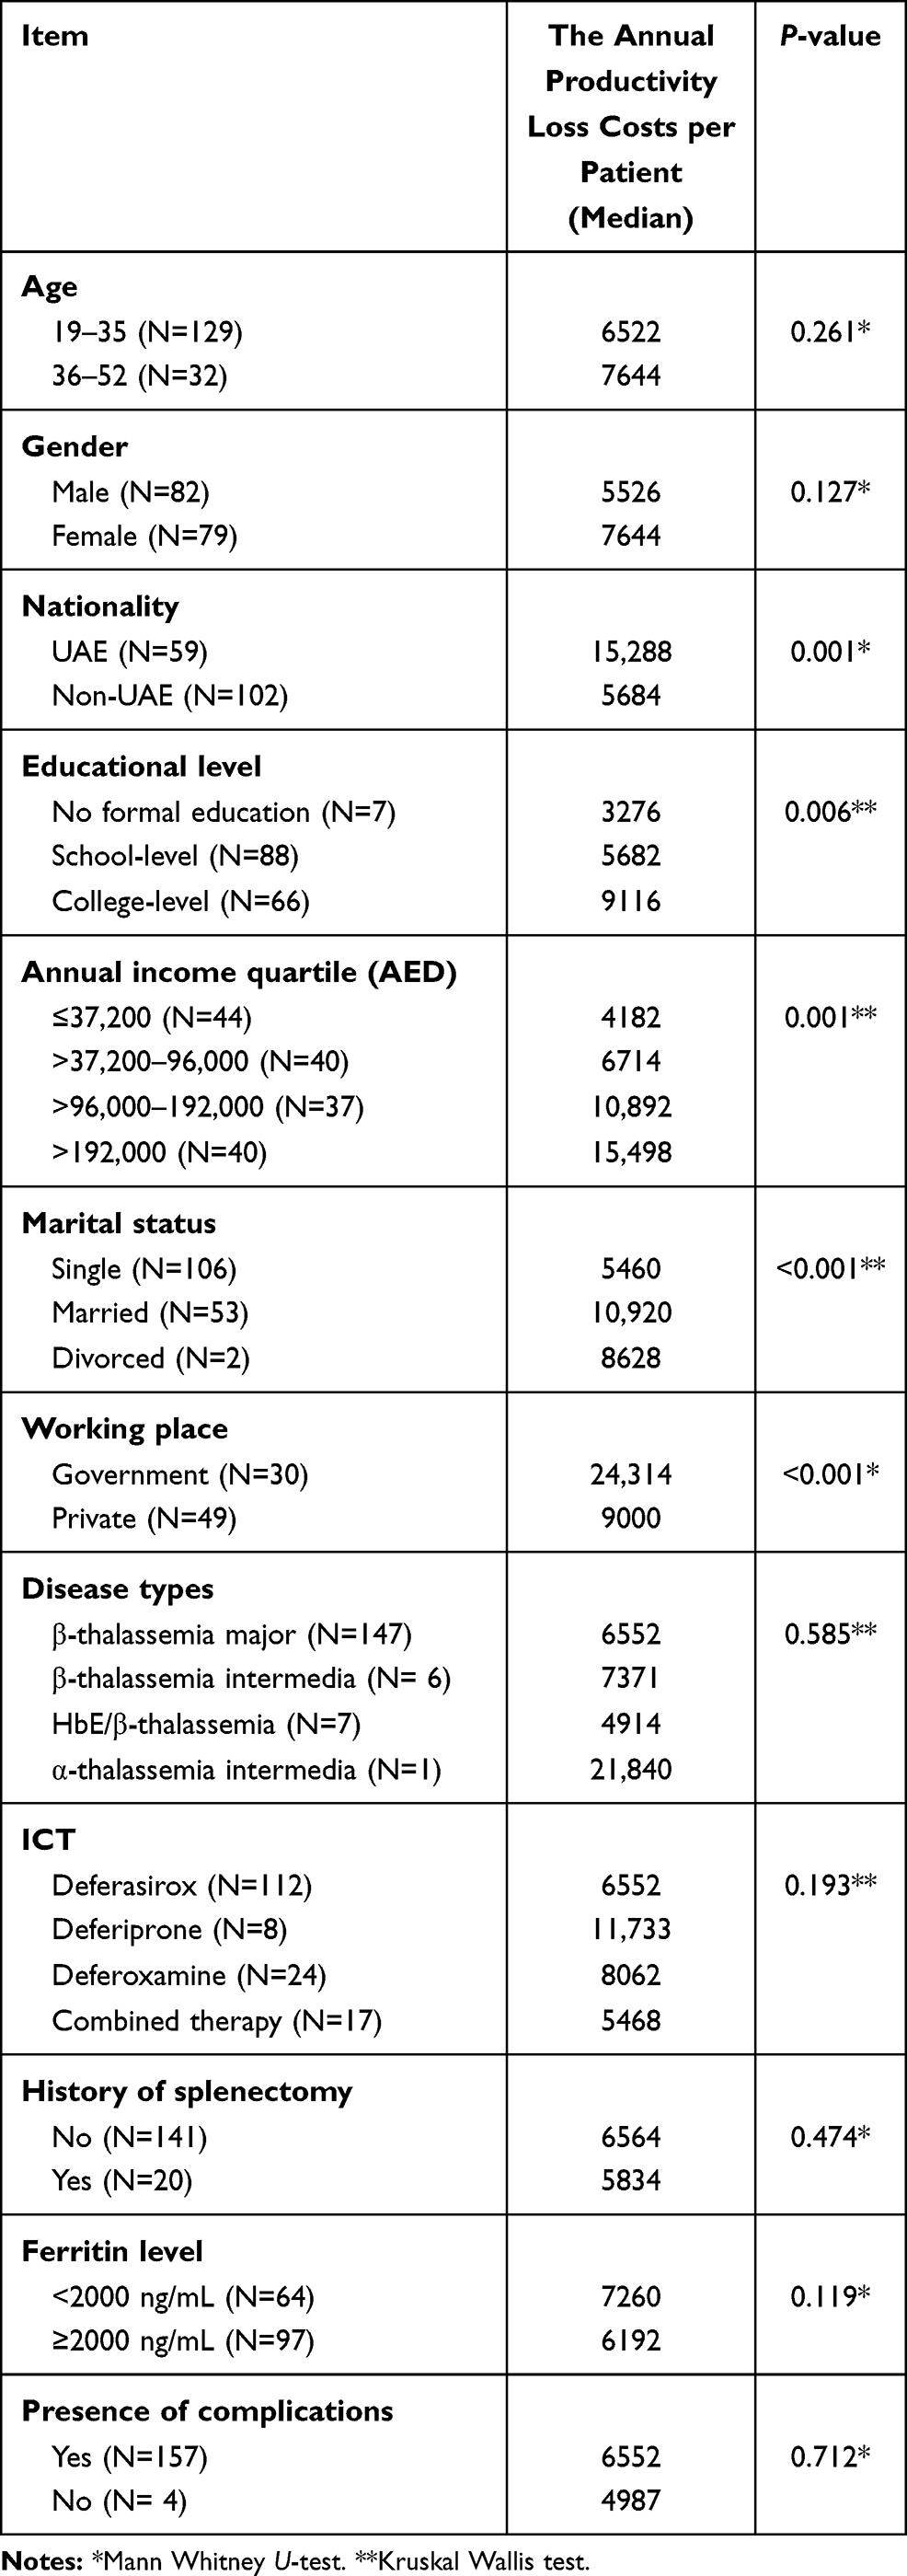 |
Table 3 Distribution of Productivity Loss Costs Among Patients’ Demographic and Clinical Characteristics (N=161) |
Significant differences were found among the annual productivity loss costs distributed by patients’ educational level (p < 0.001); the highest median value of productivity costs was observed in patients with a college-level education (AED 9116), followed by patients who only have secondary or primary schooling (AED 5682); the least median productivity loss costs were associated with illiterate patients (AED 3276). UAE patients had a significantly higher median of annual productivity loss costs compared to non-UAE patients (AED 15,288 and AED 5684, respectively – p = 0.001). Productivity loss costs were significantly associated with annual income quartiles (p = 0.001). The highest productivity loss costs were associated with the highest annual income quartile group (> AED 192,000) AED 15,498. Married patients were significantly associated with higher productivity loss costs (AED 10,920) compared to single and divorced patients (AED 5460 and AED 8628, respectively – p < 0.001). Moreover, employed patients in the government sector were associated with higher productivity loss costs than employed patients in the private sector (AED 24,314 and AED 9000, respectively – p <0.001). No statistically-relevant differences were found between the productivity loss costs and the clinical characteristics of the respondents (such as disease types, iron chelation, history of splenectomy, serum ferritin level, or presence of complications – Table 3).
A significant and positive correlation exists between productivity loss costs and monthly income (ρ value = 0.717, p < 0.001), and a positive, but weak correlation exists between patients’ age and the productivity loss costs (ρ value = 0.194, p = 0.014) (Table 4).
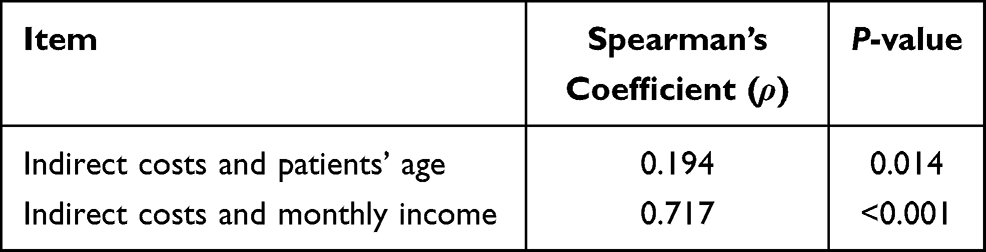 |
Table 4 The Relationship Between Indirect Costs and Patients’ Age and Monthly Income |
Identifying Predictors of Indirect Costs for TDT Patients
A generalized linear model with log link and gamma distribution was used to determine the outcome variables’ predictors. The productivity loss cost was the dependent (continuous) variable in the regression model. The following independent variables were used in the model depending on the stepwise selection method: splenectomy, marital status, monthly income, working status, and age.
The following regression equation was constructed for the productivity loss costs according to the linear model with log link function and gamma distribution:
Log (productivity loss costs) = 4.36–0.63 (x1) + 0.40 (x2) + 0.49 log (x3) + 0.05 (x4)
Where x1 is the splenectomy; x2 is the marital status; x3 is the log of monthly income; and x4 is the patient’s age.
The generalized linear model identified four statistically significant predictors for productivity loss costs. There were three significant positive predictors: marital status, monthly income, and the patient’s age, whereas the splenectomy was the significant negative predictor (Table 5). According to the regression equation, splenectomized patients were expected to decrease the rate of productivity loss cost by 63% compared to non-splenectomized patients. Married patients were associated with an expected increase in the productivity loss costs by 40% compared to single patients. A 1% increase in patients’ monthly income would yield a 0.49% increase in productivity loss costs. Moreover, with every increase of one year in the patient’s age, there is an increase of 5% in the productivity loss costs, while holding all other variables in the model constant (Table 5).
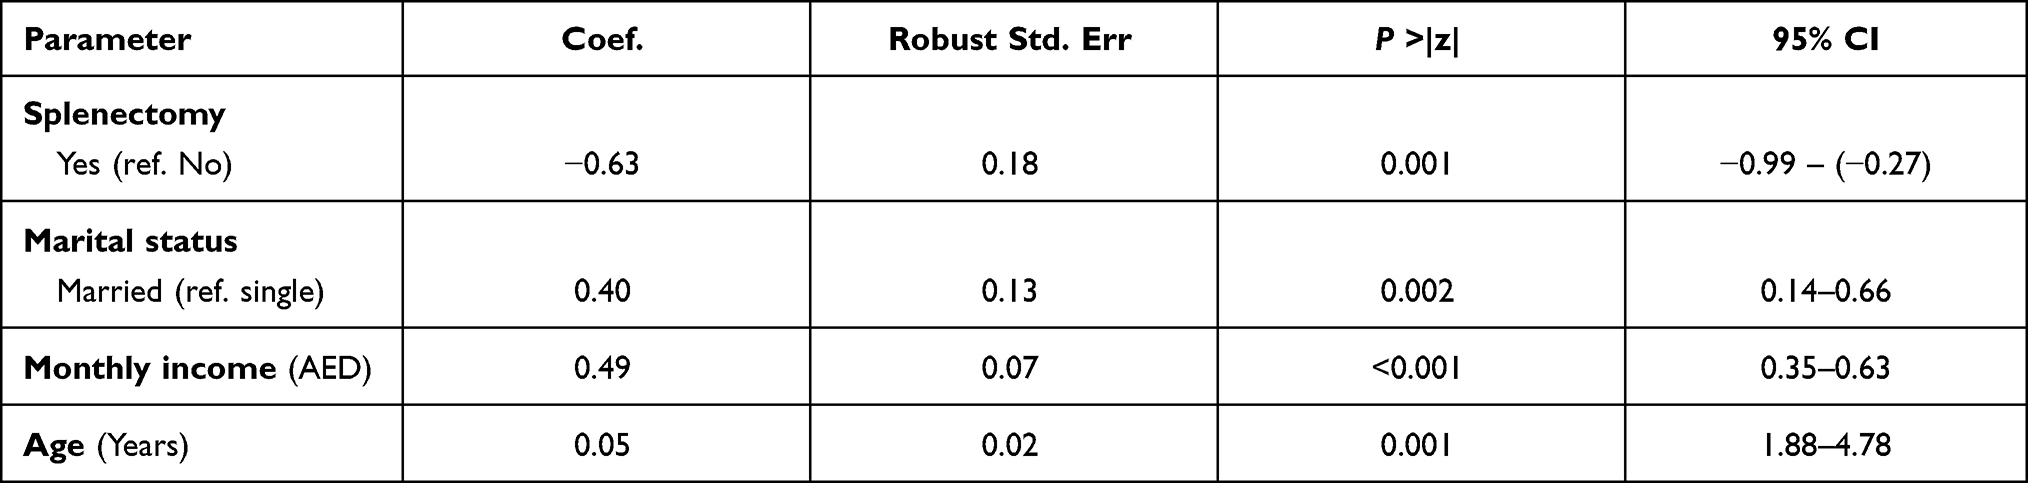 |
Table 5 Generalized Linear Model (GLM) Analysis (Gamma with Log Link Model) of the Productivity Loss Costs |
Discussion
This study estimated the productivity loss cost by using the friction cost method in patients with TDT. To our best of knowledge, no study has been conducted to estimate the productivity loss costs via the use of the friction method. In this study, most of the employed patients (97.5%) missed work during the preceding four weeks, and the mean number of missed workdays during the same period of time was 1.53 ± 1.91 days. This result is similar to other studies reporting that the annual average workdays lost for patients are 2.49 days per month,10 with a mean of 2.1 workdays in a month.11 According to our study, all employed patients had to miss one to two days of work every month for blood transfusion sessions. The study showed that productivity loss due to presenteeism was greater than productivity loss due to absenteeism. The mean number of days worked despite illness was 3.57 ± 2.63, whereas the missed working days due to disease was 1.53 ± 1.90. This finding could be explained by the weakness and fatigue that patients face due to low hemoglobin before their next blood transfusion session.
The productivity loss costs due to unpaid work per employed patients were lower than the productivity loss costs due to unpaid work per unemployed patients. This could be explained by the fact that most employed patients were in good physical health compared to unemployed patients, which affects their ability to do unpaid work. Moreover, our results showed that unpaid work losses of productivity contribute 19% of the total indirect costs. These are usually unaccounted for in estimations of disease costs and may cause policymakers to underestimate the problem.
The annual mean productivity loss costs for TDT patients was AED 21,283 (USD 5794, EUR 4768). This finding is inconsistent with other studies.7–9 Estimated indirect costs in Italy were EUR 37 per patient per week (EUR 1924 per year).7 In Thailand, the average annual productivity loss costs were USD 229.6.8 In Iran, the productivity loss costs were USD 573.5 per patient per year.9 These variations are attributable to the different methods used in estimating productivity loss costs and the different inclusion criteria of each study.
Bivariate analyses revealed that TDT patients’ demographic characteristics included their nationality, educational level, monthly income, marital status, and working places – all of which are associated with costs of productivity loss as a result of TDT. UAE patients were associated with a degree higher productivity loss costs compared to expatriate patients. This could be explained by the higher socioeconomic level of UAE patients compared to expatriate patients. Patients with a college-level education had significantly higher productivity loss costs compared to illiterate patients or patients with school-level education. This is because of the higher earnings of those with high education level when compared to illiterate patients. Patients working in the government sector had significantly higher productivity loss costs compared to patients working in the private sector. Usually, the government sector in the UAE provides higher salaries than the private sector, which increases productivity loss due to TDT. Married patients had significantly higher productivity loss costs compared to single or divorced patients. This finding could be explained by the higher earnings of married compared to single patients. Furthermore, the socioeconomic characteristics of patients could explain these findings. UAE patients had a higher socioeconomic level than expatriate patients, and about 84.4% of them work in the government sector (which is distinguished by higher salaries than the private sector), and 44% of which also had higher educational level compared to 39% of expatriate patients – therefore, a higher degree of educational attainment is usually linked with higher income. All these factors were associated with higher productivity loss costs.16
In addition, correlation analyses revealed a significant positive correlation between productivity loss costs and monthly income. This could be explained by the fact that patients with a higher monthly income had a higher productivity loss cost. According to other studies on chronic disease,17–19 older age is a predictor of productivity loss, which is in agreement with our results, which show a weak positive correlation between productivity loss costs and patients’ age. This could be explained by the fact that older people tend to have less workability, and that their performance capacity is decreased compared to young people.
Regression analysis revealed that the predictors of the productivity loss cost in this study included having had a splenectomy, marital status, monthly income, and patients’ age. The splenectomy variable had a significant negative impact on productivity loss costs by (63.2%). This could be explained by the fact that splenectomized patients received fewer blood units than non-splenectomized patients,20,21 which means less weakness and fatigue which non-splenectomized patients face due to blood transfusion session and, therefore, less productivity loss costs compared to non-splenectomized patients. Married patients and those with higher monthly income were expected to have higher productivity loss costs compared to single patients. As mentioned earlier in this section, patients with higher incomes had higher losses in productivity costs, and this is referred to via the calculation of the productivity loss costs using the friction cost method (based on the patients’ income per hour).22
In agreement with previous studies focused on chronic diseases,17–19 older patients had more disease complications affecting their ability to work. Furthermore, aging plays a positive effect on working productivity, as the performance capacity decrease with age.
According to recommendations of the guidelines for the management of TDT, clinic and transfusion times should be flexible and take into consideration the patient’s commitments, such as their education and work.23 So, a collaboration between health policymakers and the Ministry of Human Resources and Emiratisation (MOHRE) could lead to creative solutions that address the low performance of TDT employed patients and the difficulty in finding suitable jobs for the unemployed TDT patients. Moreover, to avoid the absenteeism and presenteeism in TDT patients, Dubai thalassemia Center should reorganize its schedules for the blood transfusion on weekends or in the evening to overcome the absenteeism and presenteeism problems and therefore minimize the productivity lost in TDT patients.
Study Limitation
This study has several limitations that are mainly related to research design and lack of prior research. First, the literature search identified very few published studies assessing indirect costs associated with TDT patients. Hence, comparisons could not be accurate due to different tools used in estimation or via the lack of relevant literature.7,9 Second, there is no consensus on how to differentiate the severity of thalassemia; thus, different criteria to evaluate thalassemia’s severity in different studies were found,24,25 which could, in turn, affect the quality of comparison between studies. Third, concerning estimating productivity loss, this study did not assess the productivity loss incurred by parents or caregivers, as most patients came to the thalassemia center with their parents or caregivers. Finally, there was a concern for selection bias as it only included thalassemia patients from a single center. However, since the Dubai Thalassemia Center has the largest number of thalassemia patients in Dubai, and covers about half of the thalassemia patients in the UAE,26 we believe that the sample is representative of the thalassemia population in Dubai.
Conclusions
In conclusion, this study estimates that the productivity loss costs for the patients with TDT could be substantial. Results of this study could be used to inform policies aiming to control transfusion-dependent thalassemia effectively by introducing interventions which could result in cost savings for employers and patients.
Data Sharing Statement
The data that support the findings of this study are extracted from patients’ records. Due to restrictions around revealing patients’ confidential information, data were used under license for the current study and are, thus, neither publicly available nor can be shared further.
Ethical Approval
The study was conducted in accordance with the Declaration of Helsinki Ethical principles and was approved by the Research Ethics Committee at Hamdan Bin Mohammed Smart University and the Dubai Scientific Research Ethics Committee (of the Dubai Health Authority).
Consent to Participate
Informed consent was obtained from the participants, or guardians of children aged <18, and ensured the participants that they had the right to withdraw at any time during the study. All documents and data were treated as confidential, and privacy was ensured during data collection.
Acknowledgments
The authors deeply acknowledge the Dubai Thalassemia Center for their assistance in this study. Special thanks to Dr. Tim A Kanters (Institute for Medical Technology Assessment, Erasmus University Rotterdam, Netherlands) for his assistance in the productivity cost estimation.
Funding
No funding was received to conduct this study.
Disclosure
The authors have no relevant financial or non-financial interests for this work to disclose.
References
1. Weatherall D, Clegg J. Thalassemia-a global health problem. Nat Med. 1996;2(8):847–849. doi:10.1038/nm0896-847
2. Modell B, Darlison M. Global epidemiology of haemoglobin disorders and derived service indicators. Bull World Health Organ. 2008;86:480–487. doi:10.2471/BLT.06.036673
3. De Sanctis V, Kattamis C, Canatan D, et al. β-thalassemia distribution in the old world: an ancient disease seen from a historical standpoint. Mediterr J Hematol Infect Dis. 2017;9(1):e2017018. doi:10.4084/mjhid.2017.018
4. El-Kalla S, Baysal E. α-thalassemia in the United Arab Emirates. Acta Haematol. 1998;100(1):49–53. doi:10.3109/03630269.2011.634698
5. Belhoul KM, Abdulrahman M, Alraei RF. Hemoglobinopathy carrier prevalence in the United Arab Emirates: first analysis of the Dubai Health Authority premarital screening program results. Hemoglobin. 2013;37(4):359–368. doi:10.3109/03630269.2013.791627
6. Kim S, Tridane A, Grosso M. Thalassemia in the United Arab Emirates: why it can be prevented but not eradicated. PLoS One. 2017;12(1):e0170485. doi:10.1371/journal.pone.0170485
7. Mantovani LG, Scalone L, Ravera S, Krol M, Uyl-de Groot C, Cappellini MD. Direct and Indirect Cost of Beta Thalassemia Major: resuts from the ITHACA Study. Blood. 2006;108(11):3343. doi:10.1182/blood.V108.11.3343.3343
8. Riewpaiboon A, Nuchprayoon I, Torcharus K, Indaratna K, Thavorncharoensap M, Ubol B-O. Economic burden of beta-thalassemia/Hb E and beta-thalassemia major in Thai children. BMC Res Notes. 2010;3(1):29. doi:10.1186/1756-0500-3-29
9. Esmaeilzadeh F, Azarkeivan A, Emamgholipour S, et al. Economic burden of thalassemia major in Iran, 2015. J Res Health Sci. 2016;16(3):111–115.
10. Mallik S, Chatterjee C, Mandal PK, Sardar JC, Ghosh P, Manna N. Expenditure to treat thalassaemia: an experience at a tertiary care hospital in India. Iran J Public Health. 2010;39(1):78.
11. Caro JJ, Ward A, Green TC, et al. Impact of thalassemia major on patients and their families. Acta Haematol. 2002;107(3):150–157. doi:10.1159/000057633
12. Watson J How to determine a sample size: tipsheet# 60. University Park, PA: Penn State Cooperative Extension; 2001. Available from: https://ucanr.edu/sites/CEprogramevaluation/files/143304.pdf.
13. Krejcie RV, Morgan DW. Determining sample size for research activities. Educ Psychol Meas. 1970;30(3):607–610. doi:10.1177/001316447003000308
14. Bouwmans C, Krol M, Severens H, Koopmanschap M, Brouwer W, Roijen LH-V. The iMTA Productivity Cost Questionnaire: a standardized instrument for measuring and valuing health-related productivity losses. Value Health. 2015;18(6):753–758. doi:10.1016/j.jval.2015.05.009
15. Salary Explorer. Cleaning and housekeeping average salaries in Dubai 2020; 2020. Available from: http://www.salaryexplorer.com/salary-survey.php?loc=2426&loctype=3&job=16&jobtype=1#:~:text=The%20average%20hourly%20wage%20(pay,in%20Dubai%20is%2042%20AED.
16. De Azevedo AB, Ferraz MB, Ciconelli RM. Indirect costs of rheumatoid arthritis in Brazil. Value Health. 2008;11(5):869–877. doi:10.1111/j.1524-4733.2008.00332.x
17. Puolakka K, Kautiainen H, Möttönen T, et al. Predictors of productivity loss in early rheumatoid arthritis: a 5 year follow up study. Ann Rheum Dis. 2005;64(1):130–133. doi:10.1136/ard.2003.019034
18. Chan G, Tan V, Koh D. Ageing and fitness to work. Occup Med. 2000;50(7):483–491. doi:10.1093/occmed/50.7.483
19. Kuiper S, van Gestel AM, Swinkels HL, de Boo TM, Da Silva J, Van Riel P. Influence of sex, age, and menopausal state on the course of early rheumatoid arthritis. J Rheumatol. 2001;28(8):1809–1816.
20. Saleh H, Alkhateep Y, Mohammed A. Role of splenectomy in thalassemic patients. Menoufia Med J. 2018;31(1):118–125. doi:10.4103/1110-2098.234219
21. Easow Mathew M, Sharma A, Aravindakshan R. Splenectomy for people with thalassaemia major or intermedia. Cochrane Database Syst Rev. 2016;6. doi:10.1002/14651858.CD010517.pub2
22. Pike J, Grosse SD. Friction cost estimates of productivity costs in cost-of-illness studies in comparison with human capital estimates: a Review. Appl Health Econ Health Policy. 2018;16(6):765–778. doi:10.1007/s40258-018-0416-4
23. Cappellini M-D, Cohen A, Eleftheriou A, Piga A, Porter J, Taher A Guidelines for the clinical management of thalassaemia; 2013.
24. Sripichai O, Makarasara W, Munkongdee T, et al. A scoring system for the classification of beta-thalassemia/Hb E disease severity. Am J Hematol. 2008;83(6):482–484. doi:10.1002/ajh.21130
25. Phadke SR, Agarwal S. Phenotype score to grade the severity of thalassemia intermedia. Indian J Pediatr. 2003;70(6):477–481. doi:10.1007/bf02723137
26. Nuwais SA UAE records new blood disorder cases after hopes of eradicating condition. The National. Health; September 16, 2019.
 © 2021 The Author(s). This work is published and licensed by Dove Medical Press Limited. The
full terms of this license are available at https://www.dovepress.com/terms
and incorporate the Creative Commons Attribution
- Non Commercial (unported, 3.0) License.
By accessing the work you hereby accept the Terms. Non-commercial uses of the work are permitted
without any further permission from Dove Medical Press Limited, provided the work is properly
attributed. For permission for commercial use of this work, please see paragraphs 4.2 and 5 of our Terms.
© 2021 The Author(s). This work is published and licensed by Dove Medical Press Limited. The
full terms of this license are available at https://www.dovepress.com/terms
and incorporate the Creative Commons Attribution
- Non Commercial (unported, 3.0) License.
By accessing the work you hereby accept the Terms. Non-commercial uses of the work are permitted
without any further permission from Dove Medical Press Limited, provided the work is properly
attributed. For permission for commercial use of this work, please see paragraphs 4.2 and 5 of our Terms.