")
Back to Journals » Diabetes, Metabolic Syndrome and Obesity » Volume 12
Prevalence and socio-behavioral factors associated with sugar-sweetened beverages consumption among 15 years and older persons in South Africa
Received 18 March 2019
Accepted for publication 7 May 2019
Published 21 June 2019 Volume 2019:12 Pages 937—945
DOI https://doi.org/10.2147/DMSO.S209147
Checked for plagiarism Yes
Review by Single anonymous peer review
Peer reviewer comments 2
Editor who approved publication: Dr Konstantinos Tziomalos
Supa Pengpid,1,2 Karl Peltzer2
1ASEAN Institute for Health Development, Mahidol University, Salaya, Phutthamonthon, Nakhonpathom, Thailand; 2Research and Innovation Office, North West University, Potchefstroom, South Africa
Objective: The aim of this study was to assess the frequency of sugar-sweetened beverages (SSB) consumption and its relationship with socio-behavioral factors using national population-based data in South Africa.
Subjects and methods: Cross-sectional data were analyzed from the South African National Health and Nutrition Examination Survey (SANHANES-1) in 2012. The population sample included 15,179 adults (median age=34.0 years, interquartile range=25, range=15–98 years) who participated in the SANHANES-1.
Results: Overall, the study participants consumed 33.9% none, 48.3% 1–3 times, 7.2% 4–6 times, and 10.6% every day soft drinks in the past week (or an equivalent of an average of 0.30 servings, SD=0.3, per day); 43.4% had consumed no sweetened fruit juice, 42.3% 1–3 times, 5.2% 4–6 times; and 9.1% daily sweetened fruit juice (or an equivalent of an average of 0.25 servings, SD=0.3, per day). The prevalence of daily SSB (soft drink and/or sweetened fruit juice) consumption was 16.0% (or an equivalent of an average of 0.54 servings, SD=0.5, per day). In the final logistic regression model, younger age, urban residence, perceived overweight, fruit consumption, fresh fruit juice consumption, and having had processed meat and fried food from street vendors were associated with SSB consumption. In addition, problem drinking and physical activity were associated with daily soft drink consumption, and higher sedentary time was associated with daily sweetened fruit juice consumption.
Conclusions: The study found a high prevalence of daily SSB consumption and identified several socio-behavioral factors that can be targeted in public health intervention programs.
Keywords: sugar-sweetened beverages, socio-behavioral factors, adolescents, adults, South Africa
Introduction
Sugar-sweetened beverages (SSB) consumption has been associated with overweight or obesity, poor oral health, and medical problems, including diabetes, metabolic syndrome, multimorbidity, and mental health problems.1–6 The consumption of soft drinks has been increasing in South Africa over the past 20 years.7 “‘Total soft drink’ consumption increased by a dramatic 68.9% from 55 L. capita/year in 1999 to 92.9 L. capita/year in 2012”.8 South Africa has the highest prevalence of overweight or obesity (53.8%, 18 years and older in 2016) in sub-Saharan Africa.9 Consequently, the South African government introduced a sugar tax, including SSB, in April 2018.10
Globally, the mean consumption of SSB in adults was 0.58 servings a day in 2010, with the highest in upper-middle income countries (0.80 servings/day), followed by lower-middle income countries (0.59 servings/day) and high income (0.51 servings/day) countries.11 SSB consumption in adults in upper middle-income countries was in China 15.3% once a week and 1.3% once a day in 2010–2012,12 and in Southern Brazil 20.4% consumed SSB 5–7 times a week.13 In studies among adults in high-income countries, the prevalence of daily SSB consumption was 40.8% in Mississippi, US,14 23.9% in six US States,15 26.3% in 18 US States,16 and 20.4% in the UK.17
The risk of higher SSB consumption may be higher in specific sociodemographic groups and those with specific behavioral risk factors. Sociodemographic factors may include males,13,14,17–19 younger age groups,14,15,17,19,20 ethnicity,17,19 Blacks,14,19 lower income,12,14,17 lower education,14,17 and those with a disability.21 Behavioral factors may include smokers,13,15,19 physically inactive individuals,15,19 overweight or obese persons,17,20 unhealthy food consumption, such as fast food19 and snacks.13,17 Healthy food consumption, such as fruit and vegetables consumption13,15 and 100% fruit juice consumption15 was found to be protective from SSB consumption.
Identifying the sociodemographic and behavioral determinants of SSB may help in targeted public health intervention.17 There is a lack of research in Africa, including South Africa, on the prevalence and socio-behavioral factors of SSB consumption. Therefore, the goal of this study was to investigate the frequency of SSB consumption and its relationship with socio-behavioral factors using national population-based data in South Africa.
Methods
Study design and participants
The total sample with complete SSB measurements included 15,179 persons 15 years and older (median age=34.0 years, interquartile range=25), that took part in the South African National Health and Nutrition Survey (SANHANES-1).22 Briefly, the SANHANES-1 employed a multi-stage cluster sampling design in sampling the households to be included in a nationally representative survey in South Africa from April to November 2012.22 In all, 500 enumeration areas (EAs) representative of the sociodemographic profile (stratified by province, locality type, and race or population group) of South Africa were identified, and a random sample of 20 households was selected from each EA.22,23 All persons residing in the selected households were eligible to participate.22,23 Data for this survey were collected by administering questionnaires to participants (conducting face-to-face interviews) and performing a clinical examination on each participant.22,23 Participants provided informed written consent, and the study protocol was approved by the Research Ethics Committee (REC) of the Human Sciences Research Council (REC 6/16/11/11). Participating women made up 54.3%, and 63.4% of respondents were living in urban areas.
Measures
SSB consumption was assessed with two questions, “During the past 7 days, how often did you have sweetened cold drink (gas, fizzy cold drink, and reconstituted)/sweetened fruit juice?”
Response options were 1=none, 2=every day, 3=1–3 times last week, and 4=4–6 times last week.21 Daily soft drink consumption was calculated from those who said that they would drink a sweetened cold drink every day=1 and none, 1–3 times last week, or 4=4–6 times last week=0.
Likewise, daily sweetened fruit juice consumption was calculated from those who said that they would drink it every day=1 and none, 1–3 times last week, or 4=4–6 times last week=0. Daily SSB consumption was classified as either daily sweetened cold drink consumption and/or daily sweetened fruit juice consumption. The daily average number of SSB servings was calculated from the total number of times a sweetened cold drink and sweetened fruit juice was consumed in a week, divided by 7 (for the number of days in a week) and divided by 2 (for sweetened cold drink and sweetened fruit juice.
Sociodemographic information included age, sex, race or population group, province, employment status, and residence.22
Functional disability was assessed with the 12-item WHO Disability Assessment Schedule, version 2.0 (WHODAS-II).24 For example, “In the last 30 days how much difficulty did you have in standing for long periods, such as 30 minutes?” (response ranged from 1=none to 5=extreme/cannot do). Cronbach’s alpha for the WHODAS-II was 0.90 in this study. The WHODAS-II score was transformed into a score of 0–100, with 25% or more indicating moderate to extreme functional disability.24
Tobacco use was assessed with items on the “history of tobacco smoking and use of other tobacco products, duration, and frequency of use”.22 Current tobacco use was defined as daily or less than daily smoking tobacco and/or daily or less than daily use of other tobacco products.
Problem drinking was defined as three or more scores for women and four or more scores for men on the Alcohol Use Disorders Identification Test–Consumption (AUDIT-C).25 (Cronbach alpha=0.89).
Physical activity was assessed with the General Physical Activity Questionnaire (GPAQ),26,27 and categorized into low, moderate, and high physical activity following GPAQ criteria.27
Sedentary behavior was assessed with two items, on the time spend sitting or reclining (lying) on a usual weekday or weekend day (excluding sleeping).28 Sedentary time was categorized into <4 hours, 4≤8 hours, 8 or more hours a day.29
Perceived body weight was assessed with the question, “Do you think you are Underweight, Normal weight, or Overweight?”22
Trying to lose weight was assessed with the question, “During the past 12 months have you tried to lose weight?” (Yes, No).22
Fruit consumption “How many fruits do you usually eat per day?” Vegetable consumption “How many portions of vegetables, excluding potatoes, do you usually eat per day?” Responses were classified into 0=not every day, but 4 or more a week or not every day, but less than 4 per week or none, and 1=4 or more per day or 1–3 per day.22
Fresh fruit juice consumption, without added sugar, was classified as 0=none or 1–3 times a week, and 1=4–7 times a week.22
Eating out was assessed with two questions, 1) “Do you ever eat in places other than at home?” (Yes, No) and 2) “How often do you eat at those places?” (classified as 0=monthly or more than once a month and 1=more than once a week or weekly).22
Processed meat consumption (eg, sausages, polony, cold cuts, viennas, frankfurters, russians, salami); fast food (food from fast food outlets, takeaways, eg, pizza, chicken, fish, etc); and fried food bought from street vendors (eg, chips, vetkoek, fried chicken, fried fish, etc) were grouped into 0=none or 1–3 times a week, and 1=4–7 times a week.22
Data analysis
Data were analyzed with STATA software version 15.0 (Stata Corporation, College Station, TX, USA) taking the complex study approach into account.22 Descriptive statistics were used to describe the sample, and chi-square tests were used to calculate differences in proportions. Multivariable logistic regression was used to estimate the associations between the socio-behavioral factors (age, residence, employment status, functional disability status, current tobacco use, problem drinking, physical activity, sedentary behavior, perceived body weight, and various dietary behaviors) and daily soft drink, sweetened fruit juice, and SSB consumption, separately. Variables significant (P<0.05) in bivariate analysis with any of the three outcome variables (daily soft drink, sweetened fruit juice, and SSB consumption) were included in the final model. Missing data were excluded from the analysis. P<0.05 was considered significant.
Results
Sample characteristics
Overall, the study participants consumed 33.9% none, 48.3% 1–3 times, 7.2% 4–6 times, and 10.6% every day soft drinks in the past week (or an equivalent of an average of 0.30 servings, SD=0.3, per day), 43.4% had consumed no sweetened fruit juice, 42.3% 1–3 times, 5.2% 4–6 times, and 9.1% daily sweetened fruit juice (or an equivalent of an average of 0.25 servings, SD=0.3, per day). The prevalence of daily SSB (soft drink and/or sweetened fruit juice) consumption was 16.0% (or an equivalent of an average of 0.54 servings, SD=0.5, per day). Among the nine South African provinces, the lowest prevalence of daily SB was found in the Eastern Cape (9.3%), and the highest prevalence in Gauteng province (24.5%). No significant gender and racial or ethnic or population group differences were found regarding daily soft drink, sweetened fruit juice, and SSB consumption (see Table 1).
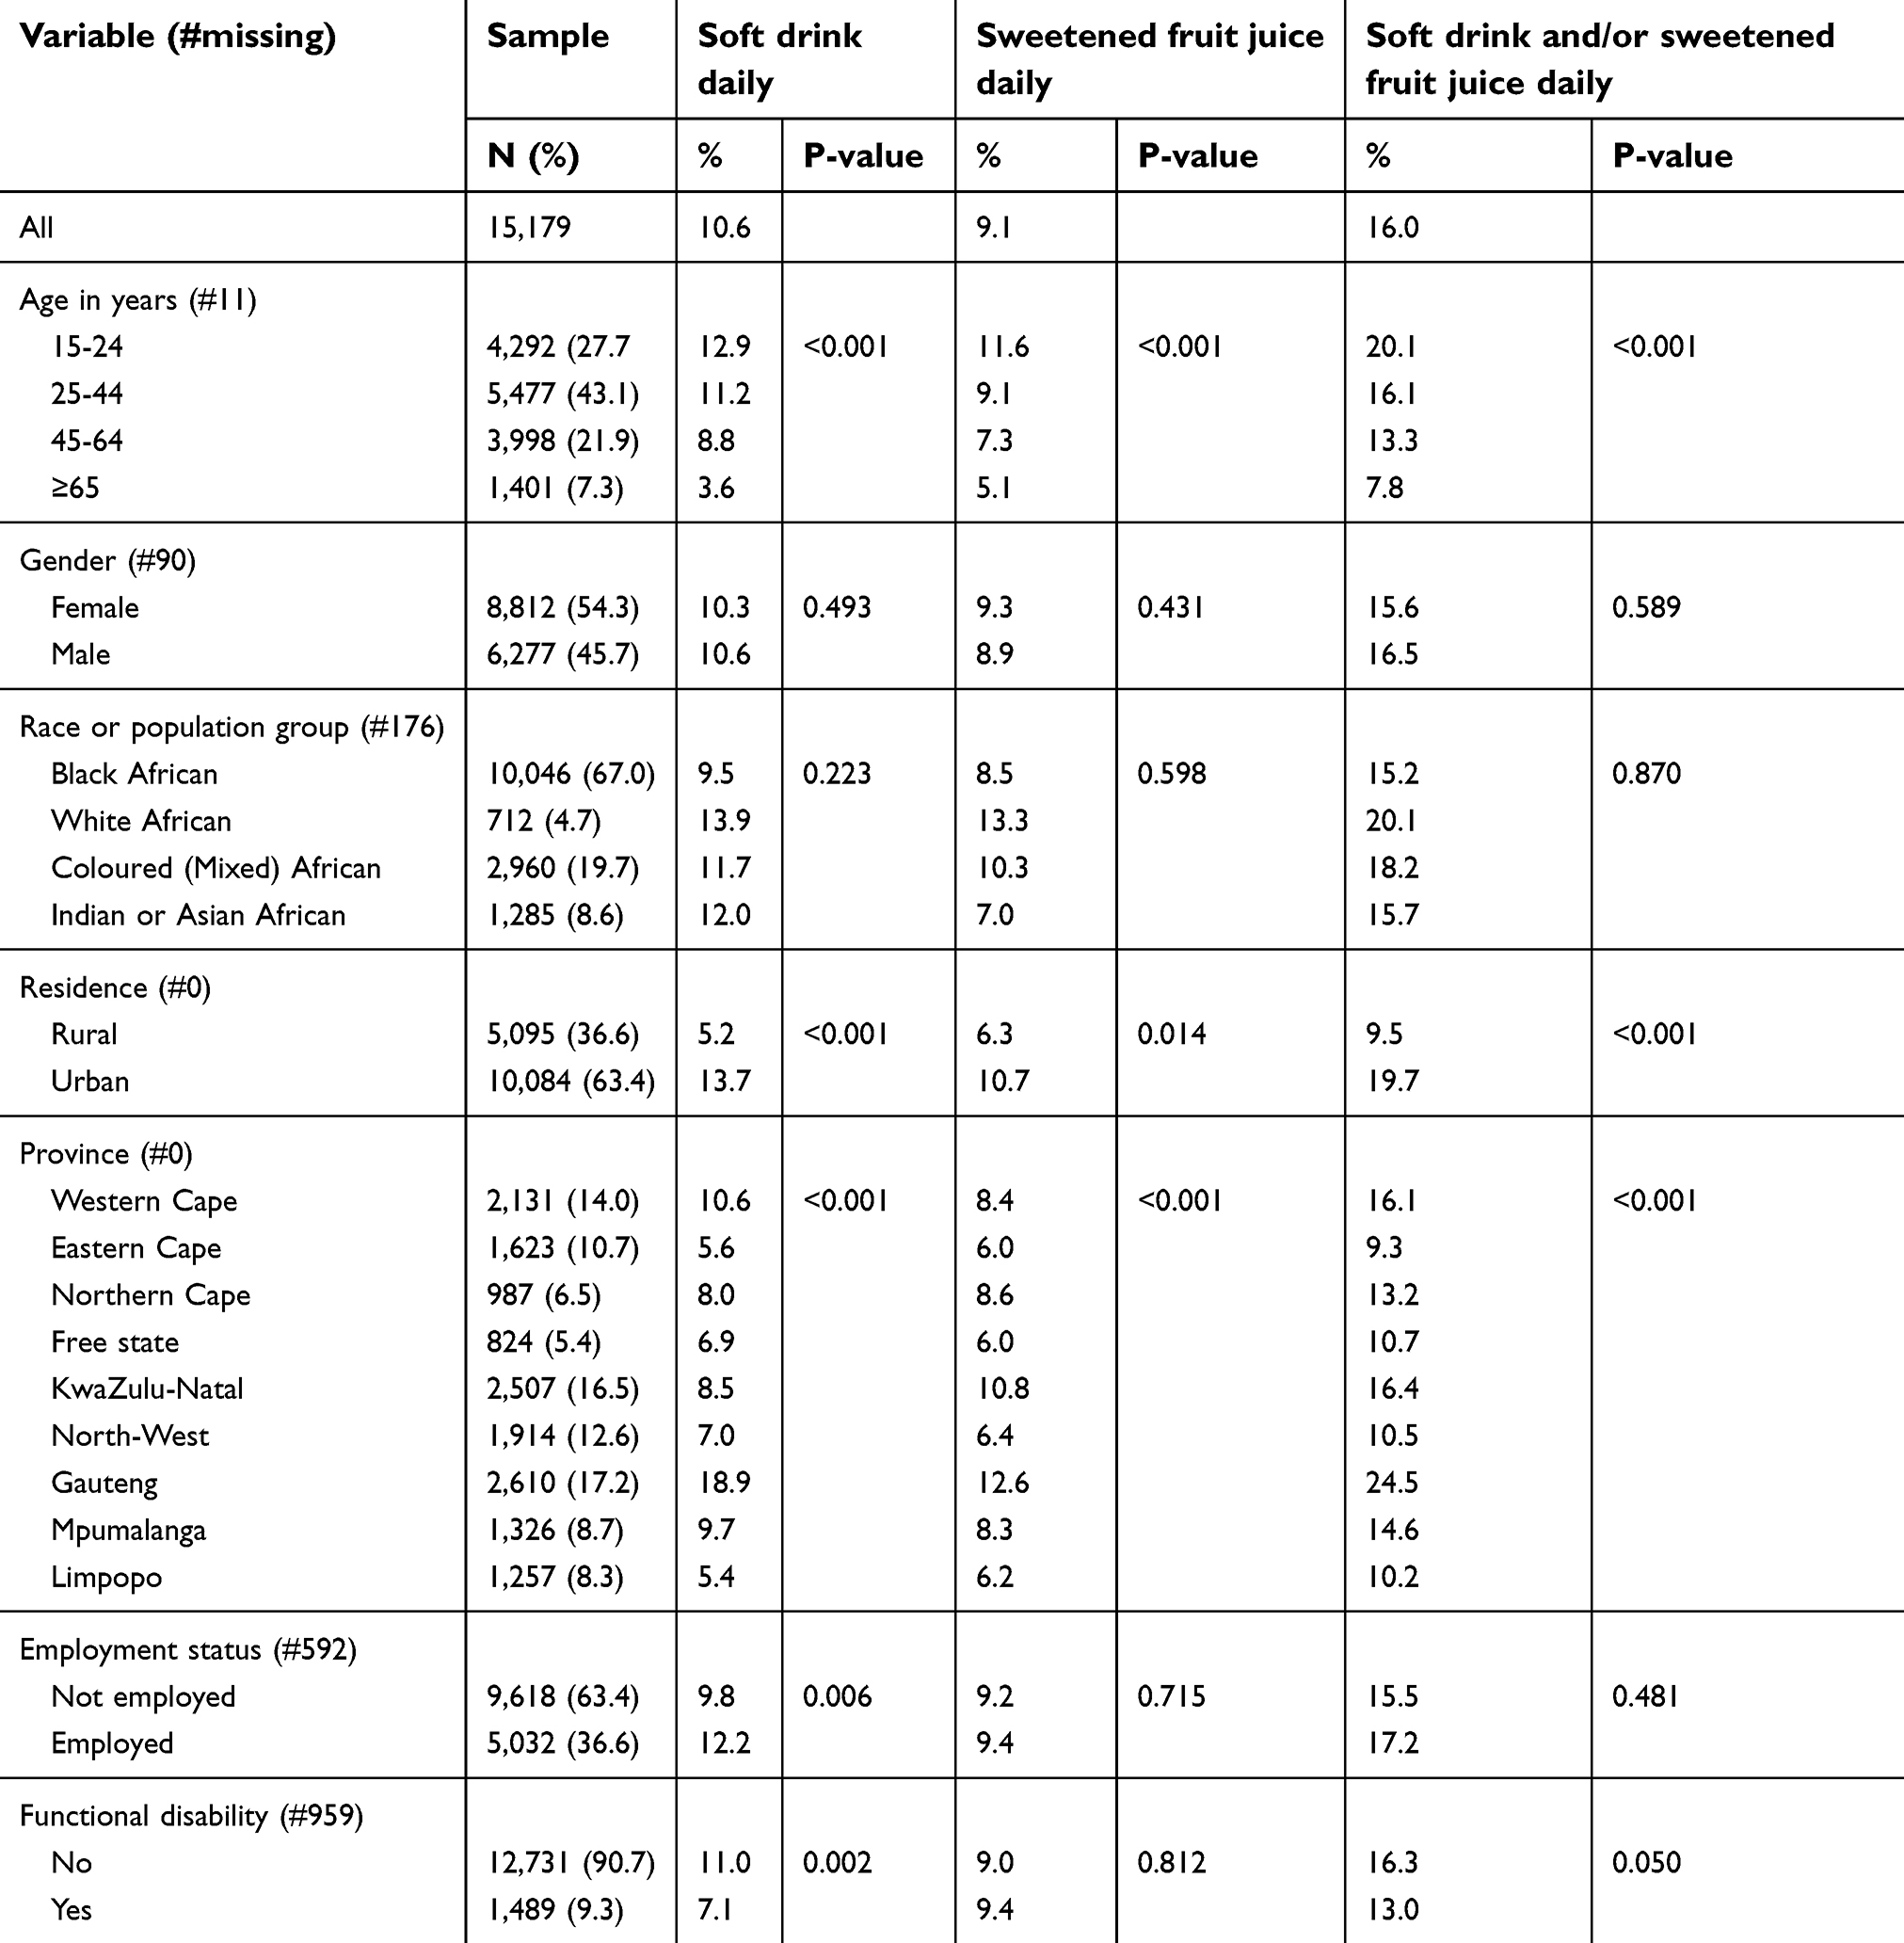 | Table 1 Sociodemographic sample characteristics among 15 years and older persons in the South African National Health and Nutrition Examination Survey, 2012 |
Table 2 describes the behavioral sample characteristics in relation to daily soft drink, sweetened fruit juice, and SSB consumption. A minority (15.3%) perceived themselves as overweight, and 11.9% had tried to lose weight in the past 12 months. The latter did not significantly differ regarding daily soft drink, sweetened fruit juice, and SSB consumption (see Table 2).
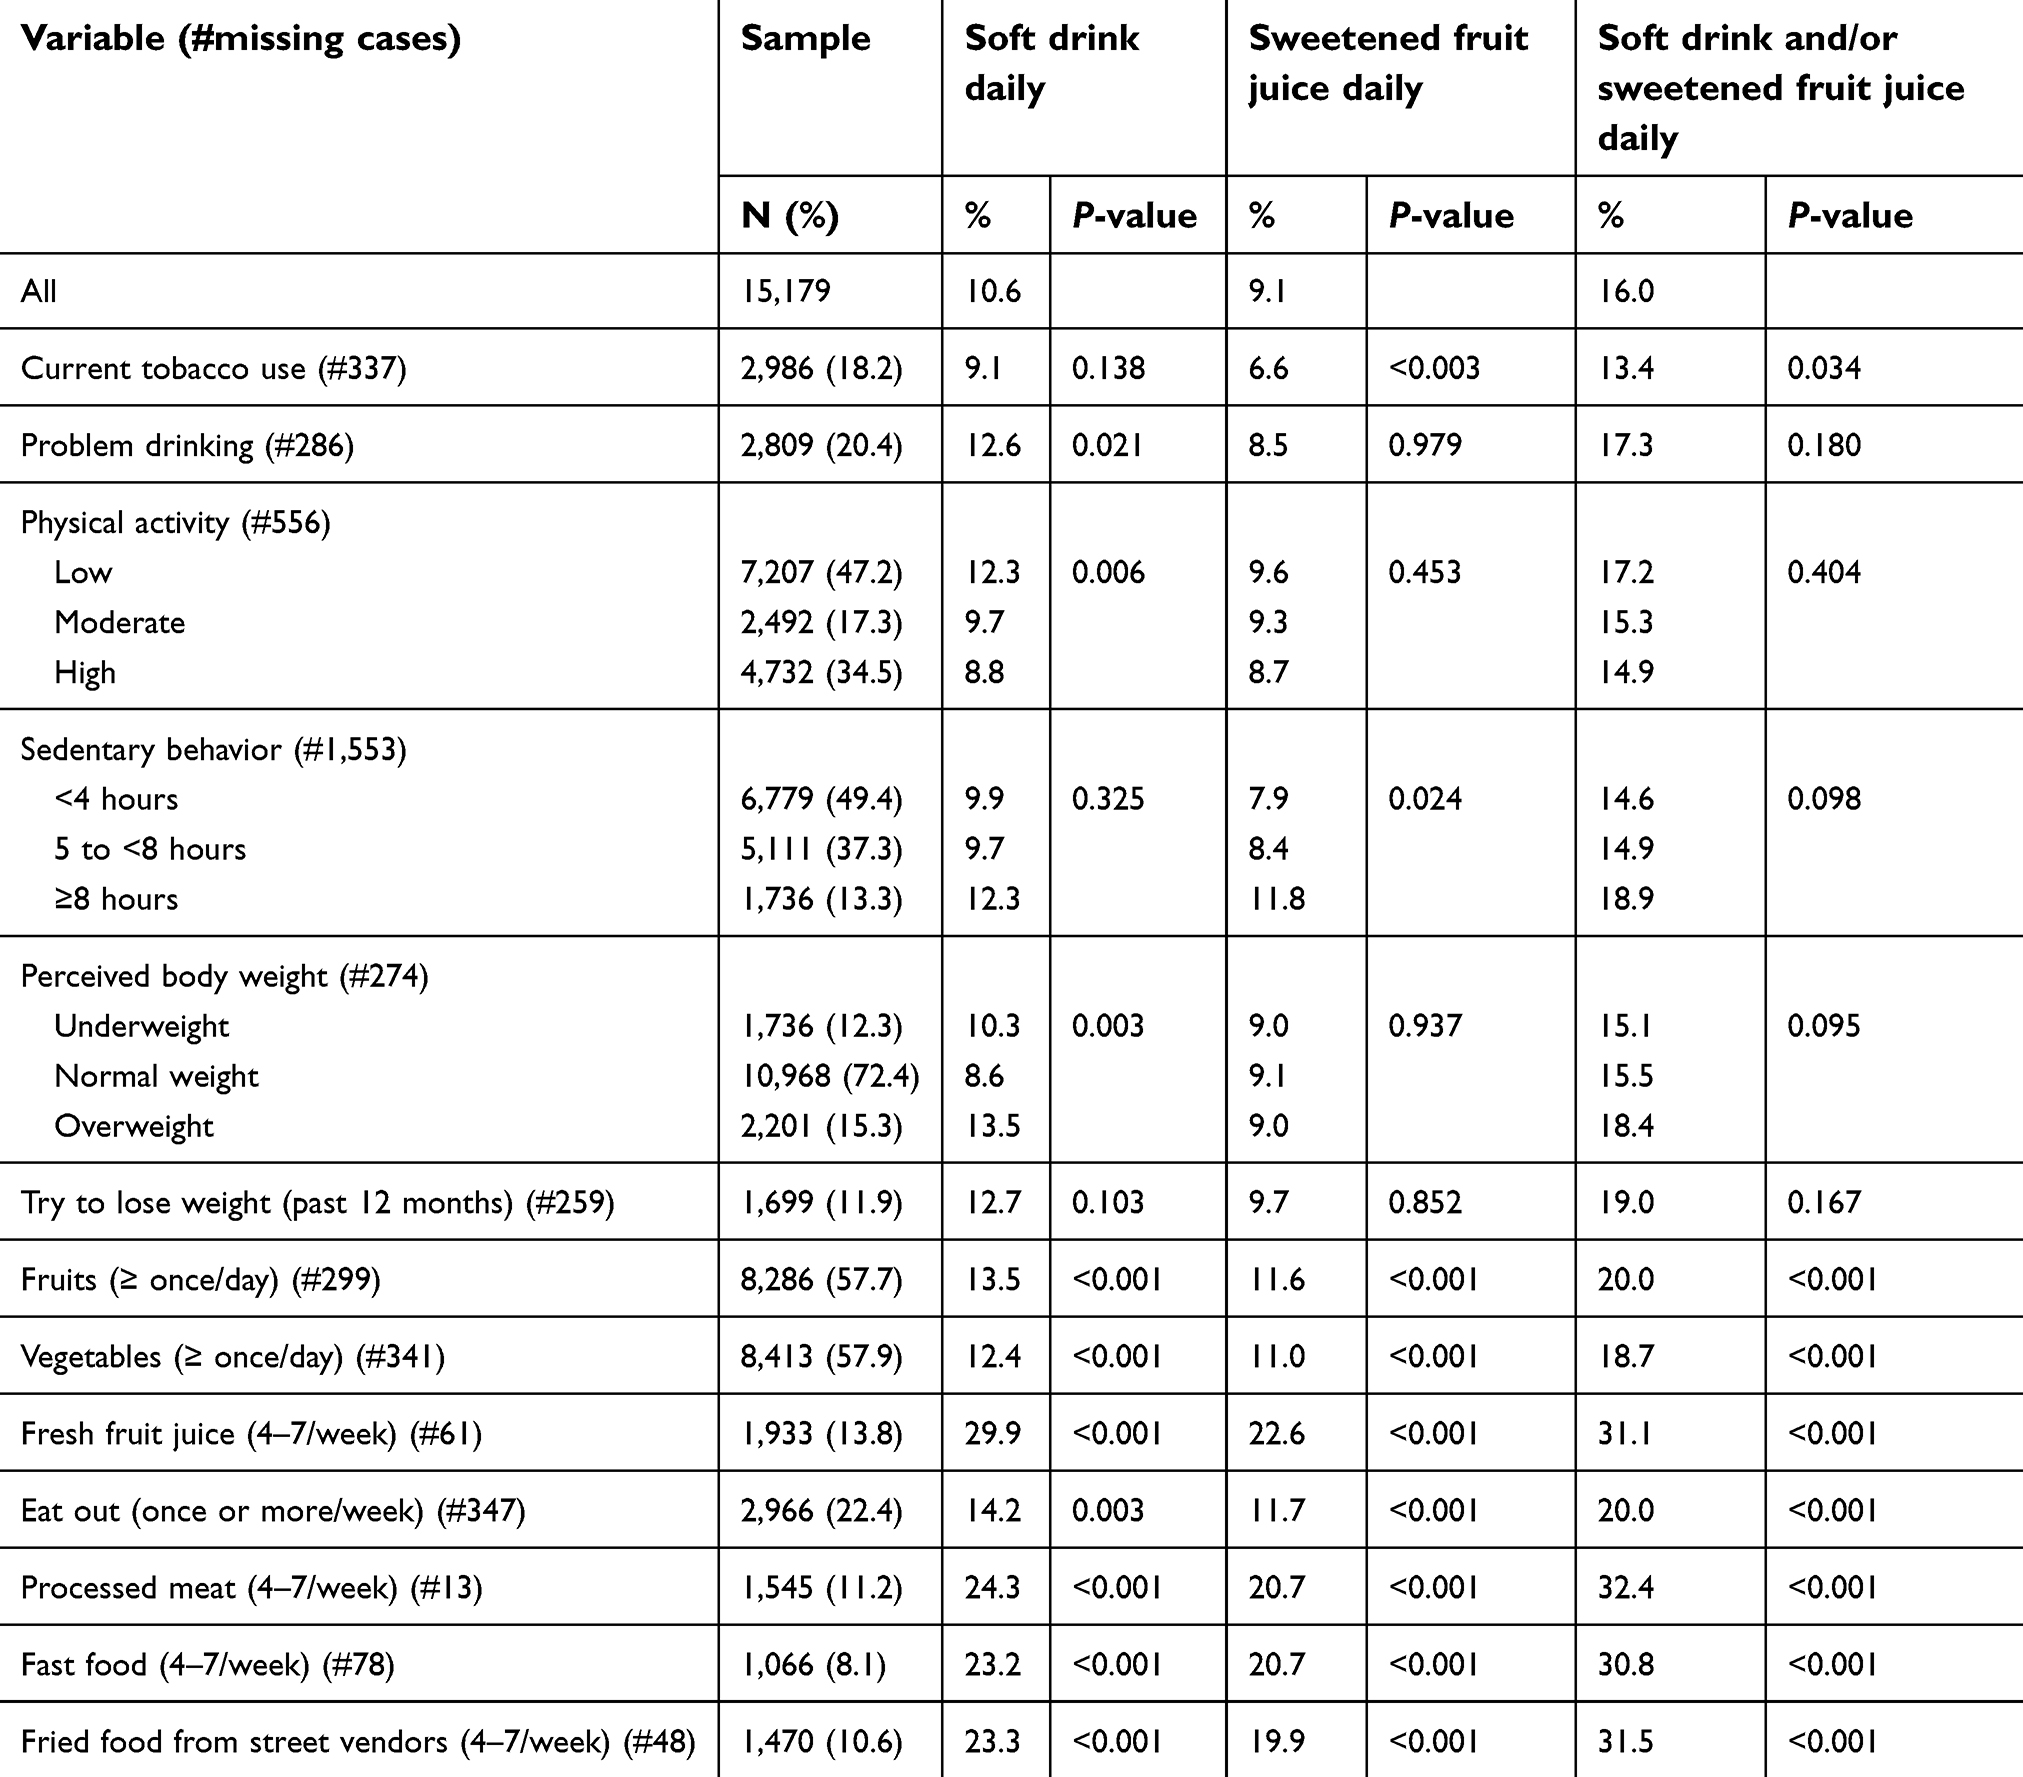 | Table 2 Behavioral factors sample characteristics among 15 years and older persons in the South African National Health and Nutrition Examination Survey, 2012 |
Associations with daily soft drink consumption, daily sweetened fruit juice, and daily soft drinks and/or sweetened fruit juice
In the adjusted logistic regression models, both younger age and urban residence significantly increased the odds for daily soft drink, sweetened fruit juice, and SSB consumption. While problem drinking and physical inactivity increased the odds for daily soft drink use, higher sedentary behavior was associated with daily sweetened fruit juice consumption. Perceived overweight status was positively associated with soft drink and SSB consumption. Some healthy dietary behaviors (fruit and fresh fruit juice consumption) were positively associated with daily soft drink, sweetened fruit juice, and SSB consumption, while unhealthy dietary behaviors (consumption of processed meat and fried food from street vendors) were positively associated with daily soft drink, sweetened fruit juice, and SSB consumption (see Table 3).
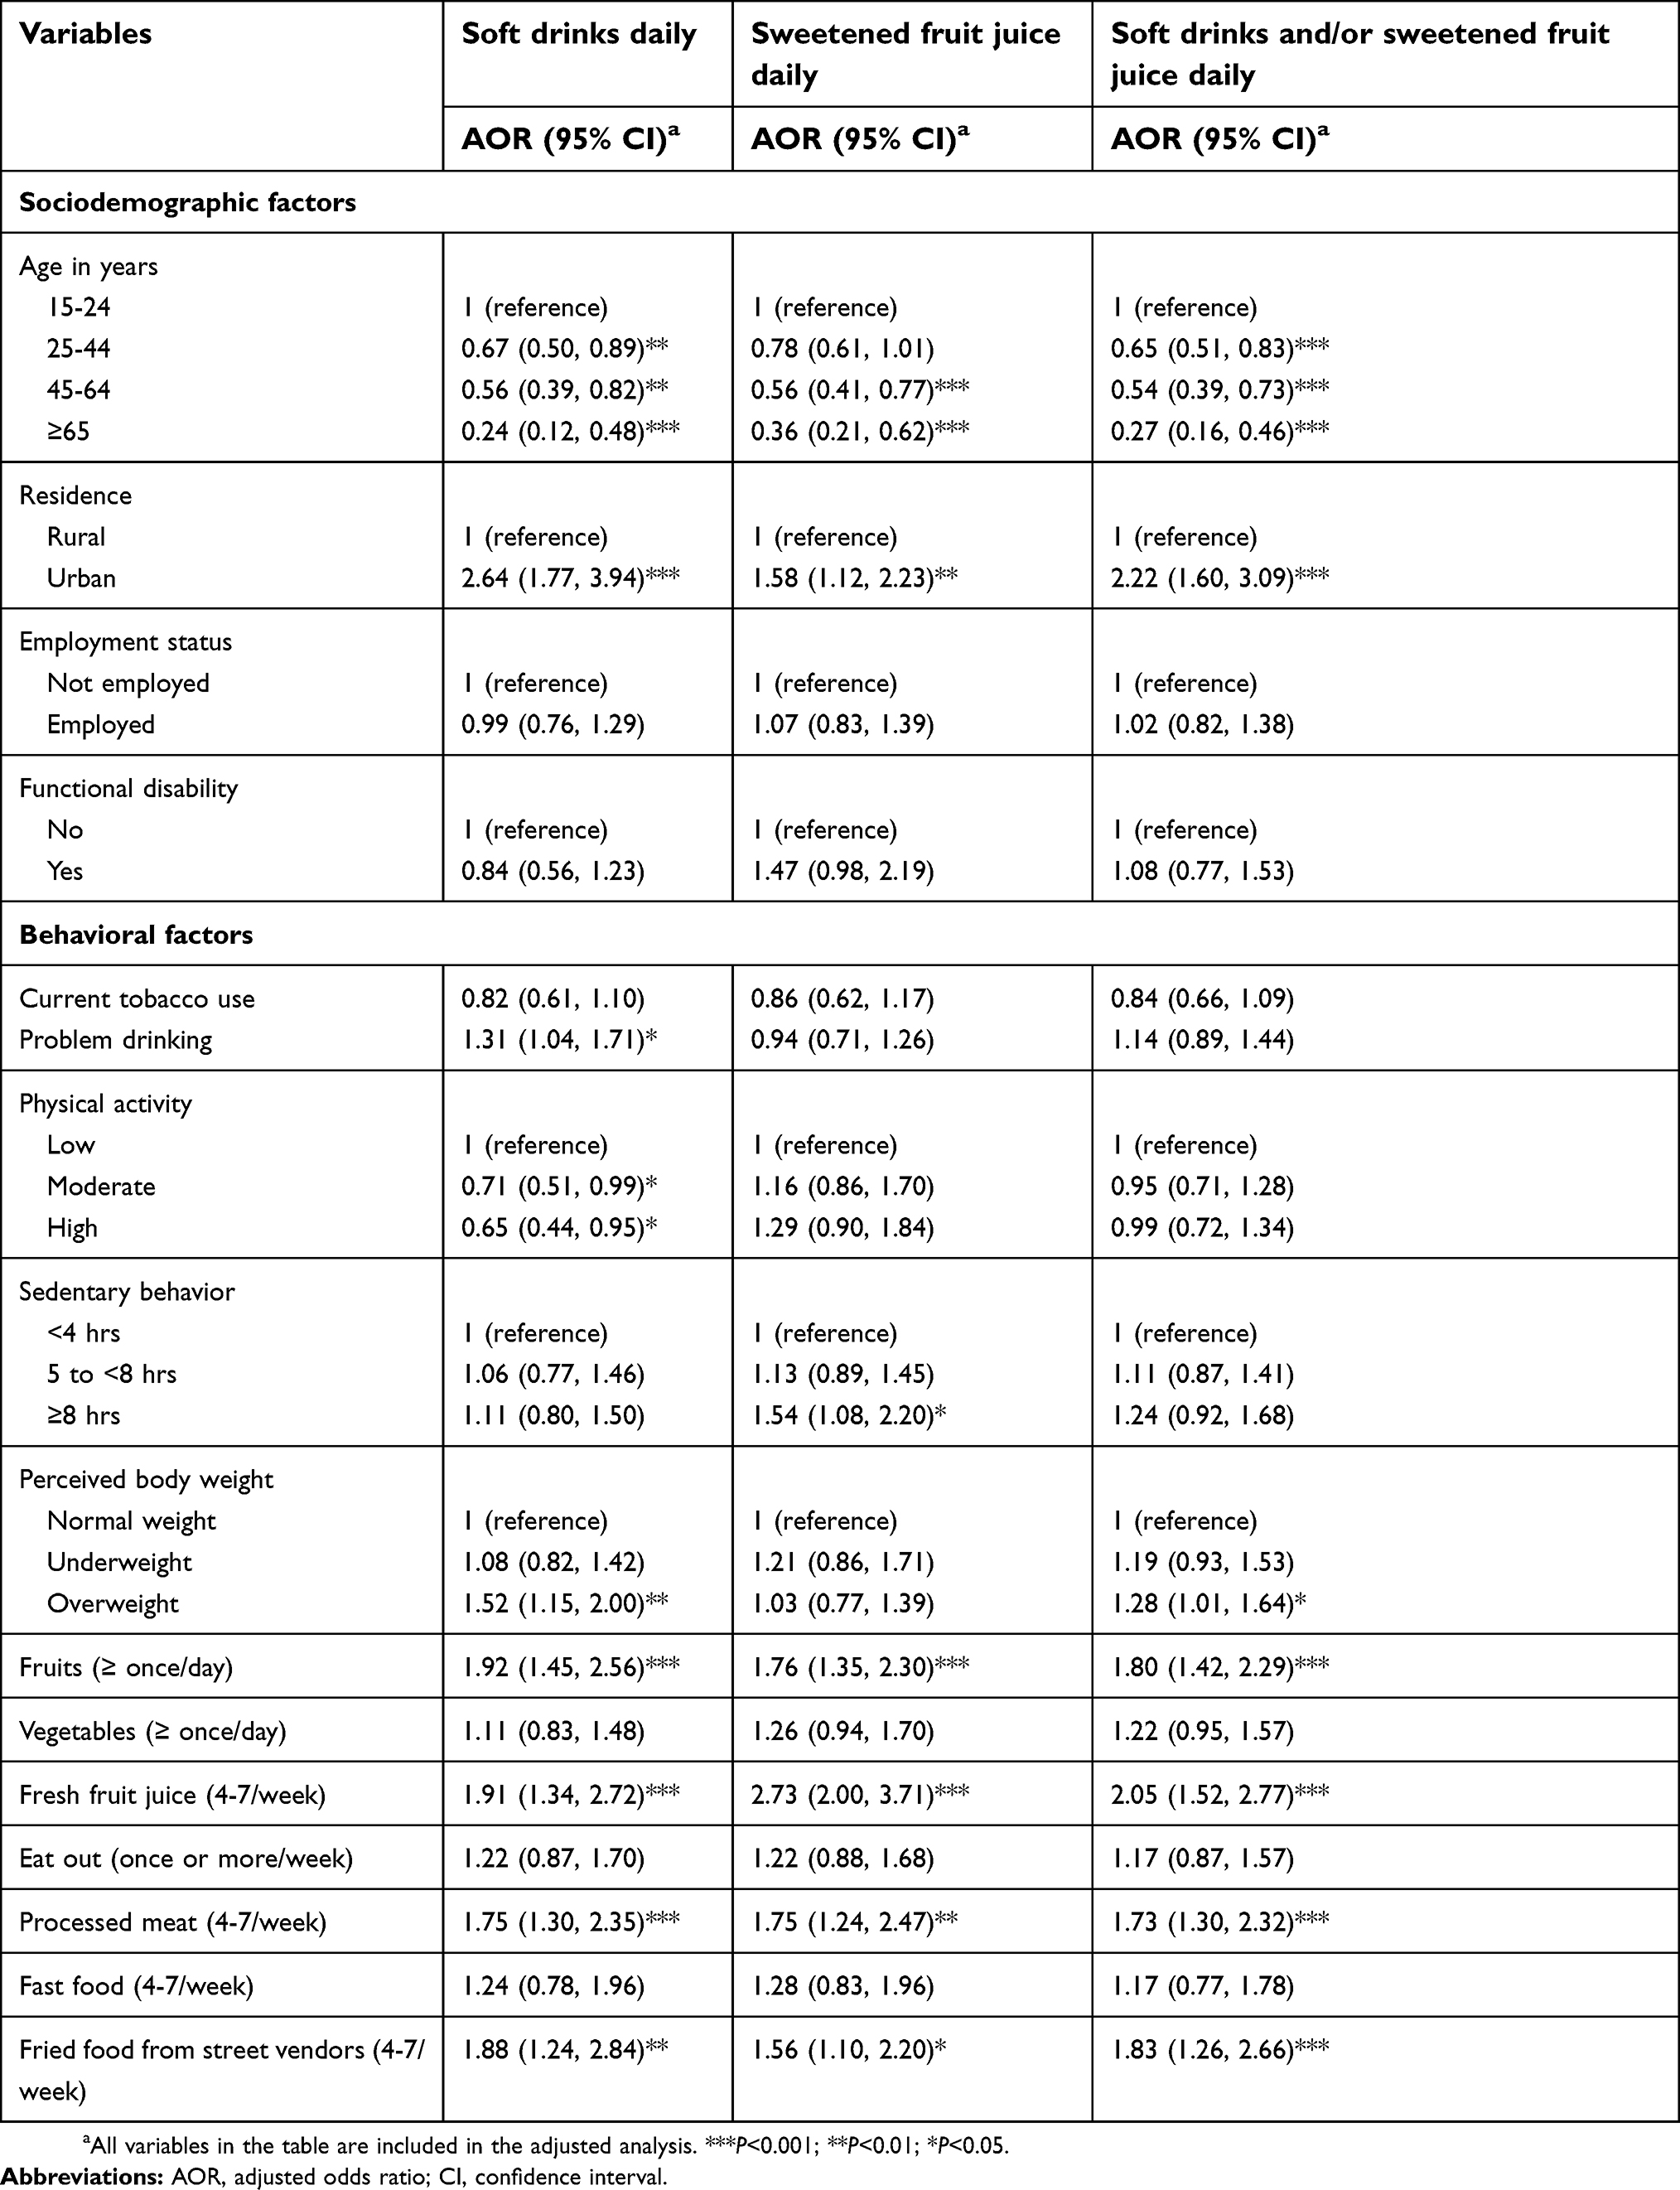 | Table 3 Associations with daily soft drink consumption, daily sweetened fruit juice and daily soft drinks, and/or sweetened fruit juice |
Discussion
The study focused on studying the frequency of SSB consumption and its relationship with socio-behavioral factors using a large national community sample of individuals (15 years and older) in South Africa. The prevalence of daily SSB (soft drink and/or sweetened fruit juice) consumption found in this study was 16.0% (or an equivalent of an average of 0.54 servings). This finding is probably similar to the global mean consumption of 0.58 servings/day of SSBs and that of lower-middle income countries (0.59 servings/day), but lower than in upper-middle income countries (0.80 servings/day).11 Daily SSB consumption in this study was higher than in China,12 similar to Brazil13 and the UK,17 but lower than in different studies in the US.14–16
Consistent with a number of previous studies,14,15,17,19,20 this study found that the younger age group (15–24 year-olds) and those living in urban areas had higher odds for daily SSB consumption than older age groups and those residing in rural areas. Among the nine different provinces in South Africa, the highest prevalence of daily SSB consumption was found in Gauteng province. This finding may be related to the high urbanization level in Gauteng province.30 One possible explanation for the higher SSB consumption among the youth (15–24 year-olds), compared to older individuals in this study, may be related to higher exposure to SSB advertising, taste preference, and popularity among young people.19 In a study in urban Soweto, South Africa, marketing of SSBs were common in and near schools.31 While several previous studies found a male preponderance and ethnic differences in daily SSB consumption,13,14,17–19 this study did not find any significant gender and population group or ethnic differences. This study also did not find significant differences in the prevalence of daily SSB consumption regarding employment status (as a proxy of socioeconomic status), while other studies12,14,17 found an association between lower socioeconomic status and SSB consumption. These findings may support the idea that SSB consumption is pervasive across gender and ethnic groups in South Africa. Contrary to a previous study,21 this study did not find an association between functional disability status and SBB.
This study found an association between physical inactivity and daily soft drink consumption, and sedentary behavior with sweetened fruit juice consumption. These results are consistent with previous studies.15,19,32 While some previous studies13,15,19 found an association between substance use (smokers) and SSB consumption, this study found a positive association between problem drinking and soft drink consumption and in bivariate analysis a negative association between tobacco use and SSB consumption. It is possible that problem drinking, physical inactivity, and sedentary behavior are markers of unhealthy behaviors leading to poorer dietary behavior.19
Consistent with previous studies on measured body weight,17,20 this study found an association between perceived overweight and SSB, in particular, soft drink consumption. This result may confirm the association between SSB consumption and increased intake of energy and overweight or obesity.2 In agreement with some other investigations,13,17,19 this study found an association between unhealthy food consumption (processed meat, fried food from street vendors, but not fast food) and daily SSB consumption. All these findings seem to confirm that persons who consume SSB are more likely to engage in various unhealthy behaviors, including problem drinking, physical inactivity, sedentary behavior, and unhealthy food consumption.15,33 However, contrary to some previous studies,13,15 this study did not find that fresh fruit juice (no sugar added) and fruit consumption were protective from daily SSB use. More research is needed to explore the found relationship between fruit or fruit juice and SSB.
Study strength and limitations
The large national sample size of the study population provided adequate statistical precision of estimates. A limitation was that the study was cross-sectional and no causative conclusions can be drawn. The size of the unit of SSB consumed, the consumption of other specific SSB, such as energy drinks and sweetened tea, were not assessed and should be measured in future studies. Seasonality could have influenced SSB consumption, but since data for this survey were not collected during the major holiday period (December and January) in South Africa, we believe seasonality played a lessor role in the prevalence of SSB consumption pattern. Data on exposure to SSBs advertising, availability, and affordability were not assessed, and should be included in future investigations.
Conclusions
The study found a high prevalence of daily SSB consumption and identified several socio-behavioral factors, such as younger age, urban residence, perceived overweight, physical inactivity, sedentary behavior, and unhealthy food consumption that can be targeted in public health intervention programs in South Africa.
Data availability
The SANHANES-I data are available at
Acknowledgments
The following data sources and organizations are acknowledged: Human Sciences Research Council. South African National Health and Nutrition Examination Survey (SANHANES-1) 2011-12: Adult Questionnaire – All Provinces. [Data set]. SANHANES 2011-12 Adult Questionnaire. Version 1.0. Pretoria South Africa: Human Sciences Research Council [producer] 2012, Human Sciences Research Council [distributor] 2017.
Disclosure
The authors report no conflicts of interest in this work.
References
1. Basu S, McKee M, Galea G, Stuckler D. Relationship of soft drink consumption to global overweight, obesity, and diabetes: a cross-national analysis of 75 countries. Am J Public Health. 2013;103(11):2071–2077. doi:10.2105/AJPH.2012.300974
2. Vartanian LR, Schwartz MB, Brownell KD. Effects of soft drink consumption on nutrition and health: a systematic review and meta-analysis. Am J Public Health. 2007;97(4):667–675. doi:10.2105/AJPH.2005.083782
3. Imamura F, O’Connor L, Ye Z, et al. Consumption of sugar sweetened beverages, artificially sweetened beverages, and fruit juice and incidence of type 2 diabetes: systematic review, meta-analysis, and estimation of population attributable fraction. Bmj. 2015;351:h3576. doi:10.1136/bmj.h3576
4. Narain A, Kwok CS, Mamas MA. Soft drink intake and the risk of metabolic syndrome: A systematic review and meta-analysis. Int J Clin Pract. 2017;71(2):e12927. doi:10.1111/ijcp.12927
5. Shi Z, Ruel G, Dal Grande E, Pilkington R, Taylor AW. Soft drink consumption and multimorbidity among adults. Clin Nutr ESPEN. 2015;10(2):e71–e76. doi:10.1016/j.clnesp.2015.01.001
6. Shi Z, Taylor AW, Wittert G, Goldney R, Gill TK. Soft drink consumption and mental health problems among adults in Australia. Public Health Nutr. 2010;13(7):1073–1079. doi:10.1017/S1368980009993132
7. Igumbor EU, Sanders D, Puoane TR, et al. “Big food,” the consumer food environment, health, and the policy response in South Africa. PLoS Med. 2012;9(7):e1001253. doi:10.1371/journal.pmed.1001253
8. Ronquest-Ross L-C, Vink N, Sigge GO. Food consumption changes in South Africa since 1994. S Afr J Sci. 2015;111(9/10):
9.
10. Arthur R South Africa introduces sugar tax; 2018. Available from:
11. Singh GM, Micha R, Khatibzadeh S, et al.;
12. Guo H, Zhao L, Xu X, Yu W, Ju L, Yu D. Consumption of sugar-sweetened beverages among 18 years old and over adults in 2010–2012 in China. Wei Sheng Yan Jiu. 2018;47(1):22–26.
13. Rombaldi AJ, Neutzling MB, Silva MC, Azevedo MR, Hallal PC. Factors associated with regular non-diet soft drink intake among adults in Pelotas, Southern Brazil. Rev Saude Publica. 2011;45(2):382–390.
14. Mendy VL, Vargas R, Payton M, Cannon-Smith G. Association between consumption of sugar-sweetened beverages and sociodemographic characteristics among mississippi Adults. Prev Chronic Dis. 2017;14:E137. doi:10.5888/pcd14.170268
15. Park S, Pan L, Sherry B, Blanck HM. Consumption of sugar-sweetened beverages among US adults in 6 states: behavioral risk factor surveillance system, 2011. Prev Chronic Dis. 2014;11:E65. doi:10.5888/pcd11.130304
16. Kumar GS, Pan L, Park S, Lee-Kwan SH, Onufrak S, Blanck HM. Centers for disease control and prevention. Sugar-sweetened beverage consumption among adults – 18 states, 2012. MMWR Morb Mortal Wkly Rep. 2014;63(32):686–690.
17. Barrett P, Imamura F, Brage S, Griffin SJ, Wareham NJ, Forouhi NG. Sociodemographic, lifestyle and behavioural factors associated with consumption of sweetened beverages among adults in Cambridgeshire, UK: the Fenland study. Public Health Nutr. 2017;20(15):2766–2777. doi:10.1017/S136898001700177X
18. Sudo N, Sekiyama M, Watanabe C, Bokul AT, Ohtsuka R. Gender differences in food and energy intake among adult villagers in northwestern Bangladesh: a food frequency questionnaire survey. Int J Food Sci Nutr. 2004;55(6):499–509.
19. Qobadi M, Payton M. Consumption of sugar-sweetened beverages in mississippi: is there a disparity? Behavioral risk factor surveillance system, 2012. Int J Environ Res Public Health. 2017;14(3):
20. French S, Rosenberg M, Wood L, et al. Soft drink consumption patterns among Western Australians. J Nutr Educ Behav. 2013;45(6):525–532. doi:10.1016/j.jneb.2013.03.010
21. Kim S, Park S, Carroll DD, Okoro CA. Daily sugar-sweetened beverage consumption, by disability status, among adults in 23 states and the district of Columbia. Prev Chronic Dis. 2017;14:E132. doi:10.5888/pcd14.160606
22. Shisana O, Labadarios D, Rehle T, et al. South African National Health and Nutrition Examination Survey (SANHANES-1). Cape Town: Human Sciences Research Council Press; 2013.
23. Peltzer K, Pengpid S. Prevalence, social and health correlates of insomnia among persons 15 years and older in South Africa. South Afr J Psychol. 2018. doi:10.1177/0081246318818623
24. Üstün T, Kostanjsek N, Chatterji S, Rehm J. Measuring Health and Disability: Manual for WHO Disability Assessment Schedule (WHODAS 2.0). Geneva, Switzerland: World Health Organization; 2010.
25. Bush K, Kivlahan DR, McDonell MB, Fihn SD, Bradley KA. The audit alcohol consumption questions (AUDIT-C), an effective brief screening test for problem drinking. Arch Intern Med. 1998;158(16):1789–1795.
26. Armstrong T, Bull F. Development of the World Health Organization Global Physical Activity Questionnaire (GPAQ). J Public Health. 2006;14:66–70. doi:10.1007/s10389-006-0024-x
27.
28. Prince SA, LeBlanc AG, Colley RC, Saunders TJ. Measurement of sedentary behaviour in population health surveys: a review and recommendations. PeerJ. 2017;5:e4130. eCollection 2017. doi:10.7717/peerj.4130.
29. Ekelund U, Steene-Johannessen J, Brown WJ, et al. Does physical activity attenuate, or even eliminate, the detrimental association of sitting time with mortality? A harmonised meta-analysis of data from more than 1 million men and women. Lancet. 2016;388(10051):1302–1310. doi:10.1016/S0140-6736(16)30370-1
30. Kok P, Collinson M Migration and urbanization in South Africa Report 03-04-02. Pretoria: Statistics South Africa; 2006.
31. Moodley G, Christofides N, Norris SA, Achia T, Hofman KJ. Obesogenic environments: access to and advertising of sugar-sweetened beverages in Soweto, South Africa, 2013. Prev Chronic Dis. 2015;E186. doi:10.5888/pcd12.140559
32. Moubarac JC, Receveur O, Cargo M, Daniel M. Consumption patterns of sweetened food and drink products in a Catholic Middle Eastern Canadian community. Public Health Nutr. 2014;17(2):471–478. doi:10.1017/S1368980012005460
33. Mullie P, Aerenhouts D, Clarys P. Demographic, socioeconomic and nutritional determinants of daily versus non-daily sugar-sweetened and artificially sweetened beverage consumption. Eur J Clin Nutr. 2012;66(2):150–155. doi:10.1038/ejcn.2011.138
 © 2019 The Author(s). This work is published and licensed by Dove Medical Press Limited. The full terms of this license are available at https://www.dovepress.com/terms.php and incorporate the Creative Commons Attribution - Non Commercial (unported, v3.0) License.
By accessing the work you hereby accept the Terms. Non-commercial uses of the work are permitted without any further permission from Dove Medical Press Limited, provided the work is properly attributed. For permission for commercial use of this work, please see paragraphs 4.2 and 5 of our Terms.
© 2019 The Author(s). This work is published and licensed by Dove Medical Press Limited. The full terms of this license are available at https://www.dovepress.com/terms.php and incorporate the Creative Commons Attribution - Non Commercial (unported, v3.0) License.
By accessing the work you hereby accept the Terms. Non-commercial uses of the work are permitted without any further permission from Dove Medical Press Limited, provided the work is properly attributed. For permission for commercial use of this work, please see paragraphs 4.2 and 5 of our Terms.