
Back to Journals » Clinical Epidemiology » Volume 18
Prevalence and Incidence of Treatment-Range Adolescent Idiopathic Scoliosis Diagnosed in Ontario Between 2012 and 2021: Validating a Population-Based Health Administrative Algorithm for Case Identification in Youth Aged 10–17 Years
Authors Dermott JA  , To T, Jaakkimainen L, Bouchard M, Howard A, Lebel DE
Received 31 October 2025
Accepted for publication 16 February 2026
Published 19 March 2026 Volume 2026:18 578144
DOI https://doi.org/10.2147/CLEP.S578144
Checked for plagiarism Yes
Review by Single anonymous peer review
Peer reviewer comments 4
Editor who approved publication: Professor Henrik Toft Sørensen
Jennifer A Dermott,1– 3 Teresa To,2,4– 6 Liisa Jaakkimainen,6– 8 Maryse Bouchard,1,2 Andrew Howard,1,2,4,6 David E Lebel1,2
1Division of Orthopaedic Surgery, The Hospital for Sick Children, Toronto, ON, Canada; 2Institute of Medical Science, University of Toronto, Toronto, ON, Canada; 3Department of Physical Therapy, University of Toronto, Toronto, ON, Canada; 4Child Health Evaluative Sciences, SickKids Research Institute, Toronto, ON, Canada; 5Dalla Lana School of Public Health, University of Toronto, Toronto, ON, Canada; 6ICES, Toronto, ON, Canada; 7Department of Family and Community Medicine, University of Toronto, Toronto, ON, Canada; 8Institute of Health Policy, Management and Evaluation, University of Toronto, Toronto, ON, Canada
Correspondence: Jennifer A Dermott, Division of Orthopaedic Surgery, The Hospital for Sick Children, 555 University Avenue, Toronto, ON, M5G 1X8, Canada, Tel +1 416 813 7654, x4853, Fax +1 416 813 6414, Email [email protected]
Purpose: The purpose of this study is to estimate the prevalence and incidence of treatment-range adolescent idiopathic scoliosis (≥ 20°) over 10-years in Ontario youth 10– 17 years of age, by validating a population-based health administrative data algorithm for case ascertainment.
Patients and Methods: Algorithms were developed using a combination of health administrative data: diagnostic, fee and/or specialty codes from physician billing data over various look-back periods. Algorithms’ ability to distinguish between youth with scoliosis, confirmed by a tertiary-care spine specialist (AIS+; n = 2732), and a provincially derived comparator group without (AIS-; n = 49,049) were evaluated using sensitivity, specificity, positive and negative predictive values with their 95% confidence intervals. The top performing algorithm was used to estimate sex- and age-standardized prevalence and incidence between 2012 and 21. Annual rate ratios were calculated using a negative binomial regression model, adjusted for age, sex, and age–sex interaction. Significance was accepted at p < 0.05.
Results: The AIS+ cohort had a median curve magnitude of 35° (interquartile range: 25.5– 45.5). Of the 93 algorithms tested, the top was “ 2 physician billing codes for scoliosis in 2 years” with sensitivity: 83.1% (95% CI, 81.6– 84.5%), specificity: 99.3% (95% CI, 99.2– 99.3%), positive predictive value: 86.3% (95% CI, 85.0– 87.6%), negative predictive value: 99.1% (95% CI, 99.0– 99.1%). Annual prevalence estimates averaged 513.3/100 000 and incidence 128.2/100 000. There was a modest annual increase in the adjusted rate ratios: 1% for prevalence, 2% for incidence. Rates were highest for females at 13-years and males at 15-years of age, with rates 65% lower for males.
Conclusion: The selected health administrative data algorithm demonstrated excellent diagnostic accuracy in identifying radiographically confirmed, treatment-range adolescent idiopathic scoliosis in 10– 17-year-old youth. This is an efficient and scalable method for clinically meaningful population-level cohort creation that will facilitate surveillance of scoliosis diagnostic and treatment trends and longitudinal outcome research.
Keywords: epidemiology, validation study, routinely collected health data, diagnosis
Introduction
Adolescent idiopathic scoliosis (AIS) accounts for approximately 80% of all scoliosis diagnoses, developing after the age of 10 years with no identifiable underlying etiology. Published scoliosis prevalence estimates range from 0.47% to 5.2%1 although prevalence rates as high as 24.3% have been reported.2 Over 140 scoliosis-related epidemiological studies have been published since 1955,3 but with great variability in the results and with several limitations that restrict generalizability.
Methodological differences, including inconsistent age and diagnostic criteria and homogenous study populations, contribute to the wide variation in reported prevalence. Over 95% of scoliosis epidemiology studies use resource-intense mass school screening initiatives to identify positive case counts.3 While most studies focus on identifying cases that have radiographic evidence of a curvature greater than 10°, some epidemiologic studies use greater than 5,4–6 or are based solely on trunk asymmetry detected on clinical examination with no radiographic confirmation of scoliosis.2,7,8 Alternatively, AIS epidemiology studies have relied on retrospective review of x-rays.3,9 These cross-sectional studies produce prevalence estimates but are expensive, time consuming, and do not allow for incidence estimates or longitudinal surveillance of disease burden over time. Moreover, the low threshold for inclusion challenges the use of such estimates for health resource planning as the case count is heavily comprised of mild curvatures less than 20,4,5,10–12 a group that are unlikely to require treatment.13 By contrast, estimating the burden of treatment-range AIS offers a more actionable basis to forecast referral volumes and planning health-system capacity. Estimating this burden is equally important from a health-economic standpoint, given the markedly higher costs of surgical versus non-surgical care14 and the implications for resource allocation.
Only recently has the use of health administrative data (HAD) been utilized in scoliosis-related epidemiology, primarily in an effort to estimate incidence.10,15,16 HAD variables are routinely collected at every patient interaction with the health system and include information related to physician visits, hospital encounters, and diagnostic services, for example, details such as diagnostic and fee codes, and physician specialty codes. Population-based HAD algorithms use a combination of such variables “that allow for identification of cases of a given disease without having to contact or examine the patient”.17 Validation assesses the accuracy of these algorithms to identify cases correctly. To date, health administrative data have primarily been used to flag potential AIS cases for subsequent individual-level validation, typically through chart-review or radiographic confirmation, before study inclusion. This approach has not yet led to a case ascertainment process that can readily be replicated for other research purposes; however, it has highlighted that radiographic confirmation produces far lower incidence estimates than those based on a single diagnostic code.15
The development and validation of algorithms using HAD has been successfully employed to estimate the prevalence and/or incidence of other health conditions in Ontario18–21 One of the benefits of a validated HAD algorithm is the speed at which a cohort can be assembled, allowing for epidemiological trends and long-term outcomes of chronic conditions to be more easily tracked. However, reliance on encounter-driven coding introduces the potential for misclassification, particularly if diagnostic codes are used inconsistently, used as rule-out labels, or applied prior to diagnostic confirmation. Algorithm validation against confirmed cases offers a scalable and reproducible approach for population-level case identification. This two-phase study aims to 1) validate HAD algorithms for the accurate case ascertainment of diagnosed, treatment-range AIS among 10–17-year-olds living in ON and 2) subsequently apply the top-performing algorithm to estimate prevalence and incidence trends over a ten-year period. This study tests the hypothesis that a HAD algorithm will demonstrate high diagnostic accuracy in identifying treatment-range AIS, resulting in clinically meaningful population estimates.
Materials and Methods
Overview
This validation study assessed the accuracy of HAD algorithms in correctly identifying treatment-range AIS, using a validation cohort of youth with a formal AIS diagnosis (AIS+) and those without (AIS- cases). Further validation of top performing algorithms included a sensitivity analysis using a sample of youth having had brace treatment and/or spinal fusion. Annual prevalence and incidence estimates were calculated from an AIS cohort derived from the optimal algorithm. This study was conducted in accordance with the Hospital for Sick Children (Protocol number: 1000076711) and University of Toronto (Protocol number: 00045385) Research Ethics Board-approved protocol. Given that the data collection was retrospective, the need for formal consent was waived by each board. The manuscript was prepared in conformity with the modified Standards for Reporting of Diagnostic accuracy (STARD) criteria, recommended for assessing the quality of validation studies of HAD (Supplemental Table 1).22
Setting
Ontario is the most populous province in Canada, having approximately 13.45 million residents, 1.22 million aged 10 up to 18 years.23 Ethnically diverse, 31.1% of residents are foreign born and 29.3% self-identify as a visible minority with the four largest visible minority groups making up 73.2% of that distribution: South Asian 29.6%, Chinese 19.4%, Black 16.2%, and Filipino 8%.
Canada has a universal healthcare system such that all hospital and physician services, including diagnostic imaging, are publicly funded for all legal residents. The routine administration of this system results in the collection of HAD at every interaction.
The AIS+ sample was identified at a pediatric tertiary care facility with a specialized spine clinic that provides approximately 3000 spine clinic visits annually, the largest volume of spine patients in the province. Triage criteria are intended to accept referrals for treatment-range scoliosis, generally considered approximately 20° or greater.
Population-Based Data Sources
ICES (formally the Institute for Clinical Evaluative Sciences) is an independent, non-profit organization tasked with housing and controlling access to the health records of all residents eligible for provincial health insurance (>99% of population).
ICES is funded by an annual grant from the Ontario Ministry of Health (MOH) and the Ministry of Long-term Care (MLTC). As a prescribed entity under Ontario’s privacy legislation, ICES is authorized to collect and use health care data for the purposes of health system analysis, evaluation, and decision support. Secure access to these data is governed by policies and procedures that are approved by the Information and Privacy Commissioner of Ontario.
The specific data holdings, and how they were used in this study, are detailed in Supplemental Table 2. These datasets were linked using unique encoded identifiers and analyzed at ICES.
Establishing Validation Cohorts
Validation cohorts were consecutive series, comprised of youth 10–17 years of age, identified from HAD records from 2014 to 2021.
The primary validation cohort included AIS+ and AIS- samples (Figure 1). Identification of the AIS+ sample (n = 2732) used hospital administrative records. Eligible patients were seen for initial spine consultation during the study period, diagnosed with AIS, and had radiographic confirmation of a coronal curve magnitude >10. Those with non-idiopathic etiology were excluded as were those living outside the province, and/or ineligible or eligible for <1 year for provincial health insurance. Each patient’s electronic medical record was reviewed by the first author (JD) to confirm eligibility, and curve magnitude of the largest curve was recorded. Establishing the AIS+ cohort from radiographically confirmed cases within a specialized spine clinic enhanced reference standard clinical validity and ensured evaluation against treatment-range AIS.
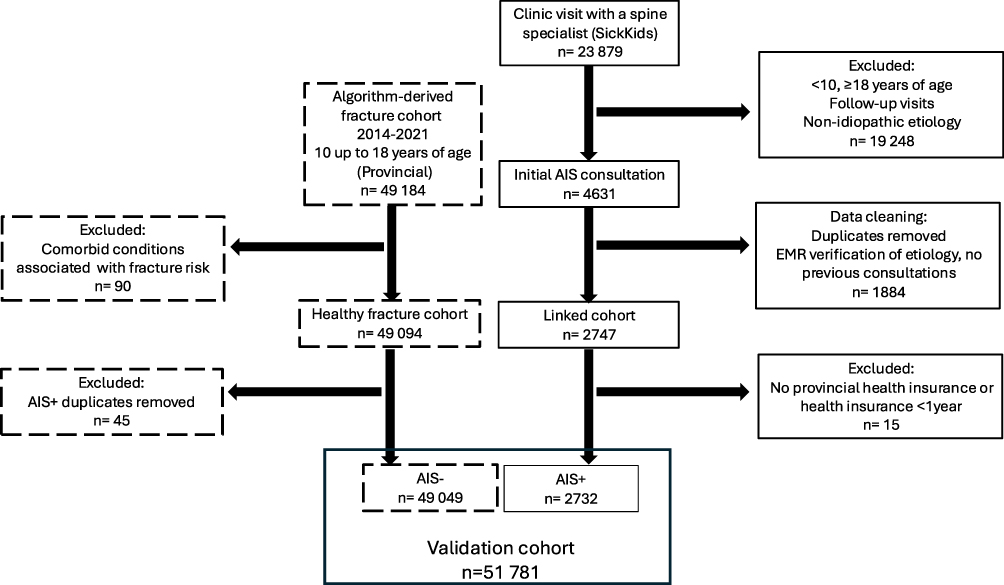 |
Figure 1 Flowchart for validation cohort (AIS+ and AIS-) identification. |
The AIS- sample was established using a previously validated algorithm to identify pediatric fracture patients in Ontario.24 To approximate the prevalence of AIS in the literature, a subgroup of distal forearm fractures (n = 49,049) was selected. Applied exclusion criteria included the International Classification of Diseases, tenth revision (ICD-10) diagnosis codes indicating a comorbid medical condition known to be associated with an increased fracture risk, further detailed in Supplemental Table 2. Any patients identified in both the AIS+ and AIS- samples were excluded from AIS-.
A secondary validation cohort of youth that received spine-related treatment between 2012 and 2021 was created for a sensitivity analysis. This included youth that had a scoliosis diagnosis code and were prescribed a spinal orthosis or underwent spinal fusion.
Algorithm Derivation
Algorithms were generated that used a combination of diagnostic, fee, and specialty codes from physician billing data (Ontario Health Insurance Plan (OHIP)), and emergency department (National Ambulatory Care Reporting System (NACRS)) and hospital discharge reporting (Canadian Institute for Health Information Discharge Abstract Database (CIHI-DAD)). Various look back periods were used up to a maximum defined period of three years, that went up to but did not include the date of initial spine consultation at the study institution (AIS+) or to the date of fracture (AIS-). An algorithm specification table outlining these details is provided in Supplemental Table 3. To streamline algorithm development, specific diagnostic and spine x-ray fee codes were prioritized a priori by the first author (JD) based on clinical experience (Supplemental Table 2). Codes were eligible for inclusion if they occurred anytime from age 10 through 17 years.
Statistical Analysis
The diagnostic accuracy of each HAD algorithm to correctly identify AIS+ cases within the validation cohort, was determined through sensitivity, specificity, positive and negative predictive values (PPV and NPV respectively) with their 95% confidence intervals (CI). To support transparent algorithm selection, a structured composite scoring framework was developed and applied, incorporating diagnostic accuracy (50%), clinical face validity (20%), practicality (15%), misclassification risk (10%), and external generalizability (5%), further detailed in Table 1. The top three algorithms were used to create cohorts that met the case definition for AIS between 2005 and 2021. Demographic information collected for the primary validation cohort and each algorithm-derived cohort included age and sex. The optimal algorithm was used to estimate prevalence and incidence.
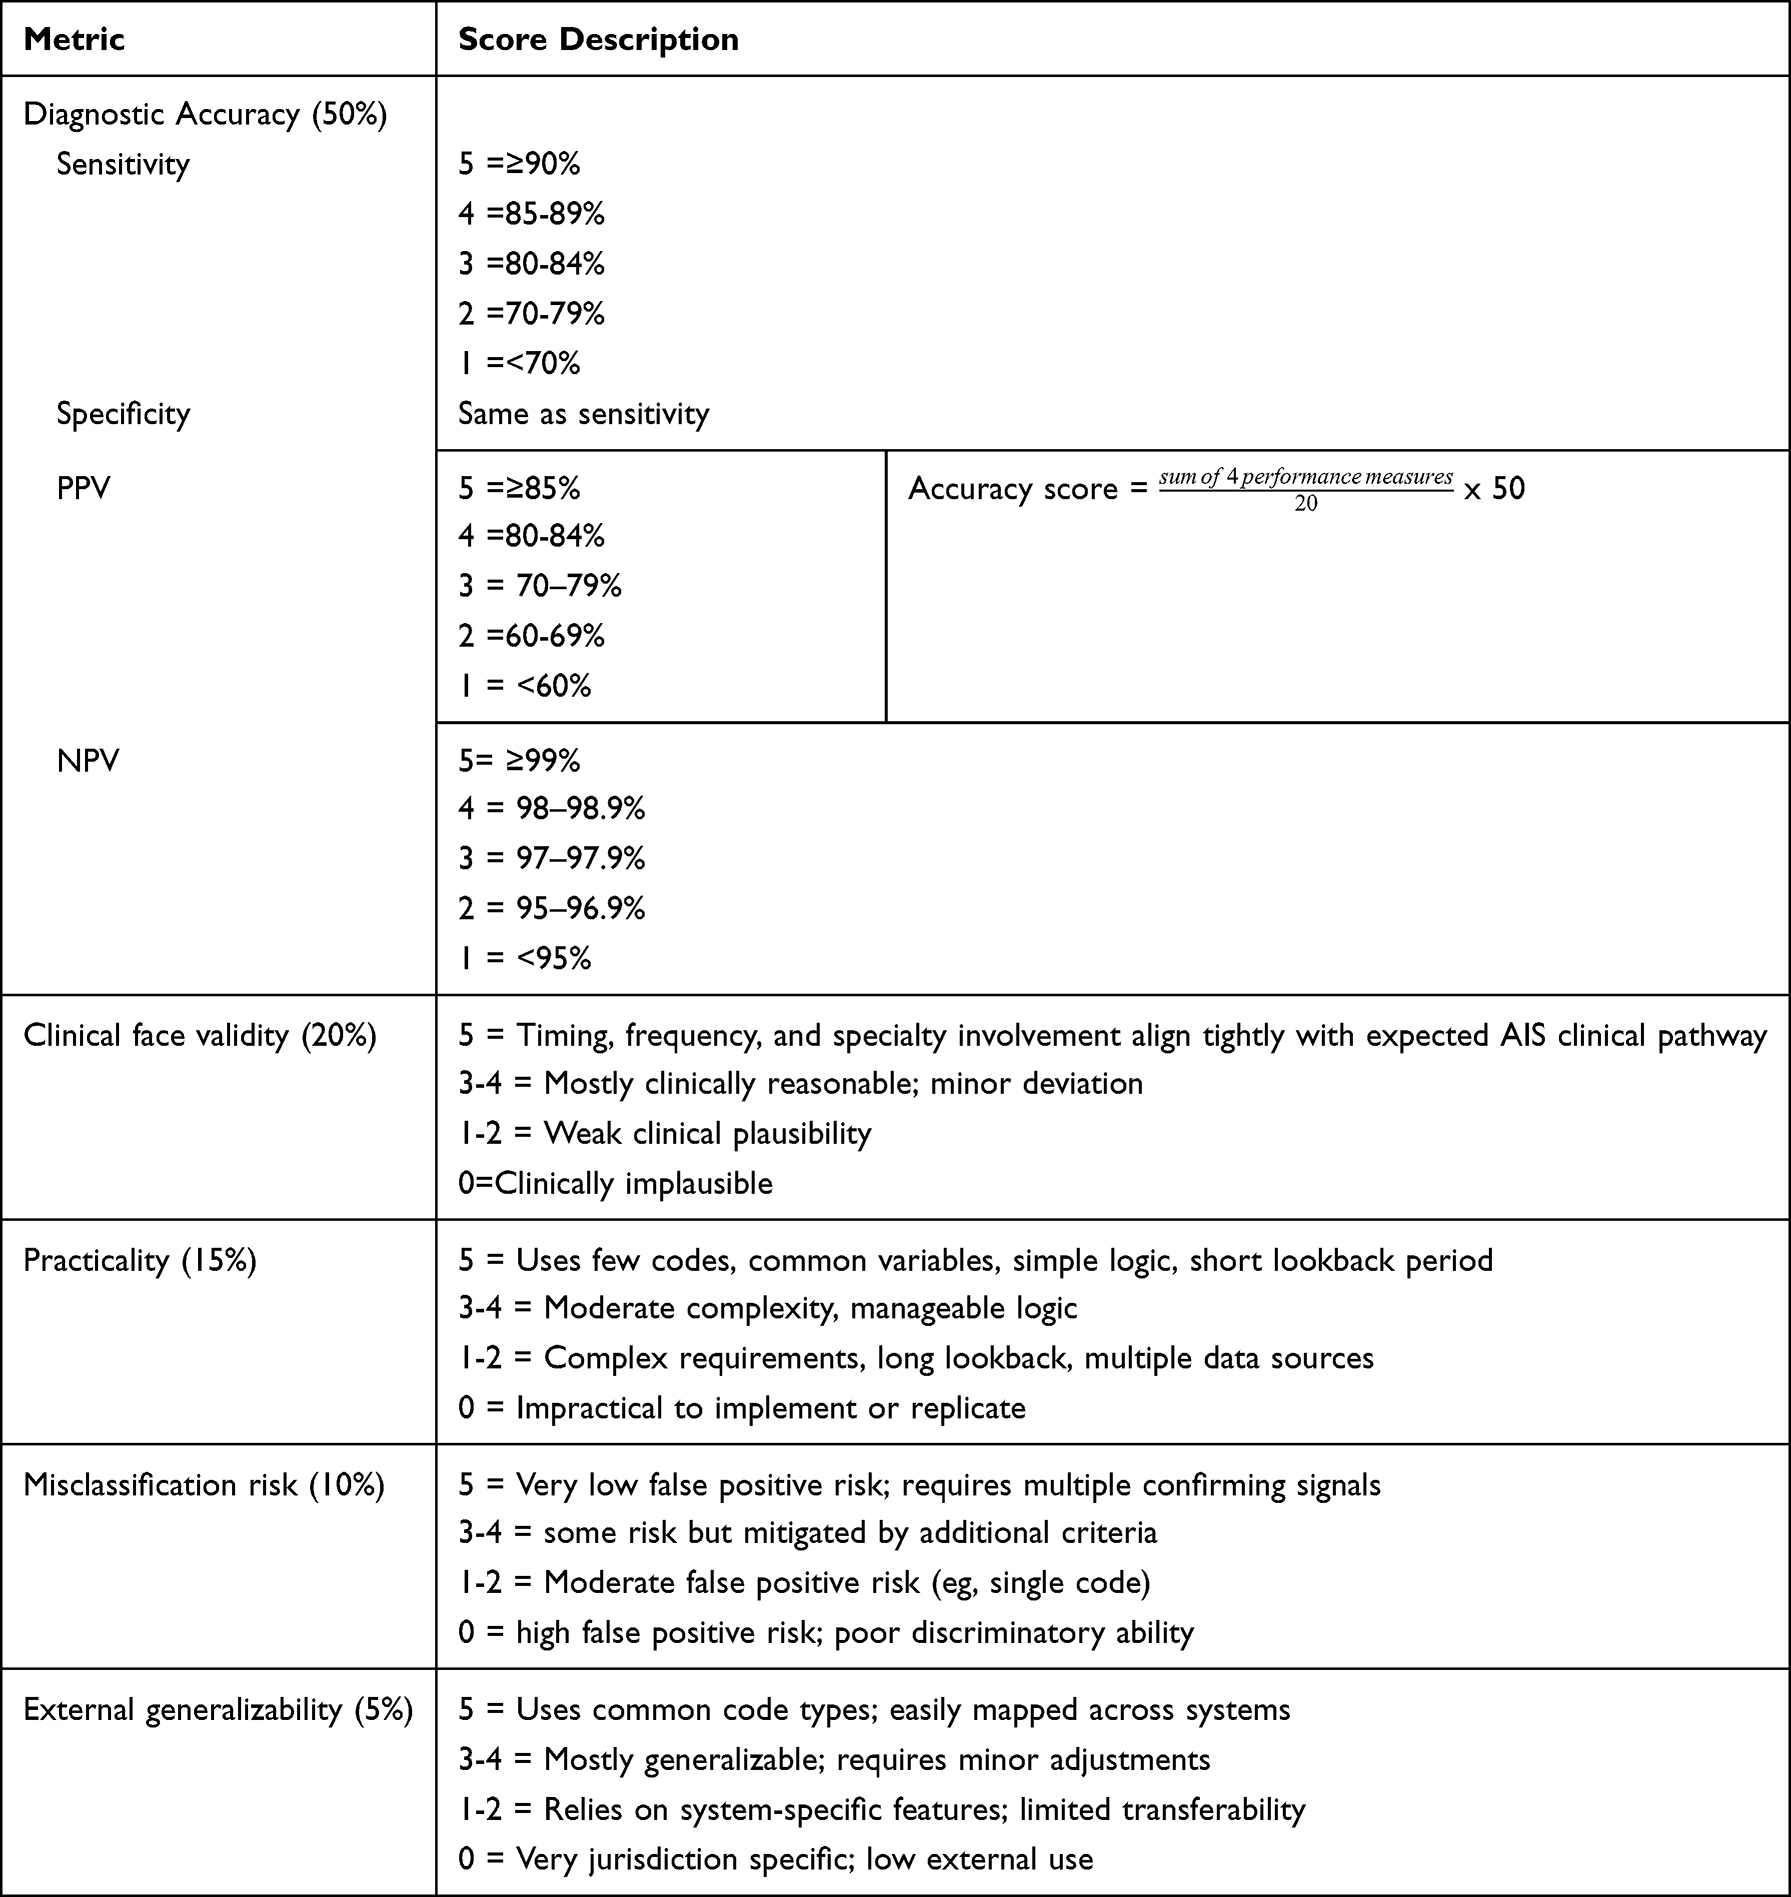 |
Table 1 Composite Scoring Framework |
A sensitivity analysis cross-referenced the cohort of youth that had received spine-related treatment with the AIS-, and then separately with the algorithm-derived cohorts. The expectation was that most youth treated with a spinal orthosis and/or spinal fusion, would not be identified in the AIS- group but would be identified by the top HAD algorithms. Sensitivity was reported with 95% CI.
Prevalence of youth with AIS from 10 to 17 years of age was reported at the start of 2012. Prevalence reflected diagnosed, treatment-range AIS. This provided sufficient time to identify all prior prevalent cases. Patients were removed once they turned 18 years of age, or earlier if they were no longer eligible for health insurance (ie, moved out of Ontario) or there was a documented date of death. AIS incidence was reported for the same time frame. An incident case was counted when the algorithm’s case definition was met and was considered a new AIS diagnosis. Crude annual incidence and prevalence estimates were adjusted for age and sex using Ontario population data. To facilitate rate comparisons over time, estimates were standardized to the 2016 Census population.
Poisson regression was considered to model the rate ratio over time, however preliminary analysis revealed overdispersion, violating the model’s assumption that mean and variance are equal. Therefore, a negative binomial regression model was chosen, introducing an additional parameter to account for overdispersion, providing a more appropriate fit for the data. The model analyzed the number of cases over time, adjusting for age and sex. An offset term was used to adjust for the population at risk. Year of diagnosis was first modelled as a continuous variable to assess the average rate change over time, then as a categorical variable (2012–21) to evaluate year-over-year change. Age was modelled as a categorical variable (10–17 years). Preliminary analysis also showed an interaction between age and sex indicating that the relationship between rates and age differed by sex. Separate models were run for prevalence rate ratios (PRR) and incidence rate ratios (IRR) with 95% CIs reported. Significance was accepted at p < 0.05. Algorithm validation was done using SAS Excelxp Taget (v1.131, 2015–04-23) with all other analyses performed using R Statistical Software (R version 3.1.2, 2014–10-31, http://www.R-project.org).
Results
There were 51781 youth in the validation cohort, 2732 (5.3%) in the AIS+ and 49049 in the AIS- sample (Table 2). The median curve magnitude in the AIS+ cohort was 35 (IQR: 25.5–44.5). In total, 93 unique HAD algorithms were tested against this validation cohort. The proportion of true positives (sensitivity) is plotted against false positives (1-specificity) in Figure 2. Detailed performance results for the 11 algorithms that had both sensitivity and specificity greater than 80% are shown in Table 3. “2 physician billing codes for scoliosis in 2 years” (Algorithm A), and “2 physician billing codes for scoliosis in 3 years, at least 1 by any specialist” (Algorithm B), were selected for further validation. “1 physician billing code for scoliosis ever” (Algorithm C), with its higher sensitivity but lower PPV was selected for comparison.
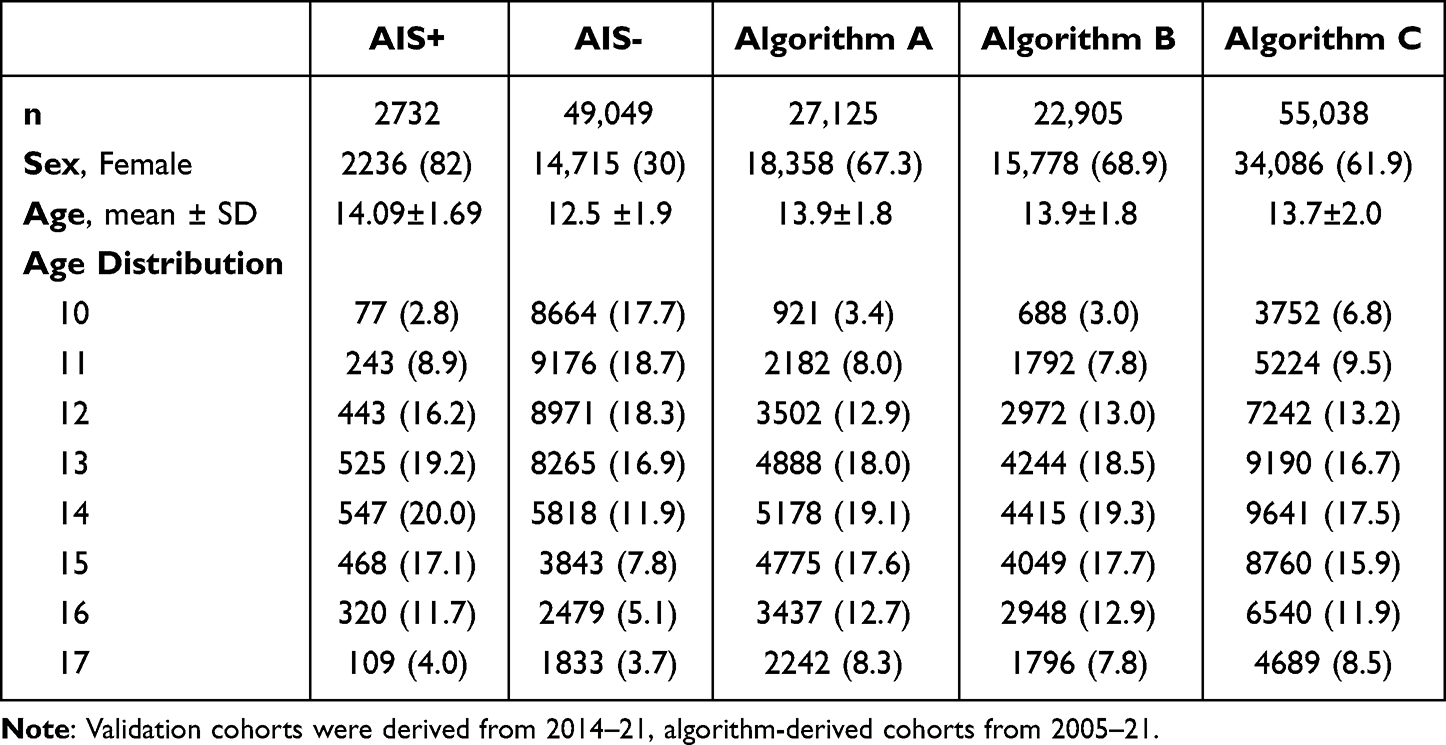 |
Table 2 Demographics of the Validation (AIS+ and AIS-) and Algorithm-Derived Cohorts |
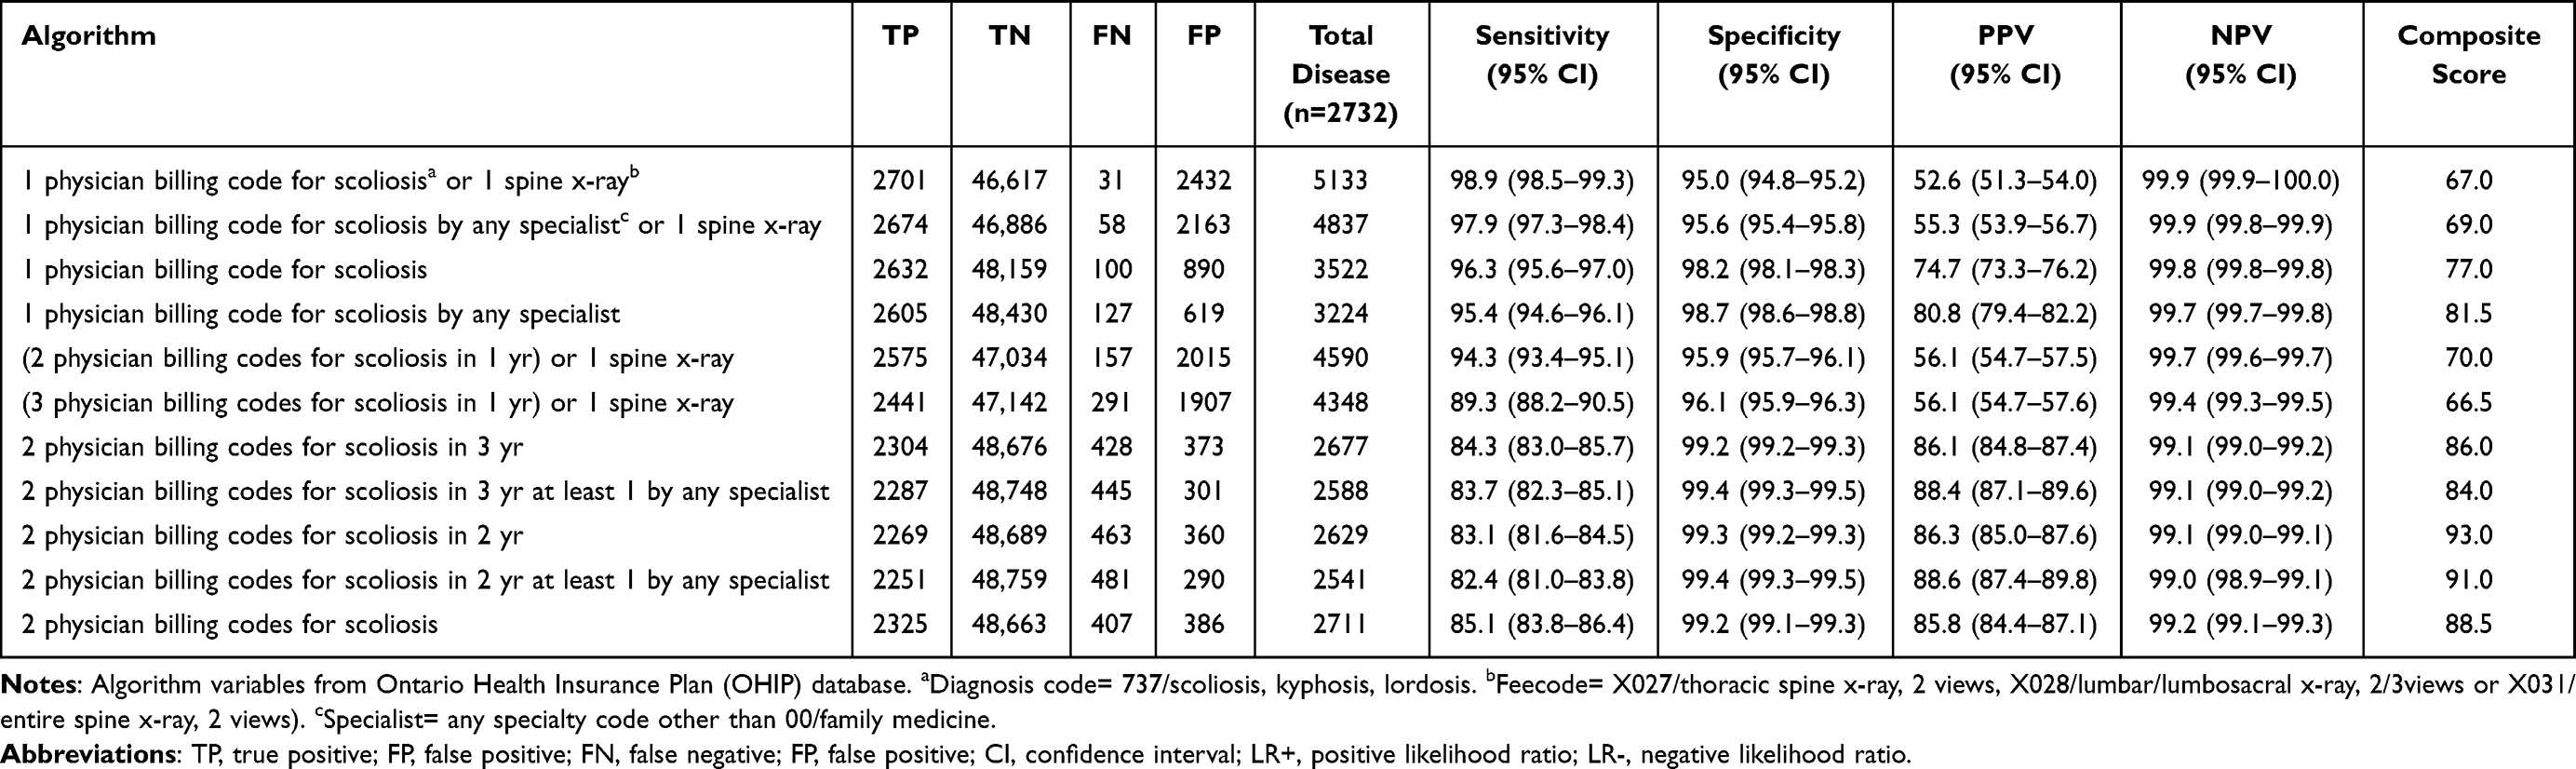 |
Table 3 Performance Summary for Algorithms with a Maximum Defined Look Back Period of 3-Years and Greater Than 80% Sensitivity and Specificity |
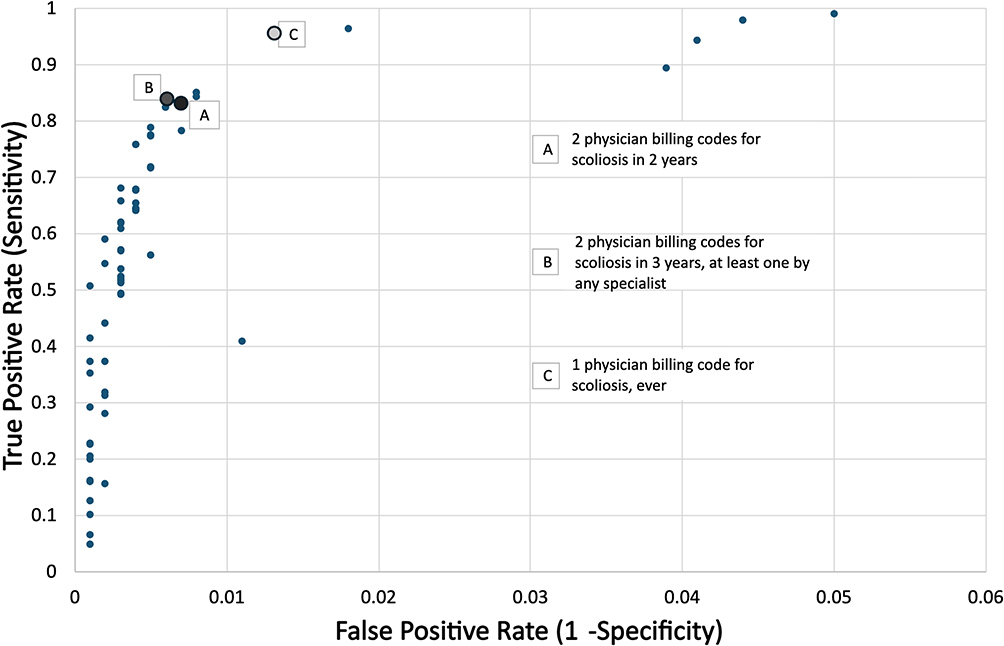 |
Figure 2 Receiver operator curve characteristics illustrating the trade-offs between a high true positive rate (sensitivity) and a low false positive rate (1-specificity) for the HAD algorithms tested. |
Results of the sensitivity analysis are shown in Table 4. Less than 0.13% and 0.04% of the AIS- cohort were flagged for having a spinal orthosis or spinal fusion, respectively. Over 72% of the brace sample and over 80% of the surgical sample were represented in the Algorithm A-C-derived cohorts, respectively.
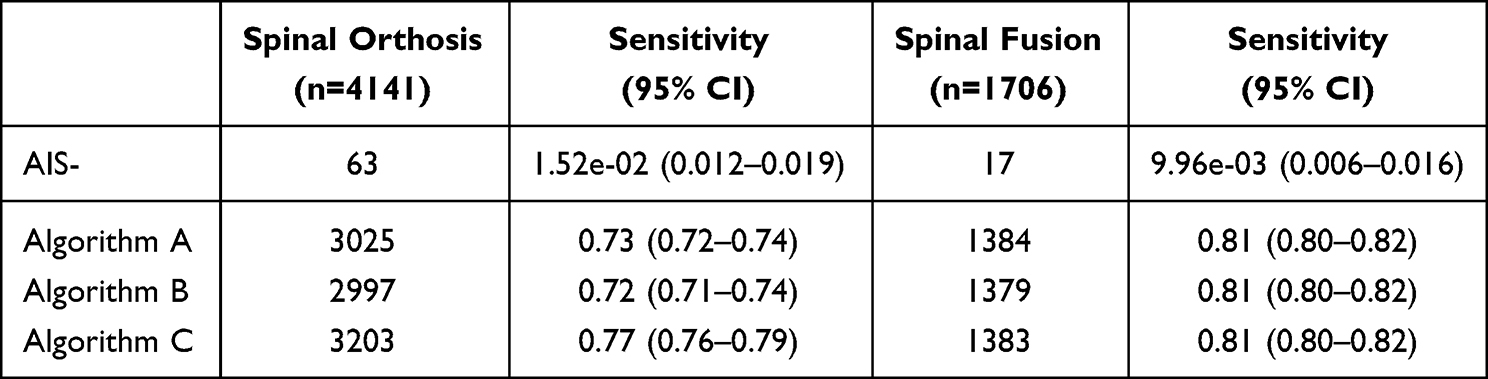 |
Table 4 Sensitivity Analysis Results |
Algorithm A “2 physician billing codes for scoliosis in 2 years” achieved the highest composite score (93.0/100) and was selected to estimate annual incidence and prevalence. The study team felt that the 3-year lookback period in Algorithm B was excessively long for an AIS population, less accurately reflecting real-world clinical pathways for treatment-range AIS, and that Algorithm C would over inflate population estimates. Further, the simplicity of this algorithm compared to other top contenders was preferred, as it did not come at the expense of performance metrics.
Annual AIS age/sex-standardized prevalence of diagnosed AIS averaged 513.3/100 000 (n = 6252) between 2012 and 2021. There was a 1.1-fold increase between 2012 (491.7/100 000) to 2021 (541.9/100 000). The sex-stratified, age-standardized prevalence rates are presented in Figure 3a, averaging 751.0/100 000 for females (n = 4449) and 288.2/100 000 for males (n = 1803).
 |
Figure 3 Sex stratified, age-standardized AIS rates in Ontario between 2012–21. (a) Average annual prevalence of diagnosed, treatment-range AIS was 513.3/100 000 (751.05/100 000 females; 288.2/100 000 males) with adjusted rate increase averaging 1% each year (p<0.001) (b) Average annual incidence of newly diagnosed AIS was 128.2/100 000 (177.5/100 000 females; 81.6/100 000 males) with adjusted rate increase averaging 2% each year (p<0.001). |
The population-based AIS age/sex-standardized annual incidence of newly diagnosed AIS from 2012 to 2021 averaged 128.2/100 000 (n = 1561). There was a 1.3-fold increase between 2012 (117.6/100 000) to 2021 (147.3/100 000). The annual sex stratified, age-standardized rates are presented in Figure 3b, averaging 177.5/100 000 for females (n = 1051) and 81.6/100 000 for males (n = 510).
The unadjusted PRR and IRR did not change over time (p = 0.72 and p = 0.49, respectively), however when adjusted for age and sex and the interaction between them, the average annual increase in the prevalence rate ratio was 1% (PRR = 1.01, 95% CI: 1.01–1.01, p < 0.001) and the adjusted incidence rate ratio increased 2% (IRR = 1.02, 95% CI: 1.01–1.02, p < 0.001). Adjusted rate ratios are shown in Table 5. Rate change was not constant year-over-year, rather change was irregular with the largest increase, relative to 2012, noted in 2021. Males had a rate ratio 65% lower than females for both prevalence and incidence (RR = 0.35, 95% CI: 0.29–0.42, p < 0.001). The effect of age differed by sex, and although rates peaked in mid-adolescence, they were highest for females at age 13 years and males at age 15 years (Figure 4).
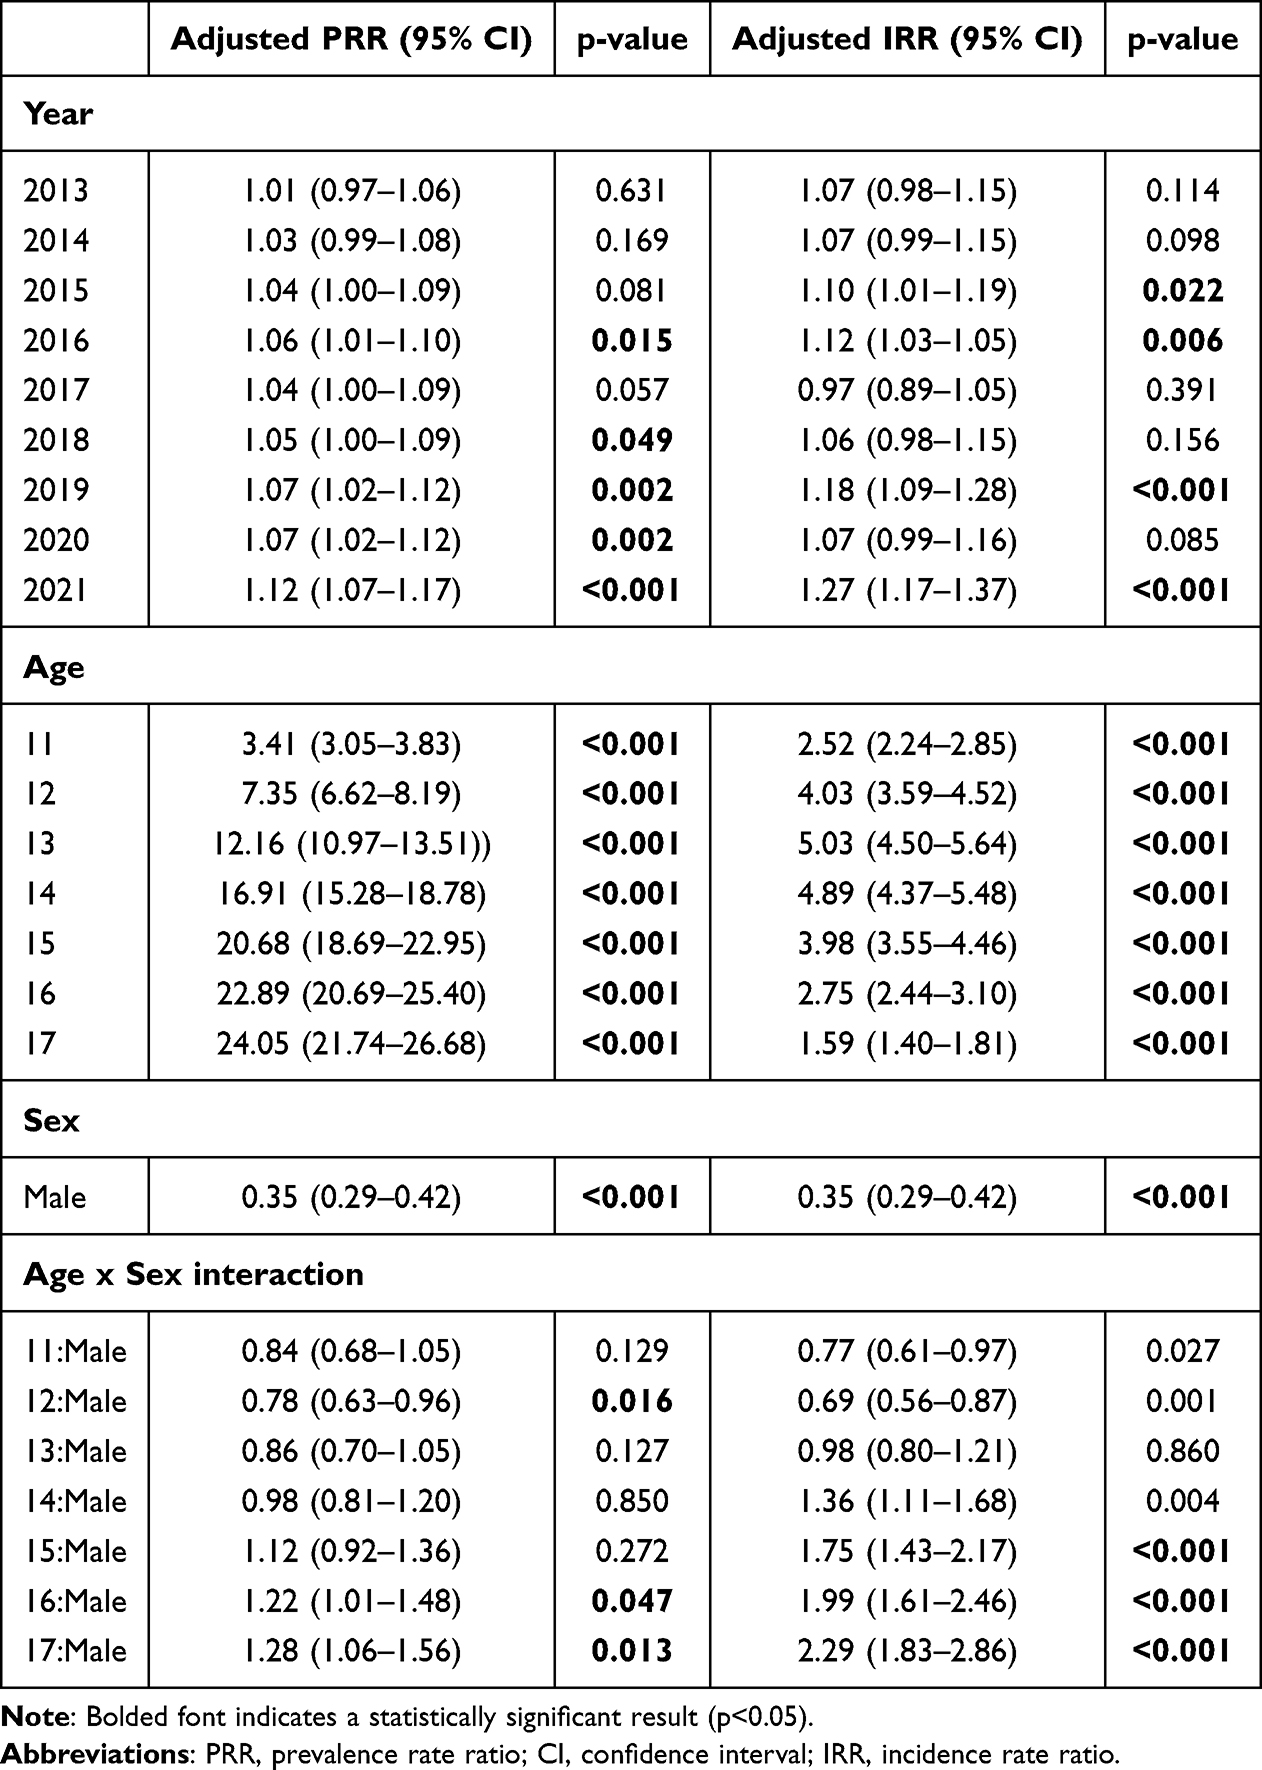 |
Table 5 Prevalence and Incidence Rate Ratios by year of Diagnosis, Adjusted for Age, Sex, and Age:sex Interaction (Reference: 10-year-Old Female in 2012) |
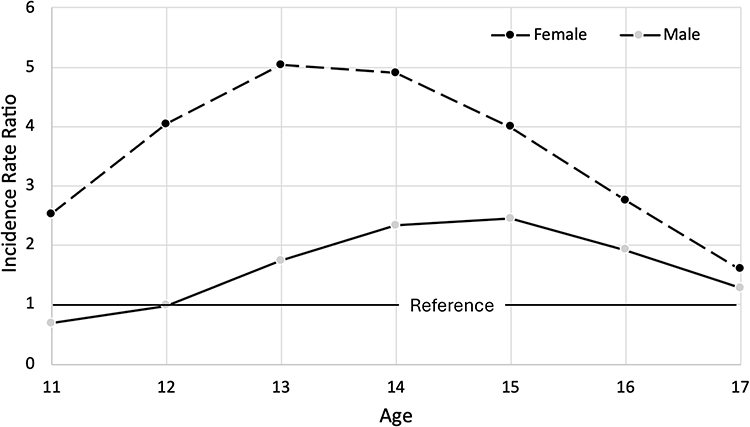 |
Figure 4 Interaction plot illustrating that the effect of age on the incidence rate ratio differs by sex, peaking at age 13 years for females and 15 years for males, similar at age 17 years for both sexes. Reference value is a 10-year-old female (incidence rate ratio=1). |
Discussion
This study aimed to explore epidemiological trends of diagnosed, treatment-range AIS in Ontario over a 10-year period, by validating a population-based HAD algorithm for case ascertainment. “Two physician billing codes for scoliosis in 2 years” was selected as the optimal algorithm with sensitivity: 83.1% (81.6–84.5), specificity: 99.3% (99.2–99.3), PPV: 86.3 (85.0–87.6), and NPV: 99.1 (99–99.1). The algorithm-derived cohort showed an average prevalence of diagnosed AIS of 513.3/100 000 and incidence of newly diagnosed AIS of 128.2/100 000 between 2012 and 2021. There was a modest 1.1-fold increase in prevalence and 1.3-fold increase in incidence.
The prevalence and incident rates reported in this study are lower than reported in previous literature; however, most estimates consists primarily of mild disease, which is unlikely to require health resources. Our algorithm is intentionally biased toward identifying larger magnitude curvatures, as the AIS+ sample used for the validation cohort had a mean curve magnitude of 35° (IQR: 25.5–45.5). Konieczny et al provided an overview of school screening data and based on 4 studies representing nearly 3.7 million youth, a subgroup analysis showed the prevalence of 21–40° curves was 0.2–0.5% and for curves greater than 40°, 0.04–0.3%.1 These estimates support that our own estimates, despite curve severity not being documented, are likely reflective of the proportion of youth that treatment consideration is warranted. Because the AIS+ and AIS- sample sizes were intentionally selected to approximate the expected population prevalence of diagnosed AIS, the resulting PPV and NPV remain appropriate for a lower‑prevalence context. Importantly, healthcare encounters were captured only up to, but not including, the date of initial spine consultation or fracture, ensuring that algorithm performance reflects pre‑diagnostic healthcare behavior rather than utilization triggered by the index event. External applicability may nevertheless vary in jurisdictions with different referral pathways, diagnostic thresholds, or access to imaging. By basing our algorithm on clinical diagnosis and validating against a cohort requiring treatment consultation, our prevalence and incidence estimates are clinically sensible and should be considered relevant to health resource planning.
Our study highlights the importance of validating HAD for case ascertainment. Although using a single scoliosis diagnostic code from physician billing claims identified over 96% of confirmed AIS, the false positive rate was over 25% which would certainly lead to inflated prevalence and incidence estimates. This was demonstrated by Thomas et al in a study that retrospectively identified patients using an integrated health system database and based on a “diagnosis suggestive of AIS”, reported an incidence of 522/100 000, however, when they included only those with radiographic confirmation of scoliosis greater than 10°, the estimated incidence was much lower at 181.7/100 000.15
Although the year‑over‑year increases in prevalence of diagnosed AIS (≈1%) and incidence of new AIS diagnoses (≈2%) are modest in absolute terms, they are statistically significant and should not be considered trivial at a population level. Even small percentage changes translate into meaningful shifts in the number of affected youth in a large jurisdiction and may have implications for referral volumes, clinical capacity, and long‑term resource planning. These trends should, however, be interpreted cautiously, as they may not be indicative of an increase in true disease but rather illustrate differences in diagnostic opportunity, healthcare‑seeking behavior, and encounter‑based coding practices over time. COVID-19 pandemic‑related disruption resulted in widespread reductions in in‑person primary care and deferred non‑urgent visits. Decreased case ascertainment in 2020/21 should be interpreted in the context of pandemic‑related service interruptions rather than underlying changes in scoliosis epidemiology.25
The wide range in previously reported AIS prevalence is, in part, related to the age of the cohort studied. Risk of scoliosis progression is greatest during the adolescent peak velocity growth; therefore, studies that do not include youth at the end of puberty2,26 are likely underestimating prevalence. The age of 14 years is a common upper threshold in epidemiology studies; however, studies that do include older adolescents show a continued increase in prevalence after 14 years6,27 similar to what we observed. In fact, the peak incidence rate for males in this study was 15 years of age. Given that females develop earlier than males, our finding that the effect of age on incidence differed by sex was not surprising and further validates our results.
Limitations
Scoliosis severity is unknown within the algorithm-derived cohort. Epidemiological estimates from a case ascertainment HAD algorithm only represent the diagnosed cases of scoliosis and does not capture the volume of undiagnosed youth with curvatures. AIS diagnosis is highly dependent on screening practices and healthcare‑seeking behavior which may impact prevalence and incidence estimates. Further, the specific billing code combinations reflect local diagnostic practices and referral pathways and may not translate directly to other jurisdictions. However, the underlying validation strategy, a clinically valid reference standard, systematic testing of candidate algorithms, and transparent performance assessment, is transferable and can be adapted and re‑validated using administrative data in other healthcare systems or within other geographic or ethnic subgroups. Although a strength of this study is the ethnic diversity of the study area, individual race data is not available.
The spine-related treatment cohort has not been independently validated at the individual clinical level; therefore, some misclassification remains possible. Although some youth in the AIS- sample were identified as having had a spinal orthosis or fusion it is reassuring this was very few (0.13% and 0.04%, respectively), and that conversely, most of the treated sample (73% spinal orthosis; 81% spinal fusion), were identified in the selected algorithm-derived AIS cohort. Independent validation would further enhance the algorithm’s external performance. This could include detailed review of electronic medical records; however, this is resource intense and was not feasible for the present study.
Conclusion
This study validates a HAD algorithm against radiographically confirmed, treatment-range AIS in 10–17-year-olds, with excellent accuracy in an ethnically diverse, publicly funded health system. Application of the validated algorithm yielded clinically meaningful prevalence, and incidence estimates of diagnosed AIS, reflecting a population appropriate for treatment consideration. This study provides an efficient and scalable method for population-level cohort creation that will facilitate surveillance of AIS diagnostic and treatment trends and longitudinal outcome research, which need be interpreted within this study’s limitations. Finally, because this algorithm was validated within a universal healthcare system using linked administrative data, its performance may differ in jurisdictions with different healthcare structures, coding practices, or data systems.
Data Sharing Statement
The data that support the findings of this study are available at ICES, Ontario, Canada but restrictions apply to the availability of these data, which were used under license for the current study, and so are not publicly available. Specifically, the dataset from this study is held securely in coded form at ICES. While legal data sharing agreements between ICES and data providers (eg, healthcare organizations and government) prohibit ICES from making the dataset publicly available, access may be granted to those who meet pre-specified criteria for confidential access, available at https://www.ices.on.ca/use-ices-data/. Contact ICES at the following e-mail for more information on data access: [email protected].
The underlying code that supports the analysis and findings of this study, utilized in a secure analysis environment at ICES, Ontario, Canada, is available from the corresponding author upon request. Note that the computer programs may rely upon coding templates or macros that are unique to ICES and are, therefore, either inaccessible or may require modification. Requests to access the datasets should be directed to ICES data sharing, [email protected].
Acknowledgments
This study was supported by ICES, which is funded by an annual grant from the Ontario Ministry of Health (MOH) and the Ministry of Long-Term Care (MLTC). Parts of this material are based on data and/or information compiled and provided by the Canadian Institute for Health Information (CIHI) and the Ontario Ministry of Health (MOH). This document used data adapted from the Statistics Canada Postal CodeOM Conversion File, which is based on data licensed from Canada Post Corporation, and/or data adapted from the Ontario Ministry of Health Postal Code Conversion File, which contains data copied under license from ©Canada Post Corporation and Statistics Canada. The analyses, conclusions, opinions, and statements expressed herein are solely those of the authors and are independent from funders and supporters. No endorsement by ICES, Statistics Canada, the Ontario MOH and MLTC are intended nor should be inferred. The funders and supporters had no role in study design; in the collection, analysis and interpretation of data; in the writing of the manuscript; and in the decision to submit the manuscript of publication. Lastly, the authors would like to recognize the contribution of Dan Fridman, ICES research analyst, for deriving and testing algorithm performance, and Jingqin Zhu, Senior Biostatistician, Sickkids Research Institute, for assembling the algorithm-derived cohorts and population data. An abstract based on an earlier version of this work was presented at the Canadian Orthopaedic Association (COA) Annual General Meeting, Vancouver, British Columbia, Canada, 11-14 June 2025, and is available at https://boneandjoint.org.uk/Article/10.1302/1358-992X.2026.1.117
Funding
This research did not receive any specific grant from funding agencies in the public, commercial, or not-for-profit sectors.
Disclosure
The authors report no conflicts of interest in this work.
References
1. Konieczny MR, Senyurt H, Krauspe R. Epidemiology of adolescent idiopathic scoliosis. J Child Orthop. 2013;7(1):3–13. doi:10.1007/s11832-012-0457-4
2. Ciaccia MCC, Castro JS, Rahal MA, et al. Prevalence of scoliosis in public elementary school students. Rev Paul Pediatr. 2017;35(2):191–198. doi:10.1590/1984-0462/;2017;35;2;00008
3. Eksi MS, Ozcan-Eksi EE, Huet SE, Dinc T, Ozmen BB, Akcal MA. Prevalence of thoracic scoliosis in adolescents in Turkey: analysis of 1065 chest radiographs. World Neurosurg. 2020;135:e527–40. doi:10.1016/j.wneu.2019.12.057
4. Morais T, Bernier M, Turcotte F. Age- and sex-specific prevalence of scoliosis and the value of school screening programs. Am J Public Health. 1985;75(12):1377–1380. doi:10.2105/ajph.75.12.1377
5. Rogala EJ, Drummond DS, Gurr J. Scoliosis: incidence and natural history. A prospective epidemiological study. J Bone Joint Surg Am. 1978;60(2):173–176. doi:10.2106/00004623-197860020-00005
6. Daruwalla J, Balasubramaniam P, Chay S, Rajan U, Lee H. Idiopathic scoliosis. Prevalence and ethnic distribution in Singapore schoolchildren. J Bone Joint Surg Br. 1985;67-B(2):182–184. doi:10.1302/0301-620X.67B2.3980521
7. Sakullertphasuk W, Suwanasri C, Saetang L, et al. Prevalence of scoliosis among high school students. J Med Assoc Thai. 2015;98 Suppl 5:S18–22.
8. Nery LS, Halpern R, Nery PC, Nehme KP, Stein AT. Prevalence of scoliosis among school students in a town in southern Brazil. Sao Paulo Med J. 2010;128(2):69–73. doi:10.1590/s1516-31802010000200005
9. Shands A, Eisberg H. The incidence of scoliosis in the state of Delaware; a study of 50,000 minifilms of the chest made during a survey for tuberculosis. J Bone Joint Surg Am. 1955;37-A(6):1243–1249. doi:10.2106/00004623-195537060-00012
10. Bondar K, Nguyen A, Vatani J, Kessler J. The demographics and epidemiology of infantile, juvenile, and adolescent idiopathic scoliosis in a Southern California integrated healthcare system. Spine. 2021;46(21):1468–1477. doi:10.1097/BRS.0000000000004046
11. Penha PJ, Ramos N, de Carvalho BKG, Andrade RM, Schmitt ACB, Joao SMA. Prevalence of adolescent idiopathic scoliosis in the State of Sao Paulo, Brazil. Spine. 2018;43(24):1710–1718. doi:10.1097/BRS.0000000000002725
12. Ueno M, Takaso M, Nakazawa T, et al. A 5-year epidemiological study on the prevalence rate of idiopathic scoliosis in Tokyo: school screening of more than 250,000 children. J Orthop Sci. 2011;16(1):1–6. doi:10.1007/s00776-010-0009-z
13. Scoliosis Research Society. Diagnosis and treatment. 2023. Available from: https://www.srs.org/Patients/Diagnosis-And-Treatment.
14. Nadler EB, Kim DJ, Lebel DE, Dermott JA. The true cost of late presentation in adolescent idiopathic scoliosis: a 5-year follow-up study. J Pediatr Orthop. 2025;45(6):e531–7. doi:10.1097/BPO.0000000000002937
15. Thomas JJ, Stans AA, Milbrandt TA, Kremers HM, Shaughnessy WJ, Larson AN. Trends in incidence of adolescent idiopathic scoliosis: a modern US population-based study. J Pediatr Orthop. 2021;41(6):327–333. doi:10.1097/BPO.0000000000001808
16. Sung S, Chae H-W, Lee HS, et al. Incidence and surgery rate of idiopathic scoliosis: a nationwide database study. Int J Environ Res Public Health. 2021;18(15):8152. doi:10.3390/ijerph18158152
17. Ehrenstein V, Hellfritzsch M, Kahlert J, et al. Validation of algorithms in studies based on routinely collected health data: general principles. Am J Epidemiol. 2024;193(11):1612–1624. doi:10.1093/aje/kwae071
18. Butt DA, Tu K, Young J, et al. A validation study of administrative data algorithms to identify patients with Parkinsonism with prevalence and incidence trends. Neuroepidemiology. 2014;43(1):28–37. doi:10.1159/000365590
19. Widdifield J, Ivers NM, Young J, et al. Development and validation of an administrative data algorithm to estimate the disease burden and epidemiology of multiple sclerosis in Ontario, Canada. Mult Scler. 2015;21(8):1045–1054. doi:10.1177/1352458514556303
20. Abdalla M, Chen B, Santiago R, et al. Accuracy of algorithms to identify people with atopic dermatitis in Ontario routinely collected health databases. J Invest Dermatol. 2021;141(7):1840–1843. doi:10.1016/j.jid.2021.01.009
21. Nasr A, Sullivan K, Chan E, Wong C, Benchimol E. Validation of algorithms to determine incidence of Hirschsprung disease in Ontario, Canada: a population-based study using health administrative data. Clin Epidemiol. 2017;9:579–590. doi:10.2147/CLEP.S148890
22. Benchimol EI, Manuel DG, To T, Griffiths AM, Rabeneck L, Guttmann A. Development and use of reporting guidelines for assessing the quality of validation studies of health administrative data. J Clin Epidemiol. 2011;64(8):821–829. doi:10.1016/j.jclinepi.2010.10.006
23. Statistics Canada. “Ontario (table). Census profile. 2016 Census”. Statistics Canada Catalogue no. 98-316-X2016001. Retrieved June 30, 2025. 2017.
24. Escott BG, To T, Beaton DE, Howard AW. Risk of recurrent fracture: a population-based study. Pediatrics. 2019;144(2). doi:10.1542/peds.2017-2552
25. Dermott JA, Kim DJ, Lebel DE. The impact of COVID-19 on idiopathic scoliosis referrals: cause for concern. Spine Deform. 2021;9(6):1501–1507. doi:10.1007/s43390-021-00418-z
26. Moalej S, Asadabadi M, Hashemi R, et al. Screening of scoliosis in school children in Tehran: the prevalence rate of idiopathic scoliosis. J Back Musculoskelet Rehabil. 2018;31(4):767–774. doi:10.3233/BMR-171078
27. Hengwei F, Zifang H, Qifei W, et al. Prevalence of idiopathic scoliosis in Chinese schoolchildren: a large, population-based study. Spine. 2016;41(3):259–264. doi:10.1097/BRS.0000000000001197
 © 2026 The Author(s). This work is published and licensed by Dove Medical Press Limited. The
full terms of this license are available at https://www.dovepress.com/terms
and incorporate the Creative Commons Attribution
- Non Commercial (unported, 4.0) License.
By accessing the work you hereby accept the Terms. Non-commercial uses of the work are permitted
without any further permission from Dove Medical Press Limited, provided the work is properly
attributed. For permission for commercial use of this work, please see paragraphs 4.2 and 5 of our Terms.
© 2026 The Author(s). This work is published and licensed by Dove Medical Press Limited. The
full terms of this license are available at https://www.dovepress.com/terms
and incorporate the Creative Commons Attribution
- Non Commercial (unported, 4.0) License.
By accessing the work you hereby accept the Terms. Non-commercial uses of the work are permitted
without any further permission from Dove Medical Press Limited, provided the work is properly
attributed. For permission for commercial use of this work, please see paragraphs 4.2 and 5 of our Terms.
Recommended articles

Epidemiology of Disorders Associated with Short Stature in Childhood: A 20-Year Birth Cohort Study in Finland
Harju S, Saari A, Sund R, Sankilampi U
Clinical Epidemiology 2022, 14:1205-1214
Published Date: 26 October 2022
Global Burden of Asthma, and Its Impact on Specific Subgroups: Nasal Polyps, Allergic Rhinitis, Severe Asthma, Eosinophilic Asthma
Rabe APJ, Loke WJ, Gurjar K, Brackley A, Lucero-Prisno III DE
Journal of Asthma and Allergy 2023, 16:1097-1113
Published Date: 6 October 2023
Validity of Prescription-Defined and Hospital-Diagnosed Hypertension Compared with Self-Reported Hypertension in Denmark
Bonnesen K, Schmidt M
Clinical Epidemiology 2024, 16:249-256
Published Date: 11 April 2024
Positive Predictive Value of ICD-10 Codes for Identifying Hypocalcemia in Women with Postmenopausal Osteoporosis in Swedish Patient Register: A Validation Study
Kjellman A, Kim M, Lundgren PO, Thiel T, Thor A, Thulin H, Hägg D, Ehrenstein V
Clinical Epidemiology 2025, 17:747-752
Published Date: 2 September 2025
A Single-Center Profile of Pemphigus in China: Significant Diagnostic Delay and Evolving Treatment Patterns
Zhang H, Li D, Zhang Y, Lu X, Tang K, Zuo YG, Jin H
Clinical, Cosmetic and Investigational Dermatology 2026, 19:578636
Published Date: 15 January 2026