Back to Journals » Journal of Asthma and Allergy » Volume 16
Global Burden of Asthma, and Its Impact on Specific Subgroups: Nasal Polyps, Allergic Rhinitis, Severe Asthma, Eosinophilic Asthma
Authors Rabe APJ ![]() , Loke WJ
, Loke WJ ![]() , Gurjar K
, Gurjar K ![]() , Brackley A
, Brackley A ![]() , Lucero-Prisno III DE
, Lucero-Prisno III DE
Received 21 April 2023
Accepted for publication 24 September 2023
Published 6 October 2023 Volume 2023:16 Pages 1097—1113
DOI https://doi.org/10.2147/JAA.S418145
Checked for plagiarism Yes
Review by Single anonymous peer review
Peer reviewer comments 3
Editor who approved publication: Dr Amrita Dosanjh
Adrian Paul J Rabe,1,2 Wei Jie Loke,3 Khushboo Gurjar,4 Allison Brackley,5 Don Eliseo Lucero-Prisno III6,7
1BioPharmaceutical Medical, Respiratory & Immunology, AstraZeneca, Cambridge, UK; 2Imperial College, London, UK; 3East and North Hertfordshire NHS Trust, Stevenage, UK; 4RWA Health Economics, Cytel Health Canada, Toronto, Ontario, Canada; 5RWA Health Economics, Cytel, Inc, Waltham, MA, USA; 6Department of Global Health and Development, London School of Hygiene and Tropical Medicine, London, UK; 7University of the Philippines Open University, Los Baños City, Philippines
Correspondence: Allison Brackley, Cytel, Inc, 1050 Winter Street, Center Entrance 3rd Floor, Waltham, MA, 02451, USA, Tel +1 617 661 2011, Fax +1 617 661 4405, Email [email protected]
Background: The complex nature of asthma has resulted in a poor understanding of its epidemiology, particularly in low-and middle-income countries (LMIC). Clinical subgroups, such as patients with severe asthma, eosinophilic asthma, allergic rhinitis, or nasal polyps, experience additional barriers to care.
Methods: Prevalence estimates for asthma and key clinical subgroups were extracted from the Global Burden of Diseases, Injuries, and Risk Factors Study 2019 and from a targeted literature review conducted through PubMed in October of 2021. National estimates were calculated and the roles of potential explanatory factors were explored through qualitative analysis.
Results: In total, 162 publications from 69 countries were included. Across continents, asthma prevalence values ranged from 3.44% (Asia), 3.67% (Africa), 4.90% (South America), 5.69% (Europe), 8.29% (North America), to 8.33% (Oceania). Globally, of those with asthma, 26.70% had severe asthma, 30.99% had eosinophilic asthma, 48.95% had allergic rhinitis, and 7.0% to 25.40% had nasal polyps. Countries with higher air quality, income status, and healthcare access and quality reported a higher asthma prevalence.
Conclusion: Asthma prevalence values were low in LMICs, potentially indicating health system deficiencies resulting in low diagnosis and reporting. The prevalence of eosinophilic asthma and severe asthma phenotypes was high in many countries, although the prevalence estimates of all asthma subgroups were quite variable.
Keywords: epidemiology, diagnosis, prevalence, low- and middle-income countries
Introduction
Asthma commonly presents as heterogeneous respiratory symptoms such as coughing, wheezing, shortness of breath, and chest tightness, which can complicate the diagnostic process.1 While the use of clinical tests (eg, spirometry) is preferred for asthma diagnosis, real-world practices are heterogeneous and often reflect a lack of resources or medical training, particularly in low-or-middle-income countries (LMIC), although significant variations exist on a within-country scale.1,2 Differences in diagnostic practices can result in underreporting and difficulty interpreting prevalence estimates.1
Aggressive treatment of early-disease asthma and the use of disease-modifying therapies may promote asthma remission.3 Despite evidence that practical remission is a reasonable goal for many patients with asthma, symptom management is the objective most often considered by clinicians for adults. Some subpopulations of patients with asthma, however, face additional challenges in achieving remission, particularly those with certain asthma phenotypes, such as eosinophilic asthma (EA) or severe asthma (SA), and those with additional respiratory conditions, such as allergic rhinitis (AR) or nasal polyps (NP).
EA is characterized by eosinophilia in tissue and sputum and a thickening of the basement membrane.4–6 Some patients with EA respond well to corticosteroids, while others experience improvements in exacerbation frequency, but not symptom intensity.5 Other patients with EA are “steroid-refractory”, or resistant to corticosteroids altogether, and often have better outcomes when treated with leukotriene receptor agonists.5
The European Respiratory Society and American Thoracic Society defines SA as asthma that can only be managed with a high dose of corticosteroids and a secondary controller, or asthma that is uncontrolled even with a high dose of corticosteroids and a secondary controller.7 The prevalence of patients with SA who experience uncontrolled asthma, even when treated with a corticosteroid and secondary controller, was estimated at 12.9% to 100.0% in a recent systematic literature review that also considered patients with moderate asthma.8
Patients with AR experience inflammation of the nasal mucosa following exposure to environmental allergens.9 Common symptoms include sneezing, rhinorrhea, itch, and nasal congestion. AR is usually treated with over-The-counter medication, making prevalence estimations difficult to ascertain.9 AR often exists alongside asthma and worsens asthma symptoms while increasing the frequency of exacerbations and hospital visits.9 Patients with AR often face a higher burden in accessing care, as visits with an ear, nose, and throat specialist or allergist may be required for treatment.9
Asthma may also be accompanied by chronic sinusitis with NPs.10 NPs are hyperplastic, inflammatory outgrowths of the sinonasal mucosa.11 Despite their characterization as benign, the inflammation from NPs can result in disruptive symptoms such as edema, loss of taste and/or smell, and chronic nasal congestion.11
The ongoing effort to improve care and reduce negative health outcomes relies on continually improving the epidemiological knowledge base for asthma and its associated comorbidities. Prevalence data informs the understanding of the clinical and economic burden of disease, while accurate epidemiology measures are used in priority setting by national health programs and medical societies. Despite the ubiquity of asthma and its clinical significance, there remains a need for further understanding of the global distribution of patients with asthma, and prevalence data for key clinical subgroups.
The goal of this study was to determine the global prevalence of asthma and its aforementioned phenotypes (EA and SA), along with the prevalence of asthma with AR or NPs, and to explore underlying drivers for the observed patterns. To do this, we examined the scientific literature for studies reporting asthma and subgroup prevalence, and compared our results to country-specific qualities like economic status and air quality.
Methods
Asthma Prevalence
To facilitate a comparison of asthma prevalence with the prevalence of its key clinical subgroups, asthma prevalence values for 69 countries were taken from the 2019 Global Burden of Disease (GBD) Study, which based its estimates on 405 sources from epidemiological reports and scientific literature.12 Conducted by the World Health Organization (WHO), the 2019 GBD study represents the most complete standardized analysis of asthma incidence and prevalence worldwide. To estimate the prevalence of asthma by continent, asthma prevalence values were used with World Bank estimates of country population using the following equation:13

Please note that all equations used were adapted from the Centers for Disease Control and Prevention (CDC) guide to epidemiological statistics.14
Asthma Subgroup Prevalence
A targeted literature review was conducted in October of 2021 to calculate the prevalence of key subgroups of the asthma population. The search methodology is outlined in Figure S1. Nine key studies with prevalence estimates for clinical subgroups were identified using PubMed (Table S1).15–23 The studies included primarily real-world evidence, along with several reviews, and formed the base of the pearl-growing (ie, snowballing) technique used to find additional sources of the same level of relevance and authority.24 Publications were identified retrospectively (ie, bibliographic) and prospectively (ie, cited by) along with keywords from the nine studies; the process was repeated several times to amass a focused collection of evidence. Additional sources were obtained by using keyword searches of four journals known to publish many epidemiological studies related to asthma: Allergy, BMC Pulmonary Medicine, European Respiratory Journal, and Journal of Allergy and Clinical Immunology Practice. Where available, 10 or more studies were included per country/disease category. The evidence base was built using articles with a substantial discussion of asthma prevalence along with subgroup data. Data on both children and adults were considered. Papers published earlier than 2011, those that lacked extrapolation content, and those that used epidemiology data already encountered in literature were excluded. After gathering several sources for each country and disease category combination, the prevalence estimate (range or point estimate) from the study with the largest number of participants was included in the dataset; this approach was selected because within studies with a valid methodology, studies with a higher number of participants were less likely to report findings influenced by random effects and unmeasured confounders. Where country-specific values were not available, continental values were used.
The following equation was used to calculate the country-specific subgroup prevalence of EA, SA, AR, and NPs where direct prevalence estimates were not available:

To calculate the average prevalence of each subgroup within the population of those with asthma, all ranged values were excluded. A crude average was taken of the remaining values by summing the prevalence values of countries within a continent and dividing them by the number of countries. Some subgroup prevalence values were inflated to match the 2020 country population, using the formula below and country-specific growth rates from the World Bank, where x denotes the year the prevalence value was published:13

Country-Specific Factors Affecting Global Prevalence Distributions
A qualitative analysis was conducted to better detect patterns in prevalence and reporting by country and region. Asthma prevalence values were aggregated according to 2020 Air Quality Index (AQI) values, 2022 World Bank economic status, and 2017 Institute for Health Metrics and Evaluation Healthcare Access and Quality (HAQ) values.13,25,26 Scatterplots were generated to visually identify patterns of high and low prevalence using RStudio©.
Results
Asthma Prevalence
Reported asthma prevalence ranged from 1.43% in Bangladesh to 11.25% in the United States (US) (Figure 1, Table 1). Asia had the lowest reported asthma prevalence of any continental region at 3.44%, as well as the lowest country-specific prevalence value: Bangladesh, at 1.43%. Reported prevalence values in most of the other Asian countries fell between 2% and 4%, with the highest reported prevalence found in the United Arab Emirates (7.55%). Africa had the second-lowest reported prevalence of asthma, at 3.68%; most African countries had a reported asthma prevalence between 3% and 4.5%. South America had an asthma reported prevalence of 5.06%, with most countries reporting values quite close to the regional estimate. The European reported asthma prevalence was 5.86%, with considerable variation across countries; the lowest value was reported in Serbia (3.05%), while the highest was reported in the UK (10.07%). Australia and New Zealand both had relatively high reported asthma prevalence, at 9.66% and 7.00%, respectively. In North America, Canada’s reported asthma prevalence was 5.32%, in line with many South American countries, while the US had the highest reported asthma prevalence in the dataset, at 11.25%.
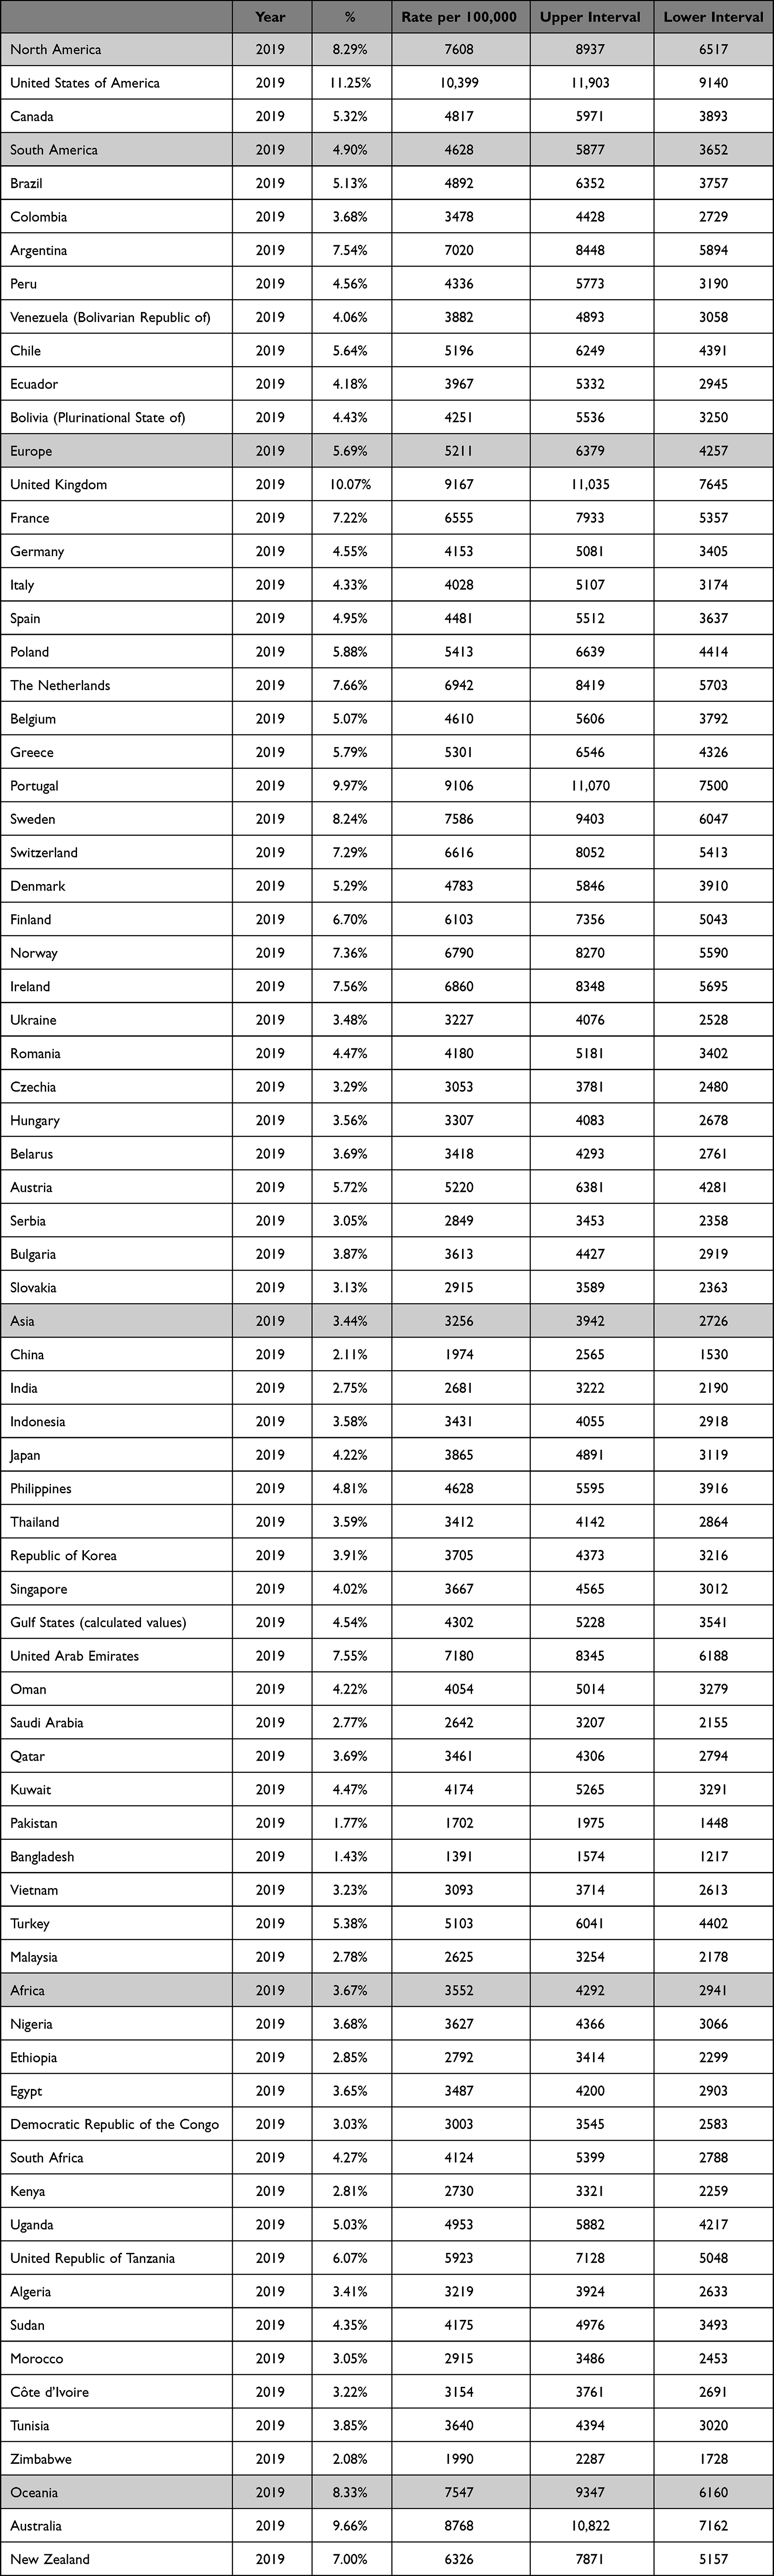 |
Table 1 Annual Asthma Prevalence Rates by Country |
 |
Figure 1 The global prevalence of asthma. |
Asthma Subgroup Prevalence
In total, 162 publications were identified using pearl-growing and targeted search techniques. Globally, of those with asthma, 25.71% reported SA, 30.70% EA, 49.01% AR, and 7.54% NPs (Table 2, Figures S2–S5). The reported prevalence of clinical subgroups was highly variable across countries, especially for AR and EA. The reported prevalence of SA was high in some countries that had a lower reported prevalence of general asthma, such as India (asthma: 2.75%, SA: 50.0%) and Nigeria (asthma: 3.68%, SA: 39.2%).
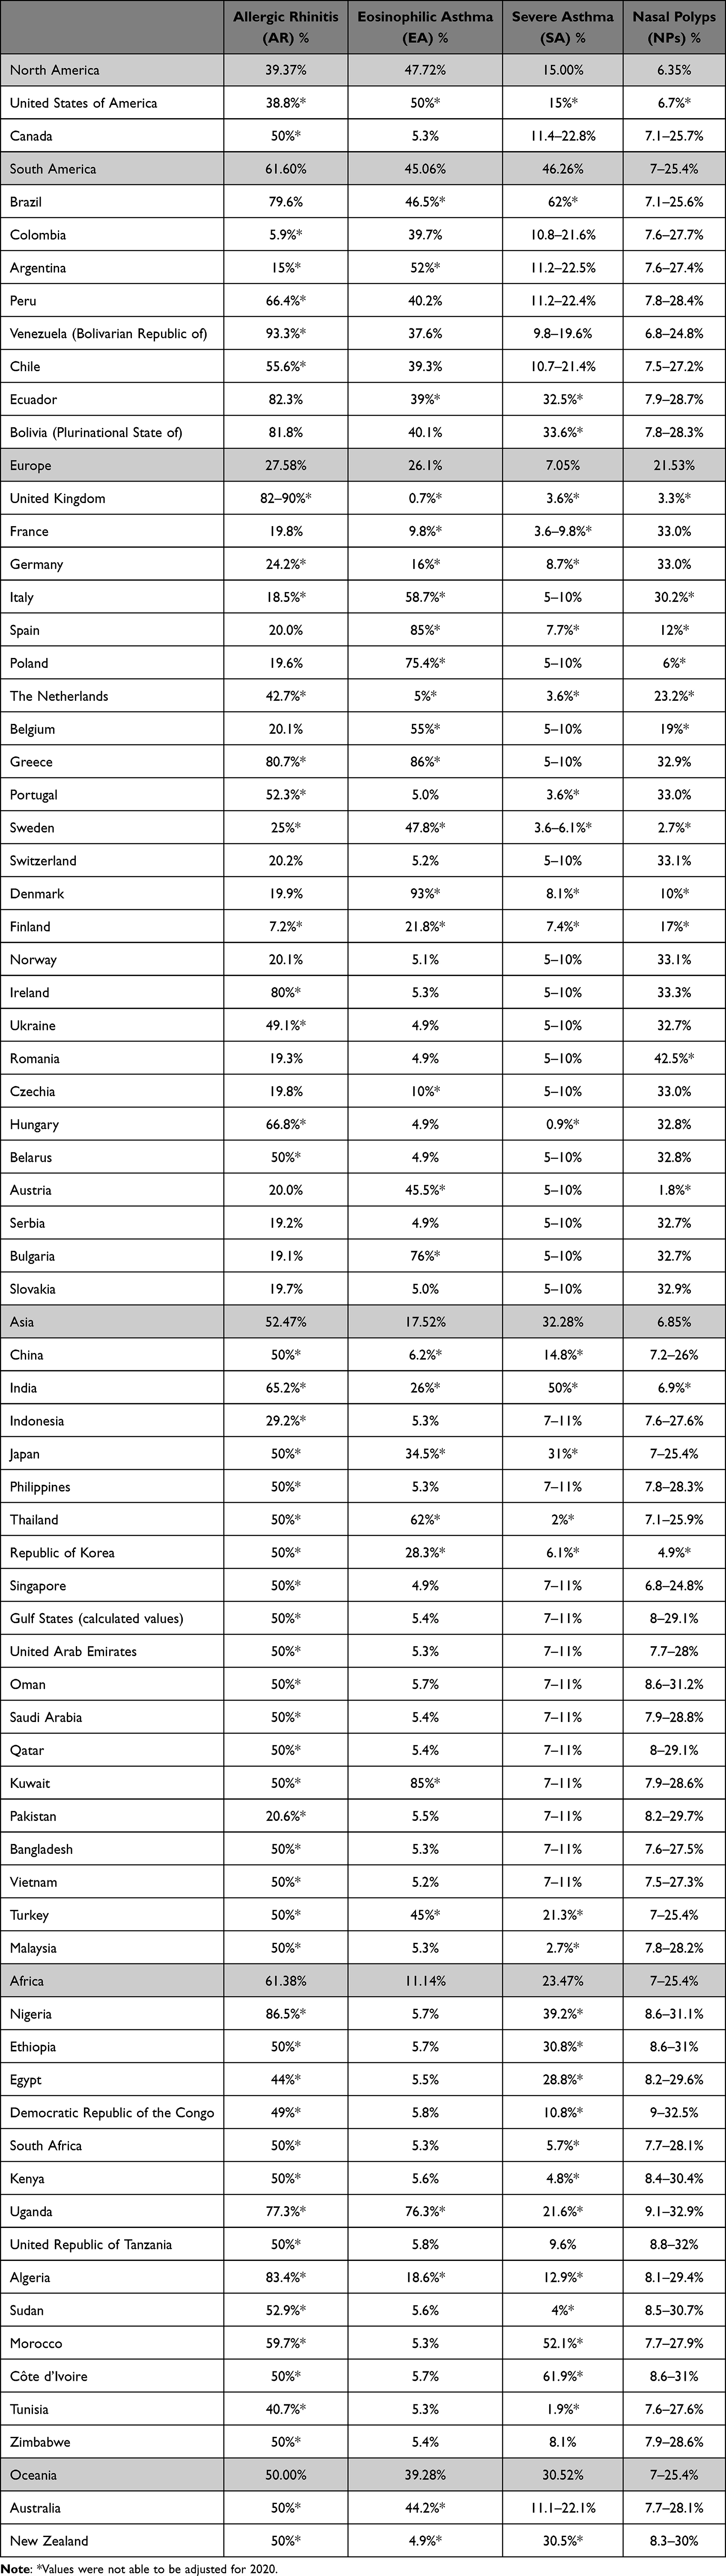 |
Table 2 Global Prevalence Estimates for Key Clinical Subgroups Within Asthma |
Country-Specific Factors Affecting Global Prevalence Distributions
AQI values (higher scores denote worse air quality) ranged from 5 for Finland and Sweden to 77.1 for Bangladesh. AQI values were not reported for 14 countries. HAQ values (higher scores denote better quality) ranged from 40.4 for the Democratic Republic of the Congo to 91.8 for Switzerland. World Bank economic status placed each nation into a discrete category: high (32 countries), upper-middle (16 countries), lower-middle (16 countries), and low (three countries). The economic status of Venezuela was unclassified and no status was reported for Indonesia. The country-specific qualitative analysis of AQI, economic status, and HAQ revealed a pattern of high asthma prevalence in countries with higher income status, better air quality, and better healthcare access and quality (Table 3, Figure 2). The US, United Kingdom (UK), and Australia were strong examples of this trend; all had high asthma prevalence (11.25%, 10.07%, and 9.66% for the US, UK, and Australia, respectively), better air quality scores (AQIs of 9.6, 8.3, and 7.6 respectively), HAQ (81.3, 84.6, and 86.2, respectively), and higher economic status (all high).
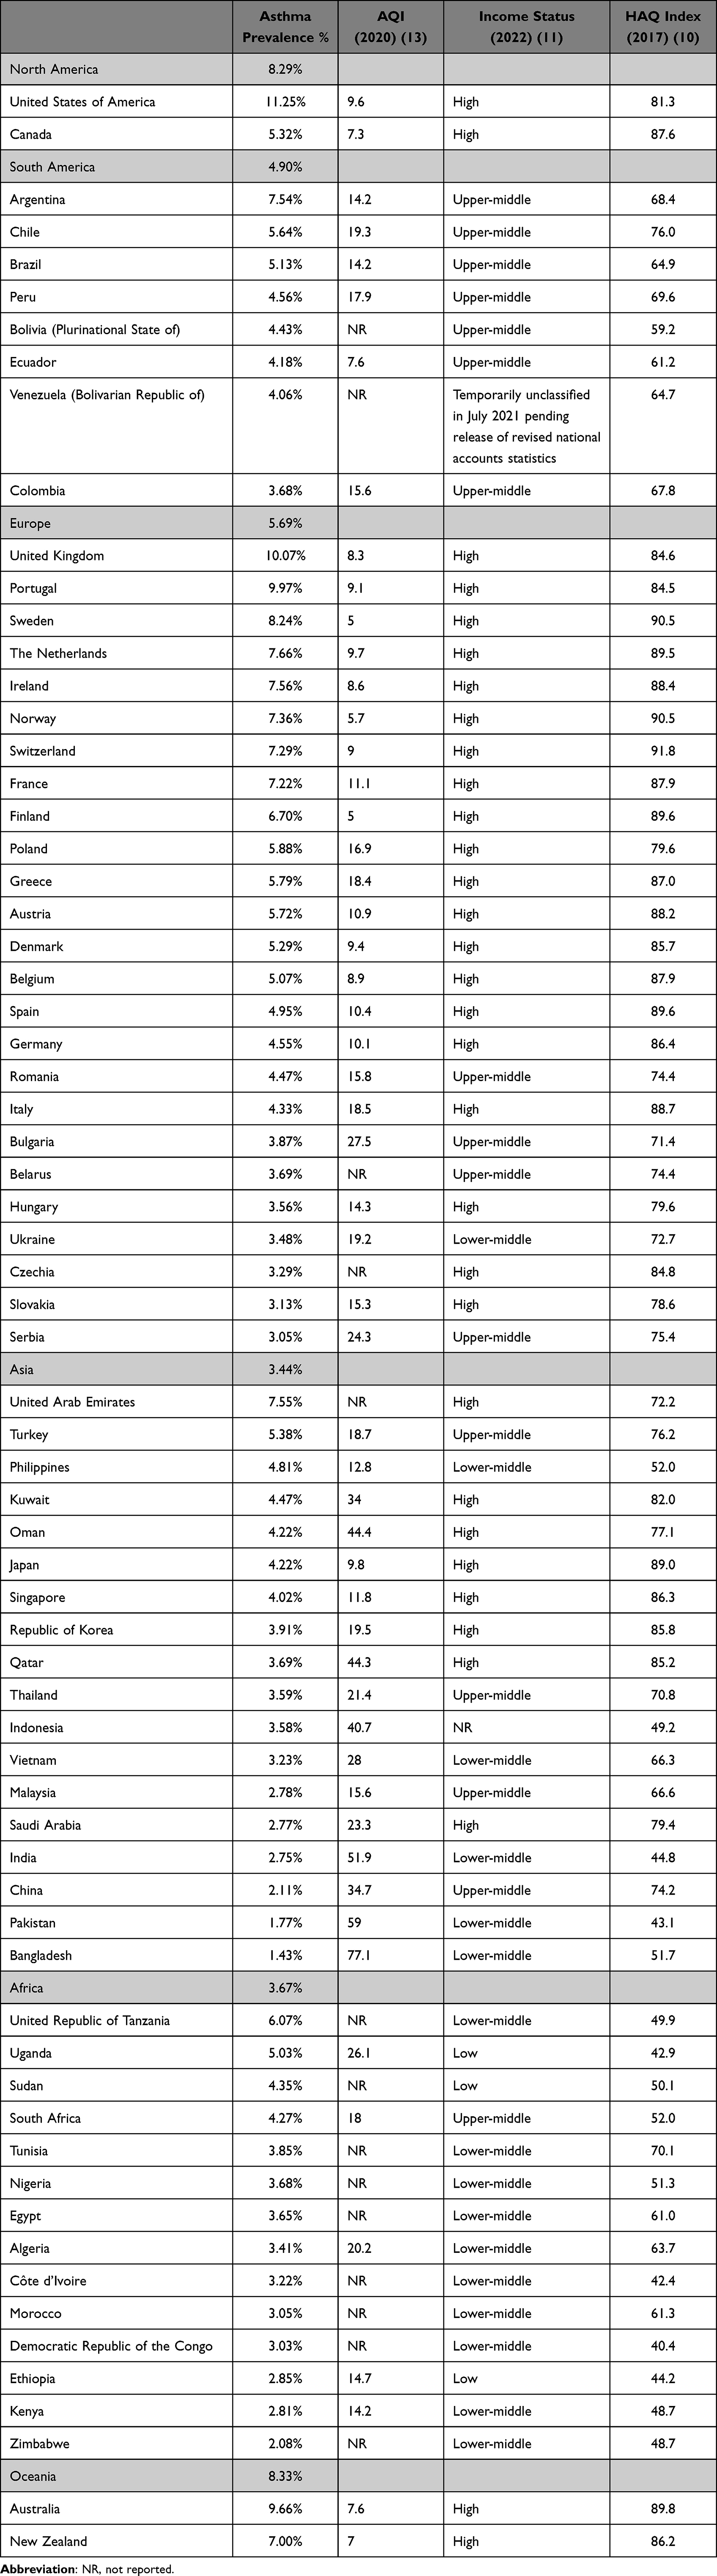 |
Table 3 Qualitative Comparison of Air Quality (AQI), World Bank Income Status, and Healthcare Quality and Access (HAQ) to Global Asthma Prevalence |
 |
Figure 2 Country-specific asthma prevalence by AQI and HAQ. Asthma prevalence is visualized by country AQI (A) and HAQ (B). For (A), AQI values were available for 55 countries. Note that lower values of AQI represent higher air quality. In (B), A total of 69 countries are shown by asthma prevalence and HAQ. A higher HAQ value represents a healthcare system with a higher level of quality and access. |
Discussion
This study presents the available evidence for the reported prevalence of asthma and its key clinical subgroups, adding to the existing epidemiological knowledge of respiratory conditions and revealing variation in the country-specific prevalence of disease.
Data Quality and Asthma Underreporting
The studies included in this review are highly relevant to the topic of reported asthma subgroup prevalence, but it should be noted that most studies had a low sample size (1000 participants or fewer), and some patient populations represented subgroups within the variables of interest—for example, children or adolescents. Furthermore, nearly all the included studies did not have an epidemiological focus, but rather reported the prevalence of clinical subgroups within asthma patients as part of a healthcare-related study. While the identified studies represent the best evidence for the prevalence of key subgroups, they do not represent a methodical sampling. Despite the uncertainty present in our findings, several known factors are likely to have influenced the observed prevalence distribution.
The Role of Healthcare, Access, and Quality (HAQ)
A possible explanation for the reported distribution of asthma prevalence is the level of HAQ across countries. HAQ can be measured using the amenable mortality rate; that is, the rate of mortality from causes that are preventable by effective and available medical treatment. The level of quality and access within healthcare systems is strongly relevant to the understanding of asthma prevalence, as each step of the treatment pathway is complicated by the condition itself. Adequate training in taking patient history, identifying symptom presentation, and selecting and administering clinical tests in practice is required to properly diagnose asthma, yet diagnostic methods are heterogeneous with poor asthma and subgroup reporting. This is especially true in LMICs that often have a lower quality of healthcare and access.27,28 Asia and Africa—both continents with many LMICs—had the lowest asthma prevalence, at 3.44% and 3.67%, respectively. These estimates may be the result of diagnostic and reporting procedures, rather than a smaller population of people with asthma, as described by a recent, large-scale study in Vietnam that found that 27.3% of school children presented with one or more asthma symptoms, but only 8.5% had an asthma diagnosis from a doctor.29 Agarwal et al studied the diagnosis of asthma in four Asian LMICs through a cross-sectional survey and reported that language was a barrier to healthcare access in diverse regions and that the quality of spirometry measurements was difficult to assess in the field.30 The study also found that evaluating patient history, along with the presence of key symptoms (wheezing and chest tightness) was the most reliable method for diagnosing asthma.30 These findings illustrated the difficulty of diagnosing asthma in a low-resource environment, while pointing toward evidence-based clinical adaptations to meet patient needs.
Even in countries with a higher HAQ, clinicians may struggle to diagnose asthma and provide care. A 2014 report from the Royal College of Physicians reviewed 195 asthma deaths that occurred from 2012 to 2013 in the UK, a country with an HAQ of 84.6.12,31 Of the 155 individuals whose asthma severity could be determined, more than half (58%) were being treated for mild or moderate asthma. The study concluded that it was likely that they actually had SA, but were not categorized appropriately by their physician.31 This interpretation is especially troubling as many nations in the current dataset have SA estimates over 20%, and those with SA are at risk for asthma-related death and reduced quality of life. Other studies have reported that the proportion of those with SA appeared to be higher in LMICs; this may be due to the underutilization and inaccessibility of controller medication.32 The highest proportions of people with SA in the current study were Brazil (62.0%), Côte d’Ivoire (61.9%), and Morocco (52.1%).
The Role of Air Quality
Many studies have noted the impact of air quality on respiratory disease on a smaller scale, including Freid et al, who found a positive relationship between childhood asthma incidence and road pollution.33 Although air quality was often noted as an important driver of asthma and other respiratory conditions, the results of the current study did not directly link air quality to asthma prevalence. The country with the highest reported asthma prevalence—the US (11.25%)—had good air quality (9.6 AQI), compared with the country with the lowest reported asthma prevalence—Bangladesh (1.43%)—which had poor air quality (77.1 AQI). This may be due to fine-scale geographical variations in air quality that are not captured by the AQI.34 Additionally, AQI does not capture the presence of household pollution due to the unsafe cooking conditions that are extremely common in many countries.35,36 The discrepancy between reported asthma prevalence and air quality observed in our results may be due in part to the imprecise nature of country-level data.
Potential Connection to the Hygiene Hypothesis
The hygiene hypothesis is a potential explanation for the observed relationship between asthma prevalence and higher AQI, income status, and HAQ. The hygiene hypothesis proposes that early, mild infections are required for optimal development of the immune system and that when children are raised in sterilized environments, away from livestock, soil, and other microbiota, there will be a higher incidence of childhood asthma.37 Since the presence of microbiota in the childhood environment is not commonly measured, country-specific comparisons of asthma and hygiene are difficult to evaluate. Ardura-Garcia et al analyzed 45 studies of the hygiene hypothesis in Latin American cities and found contradictory conclusions—studies that addressed respiratory infections instead of asthma, and others that did not accurately measure childhood exposure.38
Implications of Subgroup Prevalence Distributions
The complexities of asthma likely impacted the prevalence estimates of key clinical subgroups. There was a wide range of reported subgroup prevalence values, particularly for EA and AR. These results reflect the differences in testing and disease definitions across studies, which complicate the interpretation of observed patterns. For example, studies determining the proportion of asthma patients with EA will typically use the blood eosinophil count as a determining factor but may use different cutoffs to differentiate between EA and other asthma phenotypes. Lima-Matos et al used a cutoff of ≥260 cells/mm3 to define EA in Brazil, while a global study by Heaney et al used a complex algorithm that incorporated blood eosinophil count, corticosteroid use, and other factors to detect EA in patient records.15,39 Even within countries, there may be a need to standardize patient diagnosis, as demonstrated by a 2018 study of the diagnosis of allergic disease in the US, which showed that there were highly differential diagnostic practices across US states.2 In particular, AR was diagnosed more frequently in southern states that used less testing and more immunotherapies.2 This variation in diagnosis hinders the identification of key clinical subgroups and obscures the country-specific burden of disease. More accurate prevalence estimates would provide opportunities to improve healthcare infrastructure, for example, identifying areas with extreme unmet need that may be mitigated by environmental or public health initiatives.
Despite the observed variation in subgroup prevalence, some generalizations can be made. AR is a significant subgroup, with regional reported prevalence rates of approximately 20% to 50% across all continents except Africa and South America, which have an estimated AR prevalence of 60%. Global SA reported prevalence is approximately 10% to 20%, with a higher prevalence in some countries with low patient access to controller medication. The reported prevalence of EA was around 5% to 10% globally. The reported global prevalence of NPs was estimated at 6% to 15%.
Improving Asthma Healthcare and Reporting in LMICs
By identifying inadequacies in current healthcare systems, change can be planned and implemented. A systematic literature review of studies conducted in Nigeria, South Africa, and Uganda outlined common reasons for asthma underreporting.40 These included the lack of accessible healthcare, including spirometry testing, low levels of asthma knowledge in the general population, and the lack of healthcare education for clinicians on asthma and relevant clinical guidelines.40 Many of these underlying causes affect similar patterns of underreporting for other chronic diseases, including tuberculosis.41
Several initiatives have been developed to address the need for improved access to asthma care in LMICs. Costa Rica’s National Asthma Program (NAP) was enacted in 2003, and provided training to healthcare practitioners throughout the country.42,43 Following NAP, hospitalizations decreased by 53%, and mortality decreased by 80%.42,43 More recent programs include the Practical Approach to Care Kit (PACK),44 which provides a decisions support tool for clinicians and aims to standardize patient care, and several initiatives sponsored by WHO that include assessment algorithms and reporting tools.45,46
Strengths and Limitations
This study brought together information on the reported prevalence of asthma and asthma subgroups, as well as country-specific variables of AQI, HAQ, and economic status. The targeted searches adhered to the methodical pearl-growing technique to identify the most relevant sources of reported asthma subgroup prevalence.
The main limitation of this study was the paucity of reliable and accurate data, especially for clinical subgroups of asthma in LMICs. These data were based on generally small sample sizes rather than thorough epidemiological sampling. Although the data showed a pattern of less prevalent asthma in LMICs, more research is needed to determine the drivers of this trend.
Conclusion
This study showed that there was a pattern of low reported asthma prevalence values in LMICs, which potentially indicate health system deficiencies resulting in low diagnosis and reporting. The reported prevalence of the EA and SA asthma phenotypes was high in many countries, although the prevalence estimates of all asthma subgroups were quite variable. Existing efforts to standardize healthcare practices, increase access to care, and boost reporting have the potential to reduce the burden of illness in LMICs.
Data Sharing Statement
The corresponding author had access to all data in the study.
Funding
This study was funded by AstraZeneca (Cambridge, UK). AstraZeneca reviewed the publication, without influencing the opinions of the authors, to ensure medical and scientific accuracy, and the protection of intellectual property.
Disclosure
Professor Adrian Paul J Rabe was an employee of AstraZeneca during the conduct of the study. Dr Wei Jie Loke is an external research consultant who received personal fees from AstraZeneca UK, during the conduct of the study. Miss Khushboo Gurjar and Dr Allison Brackley were employees of Cytel Inc at the time of manuscript writing, which was hired by AstraZeneca to perform study analyses and development of this manuscript. The authors report no other conflicts of interest in this work.
References
1. Global Initiative for Asthma – GINA. Global strategy for asthma management and prevention, 2023; 2023. Available from: https://ginasthma.org/wp-content/uploads/2023/07/GINA-2023-Full-report-23_07_06-WMS.pdf.
2. Arianpour K, Svider PF, Yuhan B, Hooda Z, Eloy JA, Folbe AJ. Evolving patterns in the diagnosis and management of allergy-mediated disorders. Int Forum Allergy Rhinol. 2018;8(8):928–933. doi:10.1002/alr.22111
3. Menzies-Gow A, Bafadhel M, Busse WW, et al. An expert consensus framework for asthma remission as a treatment goal. J Allergy Clin Immunol. 2020;145(3):757–765. doi:10.1016/j.jaci.2019.12.006
4. Bakakos P, Loukides S, Bakakos P. Severe eosinophilic asthma. J Clin Med. 2019;8(9):1375. doi:10.3390/jcm8091375
5. Pavord ID. Eosinophilic phenotypes of airway disease. Ann Am Thorac Soc. 2013;10(Suppl):S143–9. doi:10.1513/AnnalsATS.201306-168AW
6. Tota M, Lacwik J, Laska J, Sedek L, Gomulka K. The role of eosinophil-derived neurotoxin and vascular endothelial growth factor in the pathogenesis of eosinophilic asthma. Cells. 2023;12(9):1326. doi:10.3390/cells12091326
7. Holguin F, Cardet JC, Chung KF, et al. Management of severe asthma: a European Respiratory Society/American Thoracic Society guideline. Eur Respir J. 2020;55(1):1900588. doi:10.1183/13993003.00588-2019
8. Czira A, Turner M, Martin A, et al. A systematic literature review of burden of illness in adults with uncontrolled moderate/severe asthma. Respir Med. 2021;191:106670. doi:10.1016/j.rmed.2021.106670
9. Dierick BJH, van der Molen T, Flokstra-de Blok BMJ, et al. Burden and socioeconomics of asthma, allergic rhinitis, atopic dermatitis and food allergy. Expert Rev Pharmacoecon Outcomes Res. 2020;20(5):437–453. doi:10.1080/14737167.2020.1819793
10. Marseglia G, Caimmi S, Marseglia A, et al. Rhinosinusitis and asthma. Int J Immunopathol Pharmacol. 2010;23(1 Suppl):29–31. doi:10.1177/03946320100230S108
11. Toro ED, Portela J. Nasal Polyps. In: StatPearls. StatPearls; 2021.
12. IHME. Global Burden of Disease Study 2019 (GBD 2019) Data Resources. Institute for health metrics and evaluation at the University of Washington; 2021. Available from: http://ghdx.healthdata.org/gbd-2019.
13. World Bank Group. World bank open data. Available from: https://data.worldbank.org/.
14. Centers for Disease Control and Prevention (CDC). Lesson 3: measures of risk; 2023. Available from: https://www.cdc.gov/csels/dsepd/ss1978/lesson3/section2.html#Incidence%20Proportion%20Or%20Risk.
15. Heaney LG, Perez de Llano L, Al-Ahmad M, et al. Eosinophilic and noneosinophilic asthma: an expert consensus framework to characterize phenotypes in a global real-life severe asthma cohort. Chest. 2021;160(3):814–830. doi:10.1016/j.chest.2021.04.013
16. Csoma Z, Gál Z, Gézsi A, Herjavecz I, Szalai C. Prevalence and characterization of severe asthma in Hungary. Sci Rep. 2020;10(1):9274. doi:10.1038/s41598-020-66445-4
17. Dhar R, Ip M, Kulkarni T, et al. Challenges faced in managing adult asthma: a perspective from Asian countries. Respirology. 2020;25(12):1235–1242. doi:10.1111/resp.13935
18. Pembrey L, Brooks C, Mpairwe H, et al. Asthma inflammatory phenotypes on four continents: most asthma is non-eosinophilic. Int J Epidemiol. 2022;52(2):611–623. doi:10.1093/ije/dyac173
19. Sullivan AA, Kushnir NM, Scarupa MD, Chase C, Kaliner MA, Faaaai M. In-depth review of allergic rhinitis. World Allergy Organization; 2020. Available from: https://www.worldallergy.org/education-and-programs/education/allergic-disease-resource-center/professionals/in-depth-review-of-allergic-rhinitis.
20. Bedolla-Barajas M, Raúl Ortiz-Peregrina J, Daniel Hernández-Colín D, Morales-Romero J, Ramses Bedolla-Pulido T, Larenas-Linnemann D. The characterization of asthma with blood eosinophilia in adults in Latin America. J Asthma. 2019;56(11):1138–1146. doi:10.1080/02770903.2018.1520863
21. Selroos O, Kupczyk M, Kuna P, et al. National and regional asthma programmes in Europe. Eur Respir J. 2015;24(137):474–483. doi:10.1183/16000617.00008114
22. Adeloye D, Chan KY, Rudan I, Campbell H. An estimate of asthma prevalence in Africa: a systematic analysis. Croat Med J. 2013;54(6):519–531. doi:10.3325/cmj.2013.54.519
23. Ahmadiafshar A, Farjd HR, Moezzi F, Mousavinasab N. Nasal polyposis in patients with asthma and allergic rhinitis. J Laryngol Otol. 2012;126(8):780–783. doi:10.1017/S0022215112000771
24. Booth A. Searching for qualitative research for inclusion in systematic reviews: a structured methodological review. Syst Rev. 2016;5(1):74. doi:10.1186/s13643-016-0249-x
25. IQAir. World’s most polluted countries 2020. Available from: https://www.iqair.com/ca/world-most-polluted-countries.
26. Global Burden of Disease Collaborative Network. Data From: Global Burden of Disease Study 2015 (GBD 2015) Healthcare Access and Quality Index Based on Amenable Mortality 1990–2015. United States: Seattle; 2017.
27. Devi R, Kanitkar K, Narendhar R, Sehmi K, Subramaniam K. A narrative review of the patient journey through the lens of non-communicable diseases in low- and middle-income countries. Adv Ther. 2020;37(12):4808–4830. doi:10.1007/s12325-020-01519-3
28. Meghji J, Mortimer K, Agusti A, et al. Improving lung health in low-income and middle-income countries: from challenges to solutions. Lancet. 2021;397(Mar 6):928–940. doi:10.1016/S0140-6736(21)00458-X
29. Le HHTC, Le An P, Vinh NN, et al. Burden of asthma-like symptoms and a lack of recognition of asthma in Vietnamese children. J Asthma. 2023;60(3):516–524. doi:10.1080/02770903.2022.2066002
30. Agarwal D, Hanafi NS, Khoo EM, et al. Predictors for detecting chronic respiratory diseases in community surveys: a pilot cross-sectional survey in four South and South East Asian low- and middle-income countries. J Glob Health. 2021;11:04065. doi:10.7189/jogh.11.04065
31. The National Review of Asthma Deaths (NRAD). Why asthma still kills; 2014. Available from: https://www.asthma.org.uk/globalassets/campaigns/nrad-executive-summary.pdf.
32. Cruz AA, Stelmach R, Ponte EV. Asthma prevalence and severity in low-resource communities. Curr Opin Allergy Clin Immunol. 2017;17(3):188–193. doi:10.1097/ACI.0000000000000360
33. Freid RD, Qi YS, Espinola JA, et al. Proximity to major roads and risks of childhood recurrent wheeze and asthma in a severe bronchiolitis cohort. Int J Environ Res Public Health. 2021;18(8):4197. doi:10.3390/ijerph18084197
34. IQAir. World air quality report; 2021. Available from: https://www.iqair.com/assets/svg/ic-download.svg.
35. Simkovich SM, Goodman D, Roa C, et al. The health and social implications of household air pollution and respiratory diseases. NPJ Prim Care Respir Med. 2019;29(1):12. doi:10.1038/s41533-019-0126-x
36. Smith K, Pillarisetti A. Household Air Pollution from Solid Cookfuels and Its Effects on Health. Chapter 7: Injury Prevention and Environmental Health. The International Bank for Reconstruction and Development / The World Bank; 2017.
37. Weber J, Illi S, Nowak D, et al. Asthma and the hygiene hypothesis. Does cleanliness matter? Am J Respir Crit Care Med. 2015;191(5):522–529. doi:10.1164/rccm.201410-1899OC
38. Ardura-Garcia C, Garner P, Cooper PJ. Is childhood wheeze and asthma in Latin America associated with poor hygiene and infection? A systematic review. BMJ Open Respir Res. 2018;5(1):e000249. doi:10.1136/bmjresp-2017-000249
39. Lima-Matos A, Ponte EV, de Jesus JPV, et al. Eosinophilic asthma, according to a blood eosinophil criterion, is associated with disease severity and lack of control among underprivileged urban Brazilians. Respir Med. 2018;145:95–100. doi:10.1016/j.rmed.2018.10.025
40. Magwenzi P, Rusakaniko S, Sibanda EN, Gumbo FZ. Challenges in the diagnosis of asthma in children, what are the solutions? A scoping review of 3 countries in sub Saharan Africa. Respir Res. 2022;23(1):254. doi:10.1186/s12931-022-02170-y
41. Linn AR, Dubois MM, Steenhoff AP. Under-reporting of tuberculosis disease among children and adolescents in low and middle-income countries: a systematic review. Trop Med Infect Dis. 2023;8(6):300.
42. Soto-Martinez ME, Soto-Quiros ME, Custovic A. Childhood asthma: low and middle-income countries perspective. Acta Med Acad. 2020;49(2):181–190. doi:10.5644/ama2006-124.296
43. Soto-Martínez M, Avila L, Soto N, Chaves A, Celedón JC, Soto-Quiros ME. Trends in hospitalizations and mortality from asthma in Costa Rica over a 12- to 15-year Period. J Allergy Clin Immunol. 2014;2(1):85–90. doi:10.1016/j.jaip.2013.09.010
44. Cornick R, Picken S, Wattrus C, et al. The Practical Approach to Care Kit (PACK) guide: developing a clinical decision support tool to simplify, standardise and strengthen primary healthcare delivery. BMJ Glob Health. 2018;3(Suppl 5):e000962. doi:10.1136/bmjgh-2018-000962
45. World Health Organization. WHO Package of Essential Noncommunicable (PEN) disease interventions for primary health care; 2020. Available from: www.who.int/publications/i/item/who-package-of-essential-noncommunicable-(pen)-disease-interventions-for-primary-health-care.
46. World Health Organization. IMAI district clinician manual: hospital care adolescents and adults: guidelines for the management of illnesses with limited-resources; 2012. Available from: https://apps.who.int/iris/handle/10665/77751.
 © 2023 The Author(s). This work is published and licensed by Dove Medical Press Limited. The
full terms of this license are available at https://www.dovepress.com/terms
and incorporate the Creative Commons Attribution
- Non Commercial (unported, 3.0) License.
By accessing the work you hereby accept the Terms. Non-commercial uses of the work are permitted
without any further permission from Dove Medical Press Limited, provided the work is properly
attributed. For permission for commercial use of this work, please see paragraphs 4.2 and 5 of our Terms.
© 2023 The Author(s). This work is published and licensed by Dove Medical Press Limited. The
full terms of this license are available at https://www.dovepress.com/terms
and incorporate the Creative Commons Attribution
- Non Commercial (unported, 3.0) License.
By accessing the work you hereby accept the Terms. Non-commercial uses of the work are permitted
without any further permission from Dove Medical Press Limited, provided the work is properly
attributed. For permission for commercial use of this work, please see paragraphs 4.2 and 5 of our Terms.
Recommended articles
Prevalence and Characterisation of Patients with Asthma According to Disease Severity in Portugal: Findings from the EPI-ASTHMA Pilot Study
João C, Jácome C, Brito D, Teixeira P, Quelhas-Santos J, Amorim L, Barbosa MJ, Bulhões C, Lopes F, Pardal M, Bernardo F, Fonseca JA, Correia de Sousa J
Journal of Asthma and Allergy 2022, 15:1441-1453
Published Date: 19 October 2022
Epidemiology of Disorders Associated with Short Stature in Childhood: A 20-Year Birth Cohort Study in Finland
Harju S, Saari A, Sund R, Sankilampi U
Clinical Epidemiology 2022, 14:1205-1214
Published Date: 26 October 2022
Epidemiology of Gastrointestinal Parasites of Cattle in and Around Hosanna Town, Southern Ethiopia
Tiele D, Sebro E, H/Meskel D, Mathewos M
Veterinary Medicine: Research and Reports 2023, 14:1-9
Published Date: 17 January 2023
Prevalence, General and Periodontal Risk Factors of Gastroesophageal Reflux Disease in China
Liu Z, Gao X, Liang L, Zhou X, Han X, Yang T, Huang K, Lin Y, Deng S, Wang Z, Wang C
Journal of Inflammation Research 2023, 16:235-244
Published Date: 17 January 2023
Underdiagnosis of COPD: The Japan COPD Real-World Data Epidemiological (CORE) Study
Koga Y, Deguchi S, Matsuo T, Suzuki A, Terashima G, Tajima T, Shibata Y, Sagara H
International Journal of Chronic Obstructive Pulmonary Disease 2024, 19:1011-1019
Published Date: 7 May 2024