Back to Journals » Journal of Inflammation Research » Volume 19
Preoperative Prediction of High Mitotic Count in Gastrointestinal Stromal Tumors Using CT Features and Serologic Indicators: An Interpretable Model with Multicenter External Validation
Authors Ren Y ![]() , Deng F, Guo X, Fan Y, Yang Y, Jin Y, Sun W, Luo K, Liu Z, Wang H
, Deng F, Guo X, Fan Y, Yang Y, Jin Y, Sun W, Luo K, Liu Z, Wang H ![]() , Cao Q, Hou J, Li S
, Cao Q, Hou J, Li S ![]() , Wang J, Dong Y, Zhang G
, Wang J, Dong Y, Zhang G
Received 21 January 2026
Accepted for publication 17 April 2026
Published 16 May 2026 Volume 2026:19 593404
DOI https://doi.org/10.2147/JIR.S593404
Checked for plagiarism Yes
Review by Single anonymous peer review
Peer reviewer comments 3
Editor who approved publication: Dr Felix Marsh-Wakefield
Yingzheng Ren,1 Fuyang Deng,1 Xiangge Guo,2 Yafei Fan,2 Yang Yang,3 Yuzhu Jin,1 Wei Sun,1 Kai Luo,1 Zhangxu Liu,1 Hao Wang,1 Qian Cao,1 Jia Hou,1 Shengze Li,4 Jinjun Wang,2 Yonghong Dong,3 Guixin Zhang1
1Department of Pancreatobiliary Endoscopic Surgery, The Second Hospital of Dalian Medical University, Dalian, 116011, People’s Republic of China; 2Department of Radiology, Yuncheng Central Hospital Affiliated to Shanxi Medical University, Yuncheng, 044000, People’s Republic of China; 3Department of Gastrointestinal, Pancreatic, Hernia and Abdominal Wall Surgery, Shanxi Provincial People’s Hospital, Taiyuan, 030012, People’s Republic of China; 4Department of General Surgery, The Second Hospital of Shanxi Medical University, Taiyuan, 030001, People’s Republic of China
Correspondence: Guixin Zhang, Department of Pancreatobiliary Endoscopic Surgery, The Second Hospital of Dalian Medical University, Dalian, 116011, People’s Republic of China, Email [email protected]
Background: Accurate preoperative identification of high mitotic count is important for risk stratification in gastrointestinal stromal tumors (GISTs), yet biopsy is invasive and conventional imaging alone does not directly reflect microscopic proliferative activity. We aimed to develop and externally validate an interpretable model integrating CT features and serologic indicators.
Methods: This multicenter retrospective study included 802 patients from three Shanxi hospitals, randomly split into a training cohort (n = 562) and an internal validation cohort (n = 240), plus an external validation cohort from Dalian (n = 255). LASSO and multivariable logistic regression were used for feature selection and nomogram construction. Five individual machine-learning models and 31 stacking ensembles were trained, and SHAP was used to interpret model behavior.
Results: Tumor size, liquefaction/necrosis, coarse vessel sign, peritumoral fat stranding, platelet-to-lymphocyte ratio, and albumin-to-fibrinogen ratio were independent predictors of high mitotic count. Among individual models, SVM achieved the highest internal-validation AUC (0.866). The best stacking model (SVM+ANN+Logit) reached an AUC of 0.867 on internal validation and 0.955 on external validation, with good calibration and favorable decision-curve performance. The gain over the best single model was small but consistent.
Conclusion: An interpretable model combining CT and serologic features may provide a practical non-invasive tool for preoperative estimation of mitotic count in GISTs. Prospective validation is still needed before routine clinical implementation. The flowchart illustrates the process of patient data collection and model development for a study on gastrointestinal stromal tumors. Patients were collected from three hospitals between January 2017 and January 2025. After screening, 802 patients were included and divided into a training set of 562 patients and an internal validation set of 240 patients, with subgroups defined by mitotic index > 5/50 HPFs and ≤ 5/50 HPFs. An external test set from another hospital included 255 patients. The workflow shows variable selection using LASSO and multivariable logistic regression, followed by the development of a logistic regression-based nomogram model and several machine learning models, including XGBoost, LightGBM, Random Forest, SVM, and ANN. Model performance was compared, and a stacking ensemble model was established. SHAP analysis was also included for model interpretation.GIST study workflow: data collection, model development, performance comparison, and SHAP interpretation.
Keywords: gastrointestinal stromal tumors, mitotic count, stacking ensemble learning, computed tomography, serological indicators, risk stratification
Introduction
Gastrointestinal stromal tumors (GISTs) are the most common mesenchymal neoplasms of the digestive tract, originating from the interstitial cells of Cajal. They show marked heterogeneity in biological behavior, ranging from indolent growth to highly aggressive phenotypes.1 An epidemiological study covering 19 countries reported an incidence of 10–15 cases per million population; in China the incidence is higher, reaching 19–22 cases per million annually, with the peak age of onset typically between 60 and 70 years.2 Studies indicate that 81.3% of patients present with related symptoms at diagnosis, while 18.7% are discovered incidentally without apparent discomfort.2,3 For patients with localized GIST, achieving R0 resection remains the first-line treatment strategy.4 Notably, despite significant intertumoral heterogeneity, all GISTs carry inherent potential for recurrence and metastasis depending on the characteristics of the primary tumor.5 According to the NCCN Guidelines (2022), the overall postoperative recurrence rate for GIST is approximately 30%–40%, and can be as high as 50% in high-risk patients. Tumor size, mitotic count, and primary tumor location are the primary determinants of recurrence risk.4 Drug resistance is also a core challenge: although several generations of tyrosine kinase inhibitors are available, about 40%–50% of patients develop secondary KIT/PDGFRA mutations and resistance within 18–24 months of treatment.6
Mitotic count is a direct quantitative indicator of tumor proliferative activity and thus reflects the rate of tumor cell division. Li et al7 confirmed that appropriate preoperative therapy can reduce tumor size to improve resectability and, by modulating tumor biology, decrease the mitotic count—thereby reducing the risks of drug resistance and postoperative recurrence. Other studies investigating the relationship between neoadjuvant therapy efficacy and risk stratification in GIST found that low-risk patients derive limited benefit from neoadjuvant therapy, and unnecessary drug exposure may increase the risk of resistance; by contrast, high-risk patients can benefit substantially, with highly proliferative clones being preferentially eliminated, mitotic count reduced, risk category downstaged, and ultimately incidence of drug resistance and recurrence lowered.8,9 These findings collectively emphasize that accurate preoperative prediction of mitotic count and precise risk stratification are essential to develop individualized treatment strategies and maximize therapeutic benefit for GIST patients.
Currently, preoperative prediction of mitotic count in GIST still lacks practical and robust tools. Most existing models rely on traditional logistic regression or nomograms, which are typically limited to single-modality feature sets, failing to fully leverage routinely available preoperative laboratory and imaging data for a comprehensive evaluation of associations with mitotic count. To address this, the present study integrates preoperative serological indicators with CT features to construct a comprehensive and reliable predictive model for GIST mitotic count. To our knowledge, stacking ensemble learning combined with SHAP-based interpretability has not been widely applied to preoperative prediction of mitotic count in GISTs.
Therefore, this study aims to (1) develop six independent machine learning models and 31 Stacking ensemble models, and (2) integrate preoperative serological indicators with CT features to identify the optimal Stacking ensemble model for accurately predicting mitotic count in gastrointestinal stromal tumors, thereby providing a reliable basis for preoperative risk stratification.
Methods
Study Design
This retrospective multicenter study screened 1057 eligible patients treated between January 2017 and January 2025. Cases were retrospectively identified from the surgical and pathology databases of the Second Hospital of Dalian Medical University (n = 255) and three hospitals in Shanxi Province (n = 802): Shanxi Provincial People’s Hospital (n = 305), the Second Hospital of Shanxi Medical University (n = 278), and Yuncheng Central Hospital Affiliated to Shanxi Medical University (n = 219). All included cases underwent surgery and had postoperative pathological confirmation of primary GIST. The three Shanxi cohorts were used for model development and internal validation, whereas the Dalian cohort served as an external validation set. Because the study was retrospective and no prospective screening log was maintained, strict consecutiveness could not be fully verified, and some selection bias may remain. The overall workflow combined conventional statistics, machine learning, stacking, and SHAP-based interpretation.
Ethical Approval
This study is a multicenter retrospective clinical study approved by the Clinical Research Management Committee of the lead center, The Second Hospital of Dalian Medical University (Approval No.: Dayieryuanlinshen [2025] No. 238). As it uses only de-identified historical clinical data with minimal risk to participants, informed consent was waived by the committee. All procedures followed the Declaration of Helsinki and relevant national regulations. Patient data were anonymized before analysis to protect privacy and confidentiality.
Data Collection
Inclusion Criteria: ① Availability of complete clinicopathological data with postoperative pathological confirmation of GIST; ② Undergone radical surgical resection; ③ Preoperative abdominal non-contrast and contrast-enhanced CT scans with complete and available data; ④ Availability of serological test results within one week preoperatively, including at minimum complete blood count, liver function, and coagulation profile; ⑤ No prior treatments before surgery.
Exclusion Criteria: ① Missing clinical, pathological, imaging, or serological data; ② Presence of metastatic or recurrent GIST, concurrent other active malignancies, severe infections, or autoimmune diseases that may significantly interfere with serological indicators; ③ Patients with tumor rupture.
Standardization of CT Imaging, Serological Testing, and Mitotic Count
This study used retrospective data that had already been generated in routine practice. Therefore, “standardization” in the present study refers to harmonized retrospective reassessment and data abstraction rather than prospective unification of image acquisition across centers. Before centralized data extraction and review, the investigators developed a unified case-report form and prespecified definitions for all imaging, serological, and pathological variables. These harmonized criteria were then applied consistently to archived CT images, laboratory records, and pathology reports from all participating centers.
The collected clinical characteristics included patient age and sex. CT features were retrospectively reassessed from archived contrast-enhanced studies according to the predefined imaging checklist by investigators with radiologic expertise, and discrepant readings were resolved by consensus when needed. Because postoperative pathology was an inclusion criterion, reviewers were aware that the lesions were GISTs; however, mitotic-count grouping was not used as a reference during imaging feature scoring. Formal interobserver agreement statistics were not prospectively recorded, and kappa/ICC values were therefore unavailable. Imaging evaluation was primarily based on contrast-enhanced CT findings, encompassing tumor location, boundary characteristics, calcification patterns, size measurement, liquefaction or necrosis, morphological features, growth pattern, ulceration, enhancement pattern and degree, the “coarse vessel” sign, and the status of peritumoral fat stranding. Tumor location was categorized as gastric or non-gastric (eg, duodenum, jejunum, ileum, colon, esophagus, omentum). Boundaries were classified as well-defined or ill-defined. Calcification was defined as an intralesional attenuation measurement exceeding 120 Hounsfield Units (HU). The maximum tumor diameter was measured on axial, coronal, and sagittal images, and the average of two maximum measurements (in millimeters) was recorded, categorized as ≤2 cm, 2–5 cm, 5–10 cm, and >10 cm. Liquefaction was characterized by an attenuation of −20 to 20 HU on non-contrast images; both liquefaction and necrosis showed no enhancement on contrast-enhanced scans. Morphological features were classified as regular (smooth margins, round or oval shape) or irregular (lobulated or uneven margins). Growth patterns were categorized as intraluminal, extraluminal, or mixed. Ulceration was identified by an uneven tumor surface with local tissue discontinuity forming a significant defect area. Enhancement degree during the portal venous phase was classified as mild (≤ muscle), moderate (between muscle and liver), or marked (≥ liver), based on a comparison of lesion CT attenuation with that of liver and muscle tissue. The enhancement pattern was classified as homogeneous or heterogeneous. The “coarse vessel” sign referred to the presence of visible dilated feeding or draining vessels around the tumor and was recorded as present or absent. Peritumoral fat stranding is normally well-defined; when affected by tumor growth or invasion, adjusted window settings revealed heterogeneous fat density or stranding, classified in this study as clear or blurred.
Collection of Serological Indicators: Blood samples were collected from fasting patients in the morning within 7 days prior to surgical tissue sampling at each center. For biochemical testing, serum was separated using coagulation-promoting tubes after centrifugation (≥1500 g for 10–15 minutes) post 30–60 minutes at room temperature. For coagulation testing, plasma was obtained using 3.2% sodium citrate anticoagulant tubes (ensuring a 9:1 blood-to-anticoagulant ratio) within 1 hour of collection. Complete blood count was performed using K2-EDTA tubes and analyzed within 2 hours of collection. All testing followed the standard operating procedures of the respective centers and was executed within a unified operational framework. Biochemical enzyme assays employed the IFCC recommended method (37°C), fibrinogen was measured by the Clauss method, and the International Normalized Ratio was calibrated and traceable to the International Sensitivity Index at each center.
Indicator Calculation: To comprehensively assess systemic inflammation, immune function, and nutritional status, the following six hematological derived indices were calculated: Platelet-to-Lymphocyte Ratio (PLR): Peripheral blood platelet count divided by lymphocyte count (both in ×109/L). Monocyte-to-Lymphocyte Ratio (MLR): Peripheral blood monocyte count divided by lymphocyte count (both in ×109/L). Systemic Immune-Inflammation Index (SII): Peripheral blood platelet count × neutrophil count / lymphocyte count (all in ×109/L). Albumin-to-Fibrinogen Ratio (AFR): Serum albumin concentration divided by fibrinogen concentration (both in g/L). Prognostic Nutritional Index (PNI): Serum albumin concentration (g/L) × 0.1 + peripheral lymphocyte count (×109/L) × 5. Advanced Lung Cancer Inflammation Index (ALI): Serum albumin concentration (g/L) × peripheral lymphocyte count (×109/L) / peripheral blood neutrophil count (×109/L). All calculations ensured consistent units for numerators and denominators, resulting in dimensionless values.
Pathological Data: Mitotic counts were extracted from final postoperative pathology reports. According to the modified NIH 2008 criteria, mitotic counts were assessed microscopically in tumor-rich areas with typical morphology over 50 high-power fields (HPFs). Based on this, GISTs were dichotomized into two groups: low mitotic count (≤5/50 HPFs) and high mitotic count (>5/50 HPFs). Because a centralized repeat count was not performed within the present study, the reproducibility of mitotic counting could not be quantified.
Statistical Analysis
Mitotic count was dichotomized as ≤5 versus >5 per 50 high-power fields (HPFs). In the development dataset, 180/562 (32.0%) patients in the training cohort and 74/240 (30.8%) in the internal validation cohort had high mitotic count; in the external validation cohort, 64/255 (25.1%) had high mitotic count. All analyses were performed in R version 4.5.1 using packages including missForest, caret, glmnet, autoReg, tableone, and rms. In preprocessing, categorical variables were encoded as factors while continuous variables remained numeric. Missing values were imputed with missForest, and the Shanxi cohort was stratified by outcome and randomly split into training and internal validation sets at a 7:3 ratio (562/240). Baseline characteristics were compared between outcome groups within the training set and between the training and validation sets using the tableone package. Because this was a retrospective study, no formal a priori sample-size calculation was performed. Instead, sample adequacy was assessed according to the events-per-variable (EPV) principle to ensure that the number of outcome events was sufficient for the candidate predictors included in the model.
Predictors in the training set were standardized prior to variable selection using Least Absolute Shrinkage and Selection Operator (LASSO) regression. The optimal λ value was determined via ten-fold cross-validation, and the corresponding validation curve was plotted. Variables selected by LASSO were subsequently included in univariate and multivariate logistic regression models to calculate odds ratios (ORs) and 95% confidence intervals (CIs). A nomogram was developed based on the multivariate model to provide individualized prediction probabilities. All statistical tests were two-sided, with a significance level set at α = 0.05.
Using the training and internal validation sets partitioned in R, subsequent analyses were carried out in Python 3.13.5. Multiple supervised learning models were developed and compared, including logistic regression, random forest, XGBoost, LightGBM, SVM, and ANN. Models were trained on the training set and evaluated on the internal validation set. Key Python libraries used included scikit-learn, xgboost, lightgbm, missforest, shap, scipy, and matplotlib. For the six final features, a logistic regression classifier was trained using L2 regularization with a regularization strength of C = 1, the liblinear solver, and a maximum of 1000 iterations to ensure convergence. For the calculation of threshold-dependent performance metrics, predicted probabilities were converted to binary class labels using a prespecified default threshold of 0.50. No additional data-driven threshold optimization was performed, as the primary objective of this study was to compare the discrimination performance of different models, with AUC prespecified as the main metric for model evaluation.
Data Preprocessing
Data cleaning and preprocessing included standardization and conversion of textual descriptors into numeric codes to ensure data quality and accuracy. Continuous variables were retained in their original numeric form. Categorical variables were encoded as follows: sex (male = 1; female = 0); tumor size (≤2 cm = 1; 2–5 cm = 2; 5–10 cm = 3; >10 cm = 4); tumor location (gastric = 1; non-gastric = 2); boundary (well-defined = 0; ill-defined = 1); ulceration, calcification, liquefaction/necrosis, and coarse-vessel sign (yes = 1; no = 0); morphology (regular = 0; irregular = 1); growth pattern (intraluminal = 1; extraluminal = 2; mixed = 3); enhancement pattern (homogeneous = 0; heterogeneous = 1); enhancement degree (mild = 1; moderate = 2; marked = 3); peritumoral fat stranding (clear = 0; blurred = 1); and mitotic count (≤5/50 HPFs = 0; >5/50 HPFs = 1). Patients with more than 20% missing data were excluded from the analysis. Ordinal encoding reflected prespecified clinical ordering, although this approach may not fully capture non-linear between-category effects.
Development of Individual Machine Learning Models
First, LASSO penalized regression was employed for feature selection, with the optimal penalty parameter (λ) determined via cross-validation to compress redundant features. Subsequently, the selected variables were incorporated into a multivariate logistic regression analysis to further identify independent risk factors associated with a high mitotic count in GISTs. Based on the final set of variables, a nomogram prediction model was constructed using the rms package and subjected to internal validation.
Concurrently, we developed five individual machine learning models for the same prediction task, including SVM, XGBoost, LightGBM, RF, and ANN. To enhance reproducibility, the hyperparameter search spaces prespecified in the Python implementation were as follows: for SVM, C = {1, 2}, kernel = {linear, rbf, poly}, gamma = {scale, auto, 0.01, 0.02}, and degree = {2, 3} for the polynomial kernel; for XGBoost, learning_rate = {0.04, 0.05, 0.06}, max_depth = {1, 2}, n_estimators = {50, 80}, subsample = {0.6, 0.7, 0.8, 0.9}, gamma = {0.9, 1.0}, and colsample_bytree = {0.5, 0.6}, with reg_alpha = 12 and reg_lambda = 18 fixed; for LightGBM, learning_rate = {0.10, 0.12}, max_depth = {1, 2}, num_leaves = {3, 4}, min_child_samples = {20, 30}, n_estimators = {50, 100}, subsample = {0.7, 0.8}, and colsample_bytree = {0.7, 0.8}, with reg_alpha = 6 and reg_lambda = 10 fixed; for RF, n_estimators = {25}, max_features = {2}, max_depth = {3, 4}, min_samples_split = {15, 17}, and ccp_alpha = {0.012, 0.013, 0.015}; and for ANN, hidden_layer_sizes = {(50, 50), (75, 75), (100, 100), (50, 50, 50), (125, 125, 125)} and activation = {relu, tanh, logistic}, with alpha = 0.0001, learning_rate_init = 0.002, max_iter = 500, early_stopping = True, and validation_fraction = 0.1. Final model configurations were selected according to internal validation performance within these prespecified search spaces. Specifically, the selected SVM model used C = 2, a polynomial kernel, gamma = 0.02, degree = 2, and class_weight = balanced, whereas the selected XGBoost model used learning_rate = 0.04, max_depth = 2, n_estimators = 80, subsample = 0.8, gamma = 0.9, colsample_bytree = 0.5, reg_alpha = 12, and reg_lambda = 18. For LightGBM, RF, and ANN, the final configurations were likewise chosen as the best-performing combinations within the above prespecified search spaces. Categorical variables were processed using a consistent encoding strategy across all models.Following model training, model-appropriate SHAP methods were applied for interpretability analysis: TreeSHAP for tree-based models (XGBoost, LightGBM, RF) and KernelSHAP for SVM and ANN models. This allowed for quantifying feature importance and determining the direction of feature effects at the individual prediction level.
Model evaluation primarily used AUC as the key metric for discriminative ability. This was supplemented by an assessment of calibration capability: Calibration curves were plotted on the internal validation set to examine the agreement between predicted probabilities and observed outcomes. To enhance clinical utility, the nomogram was used to generate individualized risk predictions. Finally, the AUC values of the individual machine learning models were compared against that of the logistic regression-based nomogram to identify the single model with the best discriminative performance.
Development and Validation of the Stacking Ensemble Model
This study employed Stacking ensemble learning to enhance predictive performance and robustness. The Stacking architecture consists of base-learners at the first level and a meta-learner at the second level. First, five base-learners (SVM, XGBoost, LightGBM, ANN, RF) were trained on the training set using stratified 10-fold cross-validation. Out-of-fold (OOF) predictions generated from these models were used as first-level features for meta-learner training, helping mitigate information leakage and improving generalizability.
Using the five prespecified base learners, we constructed 31 distinct stacking schemes by varying the ensemble architecture and meta-learner configuration. Each scheme was evaluated through internal validation to compare discrimination performance across candidate ensembles. For the final selected model (SVM + ANN + Logit), the stacking implementation used an SVM base learner with C = 3, a polynomial kernel, gamma = 0.1, and degree = 2; an ANN base learner with activation = logistic, hidden_layer_sizes = (25,), and max_iter = 1000; and a logistic-regression meta-learner with C = 0.8, solver = liblinear, max_iter = 1000, and random_state = 123. Predicted probabilities were converted to binary class labels using a fixed threshold of 0.50 for the calculation of threshold-dependent performance metrics, without additional threshold optimization. Model-specific procedures to reduce overfitting, including regularization, early stopping, and subsampling where applicable, were incorporated in the prespecified implementation.
Model selection was primarily based on AUC metric, through which the optimal Stacking ensemble model was identified. This model was subsequently compared against the five individual machine learning models and the traditional logistic regression-based nomogram to select the best overall performer. The final selected Stacking model underwent external validation, where its AUC, calibration curve, and DCA were assessed to evaluate clinical utility. Interpretability analysis and visualization were performed using SHAP. To ensure reproducibility, the training and validation processes employed fixed random seeds and adhered to a pre-defined evaluation protocol. Based on the final selected optimal model, an online prediction platform was established, allowing users to input feature parameters to obtain results.
Results
Patient Characteristics
The retrospective cohort included 802 eligible patients with GISTs. These patients were randomly divided into a training set (n = 562) and an internal validation set (n = 240) at a ratio of 7:3. To ensure the comparability of baseline characteristics between the training and validation sets, the study confirmed that there were no statistically significant differences (P > 0.05) in clinical characteristics, CT imaging features, or serological indicators. (Table 1) Baseline characteristics of the external validation cohort are summarized in Supplementary Table S1. Compared with the development cohort, the external cohort showed significant differences in tumor location and several imaging features (including margin clarity, ulceration, calcification, morphology, growth pattern, enhancement degree, and peritumoral fat stranding), as well as inflammation- and nutrition-related indices (MLR, PLR, SII, AFR, PNI, and ALI). The prevalence of high mitotic count was slightly lower in the external cohort (25.1% vs 31.7%, p=0.055).
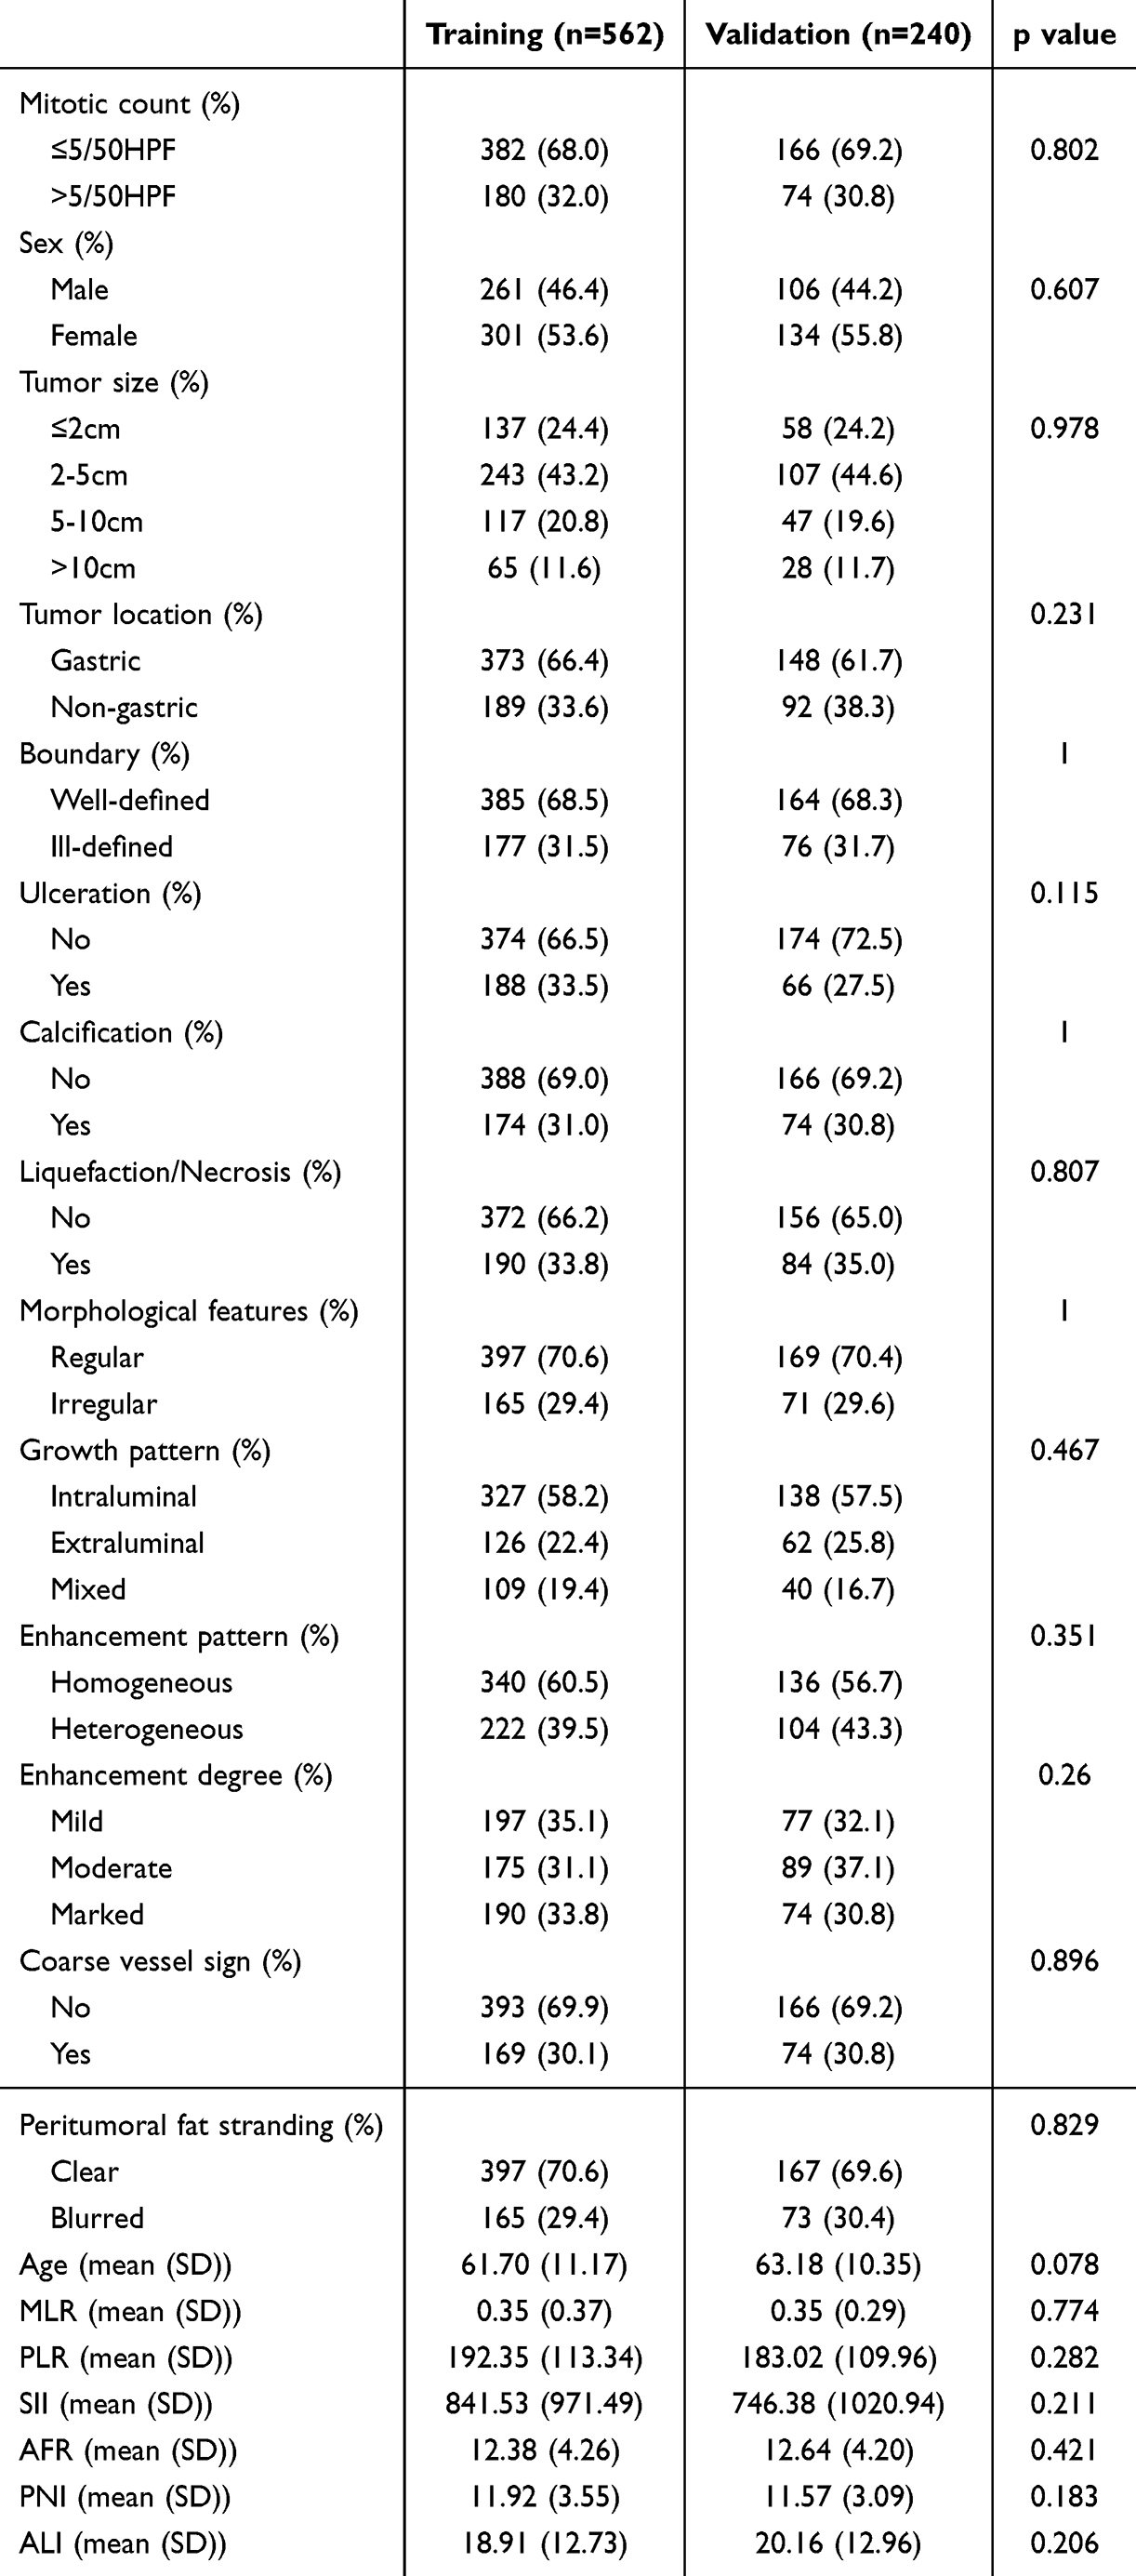 |
Table 1 Baseline Characteristics of the Training and Internal Validation Sets |
Feature Selection
To identify key variables that significantly distinguish between high mitotic count (>5/50 HPFs) and low mitotic count (≤5/50 HPFs), we performed LASSO regression analysis on the initial candidate variables. The optimal tuning parameter (λ) was determined by analyzing the LASSO coefficient trajectory and selection plot, with λ = 0.0065 ultimately selected as the screening threshold (Figure 1). Based on this criterion, we identified 16 variables demonstrating strong predictive capability for high mitotic count in GISTs: sex, age, tumor size, tumor location, boundary characteristics, ulceration, calcification, liquefaction/necrosis, enhancement pattern, coarse vessel sign, peritumoral fat stranding, MLR, PLR, SII, AFR, and ALI. Subsequently, we conducted refined selection using multivariable logistic regression analysis, ultimately identifying six features significantly associated with mitotic count (P < 0.05): tumor size, liquefaction/necrosis, coarse vessel sign, peritumoral fat stranding, PLR, and AFR (Table 2).
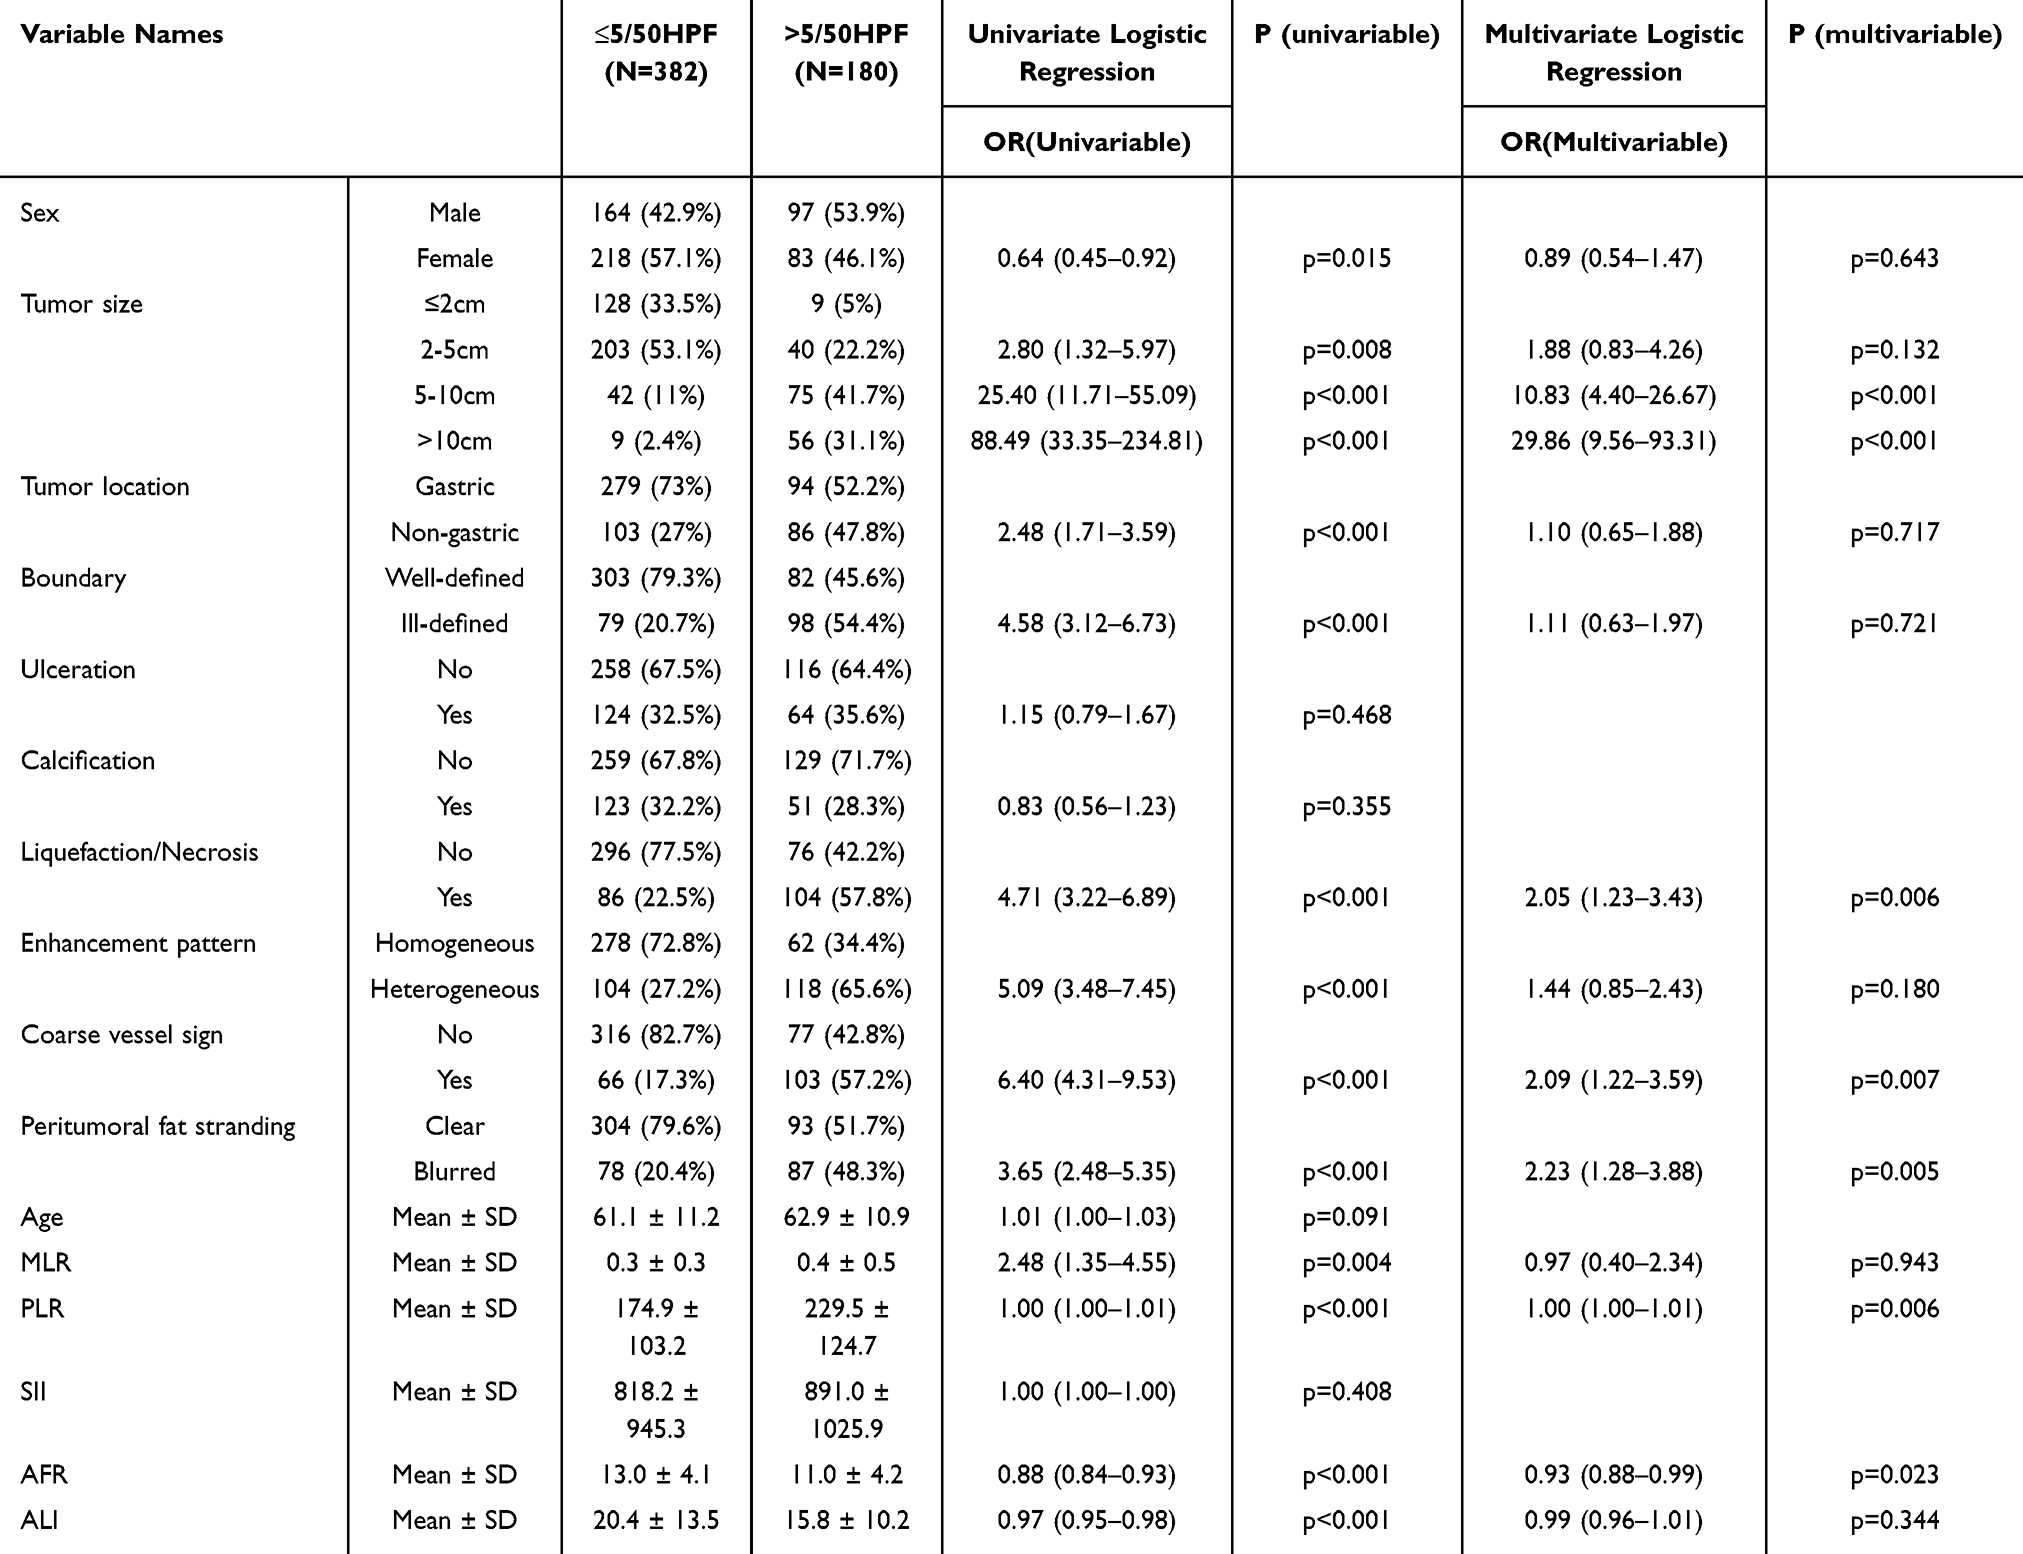 |
Table 2 Multivariate Logistic Regression Analysis of Factors Associated with Mitotic Count in GISTs |
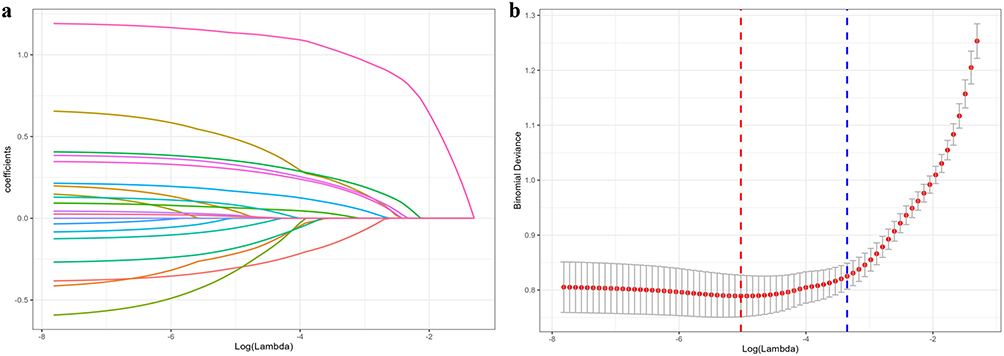 |
Figure 1 LASSO Variable Selection for Predicting Mitotic Count in GISTs. |
Development of the Nomogram Model
Based on the six selected variables, we first constructed a logistic regression model. To evaluate its predictive performance, a nomogram was developed for visual representation (Figure 2). The AUC values were calculated for both the training set and the internal validation set. The model achieved an AUC of 0.889 (95% CI: 0.856–0.922) in the training set and 0.864 (95% CI: 0.808–0.920) in the internal validation set, indicating high stability and reliability, and confirming its favorable predictive accuracy (Figure 3a–c).
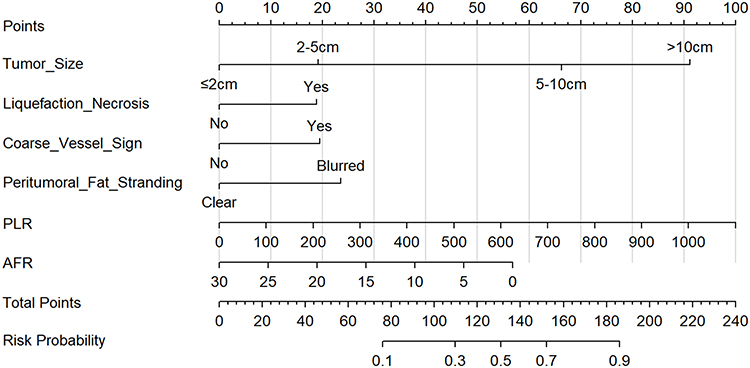 |
Figure 2 Nomogram for Preoperative Prediction of Mitotic Count in GISTs Based on CT Features and Serological Indicators. |
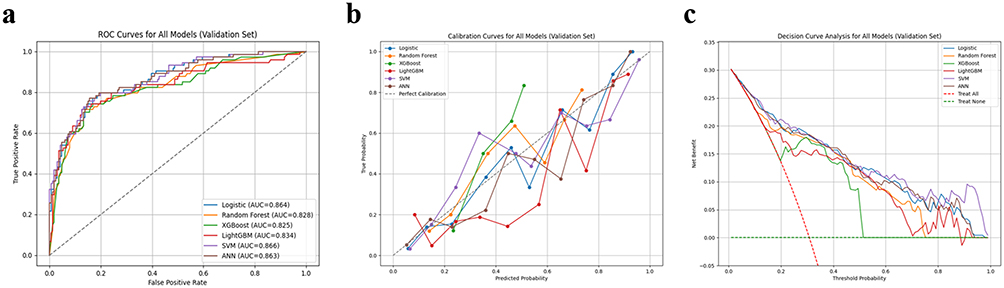 |
Figure 3 Performance Evaluation of the Models on the Internal Validation Set. (a) Receiver operating characteristic curves; (b) Calibration curves; (c) Decision curve analysis. |
Development and Evaluation of Individual Machine Learning Models
In addition to the logistic regression model, five machine learning classifiers were developed using the six selected features: SVM, XGBoost, LightGBM, ANN, and Random Forest. For each model we generated validation-set visualizations including the confusion matrix (Figure 4), ROC curve (Figure 3a), calibration curve (Figure 3b), DCA (Figure 3c), and SHAP analysis (Figure 5). Corresponding plots for the training set are provided in the supplementary material (Supplementary Figures S1–S4, Table S2).
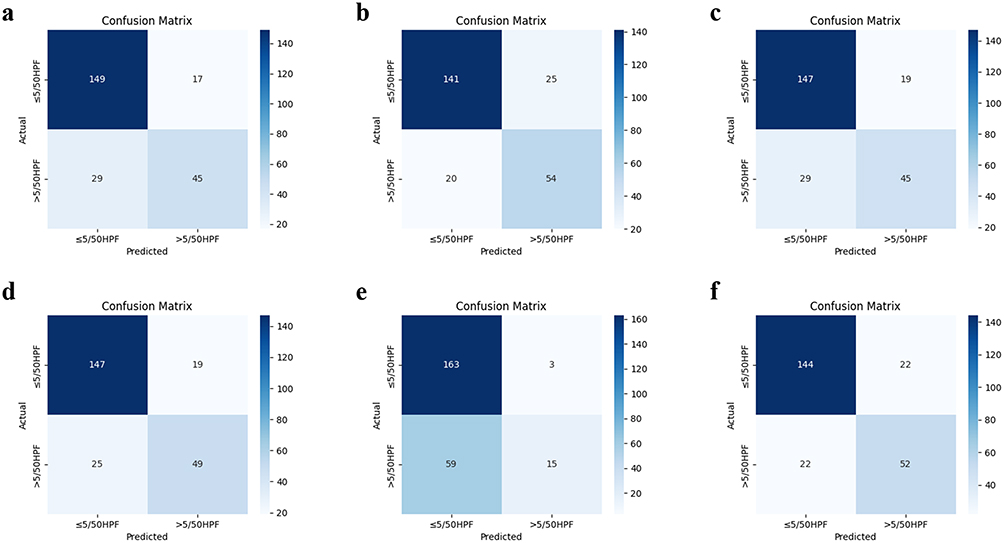 |
Figure 4 Confusion Matrices of Individual Machine Learning Models in the Internal Validation Set. (a) Logit; (b) LightGBM; (c) Random Forest; (d) SVM; (e) XGBoost; (f) ANN. |
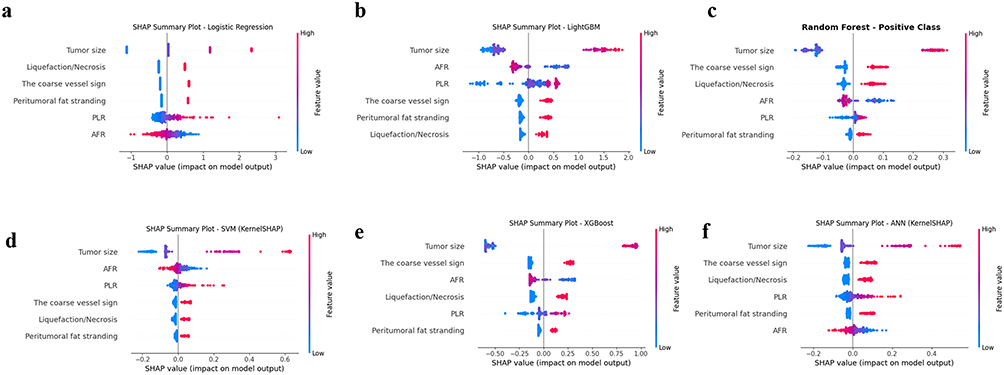 |
Figure 5 SHAP Summary Plots of Individual Machine Learning Models from the Internal Validation Set. (a) Logit; (b) LightGBM; (c) Random Forest; (d) SVM; (e) XGBoost; (f) ANN. |
On the internal validation set (Table 3), all models demonstrated good discrimination with AUCs ranging from 0.81 to 0.87. SVM achieved the highest AUC (0.866), followed by logistic regression (0.864) and ANN (0.863).
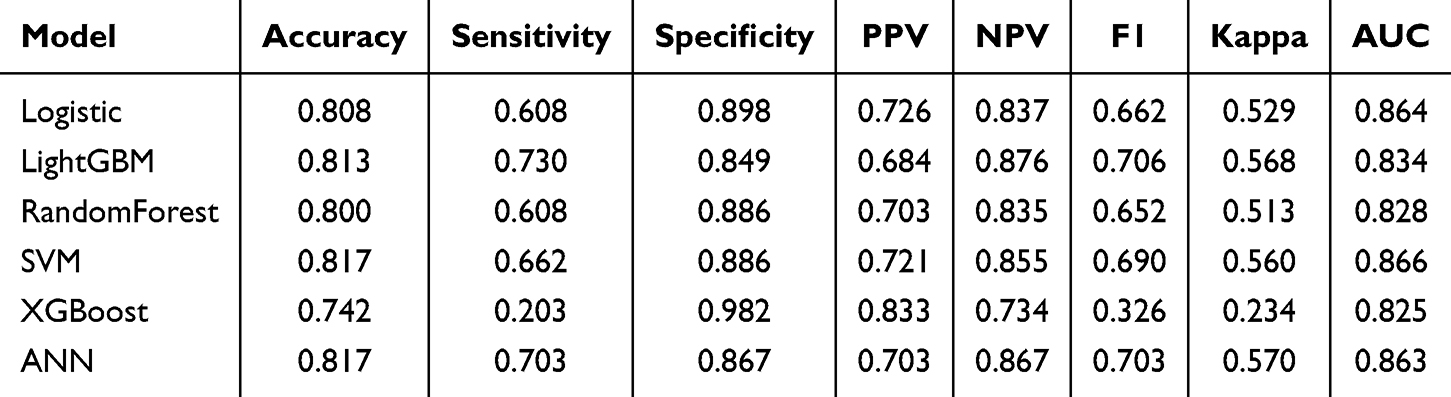 |
Table 3 Performance Comparison of Individual Machine Learning Models in the Internal Validation Set |
In terms of generalizability, SVM and ANN were the most stable: their AUCs declined only slightly from training to validation (SVM: 0.885→0.866; ANN: 0.892→0.863) with minimal fluctuation in other metrics. Logistic regression also showed strong stability (0.889→0.864) and offers the advantage of clear interpretability. By contrast, LightGBM and Random Forest showed larger performance drops (LightGBM: 0.914→0.834; Random Forest: 0.887→0.828), suggesting potential overfitting.
Detailed assessment on the validation set highlighted complementary strengths and weaknesses: SVM combined the highest AUC with excellent generalization; ANN achieved the best Kappa (0.570) and the most balanced overall performance; LightGBM attained the highest sensitivity (0.730) and F1-score (0.706) but appeared prone to overfitting; logistic regression remained a robust, interpretable baseline with only a small performance gap relative to more complex models; and XGBoost exhibited high specificity but relatively low sensitivity. Considering discriminative performance, stability, and generalizability, SVM was selected as the optimal model for predicting high mitotic count in GISTs.
Development and Validation of the Stacking Ensemble Model
Based on the performance of individual base learners, we evaluated and selected optimal stacked architectures by comparing combinations of five base models (LightGBM, Random Forest, SVM, XGBoost, ANN) with a logistic‑regression meta‑learner (Supplementary Table S3).
A total of 31 stacked combinations were developed and tested (Table 4). AUCs ranged from 0.726 to 0.867, with sensitivities generally between 0.59 and 0.69 and specificities largely between 0.87 and 0.93. The top five ensembles by AUC were: SVM + ANN + Logit (0.867), RF + SVM + Logit (0.861), and ANN + Logit, RF + SVM + ANN + Logit, RF + ANN + Logit (all 0.860).
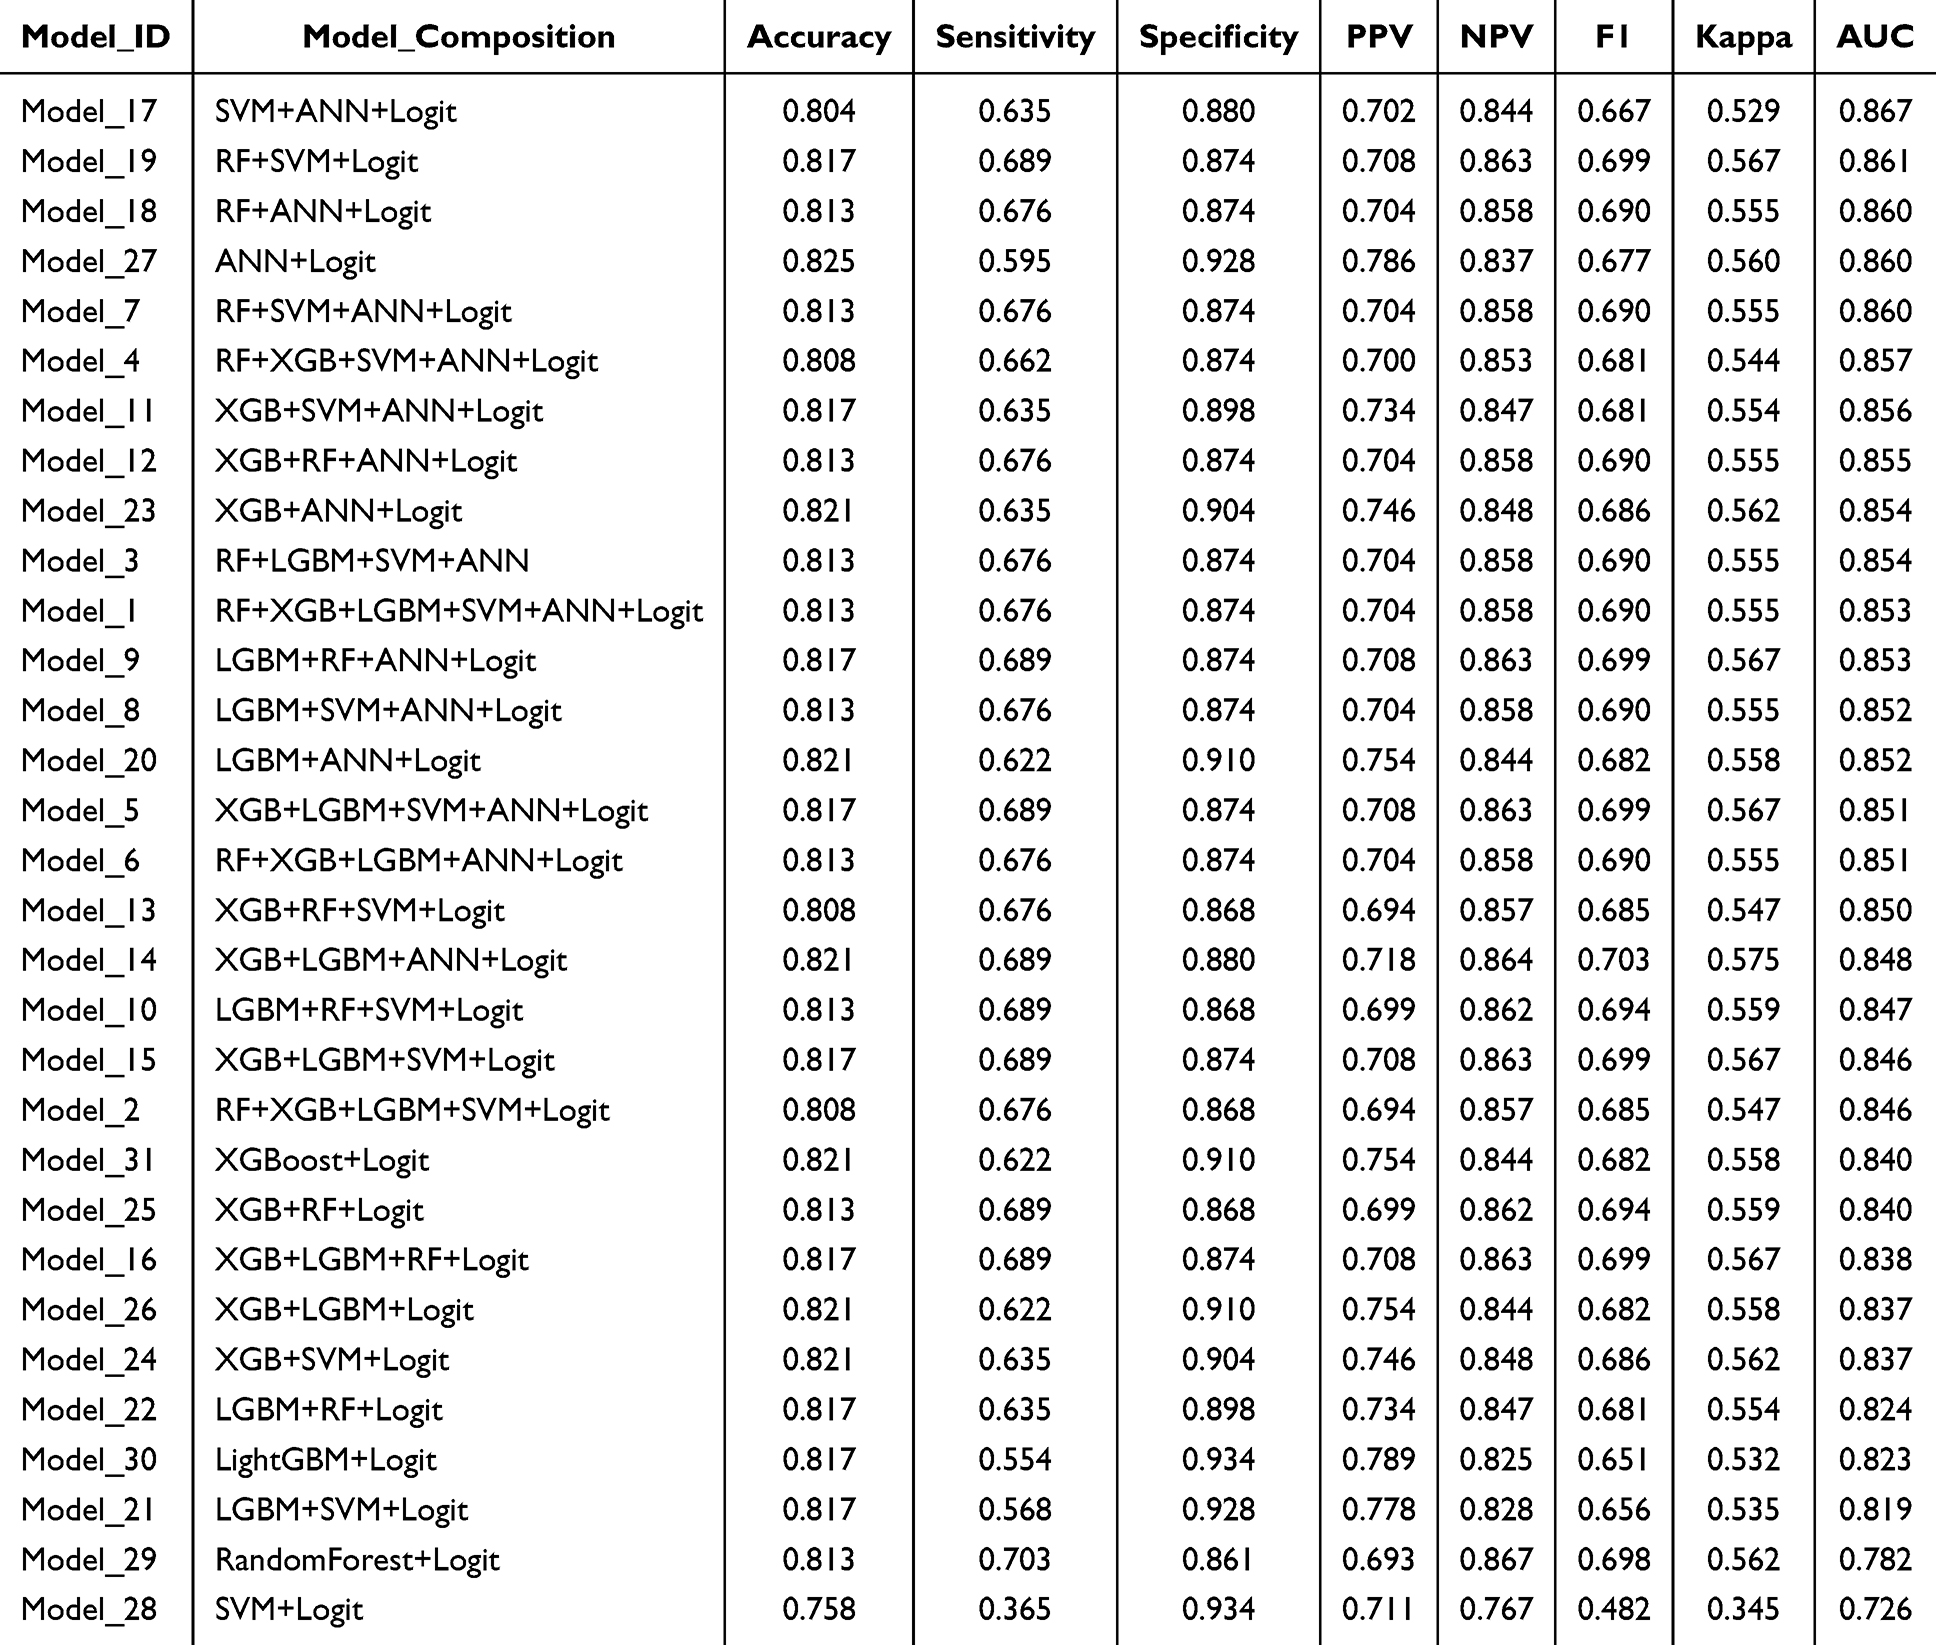 |
Table 4 Performance Metrics of the Stacking Ensemble Model on the Internal Validation Set |
The best ensemble, SVM + ANN + Logit, achieved on the internal validation set: AUC 0.867, accuracy 0.804, sensitivity 0.635, specificity 0.880, PPV 0.702, NPV 0.844, F1‑score 0.667, and Kappa 0.529. RF + SVM + Logit reached AUC 0.861 (accuracy 0.817, sensitivity 0.689, specificity 0.874, F1‑score 0.699), improving sensitivity and F1 while maintaining high specificity. Simpler two‑model stacks such as SVM + Logit and RF + Logit yielded lower AUCs (0.726 and 0.782, respectively), indicating that multi‑model stacks with targeted complementarity are more likely to provide robust gains.
Compared with single models, the SVM + ANN + Logit ensemble produced the highest overall AUC (Supplementary Figure S5a), slightly outperforming the best individual model, SVM (AUC 0.866). At the default decision threshold its accuracy and F1 were marginally lower than SVM’s (accuracy 0.804 vs 0.817; F1 0.667 vs 0.690), while specificity and PPV/NPV remained comparable (specificity 0.880 vs 0.886; PPV 0.702 vs 0.721; NPV 0.844 vs 0.855). Although the improvements in threshold-dependent metrics were modest, the stacked model was selected as the final model because AUC was prespecified as the primary discrimination metric and the ensemble integrates complementary decision patterns from heterogeneous learners. We therefore report both the stacking model and the simpler logistic regression nomogram to support practical clinical use.
Decision curve analysis (Supplementary Figure S5c) indicated meaningful net clinical benefit, and the calibration curve demonstrated reliable and stable probability estimates (Supplementary Figure S5b). Overall, these results suggest that the stacked ensemble offers stronger predictive performance and greater clinical utility than individual learners.
External Validation of the Final Model
To evaluate the robustness and generalizability of the final Stacking ensemble model, validation was performed on an external validation cohort (The Second Hospital of Dalian Medical University, n=255). The model demonstrated stable predictive performance in the independent test dataset, with an AUC of 0.955 (95% CI: 0.923–0.978) (Figure 6b), an accuracy of 0.894, a specificity of 0.927, and a sensitivity of 0.797, indicating favorable discriminative ability and predictive efficiency. Using the external validation cohort data, a confusion matrix was generated (Figure 6a), and the model’s performance was further analyzed based on the classifications of true positives, true negatives, false positives, and false negatives. The results showed high accuracy in the classification task.
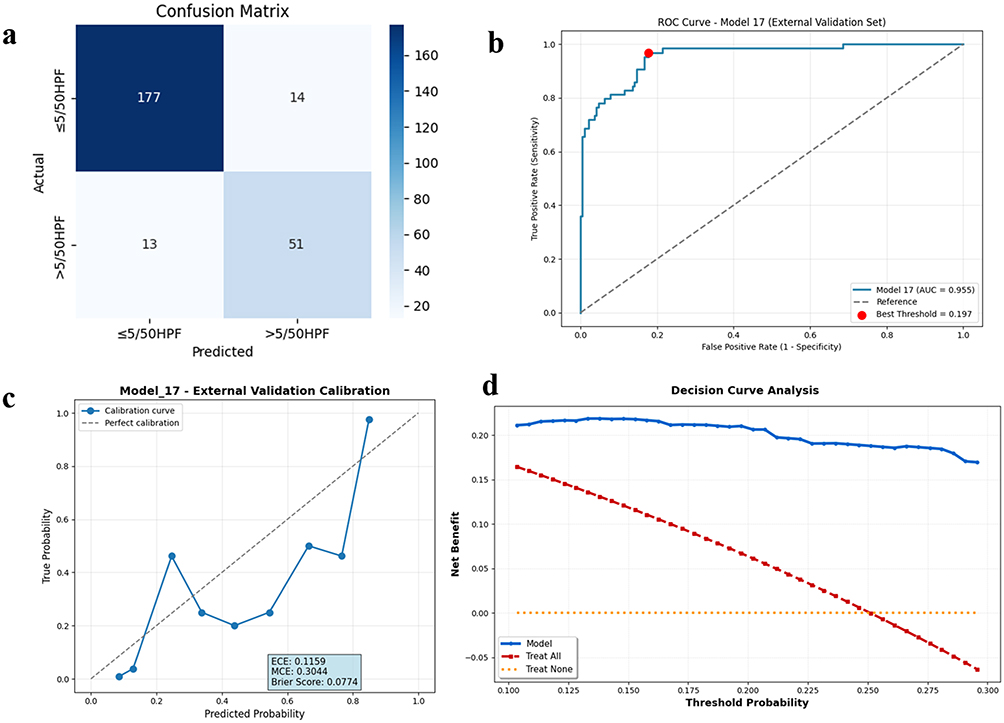 |
Figure 6 Performance Evaluation of the Final Stacking Ensemble Model on the External Validation Set. (a) Confusion matrix; (b) ROC curve; (c) Calibration curve; (d) Decision curve analysis. |
Furthermore, to further validate the clinical utility of the model, DCA based on the external validation set (Figure 6d) showed that the model provides significant net clinical benefit across a range of risk thresholds. Simultaneously, the calibration curve demonstrated good agreement between the predicted probabilities and the actual event rates, further supporting the reliability and stability of the model’s results (Figure 6c). These findings indicate that the model’s predictive performance on the external validation dataset is not only stable but also holds potential for clinical application.
SHAP Visualization of the Model
We applied SHAP to visualize the final Stacking model and provide intuitive, feature‑level explanations. As shown in Figures 7 and 8, six key features ranked by predictive importance are: tumor size, coarse vessel sign, liquefaction/necrosis, peritumoral fat stranding, PLR and AFR. These features form the core indicators for assessing high mitotic count; their importance order both reveals the model’s decision basis and offers clinical reference for prognosis and treatment planning. Force plots and waterfall plots (Supplementary Figures S6 and S7) further strengthen local interpretability.
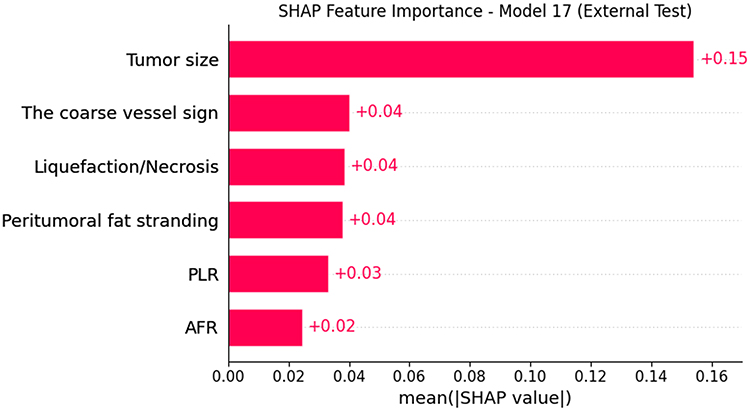 |
Figure 7 Global Model Interpretation Based on SHAP: Feature Importance Plot. |
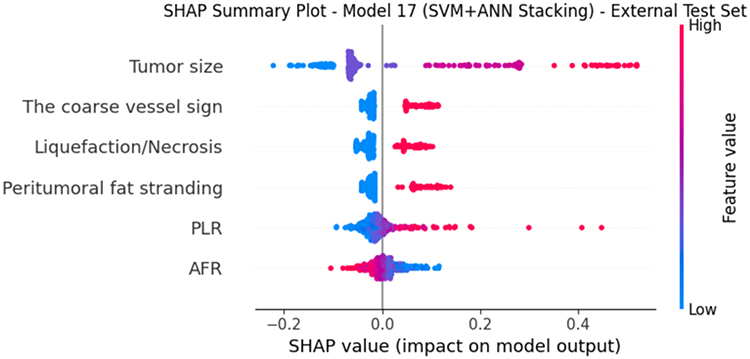 |
Figure 8 Global Model Interpretation Based on SHAP: Feature Dependency Bee Swarm Plot. |
Application of the Model
Based on our selected optimal Stacking ensemble model (ANN + SVM + Logit), we developed an online prediction platform for high mitotic count using 6 high-risk features to assist in clinical decision-making. The platform is freely accessible: https://predictive-model-for-high-mitotic-count-in-gist-hrbo6dtusar2kj.streamlit.app/. The underlying source code and trained model weights (excluding any patient data) can be obtained from https://github.com/AsherSense/Predictive-Model-for-High-Mitotic-Count-in-GIST. Figure 9 illustrates an example interface of the platform.
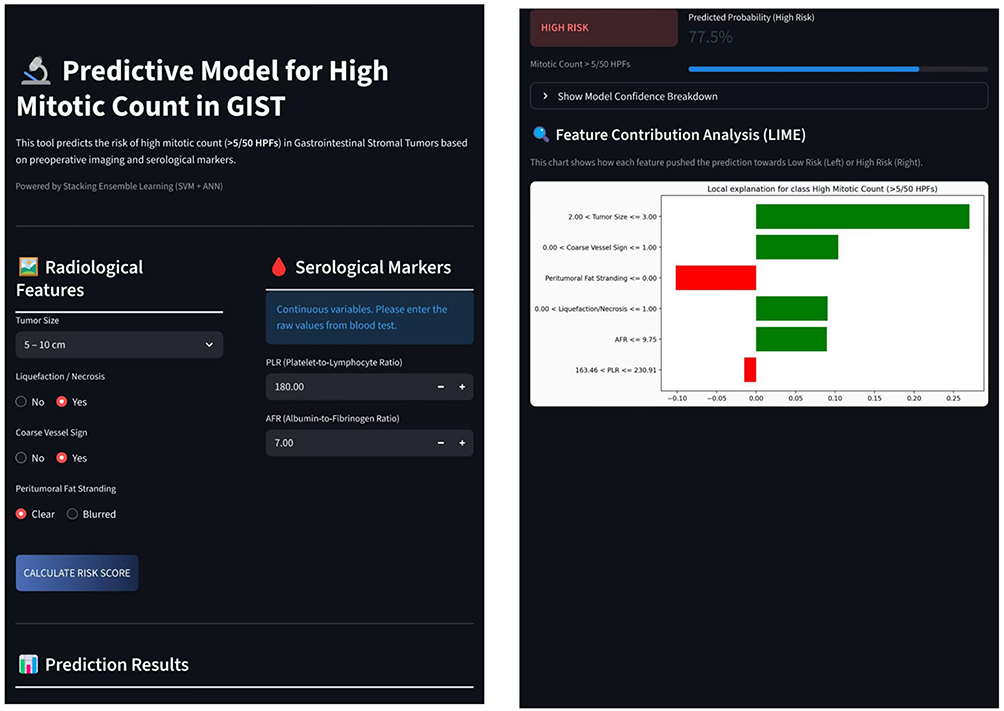 |
Figure 9 Example of the online GIST mitotic count prediction platform. |
Discussion
Although the prediction of mitotic count in GISTs has been increasingly investigated, a systematic model that integrates multiple features for the accurate prediction of high mitotic count in GISTs is currently lacking. In this study, we developed six individual machine learning models and 31 Stacking ensemble models, evaluated their performance, and identified the optimal model for predicting high mitotic count in GISTs. The results demonstrated that the SVM+ANN+Logit Stacking ensemble model was the optimal model.
Current risk stratification for GISTs primarily relies on the modified NIH (mNIH) 2023 criteria, which is based on the evaluation of postoperative pathological specimens. This system utilizes tumor size, primary tumor location, mitotic count, and rupture status as key indicators for risk stratification.10 Regarding the acquisition of these indicators, tumor size, primary location, and rupture status can be non-invasively obtained through preoperative imaging such as CT. However, the preoperative assessment of mitotic count faces significant limitations: on one hand, obtaining mitotic count preoperatively via invasive procedures like biopsy increases the risk of tumor rupture and iatrogenic dissemination.11 On the other hand, GISTs exhibit considerable heterogeneity in size, and biopsy retrieves minimal tissue, prone to sampling bias. This may fail to capture areas with the highest mitotic count, resulting in non-representative samples that mislead risk assessment and subsequently lead to deviations in patient treatment strategies.12 A Japanese multicenter study confirmed this issue, showing a concordance rate of only 50% for mitotic count determination via biopsy.13 Therefore, as the sole core indicator within the mNIH (2023) criteria that is difficult to assess non-invasively preoperatively, the accurate non-invasive prediction of mitotic count is crucial for precise risk stratification and personalized treatment planning in GIST patients.
Mitotic count serves as a significant prognostic indicator in GISTs. Although initially proposed for GIST risk stratification, its fundamental biological significance lies in directly reflecting tumor cell proliferative activity. Specifically, a higher mitotic count indicates greater biological aggressiveness and consequently increased risks of recurrence and metastasis.14 Studies have confirmed that the prognostic value of mitotic count surpasses that of tumor size. One such study demonstrated no statistical association between tumor size and patient recurrence or metastasis outcomes, whereas high mitotic count emerged as the sole predictor for elevated recurrence risk.15
A mutually reinforcing regulatory relationship exists between abundant inflammatory cells within the tumor microenvironment and tumor proliferation. Driven by mediators such as cytokines, chemokines, and enzymes, this inflammatory microenvironment acts as “fertile soil”, fostering proliferation by promoting angiogenesis and inhibiting immune-mediated killing. Serological inflammatory indicators directly reflect this state.16 Hanahan et al emphasized that inflammation is a hallmark of cancer involved in all developmental stages,17 while tumors themselves can induce inflammatory responses to block anti-tumor surveillance and remodel their environment.18
Clinically, high-grade tumors exhibit increased microvessel density, which correlates positively with neutrophil counts.19 Specifically, Cananiz et al20 identified MLR, NLR, and PLR as independent risk factors for GIST recurrence, and Lu et al21 confirmed the association between chronic inflammation and colorectal cancer survival. These findings substantiate the prognostic value of serological indicators. Currently, preoperative prediction of mitotic count in GISTs is limited because CT imaging only captures macroscopic morphological characteristics. Therefore, incorporating serological indicators is essential to reflect microscopic biological features, providing more comprehensive support for preoperative assessment.
CT examination, as one of the routine preoperative imaging modalities for GISTs, enables the non-invasive acquisition of tumor morphological characteristics. The results of this study identified four CT imaging features as risk factors for high mitotic count in GISTs: tumor size, liquefaction/necrosis, the coarse vessel sign, and peritumoral fat stranding. The study by Ren et al22 indicated that tumor size is an independent risk factor for high mitotic count in GISTs, particularly when the diameter exceeds 5 cm or 10 cm, which is more suggestive of a high mitotic count and malignant risk stratification. CT can intuitively distinguish the density differences between necrotic tissue and normal tissue; therefore, the presence of tumor necrosis on imaging often indicates active cell proliferation and is associated with an increased mitotic count. Mazzei et al,23 in predicting mitotic count based on CT findings, confirmed a significant correlation between the rate of tumor necrosis and mitotic count. Furthermore, other studies have pointed out that necrosis often occurs in areas with strong tumor invasiveness and is closely related to the proliferation process.24 The coarse vessel sign refers to the clear visibility of large feeding or draining vessels at the tumor margin on imaging and serves as an important basis for assessing tumor malignancy and proliferation potential.25 Multivariate logistic regression by Zhou et al26 also demonstrated that this sign is indicative of high-risk GISTs. Focal peritumoral fat stranding on CT often manifests as heterogeneous density or fine linear stranding within the local fat space at the tumor edge. In this study, it was graded as clear or blurred. Hisanaga et al,27 in a breast cancer study, found that more blurred peritumoral fat stranding was associated with larger tumor size and poorer prognosis. However, this indicator has not been routinely quantified in the prognostic analysis of GISTs. The findings of this study provide an important supplement to this field, offering potential clinical and research reference value.
Tumor-associated inflammation has been recognized as a hallmark of cancer, playing a crucial role in tumor initiation, progression, and treatment response. In recent years, researchers have developed various inflammation-based predictive indicators, including ALI, MLR, PLR, PNI, SII, and AFR. These indicators are all associated with adverse prognosis, and systemic inflammatory markers have demonstrated superior prognostic value compared to local immune markers.16 This study identified PLR and AFR among serological indicators as key predictors for mitotic count in GISTs. Zhao et al,28 investigating the prognostic value of inflammatory markers in predicting recurrence-free survival in GISTs, found that preoperative PLR was an independent risk factor affecting prognosis, with lower PLR associated with reduced recurrence rates. Wei et al29 reached the same conclusion, reporting that elevated PLR was significantly associated with poor prognosis in GISTs. AFR is an important parameter reflecting a patient’s coagulation status, systemic inflammation, and nutritional state. Li et al30 found that AFR had significantly stronger predictive power for GIST prognosis compared to other serological indicators. In their study, lower AFR was associated with greater tumor aggressiveness and higher risk stratification. These findings are consistent with our results, further supporting the clinical significance of PLR and AFR as key predictive indicators for GISTs.
This study developed a stacking ensemble-learning framework that combined complementary base learners. Among all evaluated models, the final SVM+ANN+Logit configuration achieved the highest AUC, although its improvement over the best single model was modest. Therefore, the added value of the ensemble may lie not only in discrimination, but also in better probability calibration, greater model flexibility, and improved robustness.
Although the proportion of high mitotic count was numerically lower in the external cohort than in the internal cohort (25.1% vs 31.7%, p = 0.055), the two cohorts also differed in several baseline characteristics. In particular, significant differences were observed in tumor location, boundary, ulceration, calcification, morphology, growth pattern, enhancement degree, peritumoral fat stranding, and several serologic indices. These findings suggest that the external cohort was not simply a repetition of the internal population, but represented a different case mix across centers. Therefore, the favorable discrimination performance in the external cohort may reflect not only the model’s generalizability, but also differences in baseline case composition between centers.
However, several limitations should be acknowledged. First, this was a retrospective study, and both CT feature extraction and mitotic-count assessment relied on human interpretation. Although standardized definitions and expert review were used, formal interobserver agreement statistics, such as kappa values or intraclass correlation coefficients, were not available. As a result, the reproducibility of imaging and pathological assessments could not be fully quantified. Second, because eligible cases were identified retrospectively and strict consecutiveness could not be completely confirmed, selection bias may still have been present. Third, the current fusion strategy remained relatively simple and included only conventional CT morphologic features and serologic indices, without radiomics, deep-learning features, or more explicit interaction modeling. Future studies may expand this framework toward radiogenomic and multi-omics integration, including spatially resolved or single-cell-level data, to better capture tumor heterogeneity.31 Fourth, KIT/PDGFRA and other related genomic variables were not included. Given the known molecular heterogeneity of GIST and the clinical importance of genotype for treatment decision-making, larger multicenter studies integrating next-generation sequencing data with imaging and serologic variables are warranted.32 Finally, no formal a priori sample-size calculation was performed because of the retrospective design, and prospective validation is still needed.
In conclusion, the SVM+ANN+Logit stacking model showed slightly better overall discrimination than the best single model and may serve as an interpretable, non-invasive decision-support tool for the preoperative estimation of high mitotic count in GISTs. Its generalizability and clinical usefulness should be further evaluated in prospective multicenter studies.
Data Sharing Statement
The dataset, algorithm files, and de-identified results used in this study are not publicly available due to privacy or ethical restrictions. However, the data that support the findings of this study are available from the corresponding author upon reasonable request.
Ethics Approval and Consent to Participate
This study is a multicenter retrospective clinical study approved by the Clinical Research Management Committee of the lead center, The Second Hospital of Dalian Medical University (Approval No.: Dayieryuanlinshen [2025] No. 238). All procedures performed in this study involving human participants were in accordance with the ethical standards of the institutional and/or national research committee and with the 1964 Helsinki Declaration and its later amendments or comparable ethical standards. Due to the retrospective nature of the study and the use of de-identified historical clinical data with minimal risk to participants, the requirement for informed consent was waived by the Clinical Research Management Committee of The Second Hospital of Dalian Medical University. Patient data were anonymized before analysis to protect privacy and confidentiality, and no identifying images or details of individual patients are included in this article.
Acknowledgments
We are deeply grateful to all individuals who offered practical help and unwavering support to this project.
Author Contributions
All authors made substantial contributions to the work; participated in drafting, revising, or critically reviewing the article; approved the final version to be published; agreed on the journal to which the article has been submitted; and agreed to be accountable for all aspects of the work. YR: Conceptualization, Methodology, Software, Formal analysis, Writing – original draft, Writing – review & editing. FD: Software, Methodology, Writing – review & editing. XG and YF: Investigation, Data curation, Writing – review & editing. YY and SL: Investigation, Resources, Writing – review & editing. YJ, WS, KL, ZL, HW, QC, and JH: Data curation, Methodology, Writing – review & editing. JW and YD: Supervision, Validation, Writing – review & editing. GZ: Conceptualization, Methodology, Validation, Supervision, Project administration, Writing – review & editing.
Funding
The authors declare that no funds, grants, or other support were received during the preparation of this article.
Disclosure
The authors declare that they have no competing interests.
References
1. Kim Y, Lee SH. Pathologic diagnosis and molecular features of gastrointestinal stromal tumors: a mini-review. Front Oncol. 2024;14. doi:10.3389/fonc.2024.1487467
2. Søreide K, Sandvik OM, Søreide JA, et al. Global epidemiology of gastrointestinal stromal tumours (GIST): a systematic review of population-based cohort studies. Cancer Epidemiol. 2016;40:39–19. doi:10.1016/j.canep.2015.10.031
3. Ma GL, Murphy JD, Martinez ME, et al. Epidemiology of gastrointestinal stromal tumors in the era of histology codes: results of a population-based study. Cancer Epidemiol Biomarkers Prev. 2015;24(1):298–302. doi:10.1158/1055-9965.EPI-14-1002
4. von Mehren M, M KJ, Agulnik M, et al. Soft tissue Sarcoma, Version 2.2022, NCCN Clinical Practice Guidelines in Oncology. J National Compr Cancer Network. 2022;20(7):815–833. doi:10.6004/jnccn.2022.0035
5. Colapkulu-Akgul N, Gunel H, Beyazadam D, et al. Gastrointestinal stromal tumors: recurrence and survival analysis of 49 patients. Middle East J Digest Dis. 2023;15(1):19–25. doi:10.34172/mejdd.2023.315
6. He C, Wang Z, Yu J, et al. Current drug resistance mechanisms and treatment options in gastrointestinal stromal tumors: summary and update. Current Treatment Options Oncol. 2024;25(11):1390–1405. doi:10.1007/s11864-024-01272-7
7. Li W, Li X, Yu K, et al. Efficacy and safety of neoadjuvant imatinib therapy for patients with locally advanced rectal gastrointestinal stromal tumors: a multi-center cohort study. Front Pharmacol. 2022;13.
8. Iwatsuki M, Harada K, Iwagami S, et al. Neoadjuvant and adjuvant therapy for gastrointestinal stromal tumors. Ann Gastroenterol Surg. 2018;3(1):43–49. doi:10.1002/ags3.12211
9. Kurokawa Y, Yang HK, Cho H, et al. Phase II study of neoadjuvant imatinib in large gastrointestinal stromal tumours of the stomach. Br J Cancer. 2017;117(1):25–32. doi:10.1038/bjc.2017.144
10. Serrano C, Martín-Broto J, Asencio-Pascual JM, et al. 2023 GEIS guidelines for gastrointestinal stromal tumors. Therapeut Adv Med Oncol. 2023;15:17588359231192388. doi:10.1177/17588359231192388
11. Cicala CM, Bauer S, Heinrich MC, et al. Gastrointestinal Stromal Tumor. Hematol Oncol Clin North Am. 2025;39(4):773–784. doi:10.1016/j.hoc.2025.04.006
12. Renne SL, Cammelli M, Santori I, et al. True mitotic count prediction in gastrointestinal stromal tumors: Bayesian Network Model and PROMETheus (Preoperative Mitosis Estimator Tool) application development. J Med Internet Res. 2024;26:e50023. doi:10.2196/50023
13. Kobara H, Mori H, Rafiq K, et al. Analysis of the amount of tissue sample necessary for mitotic count and Ki-67 index in gastrointestinal stromal tumor sampling. Oncol Rep. 2015;33(1):215–222. doi:10.3892/or.2014.3608
14. Campora M, Paudice M, Gambella A, et al. Counting mitoses in gastrointestinal stromal tumours (GISTs): variable practices in the real-world setting and their clinical implications. Virchows Archiv. 2023;482(3):589–594. doi:10.1007/s00428-022-03454-w
15. Supsamutchai C, Wilasrusmee C, Hiranyatheb P, et al. A cohort study of prognostic factors associated with recurrence or metastasis of gastrointestinal stromal tumor (GIST) of stomach. Ann Med Surg. 2018;35:1–5. doi:10.1016/j.amsu.2018.08.010
16. Huang H, Liu Q, Zhu L, et al. Prognostic value of preoperative systemic immune-inflammation index in patients with cervical cancer. Sci Rep. 2019;9(1):3284. doi:10.1038/s41598-019-39150-0
17. Hanahan D, Weinberg RA. Hallmarks of cancer: the next generation. Cell. 2011;144(5):646–674. doi:10.1016/j.cell.2011.02.013
18. Grivennikov SI, Greten FR, Karin M. Immunity, inflammation, and cancer. Cell. 2010;140(6):883–899. doi:10.1016/j.cell.2010.01.025
19. Ocaña MC, Bernal M, Quesada AR, Medina MÁ. A primer on metabolic contributions in tumor angiogenic microenvironment. Biochim Biophys Acta Rev Cancer. 2025;1880(5):189417. doi:10.1016/j.bbcan.2025.189417
20. Cananzi FCM, Minerva EM, Samà L, et al. Preoperative monocyte-to-lymphocyte ratio predicts recurrence in gastrointestinal stromal tumors. J Surg Oncol. 2019;119(1):12–20. doi:10.1002/jso.25290
21. Lu Y, Ye QY, Mei O, et al. Chronic inflammation index-based tumor subsite classification correlated with chemotherapy benefit and survival outcomes in stage II-III colorectal cancer. J Inflamm Res. 2025;18:6767–6781. doi:10.2147/JIR.S517378
22. Yingzheng R, Linlin J, Yang Y, et al. Study on the predictive value of preoperative CT features for the mitotic index of GIST based on the nomogram. Sci Rep. 2025;15(1):8627. doi:10.1038/s41598-025-93368-9
23. Mazzei MA, Cioffi Squitieri N, Vindigni C, et al. Gastrointestinal stromal tumors (GIST): a proposal of a “CT-based predictive model of Miettinen index” in predicting the risk of malignancy. Abdom Radiol. 2020;45(10):2989–2996. doi:10.1007/s00261-019-02209-7
24. Wang M, Feng Z, Zhou L, et al. Computed-tomography-based radiomics model for predicting the malignant potential of gastrointestinal stromal tumors preoperatively: a multi-classifier and multicenter study. Front Oncol. 2021;11:582847. doi:10.3389/fonc.2021.582847
25. Inoue A, Ota S, Yamasaki M, et al. Gastrointestinal stromal tumors: a comprehensive radiological review. Jpn J Radiol. 2022;40(11):1105–1120. doi:10.1007/s11604-022-01305-x
26. Zhou C, Duan X, Zhang X, et al. Predictive features of CT for risk stratifications in patients with primary gastrointestinal stromal tumour. Eur Radiol. 2016;26(9):3086–3093. doi:10.1007/s00330-015-4172-7
27. Hisanaga S, Aoki T, Shimajiri S, et al. Peritumoral fat content correlates with histological prognostic factors in breast carcinoma: a study using iterative decomposition of water and fat with echo asymmetry and least-squares estimation (IDEAL). Magn Reson Med Sci. 2021;20(1):28–33. doi:10.2463/mrms.mp.2019-0201
28. Zhao JL, Wang MY, Lv YZ, et al. Prognostic value of inflammatory markers in predicting recurrence-free survival in gastrointestinal stromal tumor patients: a nomogram-based approach. World J Gastrointest Oncol. 2025;17(2):94956. doi:10.4251/wjgo.v17.i2.94956
29. Wei ZW, Huang WB, Yang DJ, et al. The prognostic roles of platelet-to-lymphocyte ratio and neutrophil-to-lymphocyte ratio in gastrointestinal stromal tumours: a meta-analysis. Transl Cancer Res. 2020;9(9):5128–5138. doi:10.21037/tcr-20-1037
30. Li R, Song S, He X, et al. Relationship between fibrinogen to albumin ratio and prognosis of gastrointestinal stromal tumors: a retrospective cohort study. Cancer Manage Res. 2020;12:8643–8651. doi:10.2147/CMAR.S271171
31. Zhu W, Fan C, Wang H, et al. Proton-pump inhibitor use and gastrointestinal disease risk: a Mendelian Randomization Study of Omics and pharmacological pathways. FASEB J. 2025;39(24):e71370. doi:10.1096/fj.202503152R
32. Xu Y, Wei Z, Li M, et al. Identification and prioritization of high-frequency biomarkers and therapeutic targets in gastric cancer trials. BMC Cancer. 2025;26(1):148. doi:10.1186/s12885-025-15484-z
 © 2026 The Author(s). This work is published and licensed by Dove Medical Press Limited. The
full terms of this license are available at https://www.dovepress.com/terms
and incorporate the Creative Commons Attribution
- Non Commercial (unported, 4.0) License.
By accessing the work you hereby accept the Terms. Non-commercial uses of the work are permitted
without any further permission from Dove Medical Press Limited, provided the work is properly
attributed. For permission for commercial use of this work, please see paragraphs 4.2 and 5 of our Terms.
© 2026 The Author(s). This work is published and licensed by Dove Medical Press Limited. The
full terms of this license are available at https://www.dovepress.com/terms
and incorporate the Creative Commons Attribution
- Non Commercial (unported, 4.0) License.
By accessing the work you hereby accept the Terms. Non-commercial uses of the work are permitted
without any further permission from Dove Medical Press Limited, provided the work is properly
attributed. For permission for commercial use of this work, please see paragraphs 4.2 and 5 of our Terms.
Recommended articles
Assessing Invasiveness of Ground-Glass Nodules Using Ternary-Class CT Radiomics Models: A Multi-Center Study with SHAP Explanations
Zhao P, Chen H, Gu H, Lin Y, Ma Y
Cancer Management and Research 2026, 18:602730
Published Date: 5 June 2026