")
Back to Journals » Diabetes, Metabolic Syndrome and Obesity » Volume 16
Prediction of Diabetic Kidney Disease in Newly Diagnosed Type 2 Diabetes Mellitus
Authors Mu X , Wu A , Hu H, Zhou H, Yang M
Received 6 May 2023
Accepted for publication 4 July 2023
Published 8 July 2023 Volume 2023:16 Pages 2061—2075
DOI https://doi.org/10.2147/DMSO.S417300
Checked for plagiarism Yes
Review by Single anonymous peer review
Peer reviewer comments 2
Editor who approved publication: Dr Konstantinos Tziomalos
Xiaodie Mu, Aihua Wu, Huiyue Hu, Hua Zhou,* Min Yang*
Department of Nephrology, The Third Affiliated Hospital of Soochow University, Changzhou, People’s Republic of China
*These authors contributed equally to this work
Correspondence: Hua Zhou; Min Yang, Department of Nephrology, The Third Affiliated Hospital of Soochow University, Changzhou, 213003, People’s Republic of China, Tel +86 0519 68872082, Email [email protected]; [email protected]
Background: Diabetic kidney disease (DKD), a common microvascular complication of diabetes mellitus (DM), is always asymptomatic until it develops to the advanced stage. Thus, we aim to develop a nomogram prediction model for progression to DKD in newly diagnosed type 2 diabetes mellitus (T2DM).
Methods: This was a single-center analysis of prospective data collected from 521 newly diagnosed patients with T2DM. All related clinical records were incorporated, including the triglyceride-glucose index (TyG index). The least absolute shrinkage and selection operator (LASSO) was used to build a prediction model. In addition, discrimination, calibration, and clinical practicality of the nomogram were evaluated.
Results: In this study, 156 participants were incorporated as the validation set, while the remaining 365 were incorporated into the training set. The predictive factors included in the individualized nomogram prediction model included 5 variables. The area under the curve (AUC) for the prediction model was 0.826 (95% CI 0.775 to 0.876), indicating excellent discrimination performance. The model performed exceptionally well in terms of predictive accuracy and clinical applicability, according to calibration curves and decision curve analysis.
Conclusion: The predictive nomogram for the risk of DKD in newly diagnosed T2DM patients had outstanding discrimination and calibration, which could help in clinical practice.
Keywords: diabetic kidney disease, type 2 diabetes mellitus, nomogram, prediction model, risk assessment
Introduction
The latest global diabetes mellitus (DM) map demonstrated by the International Diabetes Federation (IDF) showed that the incidence of DM patients (aged 20–79) would rise to 12.2% (783.2 million people) in 2045.1 China has the most DM currently, and the number is expected to exceed 174 million by 2045.1 Diabetic kidney disease (DKD), characterized by persistent microalbuminuria or decreased estimated glomerular filtration rate (eGFR), is one of the most significant microvascular complications of diabetes. DKD is now more common than primary glomerulonephritis and is the major cause of chronic kidney disease (CKD) in China, where it affects 40% of those with type 2 diabetes mellitus (T2DM) who are hospitalized.2–4
DKD is always asymptomatic until it develops to the advanced stage. Currently, the main methods for early diagnosis of DKD are urinary albumin creatinine ratio (UACR) and eGFR. However, on the one hand, these diagnostic methods have their limitations. UACR does not increase in the early stage (stages I and II) of DKD,5 meanwhile eGFR increases in the early stage.6 On the other hand, the increasing incidence of DKD is placing a burden on the healthcare system, making it essential to find an approach to screen DKD in the medical environment. Hence, early detection and treatment of DKD are critical.
Previous studies have demonstrated multiple clinically related factors of DKD, such as age, UACR, haemoglobin A1c (HbA1c) and high-density lipoprotein (HDL).7,8 Furthermore, related studies have shown that the development of DKD is strongly associated with insulin resistance (IR), which may accelerate the progression of DKD.9–11 Hyperinsulinemic euglycemic glucose clamp (HEGC), a significant method for evaluating IR, is expensive and difficult to operate.12 Additionally, the homeostasis model for insulin resistance (HOMA-IR) index is also a common tool to assess IR in clinical practice.13 However, serum insulin or C-peptide tests are not appropriate for all inpatients or outpatients owing to the impact of insulin treatment. Triglyceride-glucose index (TyG index), as well as triglyceride and fasting glucose products, demonstrates greater potential in evaluating IR.14,15 Previous clinical studies have demonstrated the performance of the TyG index in evaluating IR, and it was superior to the HOMA-IR index.10 In conclusion, these easily available clinical risk factors may be used to build an accurate prediction model of DKD development in individuals with newly diagnosed T2DM, facilitating DKD screening. In addition, we intended to use the least absolute shrinkage and selection operator (LASSO) regression to screen variables and construct a predictive model. LASSO regression, a compressive estimation method for selecting relevant features for various classes of data, helps deal with biased estimates with complex collinearity data.16 It can perform variable screening and complexity adjustment while fitting generalized linear models, and is widely applied in variable screening of various prediction models, including commonly used clinical variables and related omics data.17,18 LASSO regression has contributed to constructing some prediction models, such as tumors, metabolic diseases, kidney diseases, etc.19,20
In this study, we designed a long-term cohort trial in patients with newly diagnosed T2DM for more than 10 years, aiming to explore the risk factors related to DKD, building and validating the prediction model.
Materials and Methods
Study Population
This was a retrospective analysis on prospectively collected T2DM patients’ data from the Third Affiliated Hospital of Soochow University. We consecutively incorporated 863 newly diagnosed T2DM patients in our hospital from December 2010 to January 2014 for long-term follow-up.
Inclusion criteria: (1) meet the American Diabetes Association (ADA) classification criteria for T2DM and were newly diagnosed patients;14 (2) age > 18 years old.
Exclusion criteria: (1) a history of DKD or other kidney diseases; (2) UACR ≥ 30mg/g, eGFR < 60 mL/min/1.73m2 (CKD-EPI),21 or urine dipstick test ≥ 1 +; (3) presence of an acute infection; (4) presence of a malignancy or pregnancy; (5) incomplete clinical records.
The endpoint event was the occurrence of DKD,22 defined as (1) persistent albuminuria (UACR ≥ 30mg/g) over 3 months (2) eGFR < 60 mL/min/1.73 m2; (3) excluded other kidney diseases.
Participants were followed up until DKD was diagnosed for the first time. Otherwise, patients without DKD events were followed up until June 2022. Figure 1 shows the procession of subject inclusion.
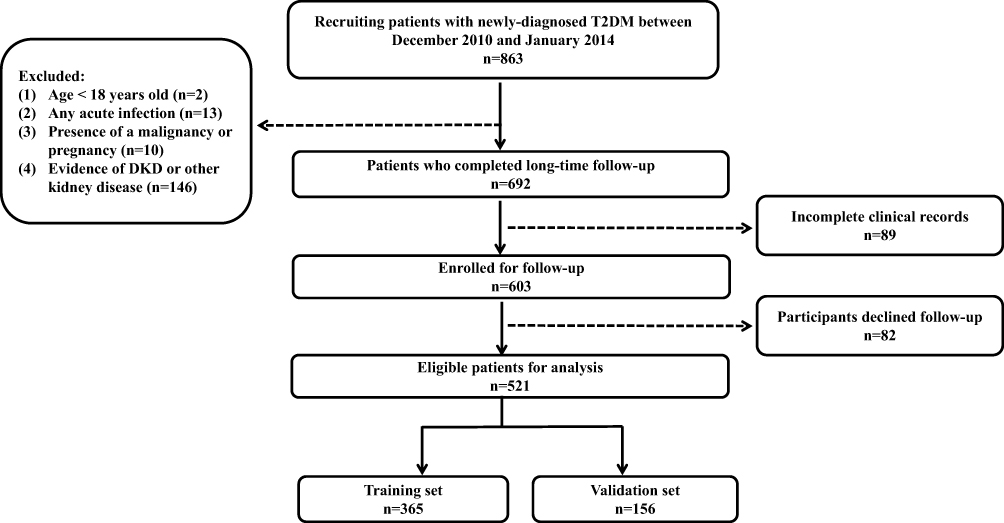 |
Figure 1 Flow chart of participants. Abbreviations: T2DM, type 2 diabetes mellitus; DKD, diabetic kidney disease. Note: The flow chart shows the entire research process. |
Data Collection
Baseline demographic data (sex and age) and related clinical data were from the electronic medical record system. The risk prediction model was trained using variables selected from medical record system and published literature,23,24 including age, sex, body mass index (BMI), history of smoking and hypertension, systolic blood pressure (SBP), fasting blood glucose (FBG), postprandial blood glucose (PBG), haemoglobin A1c (Hb1Ac), fasting C-peptide (FCP), white blood cells (WBC), hemoglobin (Hb), neutrophil to lymphocyte ratio (NLR), fibrinogen (FIB), D-dimer, alanine aminotransferase (ALT), aspartate aminotransferase (AST), serum albumin (ALB), bile cid (BA), bicarbonate, blood urea nitrogen (BUN), uric acid (UA), eGFR, total cholesterol (TC), triglyceride (TG), HDL, low density lipoprotein (LDL), apolipoprotein a1 (Apoa1), apolipoprotein b (Apob), UACR, TyG index, HOMA-IR, thyroid stimulating hormone (TSH), free triiodothyronine (FT3), free tetraiodothyronine (FT4), diagnosis of diabetic retinopathy (DR) and diabetic peripheral neuropathy (DPN), as well as antidiabetic and antihypertensive treatment. The superior indicator of the HOMA-IR and TyG index for predicting DKD was also determined by comparing the area under the curve (AUC).
Statistical Analysis
Statistical analyses were performed using SPSS software version 25.0, R software version 4.2.2 and GraphPad Prism software version 9.0.0. The median (interquartile range) [M (P25, P75)] was used to represent data with a non-normal distribution, whereas the mean ± standard deviation (SD) was used to express data with a quantitative normal distribution. The qualitative variable was selected as percentages (%). A random number table generated using R software was assigned to the training and validation set in a ratio of 7: 3. There was no statistical difference between the training and validation set for all variables, so the validation set can fully validate the prediction model based on the training set. We screened the variables and built the model based on the training set, and presented the model in a nomogram visualization. In addition, we utilized the validation set to internally validate the performance and clinical utility of the model constructed based on the training set. Spearman correlation was employed for correlation analysis. For further analysis, a nomogram was developed based on multivariate analysis. The logistic regression results were presented as odds ratio (OR), 95% confidence intervals (95% CI), and P values. To obtain the perfect prediction model, we used “glmnet” package for LASSO regression screening to to further filter the predictor variables derived from the traditional univariate logistic regression. The nomogram was drawn using the R package “regplot”, and receiver operating characteristic (ROC) analysis was performed to assess how well the nomogram predicted the risk of developing DKD. Use 1000 bootstrap replications for validation. Calibration curves were conducted using the “calibrate” R package. Draw a decision curve using the “rmda” R package. P < 0.05 was considered statistically significant.
Results
Baseline Characteristics
The final queue size was 521 persons after follow-up (Figure 1). The average follow-up time of the T2DM participants was 7.8 ± 1.8 years. There were 127 DKD events (24.4%) among the 521 individuals identified in our long-time follow-up cohort.
Table 1 presents the baseline demographic and medication of 521 T2DM patients, meanwhile, Table 2 presents the laboratory measurement indicators. The R package randomly divided the whole individuals into the training set and validation set in a ratio of 7: 3. 365 participants (70%) were randomly assigned to the training set and 156 participants (30%) to the validation set. In the training set, 90 patients (24.7%) progressed to DKD, while 37 patients (23.7%) progressed to DKD in the validation set. There was no significant difference in demographic and clinical characteristics between the training and the validation set (P > 0.05). However, variables of significance include DKD participants being on average older in age, having higher FCP, higher BMI, higher BA, higher TG, higher Apob, higher UACR, higher HOMA-IR, and TyG index, and having greater proportion with a history of smoking and hypertension, a higher incidence of DPN, and a higher utilization rate of some antidiabetic and antihypertensive drugs while having lower eGFR and HDL (Table 1 and Table 2). In addition, we also develop logistic and LASSO regression, aiming to identify the related factors with DKD.
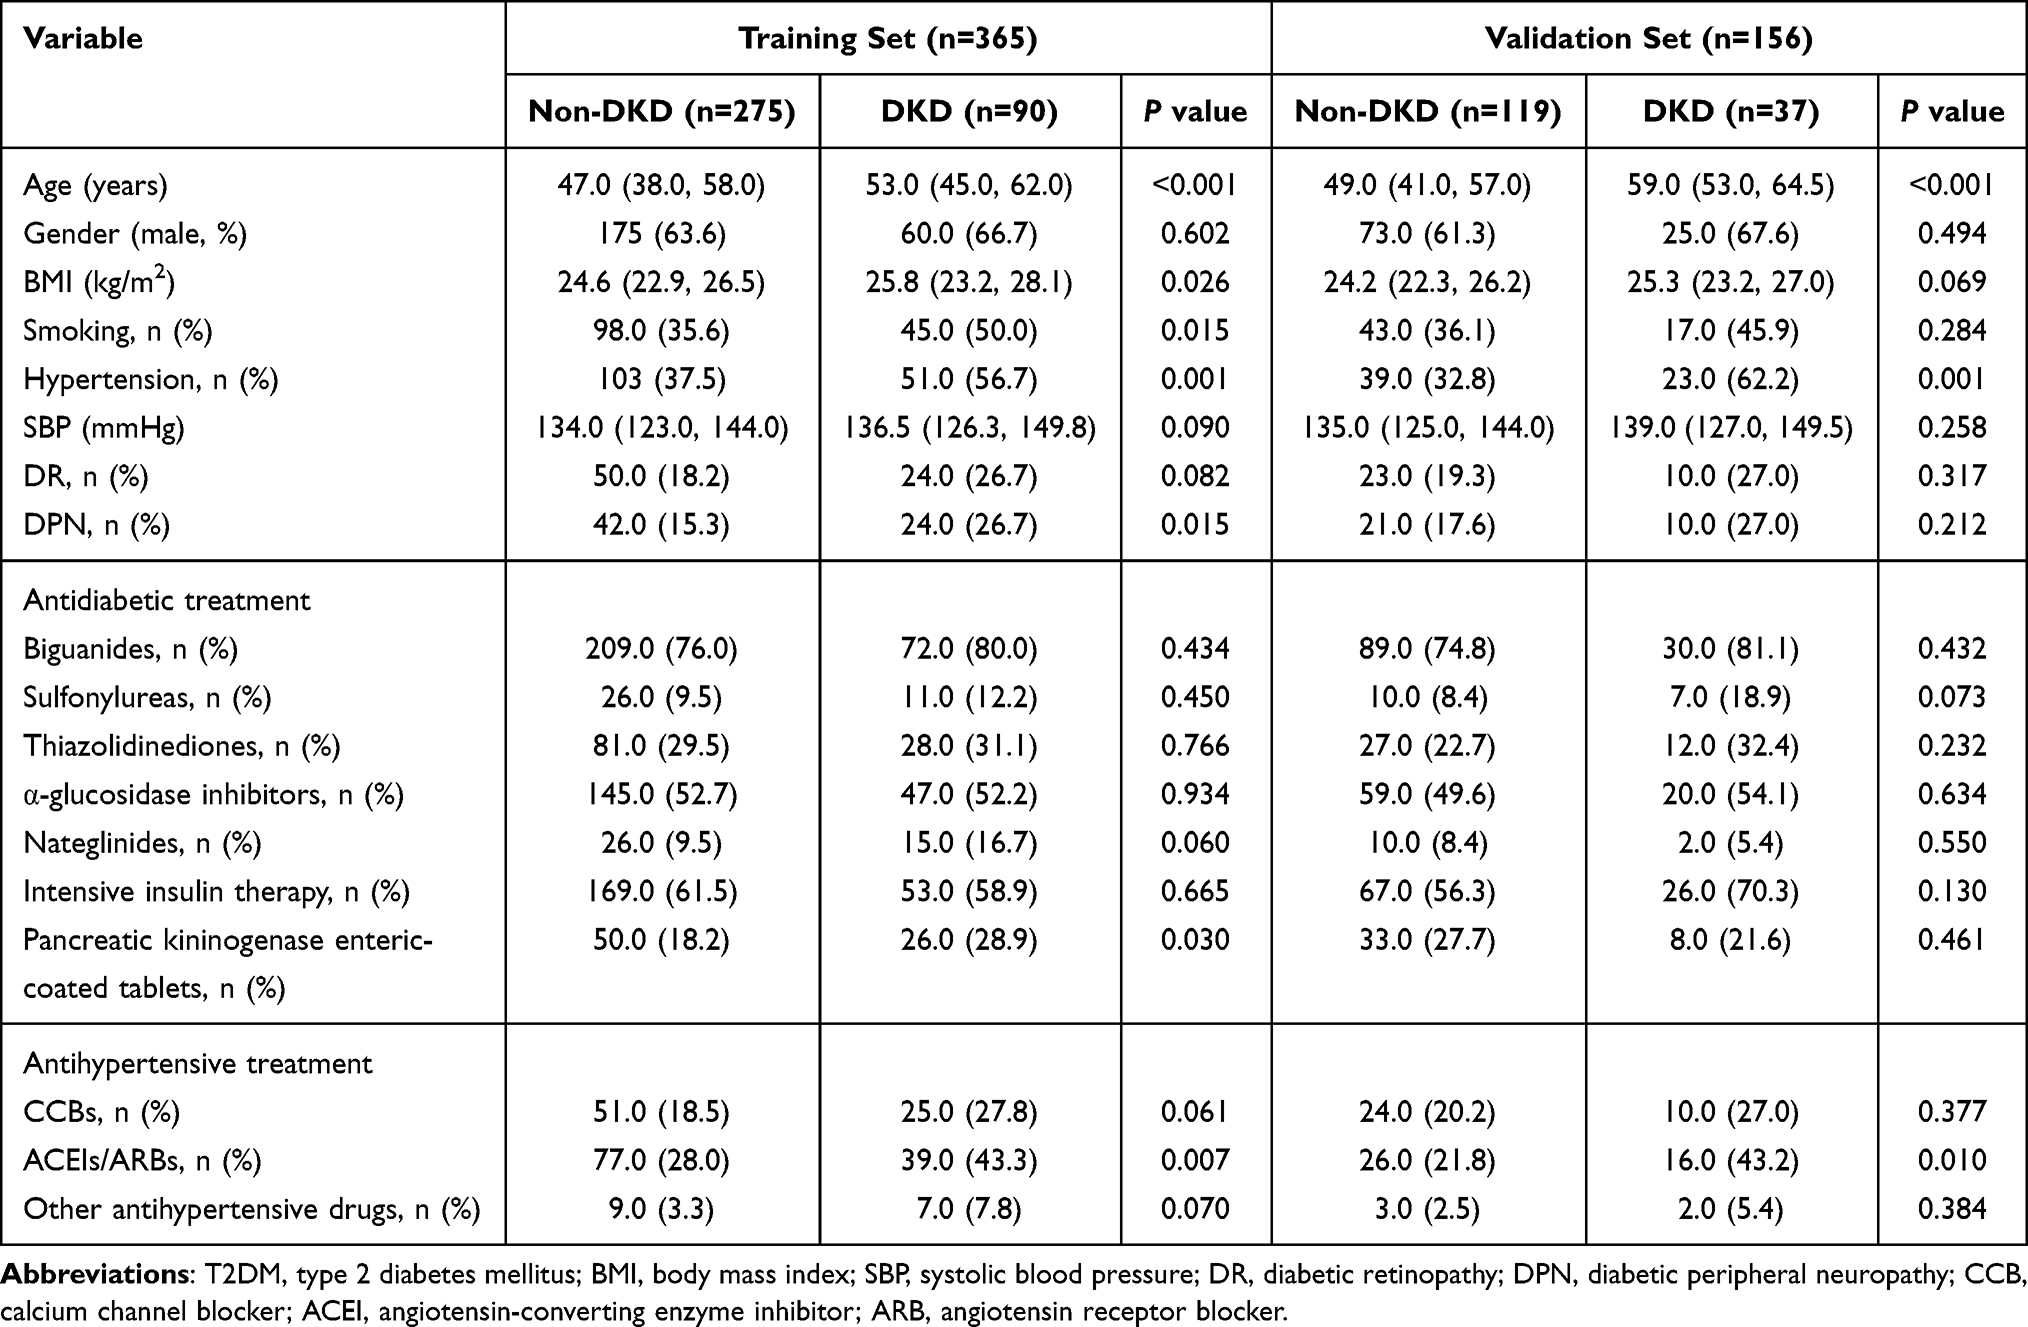 |
Table 1 Demographic and Medication of Newly Diagnosed T2DM Patients |
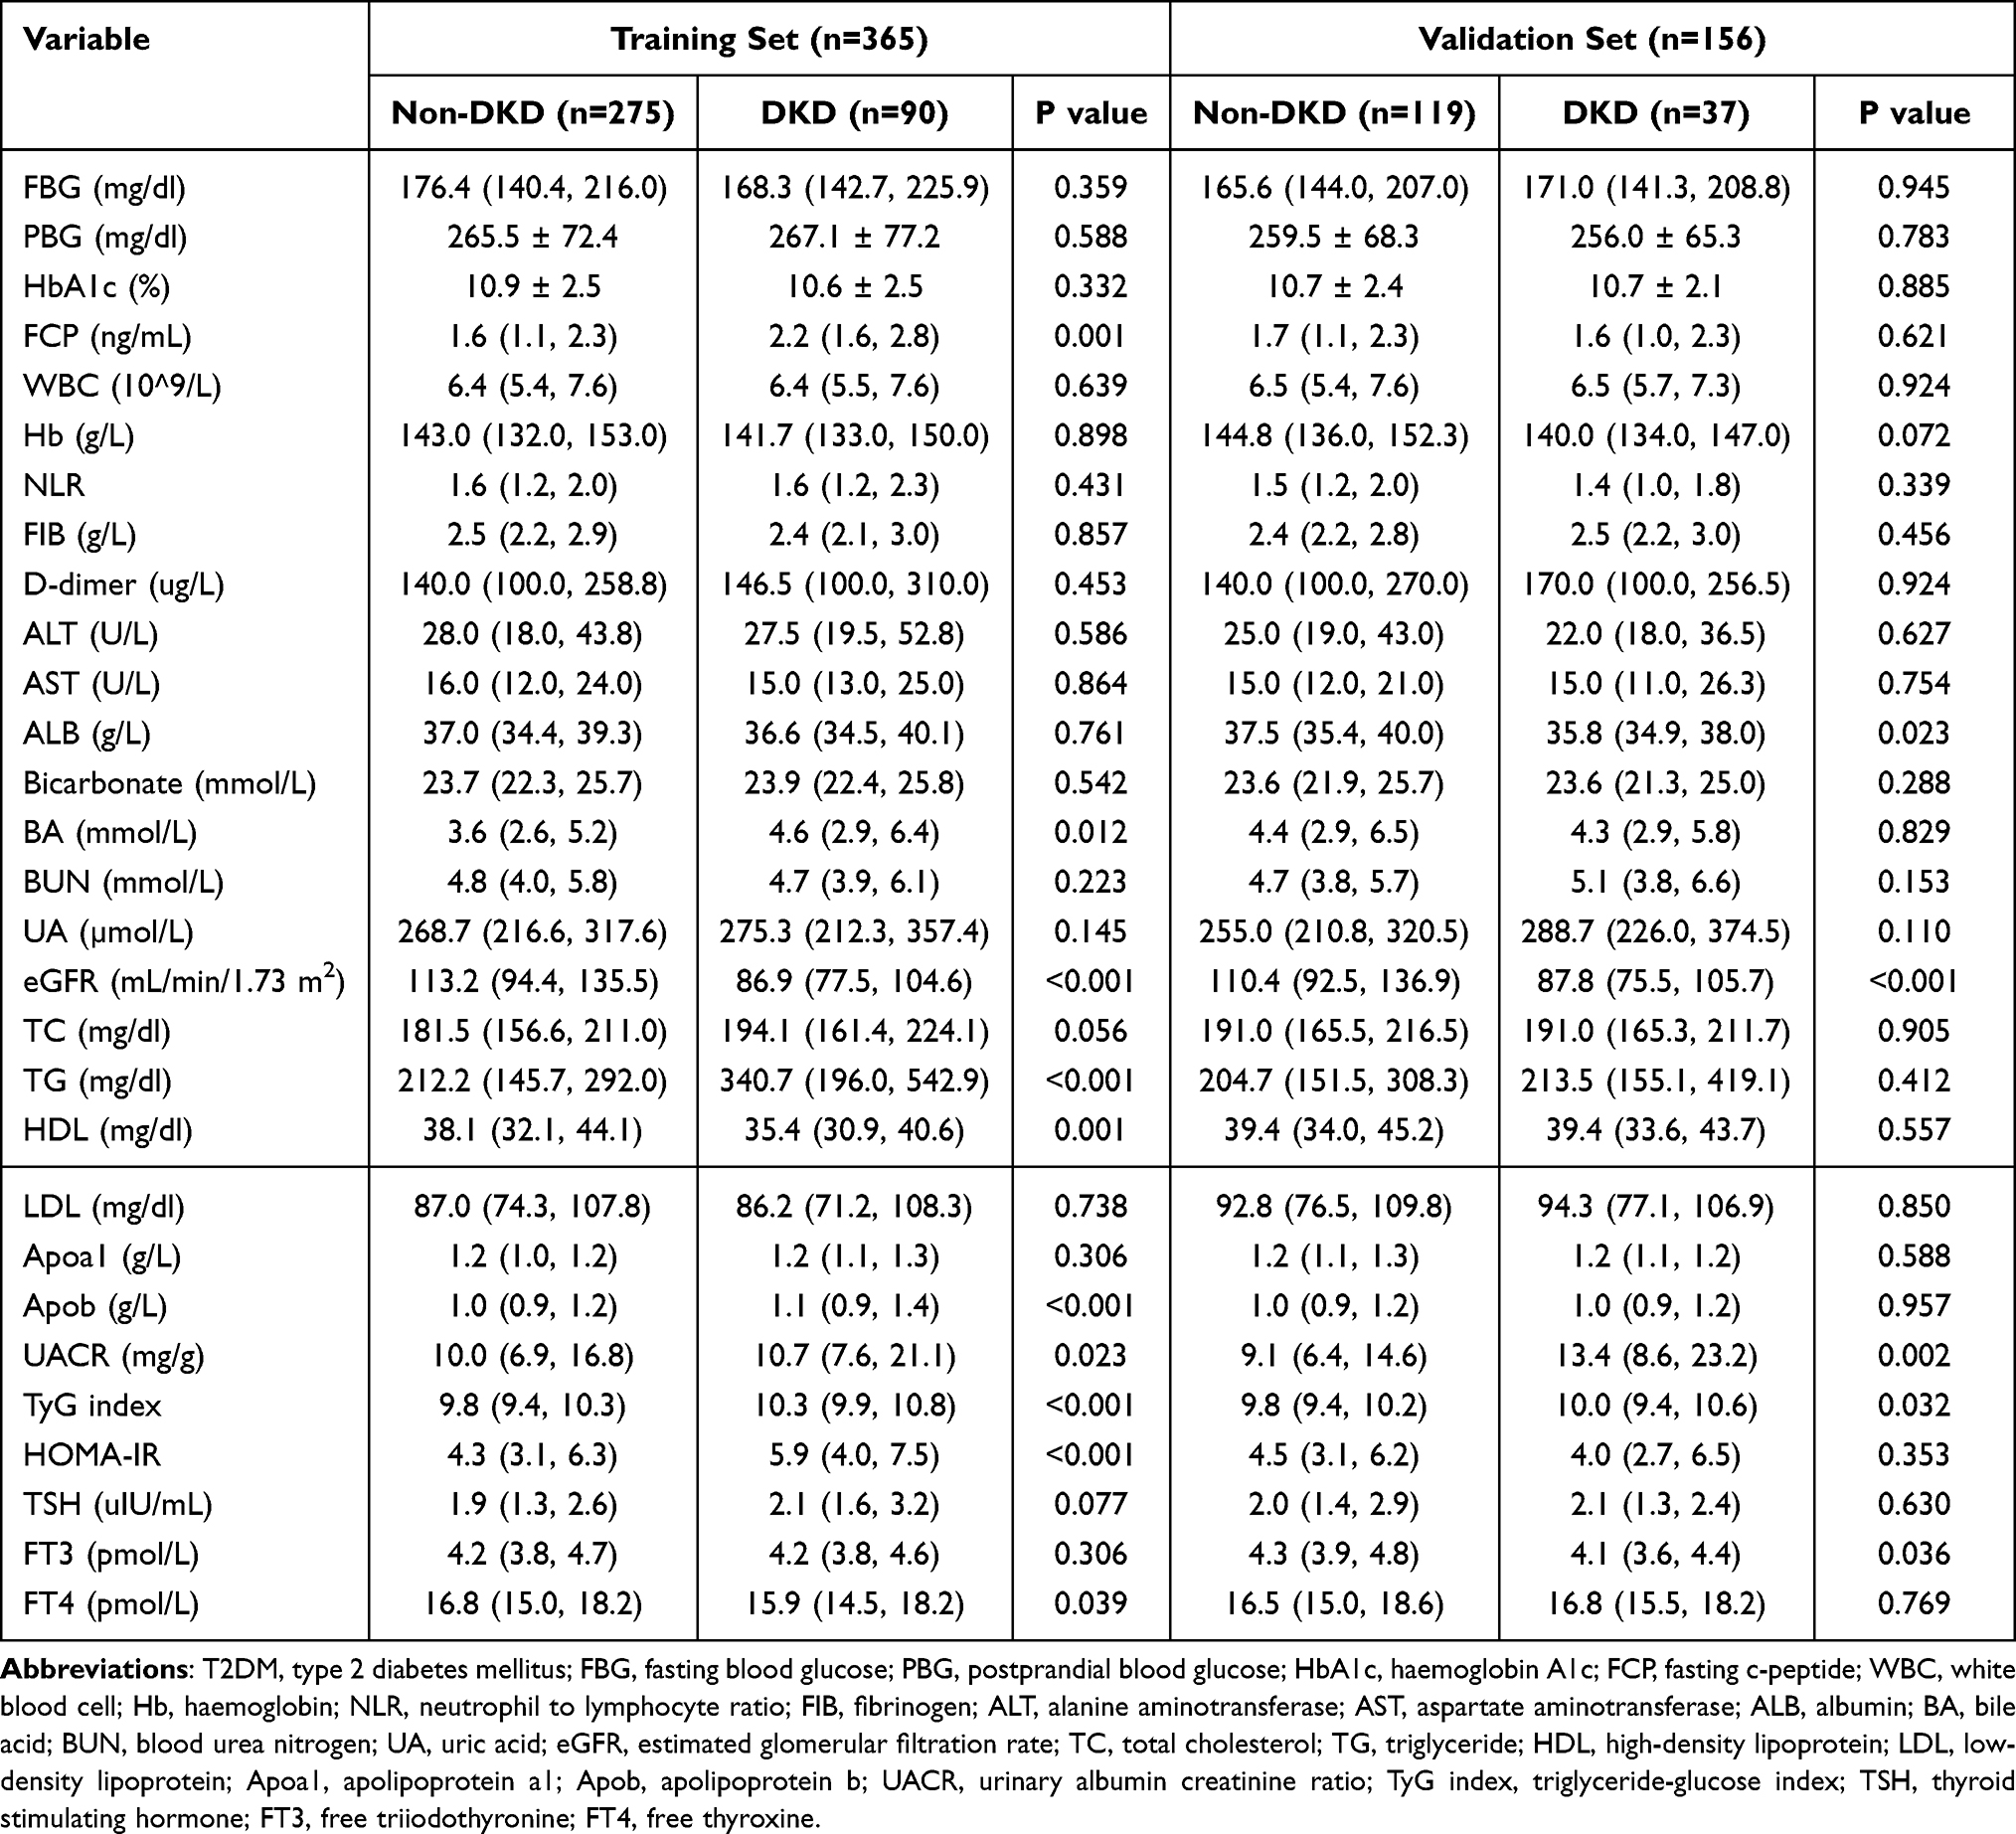 |
Table 2 Laboratory Measurement Indicators of Newly Diagnosed T2DM Patients |
Comparison of TyG Index and HOMA-IR
To evaluate the performance of the HOMA-IR and TyG index in predicting DKD, we plotted AUC. HOMA-IR and TyG index are both tools to assess IR. We determined the AUCs for the TyG index and HOMA-IR in the training set, were 0.694 (95% CI 0.630 to 0.758) and 0.640 (95% CI 0.575 to 0.705), respectively (Figure 2). The findings were following those reported in other studies, which found that TyG index was more accurate than HOMA-IR at predicting the risk of IR and DM-related complications.25,26 In addition, multivariate analysis revealed that the HOMA-IR was no statistical significance after adjusting confounding variables (Table 3).
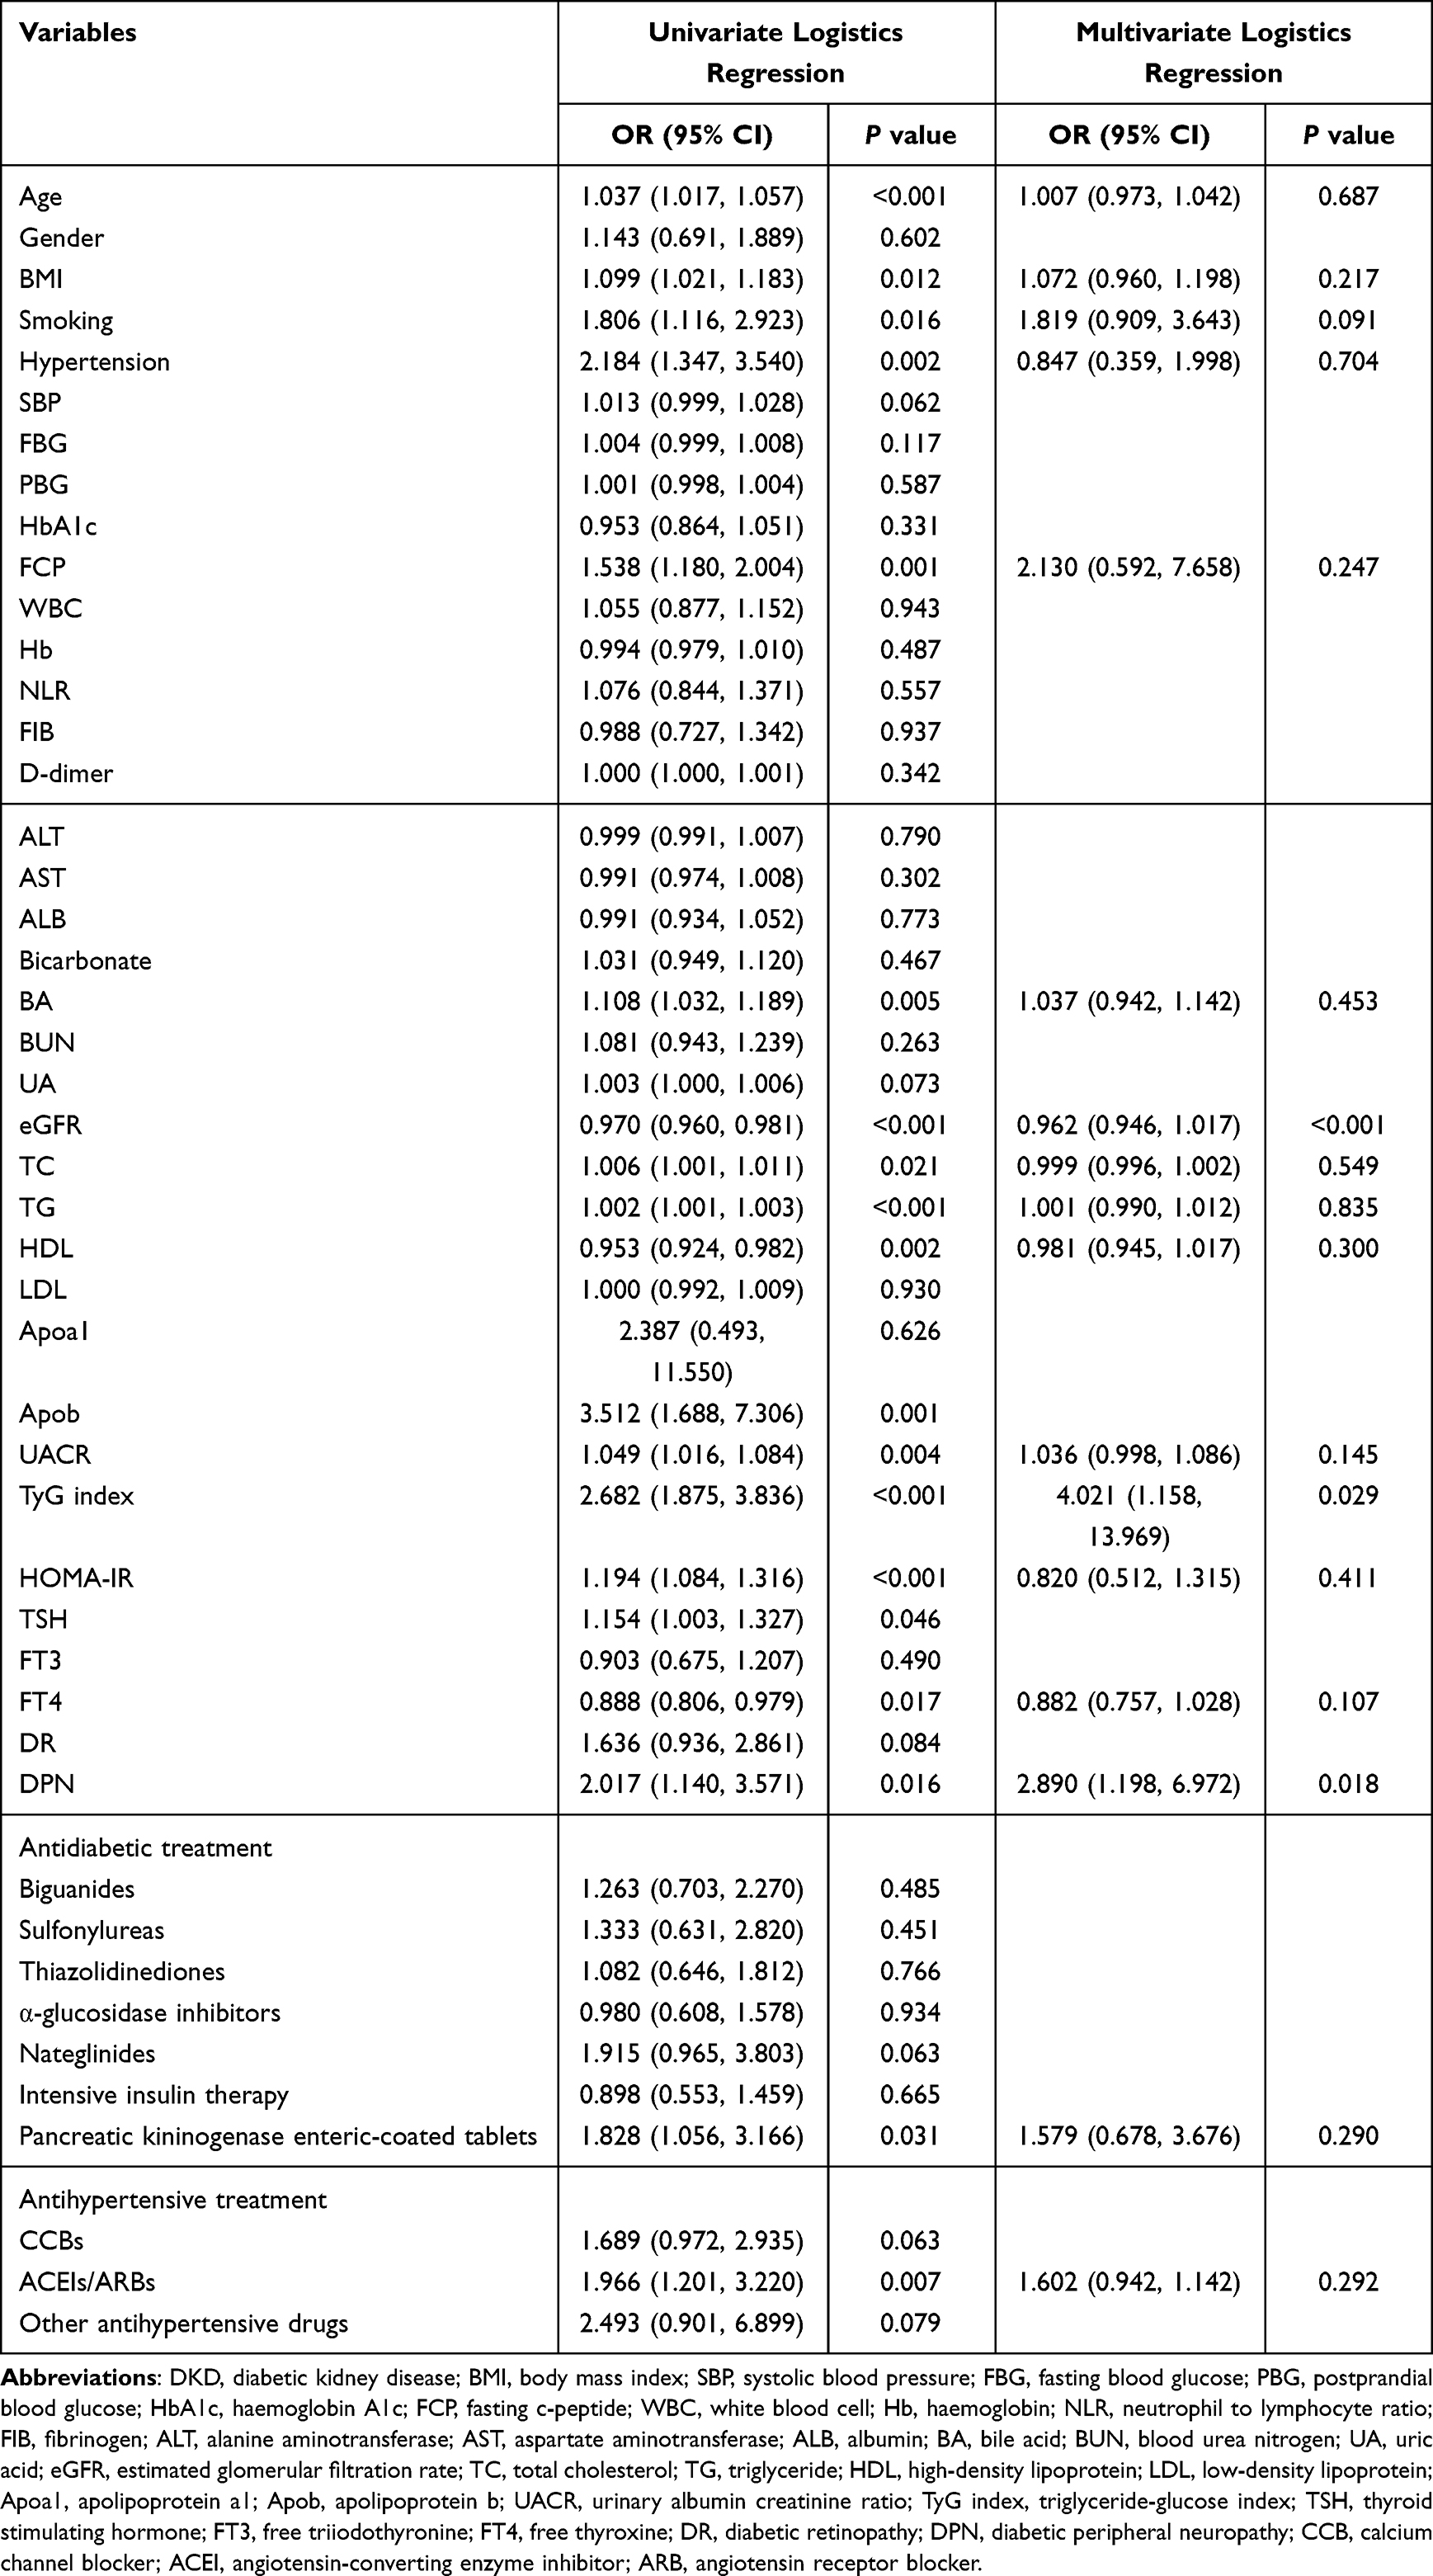 |
Table 3 Logistic Regression Analysis of DKD-Related Risk Factor |
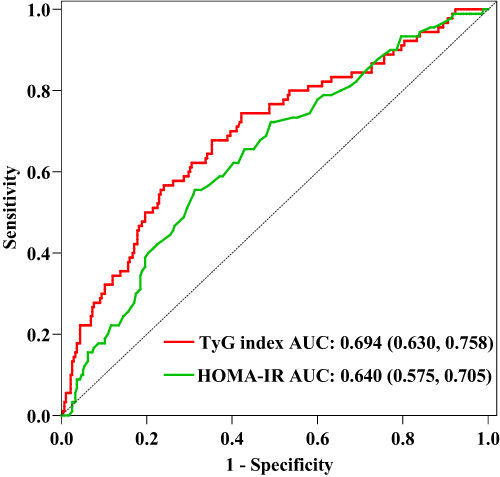 |
Figure 2 ROC curve of TyG index and HOMA-IR. Abbreviations: ROC, receiver operating characteristic; AUC, area under the curve; TyG index, triglyceride-glucose index; HOMA-IR, homeostasis model assessment for insulin resistance. Notes: ROC curve of TyG index and HOMA-IR drawn according to the training set. We calculated the AUC of the TyG index and HOMA-IR, which were 0.694 (95% CI 0.630 to 0.758) and 0.640 (95% CI 0.575 to 0.705), respectively. |
LASSO Regression Analysis
To identify the independent significant factors, we used logistic regression and LASSO regression for analysis. We conducted a correlation analysis and univariate logistic regression (Figure 3 and Table 3). Correlation analysis found a strong collinearity correlation among some variables. LASSO regression, a greedy algorithm, can be used to select the most significant variables to avoid overfitting, then establish a more accurate linear regression model.27 According to previous reports and univariate analysis, we selected 37 variables related to DKD (age, gender, BMI, smoking, hypertension, SBP, HbA1c, FBG, PBG, ALB, BUN, UA, TC, TG, HDL, LDL, Apoa1, Apob, UACR, eGFR, FCP, FT4, TyG index, HOMA-IR, DR, DPN, antihypertensive and antidiabetic treatment) for LASSO analysis. Figure 4A shows the cross-validation curve result, and the coefficient distribution plot is shown in Figure 4B. Through 10-fold cross-validation, we chose the minimum value within 1 standard error and obtained 5 independent variables that were finally screened out (Table 4).
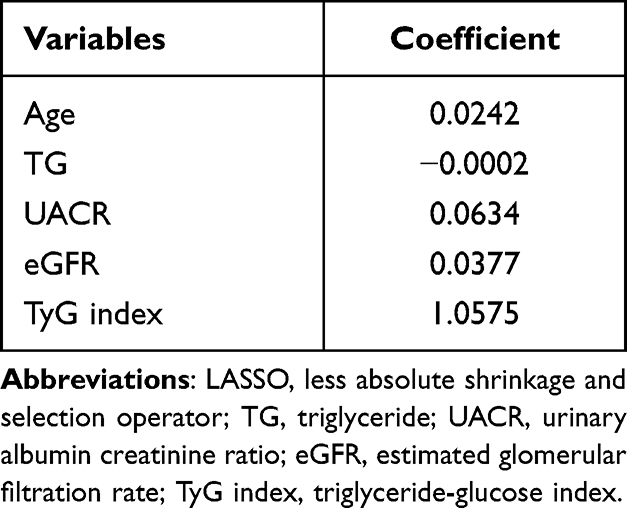 |
Table 4 LASSO Regression Analysis of DKD-Related Risk Factor |
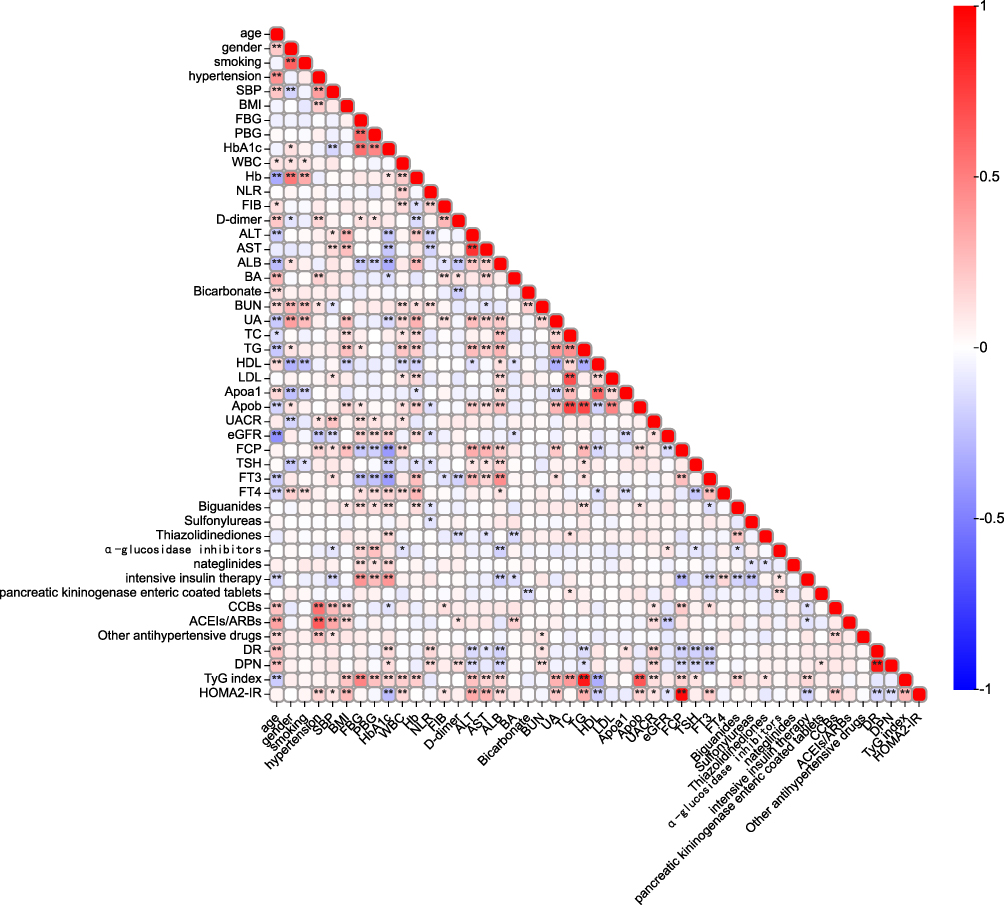 |
Figure 3 Clinical indicators correlation analysis. Abbreviations: BMI, body mass index; SBP, systolic blood pressure; FBG, fasting blood glucose; PBG, postprandial blood glucose; HbA1c, haemoglobin A1c; FCP, fasting c-peptide; WBC, white blood cell; Hb, haemoglobin; NLR, neutrophil to lymphocyte ratio; FIB, fibrinogen; ALT, alanine aminotransferase; AST, aspartate aminotransferase; ALB, albumin; BA, bile acid; BUN, blood urea nitrogen; UA, uric acid; eGFR, estimated glomerular filtration rate; TC, total cholesterol; TG, triglyceride; HDL, high-density lipoprotein; LDL, low-density lipoprotein; Apoa1, apolipoprotein a1; Apob, apolipoprotein b; UACR, urinary albumin creatinine ratio; TyG index, triglyceride-glucose index; TSH, thyroid stimulating hormone; FT3, free triiodothyronine; FT4, free thyroxine; DR, diabetic retinopathy; DPN, diabetic peripheral neuropathy; CCB, calcium channel blocker; ACEI, angiotensin-converting enzyme inhibitor; ARB, angiotensin receptor blocker. Notes: *P value < 0.05, **P value < 0.001, significant correlation between variables. |
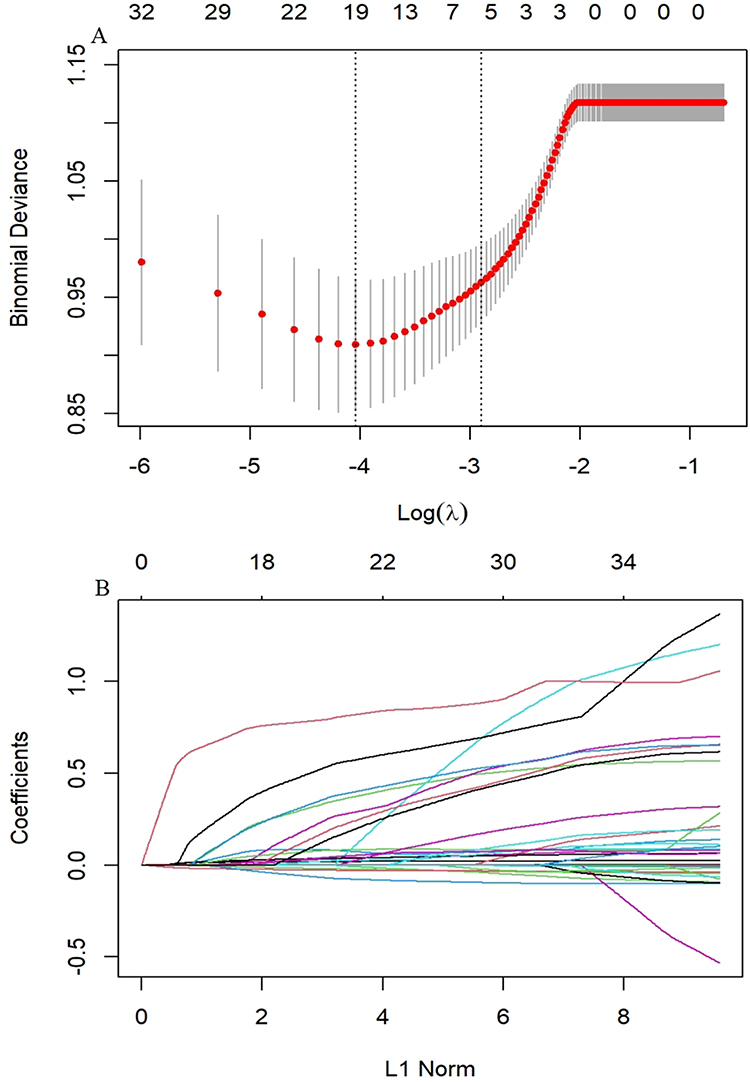 |
Figure 4 LASSO regression analysis. Abbreviation: LASSO, less absolute shrinkage and selection operator. Notes: (A) Cross-validation curve. (B) Coefficient distribution plot of 37 variables. The cross-validated error within one standard error of the minimum is shown on the right vertical line, while the minimum error is shown on the left vertical line. |
Development of an Individualized Prediction Model
To display the prediction model vividly, we applied an individualized dynamic nomogram to visualize it (Figure 5). Then, we applied ROC to analyze the performance of the prediction model. Figure 6 shows the AUC of the prediction model. For the training set, the predicted AUC of the nomogram was 0.826 (95% CI 0.775 to 0.876), meanwhile, the AUC of the validation set was 0.803 (95% CI 0.719 to 0.887).
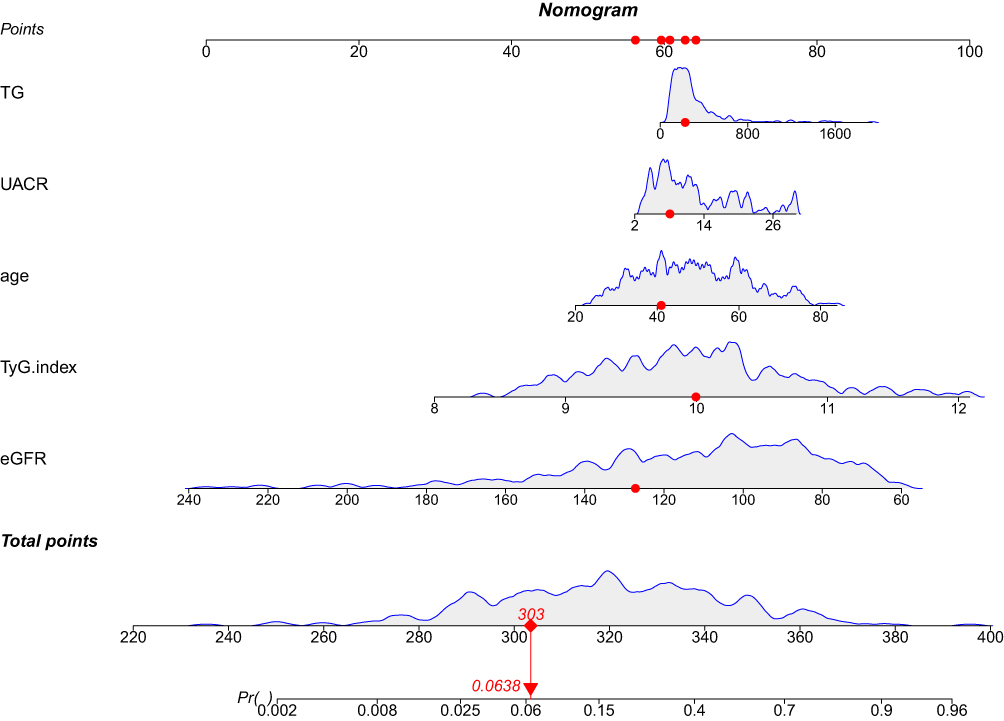 |
Figure 5 Dynamic nomogram developed for predicting DKD in patients with newly diagnosed T2DM. Abbreviations: TG, triglyceride; eGFR, estimated glomerular filtration rate; UACR, urinary albumin creatinine ratio; TyG index, triglyceride-glucose index; DKD, diabetic kidney disease; T2DM, type 2 diabetes mellitus. Notes: Dynamic nomogram can reflect the score of each variable of patients in actual situation, so as to obtain the corresponding DKD risk probability. The risk probability of DKD calculated for the first patient in the cohort by each variable score is shown in the figure above. |
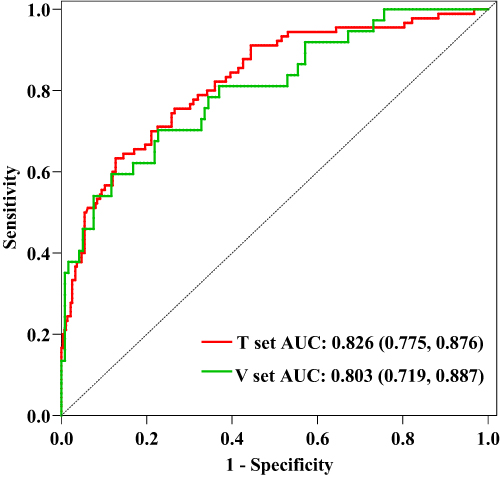 |
Figure 6 ROC curves of the predictive model. Abbreviations: ROC, Receiver operating characteristic; AUC, area under the curve; V set, validation set; T set, training set. Notes: For the training set, the predicted AUC of the nomogram was 0.826 (95% CI 0.775 to 0.876), meanwhile, the AUC of the validation set was 0.803 (95% CI 0.719 to 0.887). |
Calibration of the Model
To validate the nomogram, we used 1000 bootstrap analysis and draw a calibration curve. The calibration curves of the model revealed a strong correlation between the predicted probability and the actual probability, indicating that our model had been properly calibrated (Figure 7).
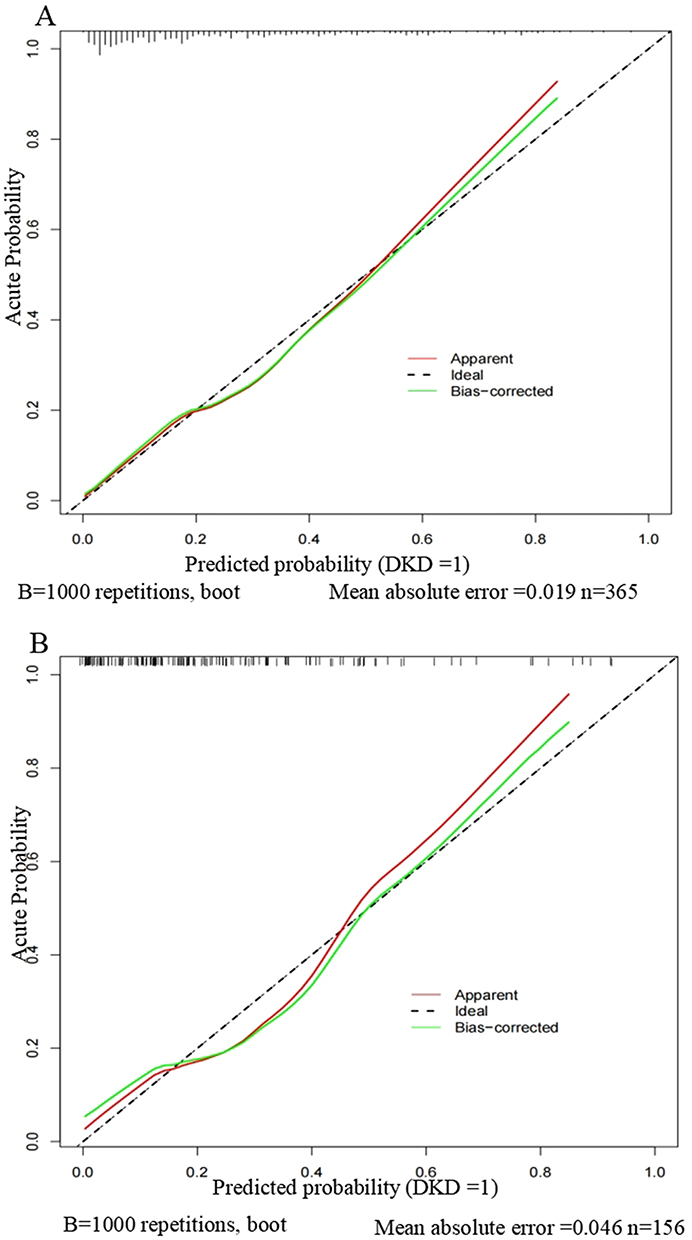 |
Figure 7 Calibration curves of the nomogram. Abbreviation: DKD, diabetic kidney disease. Notes: (A) Calibration curve of the model in the training group. (B) Calibration curve of the model in the validation group. The calibration curve reflects the consistency between the predicted probability and the actual probability. Y-axis = actual probability of DKD. X-axis = predicted probability of DKD. The shadow line represents a perfect prediction by an ideal model. The red line represents the performance of our model, which coincides well with the shadow line. |
Clinical Use of the Model
To prove the clinical practicability of the nomogram, we carried out a decision curve analysis (DCA). Figure 8 presents the DCA for the DKD nomogram. Between 20% and 40% of T2DM patients progressed to DKD,28 and within this cutoff, both decision curves were above the None and All lines. This demonstrated that predicting DKD in newly diagnosed T2DM using the nomogram model provides more clinical benefits than either treatment or no treatment for all patients.
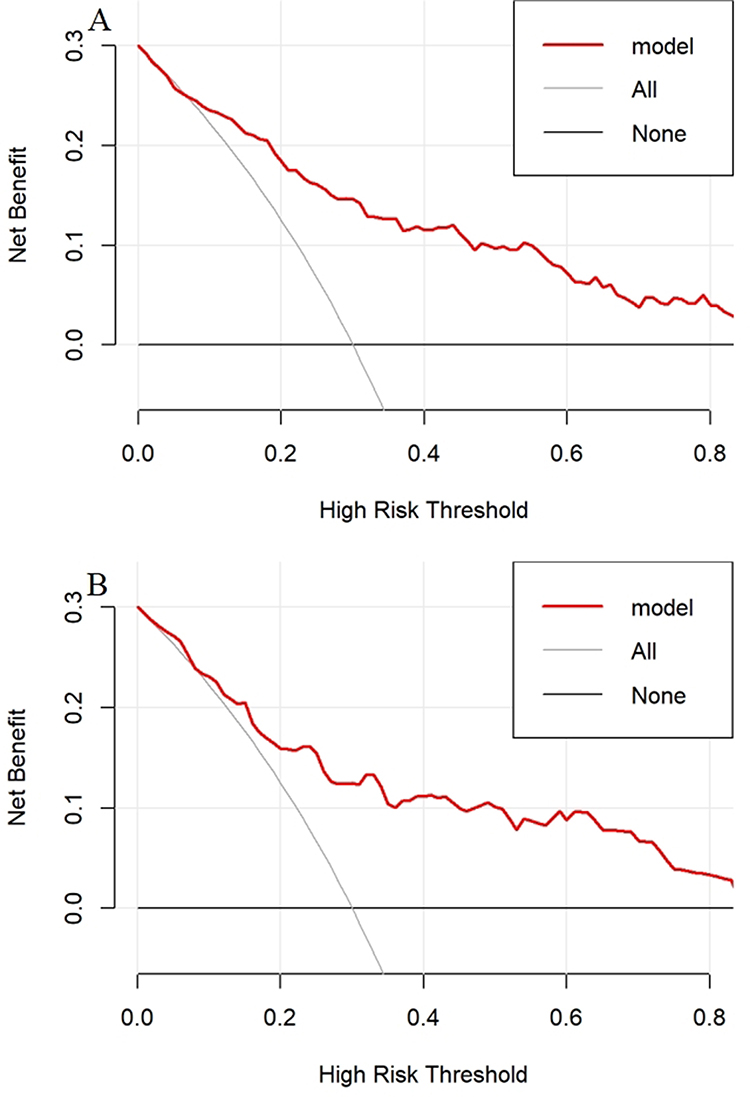 |
Figure 8 DCA for the nomogram. Abbreviations: DCA, decision curve analysis; DKD, diabetic kidney disease. Notes: (A) Decision curve of the model in the training group. (B) Decision curve of the model in the validation group. The y-axis measures the net benefit. The solid red line represents the nomogram. The solid gray line represents the assumption that all patients have DKD. The solid black line represents the assumption that no patients have DKD. |
Discussion
Our study was a single-center analysis of prospectively collected data from 521 newly diagnosed T2DM patients, 127 of whom had a DKD event. We screened variables through LASSO regression and incorporated 5 variables to construct a prediction model. Furthermore, we carried out internal validation, discrimination ability, calibration ability, and clinical practicability of the model. These results revealed that the prediction model performed well and had clinical applicability.
Independent prediction indicators were screened by logistic and LASSO regression, and finally, a DKD prediction model for predicting newly diagnosed T2DM was developed. Nomogram revealed that age, renal excretion, lipid metabolism, and IR may be potential good predictors of DKD. Age is recognized as an independent risk factor for T2DM and DKD.29 Persistent microalbuminuria (UACR > 30mg/g) can appear in the early stage of the DKD hyperfiltration state, and metabolic substances such as serum creatinine will accumulate with the decrease of renal filtration level in the later period.30 At present, some scholars considered that mitochondrial dysfunction played an indispensable role in DN, which will cause fatty acid oxidation disorder, resulting in abnormal lipid deposition in the kidney.31 Furthermore, many lipid metabolites have been confirmed to be related to the complications of DM. As an index of IR, the TyG index performs excellently in predicting complications of DM.32,33 TyG index can accurately evaluate whether IR exists only by combining two simple indexes: serum lipid and glucose. Moreover, an Australian study investigated the relationship between the TyG index and end-stage renal disease (ESRD). The results revealed a positive correlation between the TyG index and ESRD risk.9 Therefore, researchers should not ignore the relationship between IR and DKD in the future.
The onset of DKD is hidden, and it may be difficult for patients newly diagnosed with T2DM to realize the risk of developing DKD. However, if DKD occurs, we can only take symptomatic treatment (control albuminuria and serum glucose), then wait for ESRD to evolve slowly. Therefore, incorporating the clinical variables described above into the model and developing a nomogram as a screening tool can well identify newly diagnosed T2DM patients with DKD risk. For the identification of our model, the AUC of the training set and the validation set were 0.826 and 0.803, respectively. These results revealed that the model had an excellent predictive ability in identifying DKD and non-DKD in T2DM patients. The model’s calibration curve revealed a strong correlation between the predicted probability and the actual probability, indicating that our model had been properly calibrated. DCA results showed that using this model to predict DKD had clinical practicability and benefits patients.
In comparison to previous studies on developing DKD prediction models, our study had some strengths. First, our study was a retrospective cohort study with a long-time follow-up. Some patients with DKD have a DM duration of 10 years or more, so it may be difficult to collect enough participants with positive outcomes in short-term follow-up and underestimate the prevalence rate, which ultimately affects the predictive performance. Secondly, the participants in our study were newly diagnosed T2DM patients compared with other research focus individuals, who frequently overlooked the danger of developing DKD. Newly diagnosed T2DM patients are a concern in this study, and the prediction model of DKD is constructed to find all DKD events in DM patients earlier. Finally, to incorporate all related variables, we initially investigated the pathological process and risk factors for T2DM and its complications. IR is a major pathogenic factor and characteristic of T2DM, causing concomitant injury to various target organs, and DKD is no exception.34,35 It is crucial to find an index for assessing IR since it is the chief culprit of glucose metabolism disorders. The performance of the TyG index and the HOMA-IR as IR evaluation indexes varies throughout other studies. Hence, we used AUC to distinguish the performance of the TyG index from the HOMA-IR and finally revealed that the TyG index performs better. Therefore, we incorporated significant correlation factors including the TyG index, constructing a more accurate prediction model.
There were still some limitations in this trial. First, the lack of external validation was one of the important limitations of our study. To duplicate and externally verify the results of this study, more investigation is required. Secondly, this was a cohort study with limited sample size, so the endpoint event was defined as the occurrence of DKD, and no subgroup analysis was carried out. If DKD was divided into subgroups with different renal function levels according to eGFR stages, the research results would be more abundant. In addition, the family history of DM was missing from baseline data, and it is undeniable that it is also a significant factor in the development of DKD. Finally, since this was a retrospective cohort study, it may suffer from recollection bias and loss of follow-up. In this cohort study, there were 82 participants with loss to follow-up, which was controlled within 10% and had no significant impact on the outcome.
Conclusion
In conclusion, the new DKD progression model for T2DM patients constructed in this study had excellent identification and calibration ability, which was helpful for clinical practice. In the future, we need to integrate large-scale T2DM cohort studies to further verify this nomogram prediction model.
Data Sharing Statement
The data underlying this article will be shared on reasonable request to the corresponding author.
Ethics Statement
This research study was complied with the Declaration of Helsinki, and approved by the Ethics Committee of the Third Affiliated Hospital of Soochow University (2013#27). All individuals provided written informed consent for this research study.
Author Contributions
All authors made a significant contribution to the work reported, whether that is in the conception, study design, execution, acquisition of data, analysis and interpretation, or in all these areas; took part in drafting, revising or critically reviewing the article; gave final approval of the version to be published; have agreed on the journal to which the article has been submitted; and agree to be accountable for all aspects of the work.
Funding
This work was supported by grants from the National Natural Science Foundation of China (82000684) and Changzhou Sci & Tech Program (CE20215024) and Top Talent of Changzhou “The 14th Five-Year Plan” High-Level Health Talents Training Project (2022260).
Disclosure
The authors report no conflicts of interest in this work.
References
1. Sun H, Saeedi P, Karuranga S, et al. IDF diabetes atlas: global, regional and country-level diabetes prevalence estimates for 2021 and projections for 2045. Diabetes Res Clin Pract. 2022;183:109119. doi:10.1016/j.diabres.2021.109119
2. Afkarian M, Zelnick LR, Hall YN, et al. Clinical manifestations of kidney disease among US adults with diabetes, 1988–2014. JAMA. 2016;316(6):602–610. doi:10.1001/jama.2016.10924
3. Alicic RZ, Rooney MT, Tuttle KR. Diabetic kidney disease: challenges, progress, and possibilities. Clin J Am Soc Nephrol. 2017;12(12):2032–2045. doi:10.2215/CJN.11491116
4. Colhoun HM, Marcovecchio ML. Biomarkers of diabetic kidney disease. Diabetologia. 2018;61(5):996–1011. doi:10.1007/s00125-018-4567-5
5. Di Bonito P, Mozzillo E, Rosanio FM, et al. Albuminuric and non-albuminuric reduced eGFR phenotypes in youth with type 1 diabetes: factors associated with cardiometabolic risk. NMCD. 2021;31(7):2033–2041. doi:10.1016/j.numecd.2021.03.019
6. Tonneijck L, Muskiet MHA, Smits MM, et al. Glomerular hyperfiltration in diabetes: mechanisms, clinical significance, and treatment. JASN. 2017;28(4):1023–1039. doi:10.1681/ASN.2016060666
7. Chan DT, Watts GF, Irish AB, Dogra GK. Insulin resistance and vascular dysfunction in chronic kidney disease: mechanisms and therapeutic interventions. Nephrol Dial Transplant. 2017;32(8):1274–1281. doi:10.1093/ndt/gfv326
8. Nakashima A, Kato K, Ohkido I, Yokoo T. Role and treatment of insulin resistance in patients with chronic kidney disease: a review. Nutrients. 2021;13(12):4349. doi:10.3390/nu13124349
9. Chamroonkiadtikun P, Ananchaisarp T, Wanichanon W. The triglyceride-glucose index, a predictor of type 2 diabetes development: a retrospective cohort study. Prim Care Diabetes. 2020;14(2):161–167. doi:10.1016/j.pcd.2019.08.004
10. Liu L, Xia R, Song X, et al. Association between the triglyceride-glucose index and diabetic nephropathy in patients with type 2 diabetes: a cross-sectional study. J Diabetes Investig. 2021;12(4):557–565. doi:10.1111/jdi.13371
11. Luciano RL, Moeckel GW. Update on the native kidney biopsy: core curriculum 2019. Am J Kidney Dis. 2019;73(3):404–415. doi:10.1053/j.ajkd.2018.10.011
12. Elahi D. In praise of the hyperglycemic clamp. A method for assessment of beta-cell sensitivity and insulin resistance. Diabetes Care. 1996;19(3):278–286. doi:10.2337/diacare.19.3.278
13. Matthews DR, Hosker JP, Rudenski AS, Naylor BA, Treacher DF, Turner RC. Homeostasis model assessment: insulin resistance and beta-cell function from fasting plasma glucose and insulin concentrations in man. Diabetologia. 1985;28(7):412–419. doi:10.1007/BF00280883
14. Association AD. 11. Microvascular complications and foot care. Diabetes Care. 2019;42(Suppl 1):S124–S138. doi:10.2337/dc19-S011
15. Tao L-C, J-n X, Wang -T-T, Hua F, J-j L. Triglyceride-glucose index as a marker in cardiovascular diseases: landscape and limitations. Cardiovasc Diabetol. 2022;21(1):68. doi:10.1186/s12933-022-01511-x
16. Tang G, Qi L, Sun Z, et al. Evaluation and analysis of incidence and risk factors of lower extremity venous thrombosis after urologic surgeries: a prospective two-center cohort study using LASSO-logistic regression. Int J Surg. 2021;89:105948. doi:10.1016/j.ijsu.2021.105948
17. Shao Y, Jia H, Huang L, et al. An original ferroptosis-related gene signature effectively predicts the prognosis and clinical status for colorectal cancer patients. Front Oncol. 2021;11:711776. doi:10.3389/fonc.2021.711776
18. He J, Chen Z, Xue Q, et al. Identification of molecular subtypes and a novel prognostic model of diffuse large B-cell lymphoma based on a metabolism-associated gene signature. J Transl Med. 2022;20(1):186. doi:10.1186/s12967-022-03393-9
19. McEligot AJ, Poynor V, Sharma R, Panangadan A. Logistic LASSO regression for dietary intakes and breast cancer. Nutrients. 2020;12(9):2652. doi:10.3390/nu12092652
20. Wu L, Zhou B, Liu D, et al. LASSO regression-based diagnosis of acute ST-Segment Elevation Myocardial Infarction (STEMI) on Electrocardiogram (ECG). J Clin Med. 2022;11(18):5408. doi:10.3390/jcm11185408
21. Levey AS, Stevens LA, Schmid CH, et al. A new equation to estimate glomerular filtration rate. Ann Intern Med. 2009;150(9):604–612. doi:10.7326/0003-4819-150-9-200905050-00006
22. Lameire NH, Levin A, Kellum JA, et al. Harmonizing acute and chronic kidney disease definition and classification: report of a Kidney Disease: improving Global Outcomes (KDIGO) consensus conference. Kidney Int. 2021;100(3):516–526. doi:10.1016/j.kint.2021.06.028
23. Dong Z, Wang Q, Ke Y, et al. Prediction of 3-year risk of diabetic kidney disease using machine learning based on electronic medical records. J Transl Med. 2022;20(1):143. doi:10.1186/s12967-022-03339-1
24. Yamanouchi M, Furuichi K, Shimizu M, et al. Serum hemoglobin concentration and risk of renal function decline in early stages of diabetic kidney disease: a nationwide, biopsy-based cohort study. Nephrol Dial Transplant. 2022;37(3):489–497. doi:10.1093/ndt/gfab185
25. Gao W, Wang J, Chen Y, et al. Discordance between the triglyceride glucose index and HOMA-IR in incident albuminuria: a cohort study from China. Lipids Health Dis. 2021;20(1):176. doi:10.1186/s12944-021-01602-w
26. Wang S, Shi J, Peng Y, et al. Stronger association of triglyceride glucose index than the HOMA-IR with arterial stiffness in patients with type 2 diabetes: a real-world single-centre study. Cardiovasc Diabetol. 2021;20(1):82. doi:10.1186/s12933-021-01274-x
27. J-y H, Wang Y, Tong X-M, Yang T. When to consider logistic LASSO regression in multivariate analysis? Eur J Surg Oncol. 2021;47(8):2206. doi:10.1016/j.ejso.2021.04.011
28. Persson F, Rossing P. Diagnosis of diabetic kidney disease: state of the art and future perspective. Kidney Int Suppl. 2018;8(1):2–7. doi:10.1016/j.kisu.2017.10.003
29. Jiang W, Wang J, Shen X, et al. Establishment and validation of a risk prediction model for early diabetic kidney disease based on a systematic review and meta-analysis of 20 cohorts. Diabetes Care. 2020;43(4):925–933. doi:10.2337/dc19-1897
30. Ricciardi CA, Gnudi L. Kidney disease in diabetes: from mechanisms to clinical presentation and treatment strategies. Metabolism. 2021;124:154890. doi:10.1016/j.metabol.2021.154890
31. Forbes JM, Thorburn DR. Mitochondrial dysfunction in diabetic kidney disease. Nat Rev Nephrol. 2018;14(5):291–312. doi:10.1038/nrneph.2018.9
32. Park K, Ahn CW, Lee SB, et al. Elevated TyG index predicts progression of coronary artery calcification. Diabetes Care. 2019;42(8):1569–1573. doi:10.2337/dc18-1920
33. Wu Z, Zhou D, Liu Y, et al. Association of TyG index and TG/HDL-C ratio with arterial stiffness progression in a non-normotensive population. Cardiovasc Diabetol. 2021;20(1):134. doi:10.1186/s12933-021-01330-6
34. Penno G, Solini A, Orsi E, et al. Insulin resistance, diabetic kidney disease, and all-cause mortality in individuals with type 2 diabetes: a prospective cohort study. BMC Med. 2021;19(1):66. doi:10.1186/s12916-021-01936-3
35. Wang Z, Xie J, Wang J, Feng W, Liu N, Liu Y. Association between a novel metabolic score for insulin resistance and mortality in people with diabetes. Front Cardiovasc Med. 2022;9:895609. doi:10.3389/fcvm.2022.895609
 © 2023 The Author(s). This work is published and licensed by Dove Medical Press Limited. The full terms of this license are available at https://www.dovepress.com/terms.php and incorporate the Creative Commons Attribution - Non Commercial (unported, v3.0) License.
By accessing the work you hereby accept the Terms. Non-commercial uses of the work are permitted without any further permission from Dove Medical Press Limited, provided the work is properly attributed. For permission for commercial use of this work, please see paragraphs 4.2 and 5 of our Terms.
© 2023 The Author(s). This work is published and licensed by Dove Medical Press Limited. The full terms of this license are available at https://www.dovepress.com/terms.php and incorporate the Creative Commons Attribution - Non Commercial (unported, v3.0) License.
By accessing the work you hereby accept the Terms. Non-commercial uses of the work are permitted without any further permission from Dove Medical Press Limited, provided the work is properly attributed. For permission for commercial use of this work, please see paragraphs 4.2 and 5 of our Terms.