Back to Journals » Journal of Hepatocellular Carcinoma » Volume 10
Predicting T Cell-Inflamed Gene Expression Profile in Hepatocellular Carcinoma Based on Dynamic Contrast-Enhanced Ultrasound Radiomics
Authors Wang Y ![]() , Weng W, Liang R, Zhou Q
, Weng W, Liang R, Zhou Q ![]() , Hu H, Li M, Chen L, Chen S, Peng S, Kuang M
, Hu H, Li M, Chen L, Chen S, Peng S, Kuang M ![]() , Xiao H, Wang W
, Xiao H, Wang W
Received 29 August 2023
Accepted for publication 10 November 2023
Published 18 December 2023 Volume 2023:10 Pages 2291—2303
DOI https://doi.org/10.2147/JHC.S437415
Checked for plagiarism Yes
Review by Single anonymous peer review
Peer reviewer comments 2
Editor who approved publication: Dr David Gerber
Yijie Wang,1,* Weixiang Weng,2,* Ruiming Liang,3,* Qian Zhou,3 Hangtong Hu,4 Mingde Li,4 Lida Chen,4 Shuling Chen,4 Sui Peng,1,3 Ming Kuang,2,4,5 Han Xiao,6 Wei Wang4
1Department of Gastroenterology and Hepatology, the First Affiliated Hospital, Sun Yat-sen University, Guangzhou, Guangdong Province, People’s Republic of China; 2Center of Hepato-Pancreato-Biliary Surgery, the First Affiliated Hospital, Sun Yat-sen University, Guangzhou, Guangdong Province, People’s Republic of China; 3Clinical Trials Unit, the First Affiliated Hospital, Sun Yat-Sen University, Guangzhou, Guangdong Province, People’s Republic of China; 4Department of Medical Ultrasonics, Institute of Diagnostic and Interventional Ultrasound, the First Affiliated Hospital, Sun Yat-Sen University, Guangzhou, Guangdong Province, People’s Republic of China; 5Cancer Center, the First Affiliated Hospital, Sun Yat-sen University, Guangzhou, Guangdong Province, People’s Republic of China; 6Department of Medical Ultrasonics, the First Affiliated Hospital, Sun Yat-Sen University, Guangzhou, Guangdong Province, People’s Republic of China
*These authors contributed equally to this work
Correspondence: Han Xiao, Department of Medical Ultrasonics, the First Affiliated Hospital, Sun Yat-Sen University, Guangzhou, Guangdong Province, People’s Republic of China, Tel/Fax +86-20-87755766-8576, Email [email protected] Wei Wang, Department of Medical Ultrasonics, Institute of Diagnostic and Interventional Ultrasound, the First Affiliated Hospital, Sun Yat-Sen University, Guangzhou, Guangdong Province, People’s Republic of China, Tel/Fax +86-20-87755766-8576, Email [email protected]
Purpose: The T cell-inflamed gene expression profile (GEP) quantifies 18 genes’ expression indicative of a T-cell immune tumor microenvironment, playing a crucial role in the immunotherapy of hepatocellular carcinoma (HCC). Our study aims to develop a radiomics-based machine learning model using contrast-enhanced ultrasound (CEUS) for predicting T cell-inflamed GEP in HCC.
Methods: The primary cohort of HCC patients with preoperative CEUS and RNA sequencing data of tumor tissues at the single center was used to construct the model. A total of 5936 radiomics features were extracted from the regions of interest in representative images of each phase, and the least absolute shrinkage and selection operator and logistic regression were used to construct four models including three phase-specific models and an integrated model. The area under the curve (AUC) was calculated to evaluate the performance of the model. The independent cohort of HCC patients with preoperative CEUS and Immunoscore based on immunohistochemistry and digital pathology was used to validate the correlation between model prediction value and T-cell infiltration.
Results: There were 268 patients enrolled in the primary cohort and 46 patients enrolled in the independent cohort. Compared with the other three models, the AP model constructed by 36 arterial phase (AP) features showed good performance with a mean AUC of 0.905 in the 5-fold cross-validation and was easier to apply in the clinical setting. The decision curve and calibration curve confirmed the clinical utility of the model. In the independent cohort, patients with high Immunoscores showed significantly higher GEP prediction values than those with low Immunoscores (t=− 2.359, p=0.029).
Conclusion: The CEUS-based model is a reliable predictive tool for T cell-inflamed GEP in HCC, and might facilitate individualized immunotherapy decision-making.
Keywords: Radiomics, Contrast-enhanced ultrasound, Hepatocellular carcinoma, T cell-inflamed gene expression profile
Introduction
The T cell-inflamed gene expression profile (GEP) is a weighted sum of standardized expression values of 18 genes associated with IFN-γ signaling, cytotoxic effector molecules, antigen presentation, and T cell active cytokines, which are shared characteristics of a T cell-inflamed tumor microenvironment (TME) responsive to immune checkpoint inhibitors (ICIs).1 Patients with the T-cell inflammation gene signature have demonstrated improved prognosis of immunotherapy in a diverse range of solid tumors, including hepatocellular carcinoma (HCC).1–7
Contrast-enhanced ultrasound (CEUS) is one of the most commonly used screening and evaluation tools for HCC.8,9 Compared with CT and MRI, CEUS has the advantages of being radiation-free, having superior contrast resolution, and offering real-time continuous detection.10 However, conventional CEUS plays a limited role in prognosticating treatment outcomes. This could be due to the fact that image information related to drug responsiveness may be invisible to human observers. Radiomics is a rapidly developing field of medical research. It deeply mines lots of high-throughput information from medical images, including shape, grayscale, textures and intricate pathophysiological information difficult to detect or quantify by the naked human eyes.11,12 Recently, CEUS-based radiomics has shown promising results in predicting specific clinical events in HCC, including cancer diagnosis, prognosis prediction, pathology characteristics and gene expression.13–16 Besides, some studies have demonstrated the viability of radiomics in predicting inherent molecular subtypes and immune status.17–20 However, no research is available on using radiomics-based methods to predict T cell-inflamed GEP to assess tumor microenvironment.
Immunotherapy-based systemic therapy has been confirmed to effectively prolong the survival of patients with advanced HCC.21 Recently, the strategy of immunotherapy combined with targeted agents has also shown promising efficacy in neoadjuvant/adjuvant therapy for resectable HCC.22,23 However, it is important to note that not all patients can benefit from immunotherapy, as the overall objective response rate and survival benefits for HCC patients remain limited.24–27 Therefore, a significant challenge in the management of HCC is optimizing patient selection for ICIs while minimizing potential side effects for those who are unlikely to benefit from these therapeutic strategies. T cell-inflamed GEP has been proposed as a promising biomarker for predicting response to ICIs. However, all universal tests are invasive and incur a substantial cost, which limits their clinical applicability. Therefore, there is a crucial need for a noninvasive, cost-efficient tool for pre-treatment prediction of T cell-inflamed GEP in HCC patients.
Hence, this study aims to develop a radiomics model based on CEUS for predicting T cell-inflamed GEP in HCC patients.
Material and Methods
Patient Population
This study was approved by the institutional Ethics Committee of the First Affiliated Hospital of Sun Yat-sen University, and written informed consent was obtained from each patient before collecting their tumor samples.
Between August 2012 and August 2020, 268 HCC patients with post-operative frozen tumor samples in the First Affiliated Hospital of Sun Yat-sen University were enrolled as the primary cohort for model construction and validation. Inclusion criteria were as follows: (1) HCC confirmed pathologically; (2) patients had undergone CEUS within one month before surgery; (3) RNA sequencing (RNA-seq) was performed on resected tumor tissues and T cell-inflamed GEP was calculated. The exclusion criteria included: (1) poor image quality of target lesions; (2) had received preoperative anticancer therapy; (3) incomplete clinic-pathological data. Furthermore, we retrospectively included 46 patients from our previous study who had assessed Immunoscore but did not have RNA-seq data.28 These patients were selected based on the same criteria mentioned above and were considered as an independent cohort. This cohort was utilized to evaluate the association between the Rad-score (prediction value of the model) and T-cell infiltration.
RNA-Seq and T Cell-Inflamed GEP
Tumor tissues were immediately snap-frozen in liquid nitrogen within 30 minutes after surgical resection and stored at −80°C until further analysis. HiSeq X TEN platform was used for RNA-seq (details shown in Appendix 1). T cell-inflamed GEP was calculated as a weighted sum of standardized expression values of 18 genes (PSMB10, HLA-DQA1, HLA-DRB1, CMKLR1, HLA-E, NKG7, CD8A, CCL5, CXCL9, CD27, CXCR6, IDO1, STAT1, CD274 (PD-L1), CD276 (B7-H3), LAG3, PDCD1LG2 (PDL2), TIGIT) as described in previous literature.1,6
Immunohistochemistry and Immunoscore Calculation
The Immunoscores of HCC were evaluated by the method reported by Galon et al.29 Further information regarding immunohistochemistry and the calculation of Immunoscore can be found in Appendix 2. The Immunoscore ≥ 3 was defined as high Immunoscore and Immunoscore ≤ 2 was defined as low Immunoscore.
CEUS Examination and Tumor Segmentation
The CEUS examinations were conducted within one month before surgery by experienced ultrasound physicians with at least 10 years of hepatic CEUS experience. First, the entire liver was examined, and the target lesions were evaluated and recorded by grayscale US. Second, 2.4 mL of SonoVue (Bracco) was injected intravenously through the patient’s anterior elbow vein. Timing began as soon as the contrast agent was given, and lesions and liver background were continuously monitored. All data were stored in Digital Imaging and Communication in Medicine (DICOM) format. CEUS videos generally provided comprehensive scans of the major intrahepatic lesions. According to the guideline, the video was divided into arterial phase (AP, 0–30 seconds), portal venous phase (PVP, 31–120 seconds), and delayed phase (DP, over 120 seconds).30
The radiomics workflow is shown in Figure 1. For each target lesion, one representative image with the largest tumor cross-section and well-defined tumor boundaries was selected in each of the three phases.31 ITK-SNAP 3.8.0 (an open-source software; http://www.itksnap.org) was used to delineate the regions of interest (ROIs) around the tumor outline manually (Figure 2). Images of 20 patients (60 images) were randomly selected. The ultrasound physician 1 with 3 years of experience outlined ROIs. At least a week later, the ultrasound physician 1 was asked to delineate ROIs repeatedly to evaluate the intragroup correlation coefficient (ICC) of feature extraction. The ultrasound physician 2 with 5 years of experience checked ROIs to ensure the accuracy of segmentation.
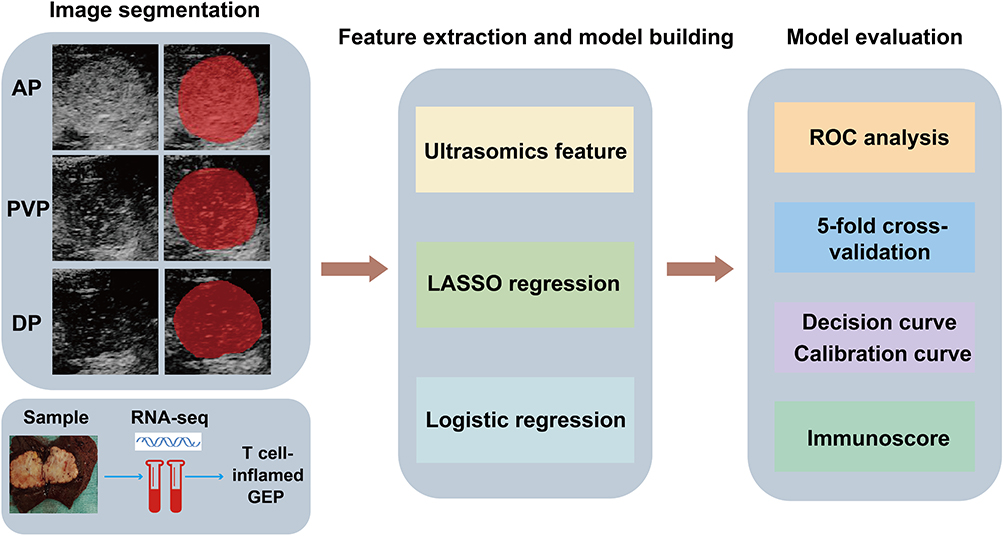 |
Figure 1 Workflow of CEUS-based radiomics modeling for the T cell-inflamed GEP prediction in HCC patients. First, ROIs of CEUS images were delineated manually (the area filled in red represented the ROI). RNA-seq was performed on tumor samples and the GEP was calculated. Second, seven categories of features were extracted and LASSO and logistic regression were used to construct the model. Last, model evaluation and validation were performed. Abbreviations: AP arterial phase, PVP portal venous phase, DP delayed phase. |
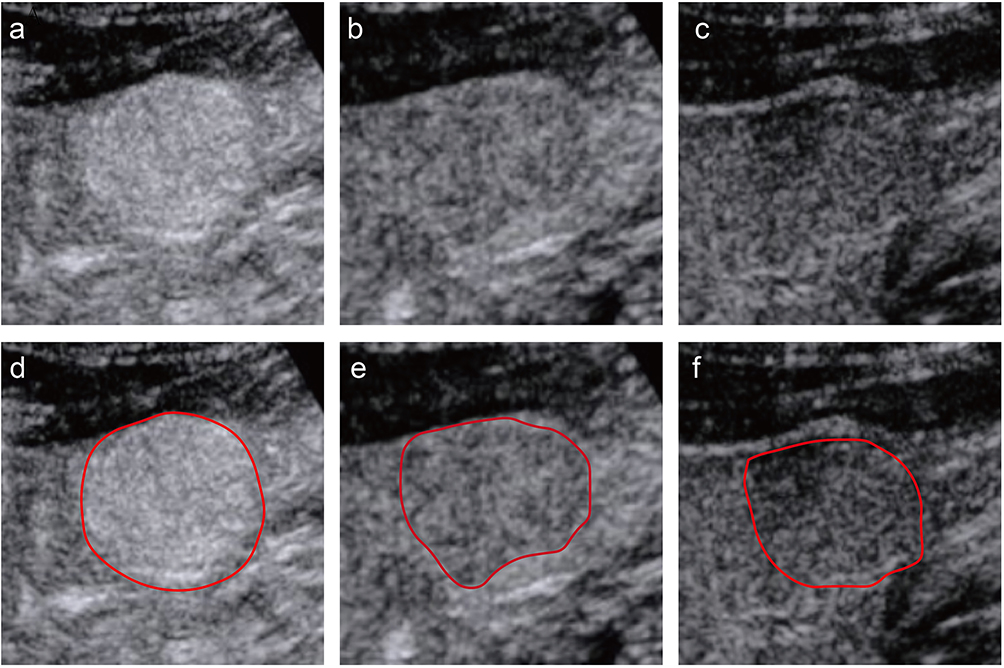 |
Figure 2 An example of segmentation of three-phase images from a 58-year-old man. The figures above respectively show representative images of the arterial phase (a), the portal venous phase (b), and the delayed phase (c), along with their corresponding regions of interest (ROI) (d-f). The red curve represented the tumor contour. |
Feature Extraction and Model Construction
A total of 5936 features were extracted from the ROIs using Ultrasomics-Platform software (Version 2.1, Ultrasomics Artificial Intelligence X-lab, Guangzhou).32,33 These features consisted of seven categories: Original, Ipris, CoLIAGe2D, Wavelets, Shearlet, Gabors, and PLBP+WLLBP (details shown in Table S1). The median of GEP was taken as the cutoff value to stratify all patients into the high GEP group and the low GEP group. We used the least absolute shrinkage and selection operator (LASSO) and logistic regression method to select the most useful predictive features and construct radiomics-based models for predicting the T cell-inflamed GEP in HCC. The features of three phases and corresponding GEP labels were used to construct AP, PVP and DP models, respectively (four patients with missing DP images). A multivariable logistic regression analysis was employed to integrate three models and construct the integrated model. Specifically, Spearman correlation coefficient was employed to identify and remove highly correlated features. If the correlation coefficient between pair of features was greater than 0.9, only one of the features was retained for further analysis.34 Next, the remaining features were normalized by the Z-score method. Then, to reduce redundancy, the LASSO regression was applied to further select features. Finally, key features were selected and presented in the calculation formula using logistic regression. The heatmap was used to show the correlation coefficient matrix among selected key radiomics features.
Model Evaluation and Validation
The 5-fold cross-validation was utilized to validate the performance of the model. Receiver operating curves (ROCs) were plotted to discriminate the high GEP group from the low GEP group, and discrimination was quantified with the area under the curve (AUC). The calibration curve and decision curve analysis were conducted to evaluate the predictive accuracy and clinical usefulness of the model. Univariate and multivariate logistic regression analyses evaluated associations between factors and GEP groups. In the independent cohort, the Rad-scores of lesions were obtained according to the model, and then values were compared between the high and low Immunoscore groups.
Statistical Analysis
All statistical analyses were conducted with R software 3.6.1, SPSS 26.0, and GraphPad 9.4 software. Continuous variables, reported as mean with standard deviation or median with interquartile range, were compared using Student’s t-test or Wilcoxon rank-sum test, depending on results from normality tests. Categorical variables, presented as numbers (proportions), were compared using the Chi-square test or Fisher’s exact test. The difference between AUCs was compared by the DeLong test. Two-sided P values less than 0.05 indicated statistical significance.
Results
Clinic-Pathological Characteristics
The detailed clinical characteristics of the patients in the primary cohort and independent cohort were shown in Tables 1 and S2. All 268 patients with T cell-inflamed GEP were involved, including 241 males and 27 females, with a mean age of 53.3 ± 11.4 years. The median lesion size was 5.1 (IQR: 3.6, 8.5) cm. The lesion size between the high GEP group (median size, 4.6 cm; IQR, 3.3–7.4 cm) and the low GEP group (median size, 5.6 cm; IQR, 3.7–9.2 cm) was statistically different (p=0.012). Among the patients, 147 (54.9%) had liver cirrhosis, and 231 (86.2%) were HBsAg positive. Additionally, CEA was elevated (≥5 U/L) in 24 patients (9.0%), and AFP was elevated (≥400 ng/mL) in 91 patients (34.0%). There were no statistically significant differences in age, gender, lesion number, liver cirrhosis, hematological examinations, and BCLC stage between the two groups (p>0.05). For the 257 patients in the primary cohort (pathology data were missing in 11 of 268 patients), GEP values were higher in the intra-tumor tertiary lymphoid structures (TLS) positive group than TLS negative group (p<0.001), confirming the correlation between T cell-inflamed GEP and aggregates of immune cells (Appendix 3, Figure S1). In the independent cohort, there were 12/46 (26.1%) patients in the high Immunoscore group and 34/46 (73.9%) patients in the low Immunoscore group.
 |
Table 1 Clinic-Pathologic Characteristics of the Patients in the Primary Cohort |
Feature Extraction and Model Construction
More than 80% of the features in the three phases had an ICC greater than 0.8, and less than 10% had an ICC less than 0.5. For arterial phase features, after removing features with correlation coefficients > 0.9, 1143 features remained. The log (λ) of LASSO regression was −3.103 and 36 key features were selected by reducing feature dimensionality (Figure 3a). The AP model (modeling using arterial phase features) was defined as a formula resulting from the regression coefficients of these 36 features multiplied by the value of the corresponding feature. The key 36 features and their coefficients of the AP model were shown in Figure 3b and Table S3. The correlation coefficient matrix of key features was displayed in Figure 3c. The top ten features in terms of the absolute value of the coefficients were distributed in the following four categories: 4 CoLIAGe, 3 shearlet, 2 gldp of Gabors, and 1 PLBP+WLLBP. The PVP model and DP model were constructed with 13 PVP features and 19 DP features, respectively (Figure S2, Tables S4 and S5). The integrated model was constructed by a multivariable logistic regression analysis (Table S6).
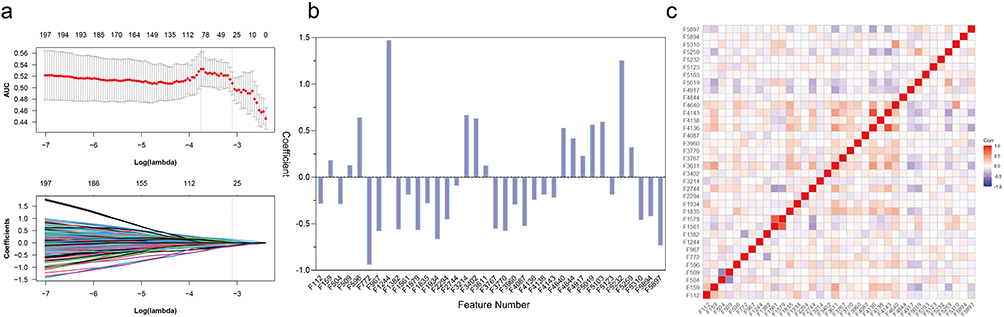 |
Figure 3 Radiomics feature selection using LASSO regression in the primary cohort. (a) Optimal tuning parameters (λ) in the LASSO model binomial deviation diagram. (b) The coefficient profile plot of the 36 selected radiomics features of the AP model was shown. (c) Heatmap portrayed correlation coefficients matrix of 36 selected radiomics features. |
Model Evaluation and Validation
The AP model achieved an AUC of 0.889 (95% CI: 0.851–0.927) in the primary dataset, the maximum Youden Index corresponded to a sensitivity of 0.799, a specificity of 0.828, and an accuracy of 0.813 (Figure 4a). In comparison, the AUCs of the PVP model, DP model and integrated model were 0.740 (95% CI: 0.682–0.799), 0.812 (95% CI: 0.761–0.863) and 0.923 (95% CI: 0.892–0.953), respectively (Figure 4b–d). Among these four models, the AP model outperformed the PVP and DP models (AP vs PVP: 0.889 vs 0.740, p<0.01; AP vs DP: 0.889 vs 0.812, p=0.02) and showed comparable performance to the integrated model (AP vs integrated model: 0.889 vs 0.923, p=0.2) (Figure 4e, Table S7). The average AUC of the 5-fold cross-validation for the AP model, PVP model, DP model, and the integration model were 0.905, 0.748, 0.693 and 0.874, respectively (Figure 4f, Figure S3a–3c). Given that the AP model achieved good performance by using fewer features than the complex integrated model, it was chosen for further analysis.
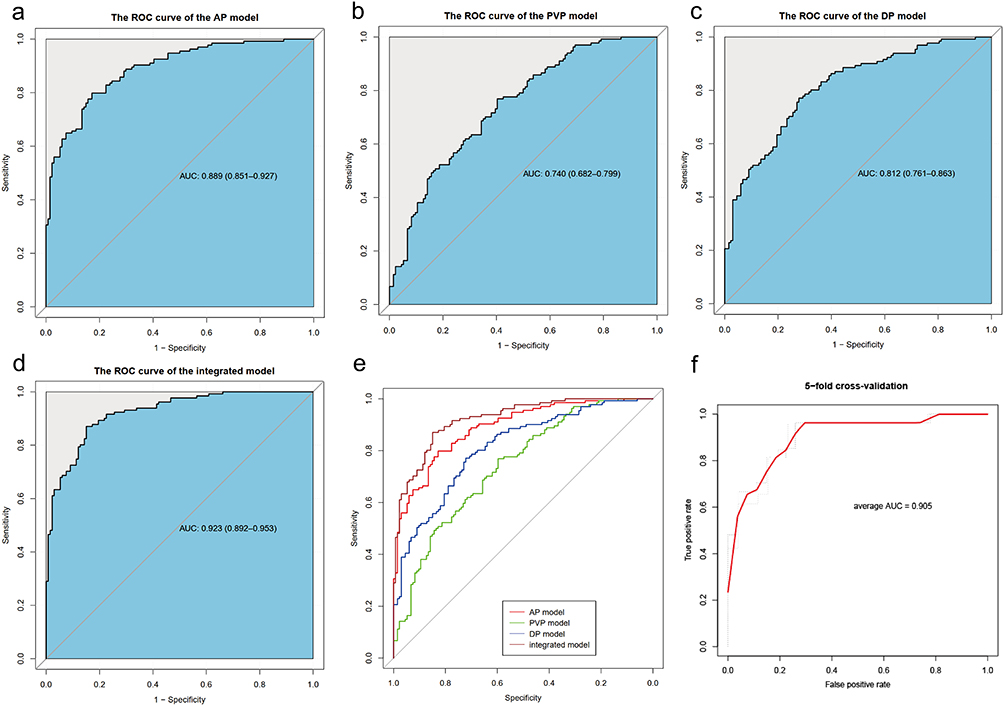 |
Figure 4 ROC curves of the AP model (a), PVP model (b), DP model (c) and integrated model (d) in the primary cohort. (e) Comparison of AUCs of four models using the Delong test. (f) ROC of AP model for 5-fold cross-validation. AUC, area under the receiver operating characteristic curve. |
The calibration curve revealed a high agreement between predictive and actual GEP in the primary cohort (Figure 5a). The decision curve showed the model had high clinical net benefit (Figure 5b). Univariate logistic regression analysis showed that the Rad-score (OR 2.72, 95% CI: 2.11–3.49, p<0.001) and tumor size (OR 0.92, 95% CI: 0.86–0.98, p=0.015) were associated with T cell-inflamed GEP, but multivariate logistic regression analysis showed that the Rad-score was independently associated with GEP (OR 2.76, 95% CI: 2.17–3.65, p<0.001) (Table 2).
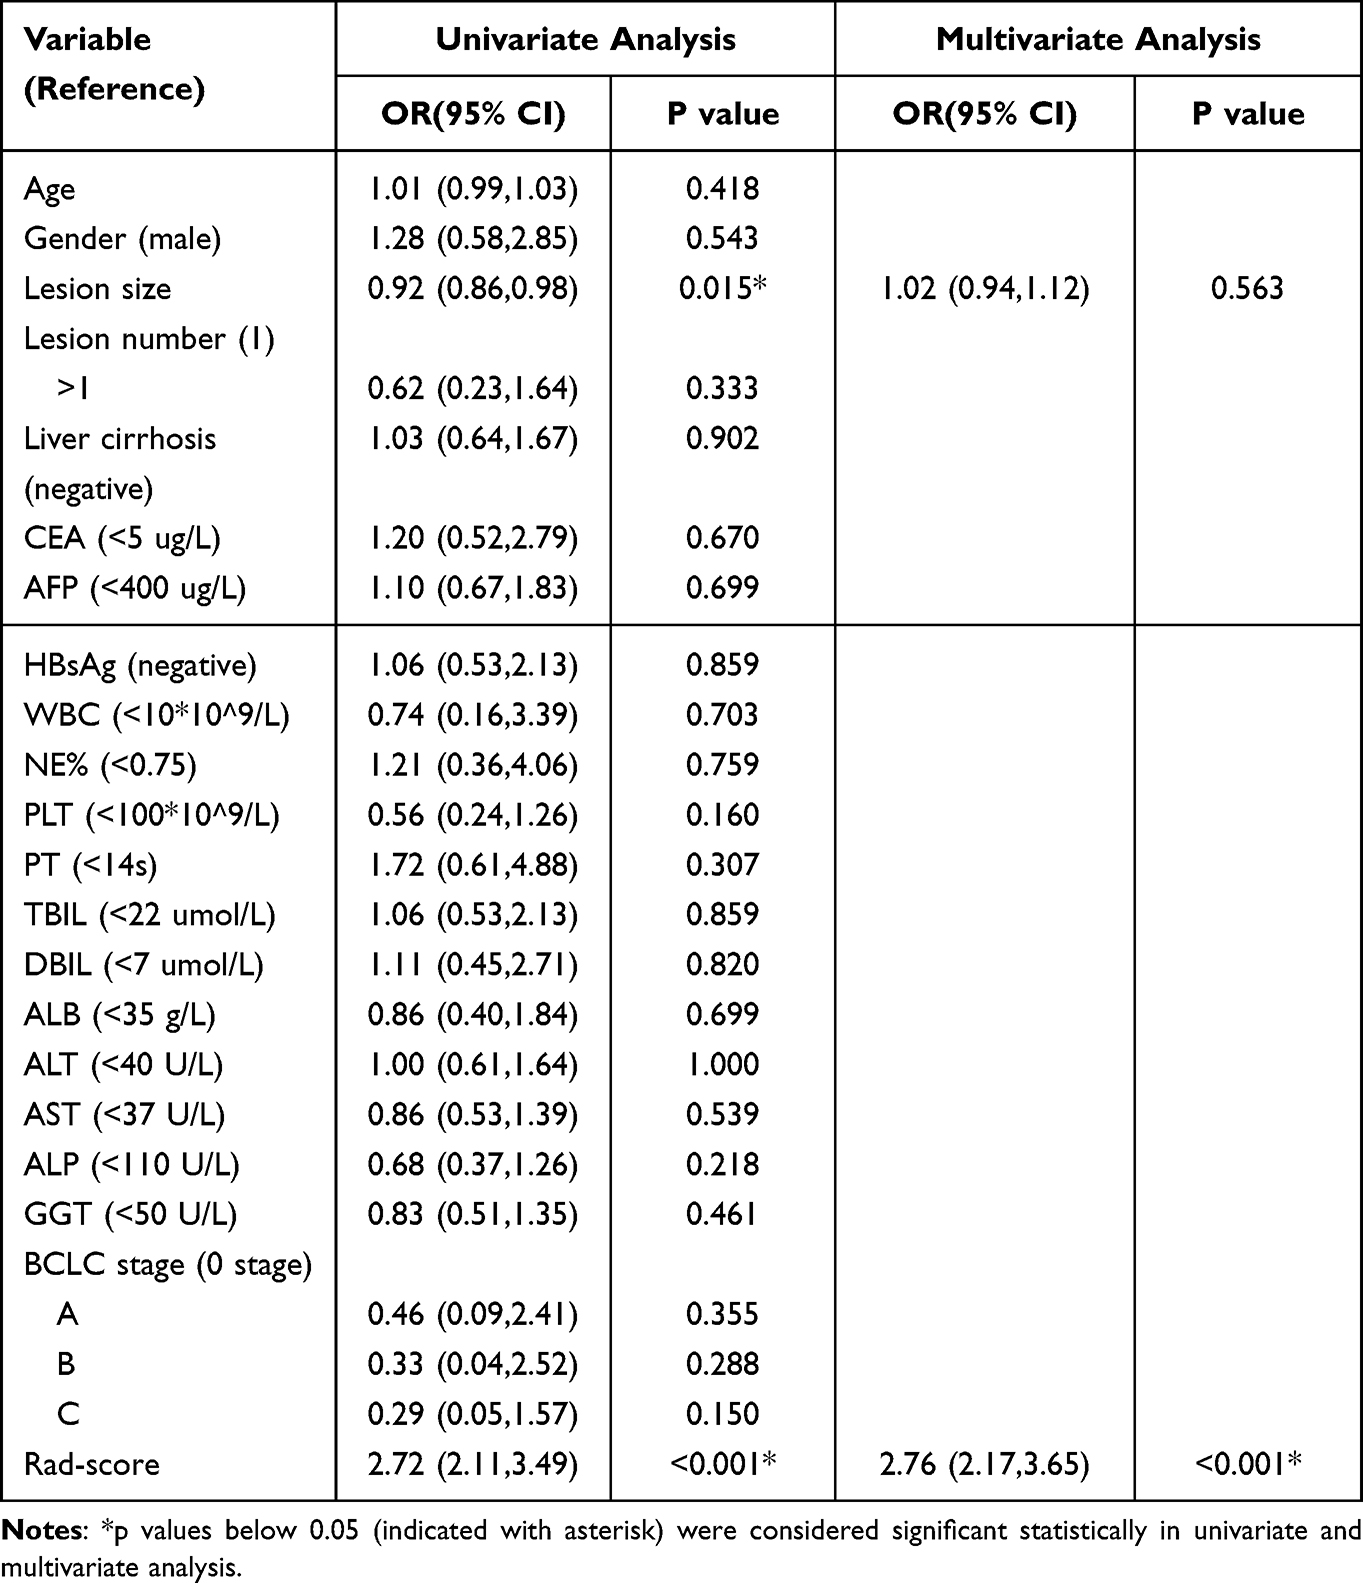 |
Table 2 Results of the Univariate and Multivariate Analysis in the Primary Cohort |
 |
Figure 5 The assessment of the model calibration curve and decision curve analysis (DCA) in the primary cohort. (a) Calibration curve: The ideal line was the standard curve, and the bias-corrected line was the calibrated predicted curve. The closer the calibration curve was to the ideal curve, the better the predictive ability of the model was. (b) Decision curve analysis (DCA): Net benefit of intervention according to radiomics model. |
In the independent cohort, the Rad-score of the high Immunoscore group (mean±SD: 1.279±2.547) was higher than that of the low Immunoscore group (mean±SD: −0.750±2.603). Tumor tissues with high Rad-score had intensive T-cell infiltration (Figure 6a). There was a statistically significant difference observed in the Rad-scores between the high and low Immunoscore groups (t=−2.359, p=0.029) (Figure 6b).
 |
Figure 6 Analysis of correlation between the Rad-score and Immunoscore in the independent cohort. (a) Representative examples of CD8+ (i, ii) and CD3+ (iii, iv) immunostaining in tumor center (CT) and invasive margin (IM) of HCC tissue specimens with high Rad-score. Immunostained cells were brown and tumor cells were blue in color. (b) The Rad-score of the high Immunoscore group (blue) was significantly higher than that of the low Immunoscore group (red). * p < 0.05. |
Discussion
It remains a challenging task to achieve a noninvasive and low-cost assessment of T-cell inflamed GEP. In the present study, we developed and validated a radiomics-based model based on CEUS images. It can automatically extract related features from CEUS images to generate T cell-inflamed GEP prediction values. Furthermore, our study showed that Rad-score was positively correlated with Immunoscore in another independent cohort, which confirmed the effectiveness of the model. Our results show the potential of the radiomics-based model as a promising approach to extract clinically and biologically significant information from CEUS images of HCC.
T cell-inflamed GEP signifies a T cell–activated TME associated with the prognosis of immunotherapy.35 Few studies have reported on the correlation between the clinicopathological characteristics of HCC and the intratumoral immune landscape. A research has indicated that the expression of tumor-associated antigens correlates with smaller tumor sizes and local immune infiltration,36 which seems to align with the findings in our study, wherein tumors within high GEP group were smaller than those within low GEP group. In the univariate analysis, both tumor size and the Rad-score were associated with GEP. In contrast, in the multivariate analysis, only the Rad-score was associated with GEP. This result is line with the challenges of predicting GEP and evaluating TME using clinical indices, indicating that radiomics features can offer additional pathophysiological information not available from clinical characteristics.
To our knowledge, this study is pioneering in establishing a radiomics model based on CEUS specifically aimed at predicting T cell-inflamed GEP. Several studies have attempted to explore the potential of non-invasive and convenient radiomics models to predict biomarkers such as programmed death receptor 1 (PD-1), programmed death-ligand 1 (PD-L1), tumor mutational burden (TMB) and microsatellite instability (MSI) for ICIs in cancer patients.37–39 There is no CEUS-based radiomics available for the assessment of immune status in HCC. A study attempted to use artificial intelligence on whole-slide digital histological images (WSIs) of HCC to predict the activation of various immune and inflammatory gene signatures, with AUCs ranging from 0.81 to 0.92.40 It’s worth noting that the acquisition of surgical specimens is often unfeasible for patients with unresectable HCC, thereby constraining the applicability of pathology-dependent model. Sun R et al used the CT images of 135 patients with advanced solid malignant tumors to develop a radiomics signature including eight variables for predicting tumor-infiltrating CD8 cells by use of machine learning method, and the AUC of this signature in the TCGA dataset was less than 0.70.18 The non-invasive model introduced in this study demonstrates wide applicability and significant potential for extensive clinical use.
In this study, texture-related features contributed significantly to the model to assess tumor immunity, which is consistent with existing studies. In a previous study, we developed a radiomics model using preoperative Gd-EOB-DTPA-enhanced MRI data from 207 HCC patients, which achieved an AUC of 0.926 in predicting the immunoscore, primarily driven by texture features.28 A study using contrast-enhanced CT scans from 30 HCC patients identified two radiomics subtypes, uncovering that texture-related features mainly correlated with the regulation of immune response and cell cycle.41 Specifically, four of the top 10 features with the highest weights of AP model are from the CoLIAGe class, three from the shearlet class, two from the gldp subclass, and one from the WLLBP subclass. In the PVP and DP models, the main categories of features are also CoLIAGe, shearlet, and gldp. As a result, the core categories of features related to tumor immunity are similar in the different phase of CEUS and are mainly texture-related features. CoLIAGe captures high-order co-occurrence patterns of local gradient tensors at the voxel level in medical imaging, allowing it to differentiate subtle pathological differences and disease phenotypes from similar morphological manifestations. It demonstrates a markedly superior classification accuracy when compared with alternative texture descriptors and the assessments made by expert radiologists.42 Since changes in the immune microenvironment may be subtle and invisible to the naked eye, CoLIAGe plays a significant role in the model. Shearlet collects curvilinear geometric structures in the image, making it suitable for handling high-dimensional signals.43 Previous studies have shown that immune cells often accumulate at the edge of tumor infiltration.29 The antitumor immunity might be indirectly reflected in the aggressiveness of the tumor border and the regularity of its morphology, meaning that the tumor’s geometry also provides valuable information related to the T cell-inflamed GEP. The gldp subclass can describe texture features and extract image edge and gradient information with good spatial locality and directional selectivity, offering more detailed discriminative features compared to the local binary pattern (LBP).
Distinguished by high temporal and spatial resolution, the CEUS of HCC is characterized by a rapid appearance of hyperenhancement in the arterial phase and subsequent washout of the enhancement signal in the portal venous phase. In this study, considering that HCC has different features in arterial, portal venous, and delayed phases, we constructed separate models for each phase, an approach not commonly seen in prior research. LASSO and logistic regression were utilized to screen the features and modeling. The AP model demonstrated robust performance and proved to be more feasible for clinical application. Lesions in the arterial phase are clearly outlined, which may explain why the AP model outperforms the others. The Immunoscore is determined by the number of CD3+ and CD8+ lymphocyte infiltration at the core and edge of the tumor.44 In the independent cohort, the Rad-score is higher in the high Immunoscore group with a statistically significant p-value. These findings provide evidence supporting the model’s ability to predict T cell-inflamed GEP.
There are several limitations to our study. First, this retrospective study may inevitably have selection bias and data imbalance. The use of different ultrasound equipment by various radiologists might introduce heterogeneity in the ultrasound images, potentially affecting the radiomics model’s performance. Second, the study is based on single-center data with a limited number of patients. Additional validations in other centers are required to assess the generalizability and reproducibility of our predictive model. Third, as with many radiomics studies, applying the model necessitates manual involvement rather than automatic operation. To facilitate its adoption in clinical practice, the radiomics technique should be developed to be more intelligent and user-friendly.
Conclusion
In conclusion, our proof-of-concept study demonstrates the promising potential of the CEUS radiomics-based machine learning model in predicting T cell-inflamed GEP in HCC. This radiation-free, non-invasive, and cost-effective clinical tool could provide valuable information about the TME that is not accessible through traditional clinical indicators. Specifically, our findings suggest that the machine learning model has the predictive value for T cell-inflamed GEP in HCC to inform therapeutic decision-making in immunotherapy. However, further research is needed to address some of the limitations and challenges associated with this approach, such as validation of the extended data and optimization utilization of convolutional neural network structures. Overall, our study contributes to the growing body of evidence supporting the potential of radiomics for improving cancer care and advancing precision medicine.
Abbreviations
AFP, alpha fetoprotein; AP, arterial phase; AUC, area under the curve; BOR, best overall response; CEA, carcinoembryonic antigen; CEUS, contrast-enhanced ultrasound; DICOM, digital imaging and communication in medicine; DP, delayed phase; GEP, gene expression profile; HCC, hepatocellular carcinoma; ICC, intragroup correlation coefficient; ICIs, immune checkpoint inhibitors; LASSO, the least absolute shrinkage and selection operator; MSI, microsatellite instability; PD-1, programmed death receptor 1; PD-L1, programmed death-ligand 1; PVP, portal venous phase; RNA-seq, ribonucleic acid sequencing; ROC, receiver operating curve; TLS, tertiary lymphoid structures; TMB, tumor mutation burden; TME, tumor microenvironment.
Ethics Approval and Informed Consent
This article does not contain any studies with animals performed by any of the authors. This study was approved by the ethics committees of the First Affiliated Hospital of Sun Yat-sen University (Approval number: [2021]152) and fully complied with the Declaration of Helsinki and the Guideline for Good Clinical Practice; written informed consent was obtained from each patient before collecting their tumor samples.
Consent for Publication
Informed consent for publication was obtained from all authors.
Acknowledgments
We thank all the patients for their participation in this study.
Author Contributions
All authors made a significant contribution to the work reported, whether that is in the conception, study design, execution, acquisition of data, analysis and interpretation, or in all these areas; took part in drafting, revising or critically reviewing the article; gave final approval of the version to be published; have agreed on the journal to which the article has been submitted; and agree to be accountable for all aspects of the work.
Funding
This study has received funding by the National Key Research and Development Program of China (No. 2020AAA0109504), National Natural Science Foundation of China (No. 82102141, NO. 82272076) and Guangdong Natural Science Foundation (NO. 2022A1515011148).
Disclosure
The authors report no conflicts of interest in this work.
References
1. Ayers M, Lunceford J, Nebozhyn M, et al. IFN-γ–related mRNA profile predicts clinical response to PD-1 blockade. J Clin Invest. 2017;127(8):2930–2940.
2. Ott PA, Bang YJ, Piha-Paul SA, et al. T-Cell-Inflamed Gene-Expression Profile, Programmed Death Ligand 1 Expression, and Tumor Mutational Burden Predict Efficacy in Patients Treated With Pembrolizumab Across 20 Cancers: KEYNOTE-028. J Clin Oncol. 2019;37(4):318–327.
3. Liu L, Liu Z, Gao J, et al. CD8+ T cell trajectory subtypes decode tumor heterogeneity and provide treatment recommendations for hepatocellular carcinoma. Front Immunol. 2022;13:964190.
4. Sangro B, Melero I, Wadhawan S, et al. Association of inflammatory biomarkers with clinical outcomes in nivolumab-treated patients with advanced hepatocellular carcinoma. J Hepatol. 2020;73(6):1460–1469.
5. Haber PK, Castet F, Torres-Martin M, et al. Molecular Markers of Response to Anti-PD1 Therapy in Advanced Hepatocellular Carcinoma. Gastroenterology. 2023;164(1):72–88.e18.
6. Cristescu R, Mogg R, Ayers M, et al. Pan-tumor genomic biomarkers for PD-1 checkpoint blockade-based immunotherapy. Science. 2018;362(6411):eaar3593.
7. Zhu AX, Abbas AR, de Galarreta MR, et al. Molecular correlates of clinical response and resistance to atezolizumab in combination with bevacizumab in advanced hepatocellular carcinoma. Nat Med. 2022;28(8):1599–1611.
8. Heimbach JK, Kulik LM, Finn RS, et al. AASLD guidelines for the treatment of hepatocellular carcinoma. Hepatology. 2018;67(1):358–380.
9. European Association for the Study of the Liver. EASL Clinical Practice Guidelines: management of hepatocellular carcinoma. J Hepatol. 2018;69(1):182–236.
10. Atri M, Jang H-J, Kim TK, Khalili K. Contrast-enhanced US of the Liver and Kidney: a Problem-solving Modality. Radiology. 2022;303(1):11–25.
11. Lambin P, Leijenaar RTH, Deist TM, et al. Radiomics: the bridge between medical imaging and personalized medicine. Nat Rev Clin Oncol. 2017;14(12):749–762.
12. Mayerhoefer ME, Materka A, Langs G, et al. Introduction to Radiomics. J Nucl Med. 2020;61(4):488–495.
13. Turco S, Tiyarattanachai T, Ebrahimkheil K, et al. Interpretable Machine Learning for Characterization of Focal Liver Lesions by Contrast-Enhanced Ultrasound. IEEE Trans Ultrason Ferroelectr Freq Control. 2022;69(5):1670–1681.
14. Liu F, Liu D, Wang K, et al. Deep Learning Radiomics Based on Contrast-Enhanced Ultrasound Might Optimize Curative Treatments for Very-Early or Early-Stage Hepatocellular Carcinoma Patients. Liver Cancer. 2020;9(4):397–413.
15. Liu D, Liu F, Xie X, et al. Accurate prediction of responses to transarterial chemoembolization for patients with hepatocellular carcinoma by using artificial intelligence in contrast-enhanced ultrasound. Eur Radiol. 2020;30(4):2365–2376.
16. Dong Y, Zuo D, Qiu YJ, Cao JY, Wang HZ, Wang WP. Prediction of Histological Grades and Ki-67 Expression of Hepatocellular Carcinoma Based on Sonazoid Contrast Enhanced Ultrasound Radiomics Signatures. Diagnostics. 2022;12(9):2175.
17. Bitencourt AGV, Gibbs P, Rossi Saccarelli C, et al. MRI-based machine learning radiomics can predict HER2 expression level and pathologic response after neoadjuvant therapy in HER2 overexpressing breast cancer. EBioMedicine. 2020;61:103042.
18. Sun R, Limkin EJ, Vakalopoulou M, et al. A radiomics approach to assess tumour-infiltrating CD8 cells and response to anti-PD-1 or anti-PD-L1 immunotherapy: an imaging biomarker, retrospective multicohort study. Lancet Oncol. 2018;19(9):1180–1191.
19. Qi Y, Zhao T, Han M. The application of radiomics in predicting gene mutations in cancer. Eur Radiol. 2022;32(6):4014–4024.
20. Feng Z, Li H, Liu Q, et al. CT Radiomics to Predict Macrotrabecular-Massive Subtype and Immune Status in Hepatocellular Carcinoma. Radiology. 2023;307(1):e221291.
21. Finn RS, Qin S, Ikeda M, et al. Atezolizumab plus Bevacizumab in Unresectable Hepatocellular Carcinoma. N Engl J Med. 2020;382(20):1894–1905.
22. Xia Y, Tang W, Qian X, et al. Efficacy and safety of camrelizumab plus apatinib during the perioperative period in resectable hepatocellular carcinoma: a single-arm, open label, Phase II clinical trial. J Immunother Cancer. 2022;10(4):e004656.
23. Chow P, Chen M, Cheng A-L, et al. IMbrave050: Phase 3 study of adjuvant atezolizumab + bevacizumab versus active surveillance in patients with hepatocellular carcinoma at high risk of disease recurrence following resection or ablation.
24. Rimassa L, Finn RS, Sangro B. Combination immunotherapy for hepatocellular carcinoma. J Hepatol. 2023;79(2):506–515.
25. Xu J, Shen J, Gu S, et al. Camrelizumab in Combination with Apatinib in Patients with Advanced Hepatocellular Carcinoma (RESCUE): a Nonrandomized, Open-label, Phase II Trial. Clin Cancer Res. 2021;27(4):1003–1011.
26. Ren Z, Xu J, Bai Y, et al. Sintilimab plus a bevacizumab biosimilar (IBI305) versus sorafenib in unresectable hepatocellular carcinoma (ORIENT-32): a randomised, open-label, Phase 2-3 study. Lancet Oncol. 2021;22(7):977–990.
27. Yu SJ. Immunotherapy for hepatocellular carcinoma: recent advances and future targets. Pharmacol Ther. 2023;244:108387.
28. Chen S, Feng S, Wei J, et al. Pretreatment prediction of immunoscore in hepatocellular cancer: a radiomics-based clinical model based on Gd-EOB-DTPA-enhanced MRI imaging. Eur Radiol. 2019;29(8):4177–4187.
29. Galon J, Costes A, Sanchez-Cabo F, et al. Type, density, and location of immune cells within human colorectal tumors predict clinical outcome. Science. 2006;313(5795):1960–1964.
30. Radiology ACo. CEUS LI-RADS® v2017 CORE. Available from: https://www.acr.org/-/media/ACR/Files/RADS/LI-RADS/CEUS-LI-RADS-2017-Core.pdf.
31. Qin X, Hu X, Xiao W, Zhu C, Ma Q, Zhang C. Preoperative Evaluation of Hepatocellular Carcinoma Differentiation Using Contrast-Enhanced Ultrasound-Based Deep-Learning Radiomics Model. J Hepatocell Carcinoma. 2023;10:157–168.
32. Li CQ, Zheng X, Guo HL, et al. Differentiation between combined hepatocellular carcinoma and hepatocellular carcinoma: comparison of diagnostic performance between ultrasomics-based model and CEUS LI-RADS v2017. BMC Med Imaging. 2022;22(1):36.
33. Wang W, Wu SS, Zhang JC, et al. Preoperative Pathological Grading of Hepatocellular Carcinoma Using Ultrasomics of Contrast-Enhanced Ultrasound. Acad Radiol. 2021;28(8):1094–1101.
34. Turhon M, Li M, Kang H, et al. Development and validation of a deep learning model for prediction of intracranial aneurysm rupture risk based on multi-omics factor. Eur Radiol. 2023.
35. Aggen DH. Combining Biomarkers for Immunotherapy. Cancer Discov. 2018;8(12):1500–1501.
36. Liang J, Ding T, Guo ZW, et al. Expression pattern of tumour-associated antigens in hepatocellular carcinoma: association with immune infiltration and disease progression. Br J Cancer. 2013;109(4):1031–1039.
37. Zhang J, Wu Z, Zhang X, et al. Machine learning: an approach to preoperatively predict PD-1/PD-L1 expression and outcome in intrahepatic cholangiocarcinoma using MRI biomarkers. ESMO Open. 2020;5(6):e000910.
38. Lam LHT, Chu NT, Tran TO, Do DT, Nqk L. A Radiomics-Based Machine Learning Model for Prediction of Tumor Mutational Burden in Lower-Grade Gliomas. Cancers. 2022;14(14):3492.
39. Pei Q, Yi X, Chen C, et al. Pre-treatment CT-based radiomics nomogram for predicting microsatellite instability status in colorectal cancer. Eur Radiol. 2022;32(1):714–724.
40. Zeng Q, Klein C, Caruso S, et al. Artificial intelligence predicts immune and inflammatory gene signatures directly from hepatocellular carcinoma histology. J Hepatol. 2022;77(1):116–127.
41. Gu Y, Huang H, Tong Q, et al. Multi-View Radiomics Feature Fusion Reveals Distinct Immuno-Oncological Characteristics and Clinical Prognoses in Hepatocellular Carcinoma. Cancers. 2023;15(8):2338.
42. Prasanna P, Tiwari P, Madabhushi A. Co-occurrence of Local Anisotropic Gradient Orientations (CoLlAGe): a new radiomics descriptor. Sci Rep. 2016;6:37241.
43. Wu L, Zhao Y, Lin P, et al. Preoperative ultrasound radiomics analysis for expression of multiple molecular biomarkers in mass type of breast ductal carcinoma in situ. BMC Med Imaging. 2021;21(1):84.
44. Bruni D, Angell HK, Galon J. The immune contexture and Immunoscore in cancer prognosis and therapeutic efficacy. Nat Rev Cancer. 2020;20(11):662–680.
 © 2023 The Author(s). This work is published and licensed by Dove Medical Press Limited. The
full terms of this license are available at https://www.dovepress.com/terms
and incorporate the Creative Commons Attribution
- Non Commercial (unported, 3.0) License.
By accessing the work you hereby accept the Terms. Non-commercial uses of the work are permitted
without any further permission from Dove Medical Press Limited, provided the work is properly
attributed. For permission for commercial use of this work, please see paragraphs 4.2 and 5 of our Terms.
© 2023 The Author(s). This work is published and licensed by Dove Medical Press Limited. The
full terms of this license are available at https://www.dovepress.com/terms
and incorporate the Creative Commons Attribution
- Non Commercial (unported, 3.0) License.
By accessing the work you hereby accept the Terms. Non-commercial uses of the work are permitted
without any further permission from Dove Medical Press Limited, provided the work is properly
attributed. For permission for commercial use of this work, please see paragraphs 4.2 and 5 of our Terms.
Recommended articles
CT-Based Radiomics for the Recurrence Prediction of Hepatocellular Carcinoma After Surgical Resection
Wang F, Chen Q, Zhang Y, Chen Y, Zhu Y, Zhou W, Liang X, Yang Y, Hu H
Journal of Hepatocellular Carcinoma 2022, 9:453-465
Published Date: 23 May 2022
Integration of Multimodal Computed Tomography Radiomic Features of Primary Tumors and the Spleen to Predict Early Recurrence in Patients with Postoperative Adjuvant Transarterial Chemoembolization
Chen C, Liu J, Gu Z, Sun Y, Lu W, Liu X, Chen K, Ma T, Zhao S, Zhao H
Journal of Hepatocellular Carcinoma 2023, 10:1295-1308
Published Date: 8 August 2023
Development of a Clinical-Radiomics Nomogram That Used Contrast-Enhanced Ultrasound Images to Anticipate the Occurrence of Preoperative Cervical Lymph Node Metastasis in Papillary Thyroid Carcinoma Patients
Wei T, Wei W, Ma Q, Shen Z, Lu K, Zhu X
International Journal of General Medicine 2023, 16:3921-3932
Published Date: 29 August 2023
Bridging the Gap Between Imaging and Molecular Characterization: Current Understanding of Radiomics and Radiogenomics in Hepatocellular Carcinoma
Ren L, Chen DB, Yan X, She S, Yang Y, Zhang X, Liao W, Chen H
Journal of Hepatocellular Carcinoma 2024, 11:2359-2372
Published Date: 27 November 2024
Preoperative Prediction of Glypican-3 Expression in Hepatocellular Carcinoma Using Sonazoid Contrast-Enhanced Ultrasound Radiomics
Yang S, Huang Z, Zheng W, Li L, Xue Y, Zou R, Peng C
Journal of Hepatocellular Carcinoma 2026, 13:610969
Published Date: 30 June 2026