Back to Journals » Infection and Drug Resistance » Volume 19
Predicting Multidrug-Resistant Pneumonia: An Interpretable Machine Learning Model Validated in US and Chinese Patient Cohorts
Authors Lan Y ![]() , Zhang Z, Wei N, Li Y, Li H, Wu C, Qiao Y, Wu M, Lu X
, Zhang Z, Wei N, Li Y, Li H, Wu C, Qiao Y, Wu M, Lu X
Received 8 December 2025
Accepted for publication 16 March 2026
Published 24 March 2026 Volume 2026:19 587338
DOI https://doi.org/10.2147/IDR.S587338
Checked for plagiarism Yes
Review by Single anonymous peer review
Peer reviewer comments 2
Editor who approved publication: Dr Sandip Patil
Yuejiao Lan,1,2,* Zheng Zhang,1,* Naijin Wei,1 Yue Li,1 He Li,1 Chunfeng Wu,2 Yunfeng Qiao,2 Mingda Wu,2 Xiaodan Lu1,2
1Changchun University of Chinese Medicine, Changchun, People’s Republic of China; 2Precision Molecular Medicine Center, Jilin Province People’s Hospital, Changchun, People’s Republic of China
*These authors contributed equally to this work
Correspondence: Mingda Wu, Precision Molecular Medicine Center, Jilin Province People’s Hospital, No. 1183 Gongnong Road, Chaoyang District, Changchun, 130012, People’s Republic of China, Email [email protected] Xiaodan Lu, Changchun University of Chinese Medicine, No. 1035 Boshuo Road, Nanguan District, Changchun, 130117, People’s Republic of China, Email [email protected]
Objective: Multidrug-resistant organisms (MDROs) complicate hospital-acquired and ventilator-associated pneumonia (HAP/VAP). We aimed to develop and validate a machine learning (ML) model to predict MDR risk in pneumonia patients and assess its utility for clinical decision support.
Patients and Methods: We developed multiple ML models using data from the MIMIC-IV database (n=802). Feature selection was performed using LASSO regression and chi-square tests. Four models—Logistic Regression, Random Forest, XGBoost, and LightGBM—were trained, tuned, and calibrated. Model performance was evaluated using ROC curves and calibration plots. The final model was selected based on discrimination, calibration, and interpretability (assessed via SHAP). External validation on an independent cohort from a Chinese tertiary hospital (n=213) demonstrated the reproducibility and generalizability of its performance.
Results: Among the evaluated ML models, Logistic Regression demonstrated the best overall performance. On the MIMIC-IV internal test set, it achieved an area under the curve (AUC) of 0.798 (95% CI: 0.718– 0.872) with an accuracy of 0.807. External validation on an independent Chinese cohort confirmed the model’s robust generalizability, achieving an AUC of 0.845. SHAP analysis identified key predictive features consistently across both cohorts, including the systemic immune-inflammation index (SII), albumin level, C-reactive protein-to-albumin ratio (CAR), number of antibiotic classes, white blood cell count (WBC), and absolute lymphocyte count (LYM abs). All of these features were significantly associated with MDR risk.
Conclusion: Multiple ML models effectively predicted MDR infections in pneumonia patients, with Logistic Regression exhibiting particularly strong overall performance. Model reliability was enhanced through feature selection and probability calibration, while interpretability was improved by SHAP analysis. External validation confirmed the generalizability of our approach, supporting its potential application in clinical infection control. Future studies should focus on validation and the integration of more diverse clinical data sources.
Keywords: pneumonia, multidrug-resistant organisms, deep learning, MIMIC-IV database, Chinese cohort
Introduction
Pneumonia remains a formidable and persistent global public health challenge, representing the leading infectious cause of death worldwide with staggering morbidity and mortality across all age groups and geographical regions.1 According to the Global Burden of Disease (GBD) systematic analyses, lower respiratory tract infections rank among the top four leading causes of death globally, accounting for nearly 4 million annual deaths, with pneumonia constituting the primary pathological driver of this overwhelming disease burden.2,3 Community-acquired pneumonia (CAP), the most prevalent clinical form of pneumonia, exhibits a mortality rate ranging from 14% to 30% in high-burden regions including sub-Saharan Africa, Southeast Asia, and South Asia, which collectively contribute to nearly a quarter of the global CAP disease burden.2,4,5 Beyond its devastating impact on population survival, pneumonia imposes a massive socioeconomic and healthcare system burden globally. In the United States alone, pneumonia was associated with an estimated total treatment cost of $6.4 billion in 2017, and it persists as a leading cause of death among children under 5 years of age in low-income countries and older adults in high-income nations.6,7 In China, pneumonia is one of the most common infectious diseases among both hospitalized medical and surgical patients. Compelling clinical evidence indicates that patients with pneumonia caused by multidrug-resistant (MDR) pathogens experience a 6.4–12.7 day prolongation of hospital length of stay compared to those with antibiotic-susceptible infections,8 alongside significantly elevated risks of severe clinical complications and all-cause mortality.9–11 These epidemiological findings highlight the substantial and growing healthcare demands imposed by pneumonia, particularly the MDR pathogen-associated subtype, and underscore an urgent unmet clinical need for accurate and early prediction of drug-resistant pneumonia to optimize antimicrobial stewardship and improve patient outcomes.
The widespread use of broad-spectrum antimicrobial agents has led to a rising prevalence of MDR, which has become a major obstacle in pneumonia treatment. Based on international expert consensus, MDR is defined as acquired non-susceptibility to at least one agent in three or more antimicrobial categories.12 Among patients with hospital-acquired pneumonia (HAP) and ventilator-associated pneumonia (VAP), MDR Gram-negative bacteria have emerged as predominant pathogens.9,13 These strains rapidly develop resistance through diverse mechanisms, including chromosomal mutations in two-component systems, deletion of the membrane protein gene mgrB, and acquisition of mobile colistin resistance (mcr) genes. Such mechanisms lead to resistance to critical antibiotics like colistin and carbapenems.14 Infections with these MDR pathogens severely limit treatment options, resulting in significantly higher therapeutic failure and mortality rates. Therefore, MDR is widely regarded as a key determinant of clinical outcomes in pneumonia patients. Conventional culture-based antimicrobial susceptibility testing remains the clinical standard but requires 48–72 hours to complete.15 This prolonged turnaround time often fails to meet the urgent need for timely and precise treatment decisions in critically ill pneumonia patients. Furthermore, existing clinical prediction scores demonstrate limited performance in identifying MDR infections, providing inadequate support for early risk stratification.
In recent years, machine learning (ML) has emerged as a promising alternative to overcome these challenges. ML has demonstrated remarkable success across various medical domains, including pneumonia diagnosis. For instance, Vyas and Khadatkar developed an ensemble framework integrating deep learning architectures with machine learning classifiers (DLxMLC) for pneumonia classification using chest X-rays. This approach adopted modified VGG19, ResNet50V2, and DenseNet121 for high-dimensional feature extraction from chest radiographs, paired with mainstream machine learning classifiers, and achieved an exceptional diagnostic accuracy of up to 99.98% in binary pneumonia identification.16 Meanwhile, a comprehensive systematic review by Siddiqi and Javaid further confirmed that deep learning-based methods, represented by convolutional neural networks, transfer learning and ensemble learning strategies, have become the mainstream technical route for chest X-ray-based pneumonia detection, which can effectively address the subjectivity and inefficiency limitations of conventional manual radiograph interpretation in clinical practice.17 Furthermore, researchers have extended ML applications to prognostic tasks. Cilloniz et al applied a causal probabilistic network to predict 30-day mortality in community-acquired pneumonia, outperforming traditional severity scores.18 Similarly, Cui et al constructed models using the MIMIC-IV database to identify risk factors for multidrug-resistant organism (MDRO) infections in ventilator-associated pneumonia patients, with XGBoost demonstrating superior predictive performance.19 Furthermore, large-scale multi-database studies, such as that by Chen et al, have validated the robustness of ML models for pneumonia mortality prediction across diverse healthcare systems.20 Despite these advances, significant gaps remain. As highlighted in a comprehensive review by Kim et al, most AMR prediction models are limited by their reliance on single-center or public databases, such as MIMIC, and lack rigorous external validation in geographically distinct populations.21 Models trained solely on Western cohorts may not generalize well to Asian populations due to differences in pathogen epidemiology, host genetics, and clinical practices. Moreover, many existing models prioritize predictive performance over interpretability, creating “black boxes” that hinder clinical adoption.21 Few studies have systematically compared multiple algorithms while simultaneously providing both global and local explanations through SHAP analysis. Consequently, there is an urgent need for an interpretable ML model that is rigorously developed on a large public database and externally validated in an independent Asian cohort to ensure its generalizability and clinical utility. This study aims to address these gaps by developing and validating an interpretable ML model for predicting MDR pneumonia, integrating data from the MIMIC-IV database and a Chinese cohort, with comprehensive SHAP-based interpretability.
Materials and Methods
Study Design and Data Sources
This retrospective cohort study developed a prediction model for MDR using two independent cohorts and evaluated its performance. The development cohort data were extracted from the Medical Information Mart for Intensive Care IV (MIMIC-IV, version 3.1) database, a single-center critical care repository developed by the Massachusetts Institute of Technology and Beth Israel Deaconess Medical Center (BIDMC), with support from the National Institutes of Health (NIH).22 This database includes comprehensive de-identified clinical data of patients admitted to the ICU at BIDMC between 2008 and 2019, covering demographics, vital signs, laboratory test results, International Classification of Diseases (ICD) diagnosis codes, medication administration records, and antibiotic susceptibility test results. The database is hosted on the PhysioNet platform, and the study protocol was approved by the Institutional Review Board of BIDMC with a waiver of informed consent due to the retrospective, de-identified nature of the data.
We screened adult patients (aged >18 years) with a diagnosis of pneumonia admitted to the ICU during the study period. Pneumonia was identified using ICD-9 and ICD-10 codes, with no restriction on pneumonia subtype. The exclusion criteria were as follows: (1) repeated ICU admissions during the study period (only the first admission was included); (2) missing complete antibiotic susceptibility test results; (3) missing core laboratory data (complete blood count, clinical chemistry) and comorbidity records required for model development. Data extraction was performed using structured query language (SQL) based on unique patient identifiers. We first retrieved 2000 randomly selected patients who met the preliminary inclusion criteria, then matched their antibiotic resistance profiles, core laboratory data, and comorbidity data via patient IDs. After applying the exclusion criteria, a total of 803 patients with complete clinical and drug susceptibility records were initially enrolled; 1 patient was excluded due to missing primary outcome data, resulting in a final development cohort of 802 patients.
An independent external validation cohort was established using retrospective data from the inpatient management system of Jilin Provincial People’s Hospital, with exactly the same inclusion and exclusion criteria as the development cohort. Patients with pneumonia admitted to the hospital between January 2024 and June 2025 were consecutively enrolled. The final validation cohort included 213 adult patients, among whom 44 were in the MDRO group and 169 were in the non-MDRO group. The study protocol was approved by the Ethics Committee of Jilin Provincial People’s Hospital (Approval No. 2025163), with a waiver of informed consent for this retrospective study. The detailed patient screening and enrollment process for both cohorts is shown in Figure 1.
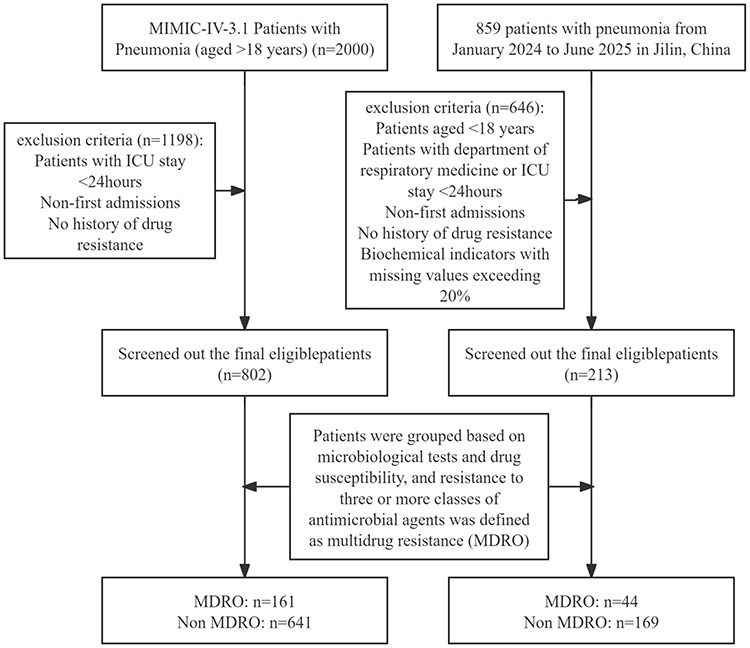 |
Figure 1 Patient selection flowchart. This flowchart illustrates the process of patient selection from the MIMIC-IV database (training/internal validation cohort) and a hospital in Jilin, China (external validation cohort). Exclusion criteria are detailed in the boxes. Patients were ultimately divided into multidrug-resistant organism (MDRO) and non-MDRO groups based on microbiological tests and drug susceptibility testing. Multidrug resistance was defined as resistance to three or more classes of antimicrobial agents. |
Outcomes and Features
Following data processing, 49 variables were retained for analysis. These comprised demographic characteristics (sex, age), comorbidities (hypertension, diabetes, hyperlipidemia, chronic obstructive pulmonary disease (COPD), cancer, cerebral infarction, coronary heart disease, emphysema, tuberculosis), results from 24-hour routine blood tests, (hemoglobin, mean corpuscular volume (MCV), mean corpuscular hemoglobin (MCH), mean corpuscular hemoglobin concentration (MCHC), white blood cell count (WBC), red blood cell count (RBC), hematocrit (HCT), platelet count (PLT), mean platelet volume (MPV), platelet large cell ratio, absolute basophil count, basophil percentage (BASO pct), absolute neutrophil count (NEUT abs), neutrophil percentage (NEUT pct), absolute lymphocyte count (LYM abs), neutrophil-to-lymphocyte ratio, lymphocyte percentage (LYM pct), platelet-to-lymphocyte ratio (PLR), monocyte absolute count (MONO abs), monocyte percentage (MONO pct), lymphocyte-to-monocyte ratio), and 24-hour biochemical indicators (aspartate aminotransferase (AST), alanine aminotransferase (ALT), AST/ALT ratio, total bilirubin, total protein, albumin, creatinine, high-sensitivity C-reactive protein (hs-CRP), C-reactive protein-to-albumin ratio, adenosine deaminase, alkaline phosphatase, platelet distribution width (PDW), blood urea nitrogen (BUN), red blood cell distribution width (RDW)), in addition to the number of antibiotic classes used. Two composite indices were calculated: the systemic immune-inflammatory index (SII), determined as (neutrophil count × platelet count) / lymphocyte count, and the C-reactive protein-to-albumin ratio (CAR), which reflects both acute inflammation and nutritional status. The primary outcome, MDR, was defined as resistance to at least three classes of antimicrobial agents.19,23
Data Preprocessing and Train-Test Splitting
The foundational dataset for model training and internal testing comprised 802 patients extracted from the MIMIC-IV version 3.1 database. An additional external validation set was obtained from a local hospital information management system. Variables were referenced using a predefined column sequence to ensure consistency. The foundational dataset was split into training and internal testing sets, with MDR used as a stratification variable to maintain consistent event rates and minimize sampling bias. The training set underwent comprehensive preprocessing. Binary variables were converted to Pandas Int64 type to accommodate missing values; Continuous variables and label columns were uniformly cast as float64 and Int64, respectively; Missing values in continuous variables were imputed iteratively using IterativeImputer; Skewed distributions were corrected via the Yeo–Johnson transformation implemented in PowerTransformer; Extreme values were winsorized based on quartiles (Q1, Q3) and the interquartile range (IQR) derived from the training data. Continuous variables with low variance were removed using VarianceThreshold. Redundant variables were eliminated by identifying highly correlated pairs (|r| > 0.9) in the Pearson correlation matrix. The remaining continuous features were standardized using z-score normalization and subsequently filtered using L1-regularized logistic regression. Binary variables were handled by filling missing values with 0 and selecting those with p-values < 0.05 in chi-square tests. The resulting continuous and categorical features were concatenated into the final training feature matrix. All preprocessing parameters were fitted exclusively on the training set to prevent data leakage.
Feature Selection
For binary categorical variables: The chi-square test was used for initial screening, with variables with a two-sided p-value < 0.05 retained. For continuous variables: Least absolute shrinkage and selection operator (Lasso) regression was applied for dimensionality reduction using an L1-regularized logistic model (C = 1.0). Variables with non-zero coefficients were retained. After feature selection, a total of 23 predictors (2 binary variables and 21 continuous variables) were included in the final feature matrix for model development, age and gender were excluded after variable selection and are not presented. The distribution differences of the selected variables between the MDR and non-MDR groups were visualized via boxplots (for continuous variables) and bar plots (for categorical variables).
Model Development and Class Imbalance Handling
Four candidate models were constructed: logistic regression (LR), random forest (RF), extreme gradient boosting (XGBoost), and light gradient boosting machine (LightGBM). LR serves as the conventional benchmark for clinical prediction due to its statistical robustness, transparent coefficient-based interpretation, and ease of clinical implementation; ensemble tree-based models (RF, XGBoost, LightGBM) can effectively capture nonlinear relationships and higher-order feature interactions in structured clinical data, and have been widely applied in infectious disease risk prediction.24–26
To address the class imbalance between the MDR and non-MDR groups, dynamic class weights were calculated based on the event rate in the training set. For LR, RF, and LightGBM, class weights were incorporated via the class_weight parameter; for XGBoost, the scale_pos_weight parameter was used for imbalance correction, with this parameter optimized simultaneously during hyperparameter tuning.
For each candidate model, a comprehensive hyperparameter grid was predefined, covering core parameters affecting model performance (including regularization strength, maximum tree depth, learning rate, number of estimators, minimum sample split, and L1/L2 regularization terms). Optimal hyperparameters were determined via 5-fold stratified cross-validation on the training set, with the area under the receiver operating characteristic curve (AUROC) as the primary optimization metric. The LR model, which demonstrated the best overall performance in internal validation, was selected for external validation and in-depth interpretability analysis.
Model Performance Evaluation
The performance of all candidate models was systematically evaluated from three core dimensions: Discrimination: The primary metric was AUROC, which quantifies the model’s ability to distinguish between patients with and without MDR infection. Secondary metrics included accuracy, sensitivity, specificity, precision, and F1-score. The 95% confidence intervals (CIs) for all metrics were calculated via the bootstrap method with 1000 resamples; Calibration: The consistency between predicted probabilities and actual observed MDR risk was evaluated via calibration curves (plotted with 1000-bootstrap resampling); Clinical utility: Decision curve analysis (DCA) was performed to quantify the net benefit of the model across a range of threshold probabilities, compared with the default “treat-all” and “treat-none” strategies.
Model Calibration
To improve the reliability of probabilistic output for clinical decision-making, isotonic regression was used to calibrate the predicted probabilities of all candidate models. To further optimize the smoothness of calibrated probabilities, a binning-based manual recalibration approach was implemented: predicted probabilities were grouped into deciles, and the observed MDR positivity rate in each bin was used to recalibrate predicted probabilities while preserving the relative ranking of predicted risks. The discrimination and calibration performance of models before and after recalibration were compared to balance the trade-off between discrimination and calibration.
Model Interpretability Analysis
The LR model, which demonstrated the best comprehensive performance in internal validation, was selected as the final model for in-depth interpretability analysis. Although traditional LR coefficients can provide population-level average associations between predictors and outcomes, they cannot quantify the individualized contribution of each predictor to a specific patient’s predicted risk, nor can they adequately visualize nonlinear effects. Tree-based ensemble models are also considered “black box” models with limited intrinsic transparency due to their complex internal structure. To address these limitations, we applied the SHapley Additive exPlanations (SHAP) framework, a game theory-based explainable artificial intelligence method that decomposes model predictions into additive feature contributions.27–29 SHAP analysis enables both global and individualized interpretability:
Global interpretability: A SHAP beeswarm plot was generated to illustrate the overall feature importance ranked by mean absolute SHAP values, and to visualize the direction of correlation between each feature and predicted MDR risk.
Individualized interpretability: SHAP dependence plots were generated for the top 4 most important continuous variables to visualize their marginal effects on model predictions and explore potential feature interactions.
External Validation
For external validation, the independent local hospital cohort was processed using the preprocessing workflow and parameters derived from the training set, with no refitting or reoptimization performed on the external validation data. The final LR model was applied to the preprocessed external validation feature matrix to generate predicted MDR risk probabilities. Model performance in the external validation cohort was evaluated using all metrics specified in Section Model Performance Evaluation, and performance was compared with the internal test set to assess the model’s robustness and cross-population generalizability.
Statistical Analysis
For baseline characteristics analysis, normally distributed continuous variables are presented as mean ± standard deviation, while non-normally distributed continuous variables are presented as median (interquartile range, IQR). Categorical variables are expressed as frequency (percentage). Between-group comparisons (MDR vs non-MDR groups) were performed using the Student’s t-test or Mann–Whitney U-test for continuous variables, and the chi-square test or Fisher’s exact test for categorical variables. Statistical significance was defined as p < 0.05.
All statistical analyses, data preprocessing, and model development were performed using Python version 3.12, with libraries including scikit-learn, xgboost, lightgbm, shap, pandas, and numpy.
Results
Patient Demographic Characteristics
A total of 1015 hospitalized patients from two independent cohorts: the MIMIC-IV public database cohort (n=802), which included 161 multidrug-resistant (MDR)-positive cases (positivity rate 20.1%), and an external validation cohort from a local hospital (n=213), which included 44 MDR-positive cases (positivity rate 20.7%). The Chi-square test revealed no statistically significant difference in MDR positivity rates between the two cohorts (χ2=0.058, p=0.810). The mean age was 65.6 years in the MIMIC-IV cohort and 74.3 years in the local validation cohort, with male patients comprising 55.6% and 57.3% of the respective cohorts. Table 1 presents all variables retained after feature selection in both the training set (the MIMIC-IV dataset) and validation sets.
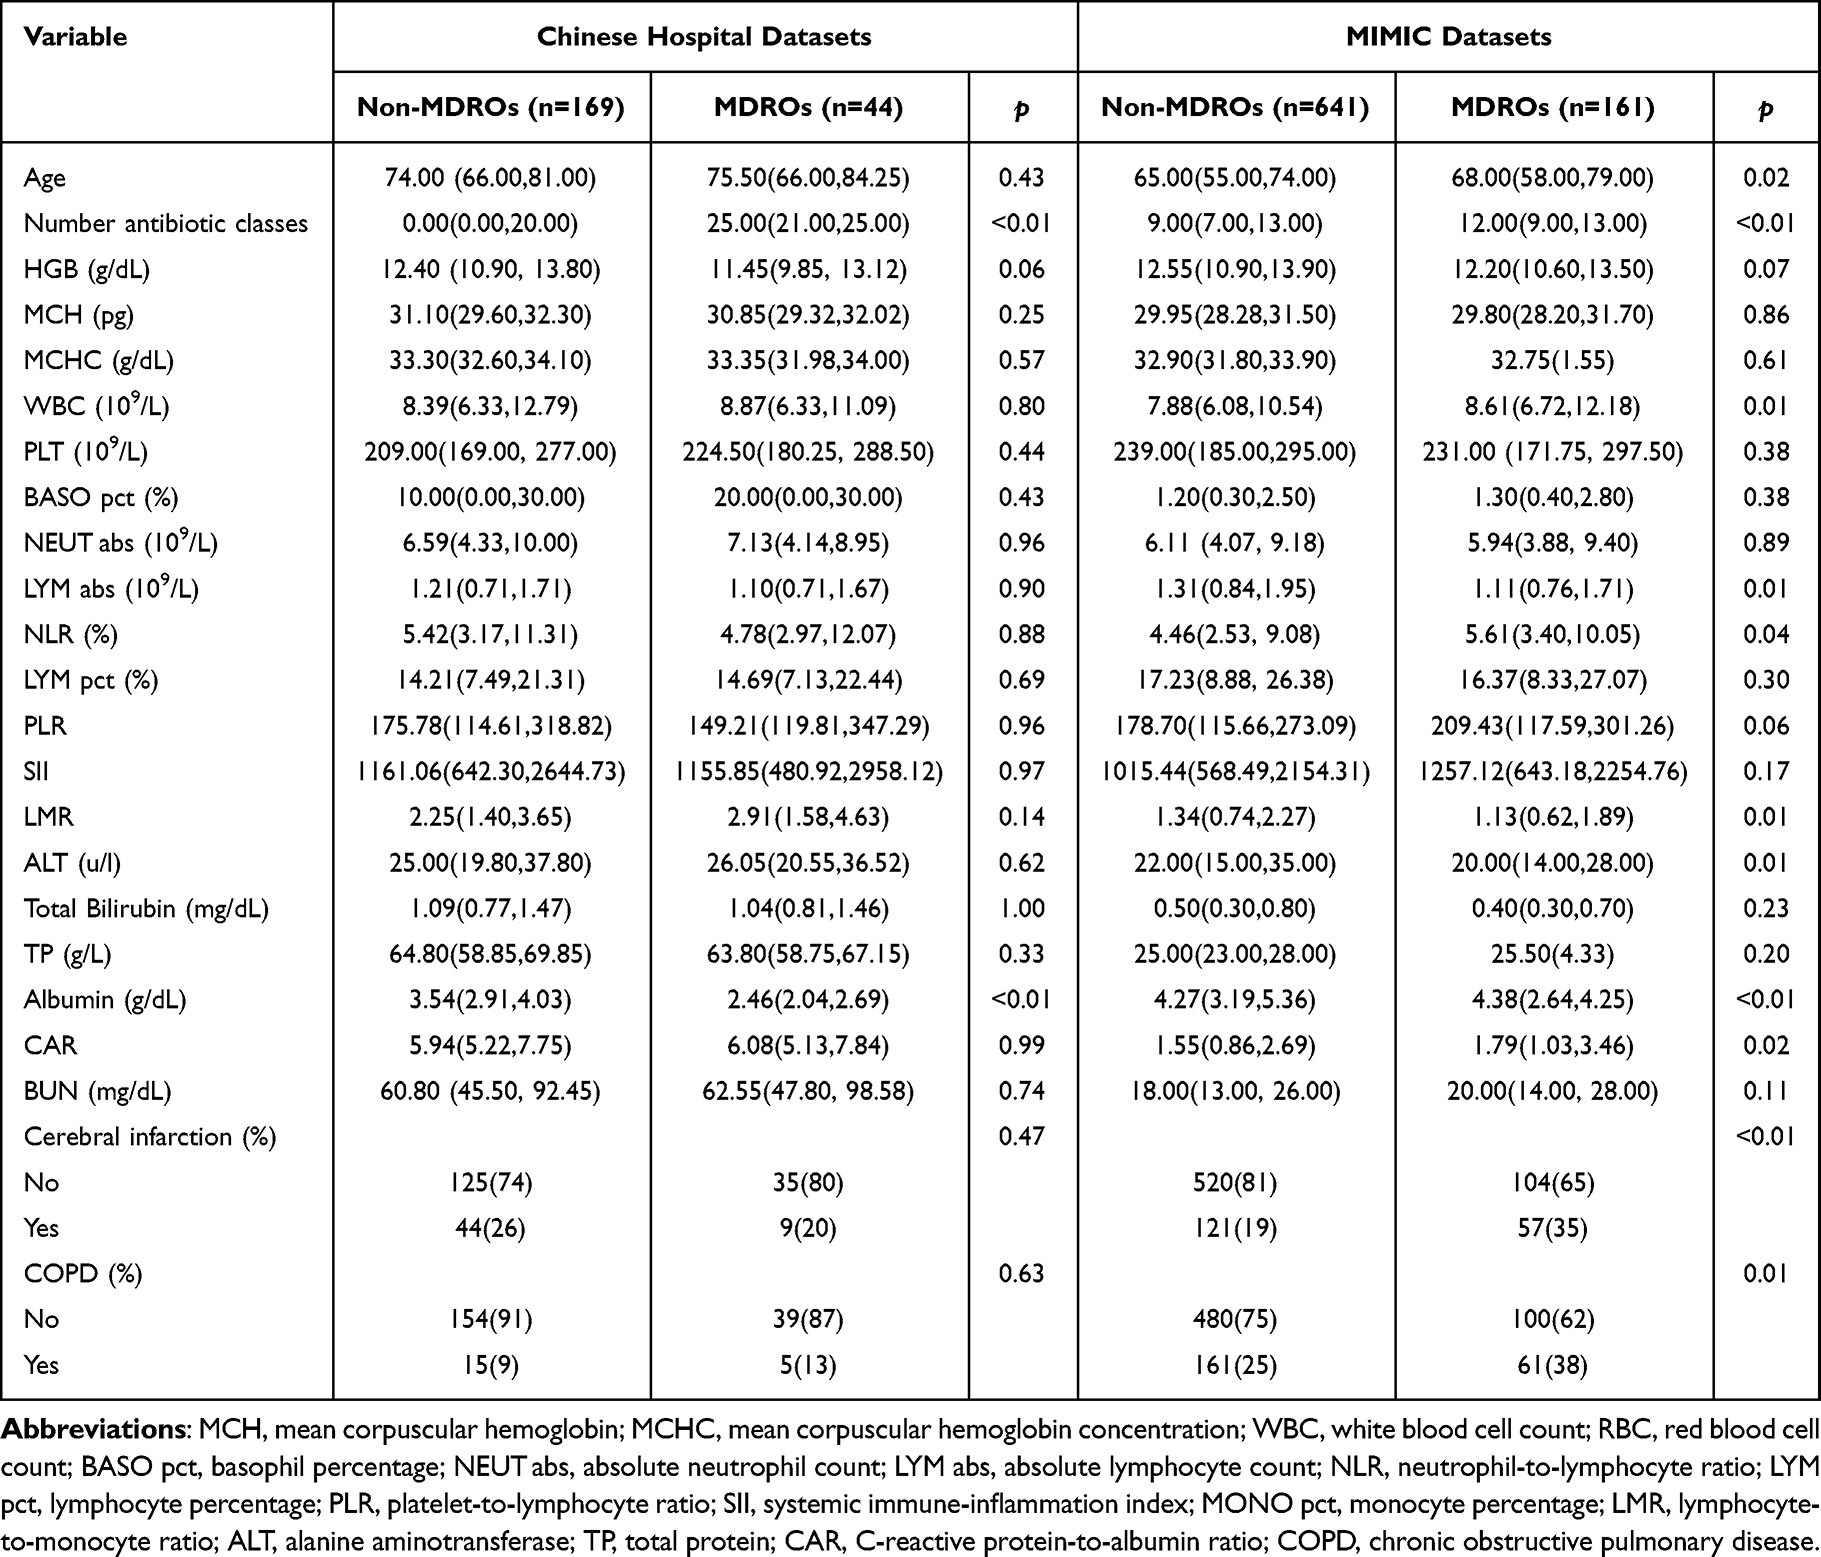 |
Table 1 Characteristics of Multidrug-Resistant versus Non-Multidrug-Resistant Patients from the MIMIC-IV and Local Hospital Databases |
Key Predictor Identification for Multidrug-Resistant Organism Infections in Pneumonia
For continuous variables, the Lasso regression analysis revealed considerable variation in the contributions of different metrics to the MDR outcome. A strong negative association was observed for the systemic immune-inflammation index (SII) and albumin level, with Lasso coefficients substantially below zero, suggesting an inverse association with MDR infection risk. In contrast, white blood cell count (WBC), number of antibiotic classes, neutrophil-to-lymphocyte ratio (NLR), and platelet-to-lymphocyte ratio (PLR) exhibited positive coefficients, indicating increased MDR infection risk. In terms of coefficient magnitudes, WBC and albumin demonstrated the largest absolute values. The C-reactive protein-to-albumin ratio (CAR), basophil percentage (BASO pct), and absolute lymphocyte count (LYM abs) also showed notably high coefficients, identifying them as important continuous predictors. These six variables were selected for further analysis due to their higher feature importance. Conversely, variables including GHB, lymphocyte percentage (LYM pct), and blood urea nitrogen (BUN) had coefficients approaching zero, showing minimal predictive contribution (Figure 2).
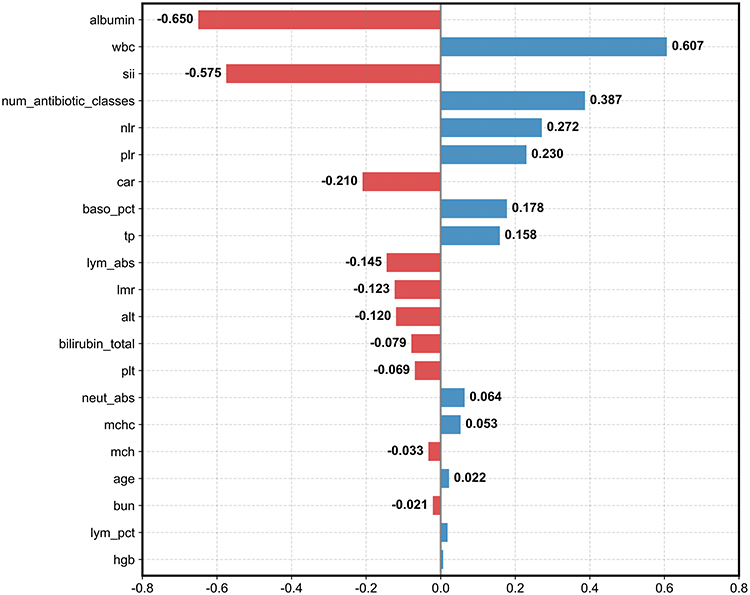 |
Figure 2 Standardized regression coefficient plot of candidate predictors based on LASSO logistic regression. The horizontal axis represents the standardized regression coefficient value of each predictor for multidrug-resistant organism (MDRO). Positive coefficient values (blue bars) indicate risk factors for MDRO, while negative coefficient values (red bars) indicate protective factors. The vertical axis lists all candidate predictors included in the LASSO regression. The solid black vertical line at x=0 is the zero-coefficient reference line. |
Chi-square tests were conducted to screen binary variables, with cerebral infarction and chronic obstructive pulmonary disease (COPD) identified as the only binary variables significantly associated with MDR outcomes. Comparative plots of the six top continuous variables (selected based on Lasso feature importance) and the two binary variables (cerebral infarction and COPD) across different groups are presented in Supplementary Figure 1.
Model Performance and Horizontal Comparison
On the internal test set, the Logistic Regression (LR) model demonstrated superior discriminative ability, achieving an area under the receiver operating characteristic curve (AUROC) of 0.798 (Figure 3A). This performance was notably higher than that of XGBoost (AUC=0.742), Random Forest (RF, AUC=0.771), and LightGBM (LGBM, AUC=0.715). A comprehensive comparison of performance metrics, including accuracy, precision, and F1-score with their 95% confidence intervals, is provided in Table 2. While all models maintained high specificity, LR achieved the highest accuracy (0.807) and AUROC, indicating its strong overall performance for this prediction task.
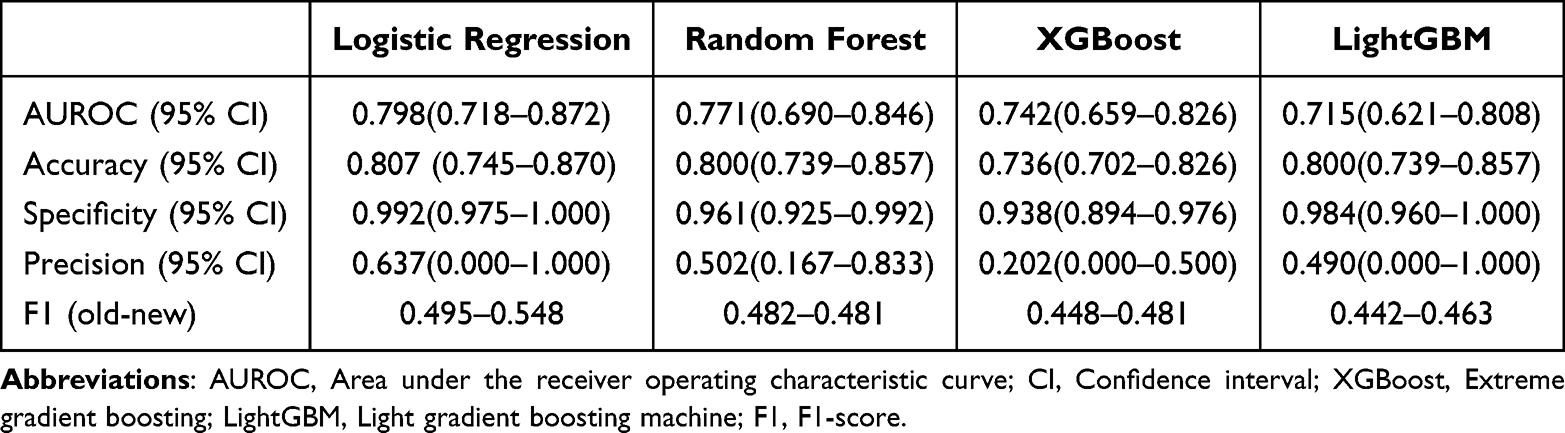 |
Table 2 Comparison of Model Performance Metrics for Logistic Regression, Random Forest, XGBoost, and LightGBM Following Internal Validation |
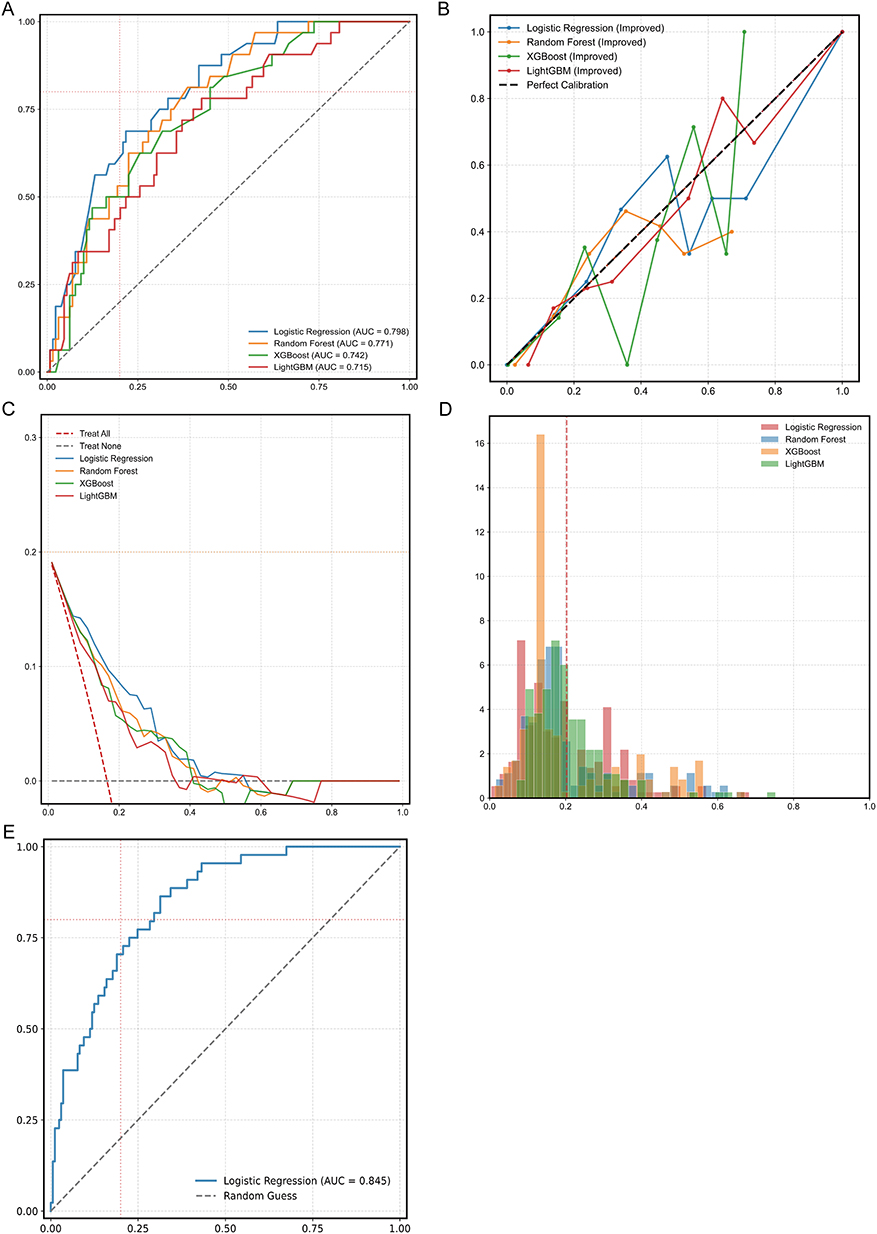 |
Figure 3 Performance comparison and validation of four prediction models for MDRO risk. Four models were developed, including logistic regression, random forest, XGBoost, and LightGBM. (A) Receiver operating characteristic (ROC) curves of the four models in the internal validation cohort. (B) Calibration curves of the four models. The diagonal black dashed line represents the ideal calibration (the predicted probability is perfectly consistent with the actual probability of MDRO). (C) Decision curve analysis (DCA) to evaluate the clinical net benefit of the four models. The red dashed line represents the “Treat All” strategy, the gray dashed line represents the “Treat None” strategy, and the colored solid lines represent the net benefit of each model at different threshold probabilities. (D) Predicted probability density distribution of the four models for MDRO risk. The red vertical dashed line indicates the mean predicted probability of all samples. (E) ROC curve of the optimal logistic regression model in the external validation cohort. The blue solid line represents the ROC curve of the model, the gray dashed line represents the reference line of random guess (AUC=0.5), and the red dotted lines are auxiliary reference lines for AUC evaluation. |
Figure 3B presents the calibration curves for the four models, comparing a novel manual binning recalibration method against the default method. The x-axis represents the mean predicted probability, and the y-axis shows the observed event frequency. For instance, LightGBM’s AUC improved to 0.744 with the new method, outperforming the old method (AUC=0.709), indicating improved probability estimation. The decision curve analysis depicts the net benefit of each model (including LR, RF, etc.) and two extreme strategies (treat-all and treat-none) across various threshold probabilities (Figure 3C).
AUROC before calibration represented the raw predictive performance of uncalibrated baseline models, AUROC after standard calibration denoted the performance following conventional isotonic calibration (equal-frequency binning), and AUROC after improved calibration referred to the performance using our modified isotonic calibration that preserves feature discriminability. As shown in the results, Logistic Regression achieved the highest baseline AUROC (0.798) with slight increments to 0.802 and 0.806 after standard and improved calibration, respectively. Tree-based models exhibited more notable performance changes: Random Forest decreased to 0.740 with standard calibration but recovered to 0.763 with our method, while XGBoost and LightGBM both obtained remarkable improvements (0.742 to 0.788 and 0.715 to 0.744, respectively) via improved calibration, in contrast to the declines with standard calibration. The improved calibration strategy showed higher AUROC values across all models, validating its efficacy in balancing calibrated probability accuracy and feature discriminability (Table 3).
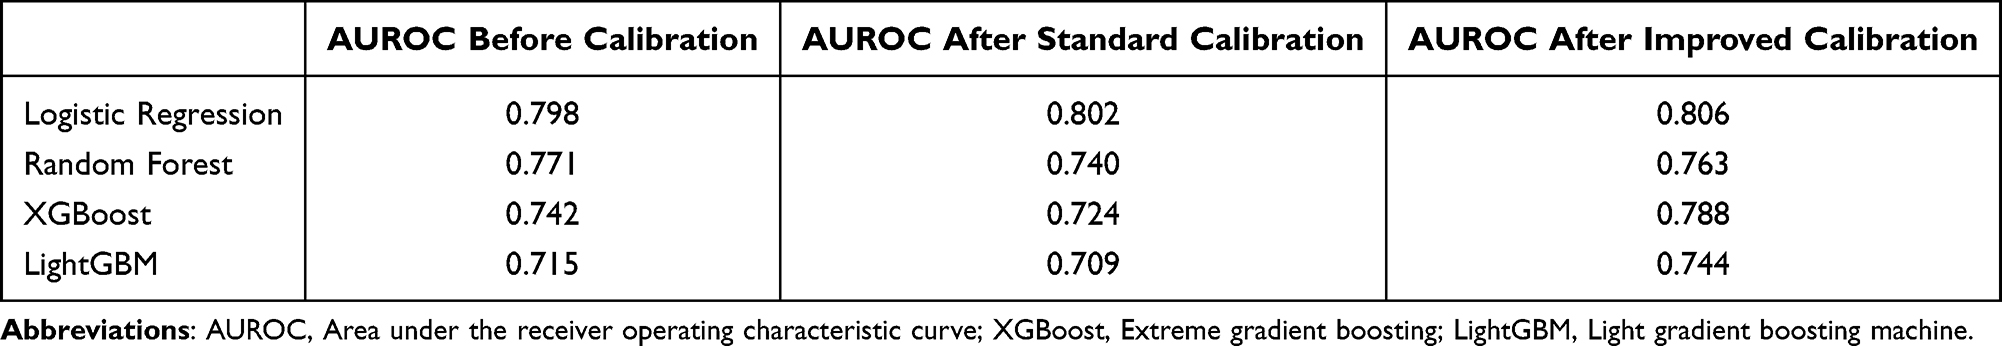 |
Table 3 Comparison of AUROC Before Calibration, with Original Calibration, and with Improved Calibration Across Logistic Regression, Random Forest, XGBoost, and LightGBM Models |
The distribution of predicted probabilities for multidrug-resistant (MDR) infection risk generated by the four models is shown in Figure 3D. Most predictions were concentrated in the 0.0–0.4 range, indicating a generally low-to-moderate predicted risk. Distribution patterns varied among models, with XGBoost showing a peak near 0.2, while LR produced a more dispersed profile.
The optimally tuned and calibrated LR model was externally validated on an independent cohort from a local hospital (n=213; 44 MDR-positive, positivity rate=20.7%). To prevent data leakage, all external data were strictly processed using the preprocessing pipeline and parameters derived exclusively from the internal training set. The model achieved an AUROC of 0.845 on this external set (Figure 3E), demonstrating consistent discriminative performance across cohorts.
Our multidrug-resistant prediction model was compared with two recent studies. Zhao et al (2025) and Cui et al (2025) achieved optimal internal AUROCs of 0.83 and 0.831 using random forest and XGBoost, yet both lacked independent external validation and showed limited generalizability from single-center/database designs.19,30 Our study screened four machine learning models and identified logistic regression as optimal. With Lasso-Chi-square dual feature selection and discrimination-preserving improved isotonic calibration, our model achieved an internal AUROC of 0.798 and an external AUROC of 0.845 via independent external validation. (Supplementary Table 1).
Interpreting Model Predictions: SHAP Analysis Reveals Key Drivers of MDR Risk
SHAP analysis was employed to interpret the predictions of the Logistic Regression model (Figure 4). The plot indicated that albumin and the systemic immune-inflammation index (SII) substantially influenced the model’s output. Higher albumin levels were mainly associated with negative SHAP values, indicating a lower predicted risk of multidrug-resistant infection, lower SII values were mainly associated with negative SHAP values, indicating a lower predicted MDR risk.
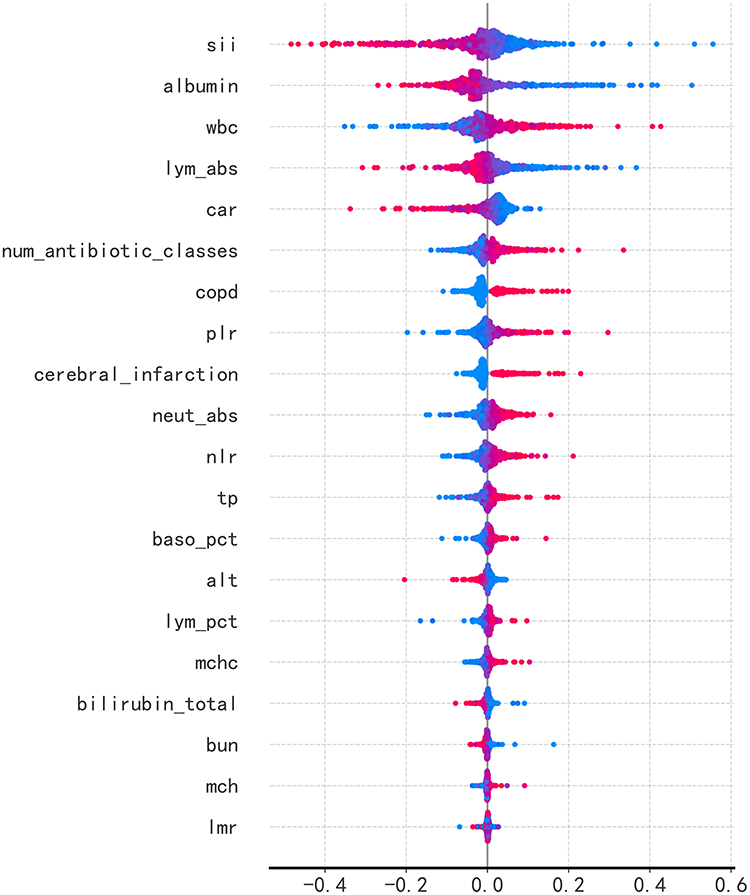 |
Figure 4 SHAP summary plot for the Logistic Regression model. This plot illustrates the contribution of each predictor to the MDRO risk prediction of the model. Predictors are ranked from top to bottom according to the magnitude of their predictive contribution (mean absolute SHAP value). The horizontal axis represents the SHAP value (the magnitude of the variable’s impact on the model’s predicted probability of MDRO). The color gradient represents the normalized value of each variable, from the minimum value (red) to the maximum value (blue). |
Dependence plots for the four most influential variables illustrated their relationships with model predictions (Figure 5). For SII, lower values were associated with positive SHAP values, which gradually shifted toward negative as SII increased, suggesting an overall negative association with MDR risk. White blood cell count demonstrated a clear positive association, with higher values substantially increasing the predicted risk. Albumin showed a predominantly negative relationship, where higher levels corresponded to lower predicted risk. Similarly, lymphocyte absolute count exhibited a negative association, with increasing values generally contributing to lower MDR risk.
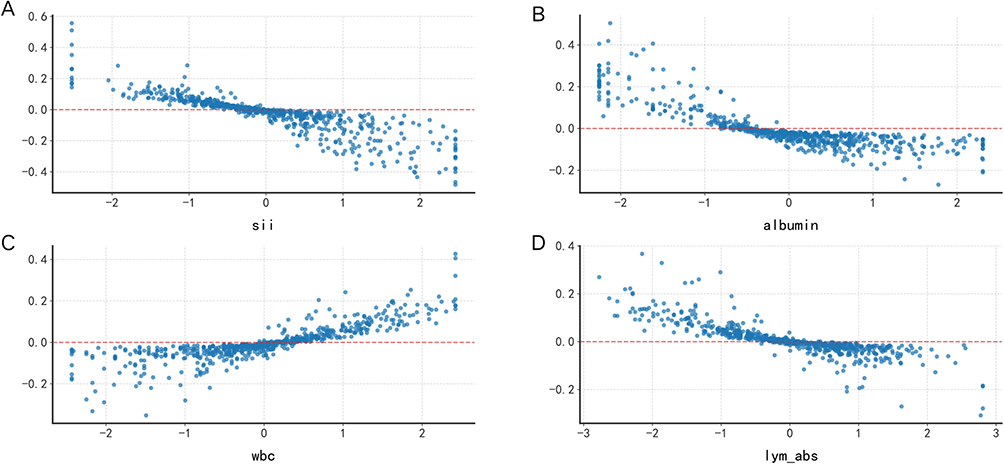 |
Figure 5 SHAP dependence plots of the top four most influential predictors for the optimal logistic regression model. These plots visualize the marginal effect of a single predictor on the model’s predicted probability of MDRO, while adjusting for the effects of other predictors. The horizontal axis of each subplot represents the actual value of the predictor, the vertical axis represents the corresponding SHAP value (the impact of the predictor on the predicted MDRO risk), and the red horizontal dashed line is the reference line of SHAP=0 (no impact on prediction). (A) systemic immune-inflammation index (SII); (B) Albumin; (C) white blood cell count(WBC); (D) absolute lymphocyte count (LYM abs). |
Discussion
This study developed and validated a logistic regression (LR)-based prediction model for multidrug-resistant (MDR) pneumonia using the MIMIC-IV database and an independent cohort from a Chinese tertiary hospital. The model showed robust and stable predictive performance, with an AUC of 0.845 in the external validation cohort, enabling early identification of nearly 80% of patients at high risk of MDR pneumonia to support timely clinical intervention. We also identified 6 key predictors of MDR pneumonia, including systemic immune-inflammation index (SII), serum albumin, C-reactive protein to albumin ratio (CAR), number of antibiotic classes, white blood cell count (WBC), and absolute lymphocyte count (LYM abs).
We compared the performance of LR with three mainstream machine learning algorithms (random forest, XGBoost, and LightGBM) through stratified five-fold cross-validation and grid search hyperparameter optimization, with model stability verified by repeated runs. We found that all included algorithms had comparable overall discrimination, with AUROC values ranging from 0.715 to 0.798 and overlapping confidence intervals, indicating similar predictive performance across models. The slightly superior performance of LR in both the development and external validation cohorts may be attributed to three factors. First, after rigorous feature engineering, the retained predictors appeared to exhibit largely monotonic or approximately linear relationships with MDR outcomes, which aligns with the linear fitting mechanism of LR and reduces the advantage of nonlinear ensemble models. Second, for structured clinical data with moderate sample size and class imbalance, complex ensemble models may be more prone to capturing noise in moderate-sized structured datasets, whereas LR with lower model complexity and stronger bias constraints exhibits better robustness and generalizability across independent cohorts. Third, LR is inherently optimized for probabilistic output under a logistic link function, showing more stable performance after isotonic calibration, while the discrimination advantage of ensemble models was partially attenuated after calibration adjustment. Similar observations have been reported in recent clinical prediction studies, where machine learning methods did not consistently outperform LR in structured tabular datasets, especially when the underlying associations between predictors and outcomes are primarily linear.31,32
In our study, SII was identified as the top-ranked predictor of MDR pneumonia by SHAP global importance analysis, with elevated SII showing a strong positive correlation with MDR risk. This finding can be explained by the bidirectional interaction between systemic inflammation and bacterial drug resistance. Inflammatory processes promote the development of drug resistance through multiple pathways, while persistent MDR infections further exacerbate inflammatory responses, forming a self-reinforcing vicious cycle.33 On the one hand, inflammation recruits neutrophils and leads to alveolar exudate accumulation, generating a hypoxic and acidic microenvironment that drives the selection of resistant bacterial strains. Inflammation also disrupts the respiratory microbial barrier, clears commensal microbiota, and promotes the excessive proliferation of MDR pathogens such as Klebsiella pneumoniae and Pseudomonas aeruginosa, increasing the risk of resistance gene transmission. Meanwhile, reactive oxygen species and antimicrobial peptides produced during severe inflammatory responses can induce bacterial stress responses and activate the expression of resistance genes.34 On the other hand, SII, calculated from platelet, neutrophil, and lymphocyte counts, comprehensively reflects the balance between systemic inflammatory and immune status. Elevated SII, typically characterized by increased platelet and neutrophil counts combined with decreased lymphocyte count, indicates excessive inflammatory activation and impaired immune competence, which further increases the susceptibility to MDR infections.35 Consistent with our findings, previous studies have reported that elevated SII is not only associated with the severity of pneumonia, but also has predictive value for the presence of extended-spectrum beta-lactamase (ESBL)-producing strains and other drug-resistant pathogens.36,37
We also found that LYM abs and serum albumin were negatively correlated with MDR pneumonia risk, while CAR, number of antibiotic classes, and WBC were positively correlated with MDR risk, all of which were verified as independent predictors by SHAP analysis. The inverse association between LYM abs and MDR risk is primarily attributed to immunosuppression caused by lymphopenia. Impaired T-cell and B-cell function leads to reduced antigen presentation and antibody production, which permits the proliferation of resistant bacterial mutants.38–40 Meanwhile, lymphocytes are the primary source of interferon-gamma (IFN-γ), which enhances the bactericidal capacity of macrophages; IFN-γ deficiency caused by lymphopenia can directly reduce antibiotic efficacy and promote the survival of resistant strains.41 For the association between hypoalbuminemia and elevated MDR risk, three core mechanistic pathways are supported by our findings. First, as a negative acute-phase reactant, serum albumin is critical for maintaining normal immune cell function; hypoalbuminemia suppresses the respiratory burst of phagocytes, impairs bactericidal capacity, and creates a survival advantage for resistant bacterial mutants. Second, hypoalbuminemia significantly compromises the efficacy of highly protein-bound antibiotics (including β-lactams, carbapenems, and vancomycin), by altering the pharmacokinetic/pharmacodynamic (PK/PD) profile and reducing the probability of target attainment, which further drives the selection of resistant strains. Third, hypoalbuminemia is often accompanied by tissue edema, poor perfusion, and local acidosis, which can stimulate bacterial efflux pump systems and enhance biofilm formation, further increasing antibiotic minimum inhibitory concentrations and promoting the development of drug resistance.
Despite its methodological strengths, including robust external validation, this study has limitations. First, our study adopted a cross-sectional design, which cannot establish definitive causal relationships between the identified predictors and MDR pneumonia outcomes, and reverse causality cannot be completely excluded. To mitigate this bias, we strictly defined the time window of predictor collection within 24 hours after hospital admission, prior to the identification of MDR pathogens. Future prospective cohort studies are needed to verify the causal relationship between these predictors and MDR pneumonia, and to evaluate whether targeted intervention for these risk factors can reduce the incidence of MDR infections. Second, the external validation cohort was recruited from a single tertiary hospital in China, which may limit the generalizability of the model to primary care settings, pediatric populations, or other regional populations with distinct pathogen epidemiology and antibiotic prescribing practices. Multi-center, multi-regional prospective validation is needed in future studies to further verify the robustness of the model. Third, although we employed multiple imputation to handle missing data and verified that data were missing at random, the imputation method assumes a multivariate Gaussian distribution, which may not fully represent highly skewed inflammatory markers, and estimation bias cannot be completely excluded. Finally, due to data privacy regulations, we were unable to collect long-term follow-up data, which precluded the evaluation of the model’s long-term prognostic utility for outcomes such as MDR recurrence and long-term mortality.
Conclusion
This study aimed to develop and validate an interpretable logistic regression model for early risk prediction of multidrug-resistant (MDR) bacterial infections in patients with pneumonia, with model development based on the large-scale MIMIC-IV database, and independent external validation conducted in a single-center Chinese tertiary-care cohort. The model achieved favorable discriminative performance, with an area under the receiver operating characteristic curve (AUC) of 0.798 in the held-out internal test set (n=802), and maintained stable predictive performance with an AUC of 0.845 in the independent Asian external validation cohort. These results demonstrate that the model has limited overfitting and stable predictive ability across two geographically and ethnically distinct cohorts, rather than confirming broad generalizability. Following standardized isotonic calibration, the model showed good calibration (Hosmer-Lemeshow test, p>0.05). Decision curve analysis indicated the potential clinical utility of the model, which achieved a higher net benefit than the treat-all and treat-none strategies within the 10–60% threshold probability range. In summary, this study provides a reliable, fully interpretable tool for early risk stratification of MDR pneumonia in hospitalized adult patients. We explicitly note that further large-scale, multi-center, multi-regional prospective validation across diverse healthcare settings, age groups, and ethnic populations is required to confirm the broad generalizability of the model, prior to its widespread clinical implementation.
Data Sharing Statement
The MIMIC-IV database is publicly available and can be accessed upon completion of the required training and data use agreement via PhysioNet (https://doi.org/10.13026/kpb9-mt58) after completion of the required trainings and data use agreement. The hospital cohort data used in this study are not publicly available due to institutional ethics restrictions and patient privacy considerations. De-identified data may be made available from the corresponding author upon reasonable request and with approval from the institutional review board.
Ethics Approval and Informed Consent
Part of the data in this study was obtained from the Medical Information Mart for Intensive Care IV (MIMIC-IV, version 3.1), a publicly available, de-identified critical care database. The use of MIMIC-IV was approved by the Institutional Review Boards of the Massachusetts Institute of Technology and Beth Israel Deaconess Medical Center (IRB protocol No. 2001P001699). Access to the database was granted after completion of the required training and data use agreement. Because the database contains fully de-identified patient information, the requirement for individual informed consent was waived in accordance with U.S. federal regulations.
The remaining data were retrospectively collected from Jilin Provincial People’s Hospital and were approved by the Ethics Committee of Jilin Provincial People’s Hospital (Approval No.: 2025163). Given the retrospective nature of the study and the use of de-identified data, the requirement for informed consent was waived by the ethics committee. All procedures complied with the Declaration of Helsinki, and patient confidentiality was strictly protected.
Acknowledgments
The authors greatly appreciate all the patients involved in the study.
Author Contributions
All authors made a significant contribution to the work reported, whether that is in the conception, study design, execution, acquisition of data, analysis and interpretation, or in all these areas; took part in drafting, revising or critically reviewing the article; gave final approval of the version to be published; have agreed on the journal to which the article has been submitted; and agree to be accountable for all aspects of the work.
Funding
This work was supported by the Jilin Provincial Natural Science Foundation (YDZJ202501ZYTS788), Jilin Provincial Outstanding Youth Foundation Project (20240101007JJ), and the Jilin Provincial Health Commission Science and Technology Capacity Enhancement Project (2025WS-KB009).
Disclosure
The authors report no conflicts of interest in this work.
References
1. Torres A, Cilloniz C, Niederman MS, et al. Pneumonia. Nat Rev Dis Prim. 2021;7(1):25. doi:10.1038/s41572-021-00259-0
2. Troeger C, Blacker B, Khalil IA, Collaborators GBDLRI. Estimates of the global, regional, and national morbidity, mortality, and aetiologies of lower respiratory infections in 195 countries, 1990–2016: a systematic analysis for the global burden of disease study 2016. Lancet Infect Dis. 2018;18(11):1191–16. doi:10.1016/S1473-3099(18)30310-4
3. Diseases GBD, Injuries C. Global burden of 369 diseases and injuries in 204 countries and territories, 1990–2019: a systematic analysis for the global burden of disease study 2019. Lancet. 2020;396(10258):1204–1222. doi:10.1016/S0140-6736(20)30925-9
4. Aston SJ, Ho A, Jary H, et al. Etiology and risk factors for mortality in an adult community-acquired pneumonia cohort in Malawi. Am J Respir Crit Care Med. 2019;200(3):359–369. doi:10.1164/rccm.201807-1333OC
5. Poovieng J, Sakboonyarat B, Nasomsong W. Bacterial etiology and mortality rate in community-acquired pneumonia, healthcare-associated pneumonia and hospital-acquired pneumonia in Thai university hospital. Sci Rep. 2022;12(1):9004. doi:10.1038/s41598-022-12904-z
6. Ramirez JA, Wiemken TL, Peyrani P, et al. Adults hospitalized with pneumonia in the united states: incidence, epidemiology, and mortality. Clin Infect Dis. 2017;65(11):1806–1812. doi:10.1093/cid/cix647
7. McAllister DA, Liu L, Shi T, et al. Global, regional, and national estimates of pneumonia morbidity and mortality in children younger than 5 years between 2000 and 2015: a systematic analysis. Lancet Glob Health. 2019;7(1):e47–e57. doi:10.1016/S2214-109X(18)30408-X
8. Kalil AC, Metersky ML, Klompas M, et al. Management of adults with hospital-acquired and ventilator-associated pneumonia: 2016 clinical practice guidelines by the infectious diseases society of America and the American Thoracic Society. Clin Infect Dis. 2016;63(5):e61–e111. doi:10.1093/cid/ciw353
9. Torres A, Niederman MS, Chastre J, et al. International ERS/ESICM/ESCMID/ALAT guidelines for the management of hospital-acquired pneumonia and ventilator-associated pneumonia: guidelines for the management of hospital-acquired pneumonia (HAP)/ventilator-associated pneumonia (VAP) of the European Respiratory Society (ERS), European Society of Intensive Care Medicine (ESICM), European Society of Clinical Microbiology and Infectious Diseases (ESCMID) and Asociacion Latinoamericana del Torax (ALAT). Eur Respir J. 2017;50(3). doi:10.1183/13993003.00582-2017
10. Lui GCY, Lai CKC. Community acquired pneumonia due to antibiotic resistant- Streptococcus pneumoniae: diagnosis, management and prevention. Curr Opin Pulm Med. 2025;31(3):211–217. doi:10.1097/MCP.0000000000001153
11. Metlay JP, Waterer GW, Long AC, et al. Diagnosis and treatment of adults with community-acquired pneumonia. an official clinical practice guideline of the American Thoracic Society and Infectious Diseases Society of America. Am J Respir Crit Care Med. 2019;200(7):e45–e67. doi:10.1164/rccm.201908-1581ST
12. Magiorakos AP, Srinivasan A, Carey RB, et al. Multidrug-resistant, extensively drug-resistant and pandrug-resistant bacteria: an international expert proposal for interim standard definitions for acquired resistance. Clin Microbiol Infect. 2012;18(3):268–281. doi:10.1111/j.1469-0691.2011.03570.x
13. Cannatelli A, Giani T, D’Andrea MM, et al. MgrB inactivation is a common mechanism of colistin resistance in KPC-producing Klebsiella pneumoniae of clinical origin. Antimicrob Agents Chemother. 2014;58(10):5696–5703. doi:10.1128/AAC.03110-14
14. Liu YY, Wang Y, Walsh TR, et al. Emergence of plasmid-mediated colistin resistance mechanism MCR-1 in animals and human beings in China: a microbiological and molecular biological study. Lancet Infect Dis. 2016;16(2):161–168. doi:10.1016/S1473-3099(15)00424-7
15. Humphries R, Bobenchik AM, Hindler JA, Schuetz AN. Overview of changes to the clinical and laboratory standards institute performance standards for antimicrobial susceptibility testing, M100, 31st edition. J Clin Microbiol. 2021;59(12):e0021321. doi:10.1128/JCM.00213-21
16. Vyas R, Khadatkar DR. Ensemble of deep learning architectures with machine learning for pneumonia classification using chest X-rays. J Imaging Inform Med. 2025;38(2):727–746. doi:10.1007/s10278-024-01201-y
17. Siddiqi R, Javaid S. Deep learning for pneumonia detection in chest X-ray images: a comprehensive survey. J Imaging. 2024;10(8):176. doi:10.3390/jimaging10080176
18. Cilloniz C, Ward L, Mogensen ML, et al. Machine-learning model for mortality prediction in patients with community-acquired pneumonia: development and validation study. Chest. 2023;163(1):77–88. doi:10.1016/j.chest.2022.07.005
19. Cui Z, Dong Y, Yang H, et al. Machine learning prediction models for multidrug-resistant organism infections in ICU ventilator-associated pneumonia patients: analysis using the MIMIC-IV database. Comput Biol Med. 2025;190(110028):110028. doi:10.1016/j.compbiomed.2025.110028
20. Chen J, Hou D, Song Y. Development and multi-database validation of interpretable machine learning models for predicting In-Hospital mortality in pneumonia patients: a comprehensive analysis across four healthcare systems. Respir Res. 2025;26(1):279. doi:10.1186/s12931-025-03348-w
21. Kim JI, Maguire F, Tsang KK, et al. Machine learning for antimicrobial resistance prediction: current practice, limitations, and clinical perspective. Clin Microbiol Rev. 2022;35(3):e0017921. doi:10.1128/cmr.00179-21
22. Johnson ABL, Pollard T, Gow B, et al. MIMIC-IV (version 3.1). PhysioNet. RRID:SCR_007345. 2024. doi:10.13026/kpb9-mt58.
23. Di Lodovico S, Fasciana T, Di Giulio M, et al. Spread of multidrug-resistant microorganisms. Antibiotics. 2022;11(7):832. doi:10.3390/antibiotics11070832
24. Steyerberg EW, Vergouwe Y. Towards better clinical prediction models: seven steps for development and an ABCD for validation. Eur Heart J. 2014;35(29):1925–1931. doi:10.1093/eurheartj/ehu207
25. Zhang J, Mucs D, Norinder U, Svensson F. LightGBM: an effective and scalable algorithm for prediction of chemical toxicity-application to the Tox21 and mutagenicity data sets. J Chem Inf Model. 2019;59(10):4150–4158. doi:10.1021/acs.jcim.9b00633
26. Moore A, Bell M. XGBoost, A novel explainable ai technique, in the prediction of myocardial infarction: a UK biobank cohort study. Clin Med Insights Cardiol. 2022;16(11795468221133611). doi:10.1177/11795468221133611
27. Topol EJ. High-performance medicine: the convergence of human and artificial intelligence. Nat Med. 2019;25(1):44–56. doi:10.1038/s41591-018-0300-7
28. Caterson J, Lewin A, Williamson E. The application of explainable artificial intelligence (XAI) in electronic health record research: a scoping review. Digit Health. 2024;10(20552076241272657). doi:10.1177/20552076241272657
29. Lundberg SM, Erion G, Chen H, et al. From local explanations to global understanding with explainable AI for trees. Nat Mach Intell. 2020;2(1):56–67. doi:10.1038/s42256-019-0138-9
30. Zhao W, Sun P, Li W, Shang L. Machine learning-based prediction model for multidrug-resistant organisms infections: performance evaluation and interpretability analysis. Infect Drug Resist. 2025;18:2255–2269. doi:10.2147/IDR.S459830
31. de Groot LM, Twisk JWR, Kok AAL, Heymans MW. Incorporating longitudinal variability in prediction models: a comparison of machine learning and logistic regression in a cohort study with long follow-up. Ann Epidemiol. 2025;110:51–65. doi:10.1016/j.annepidem.2025.07.060
32. Christodoulou E, Ma J, Collins GS, Steyerberg EW, Verbakel JY, Van Calster B. A systematic review shows no performance benefit of machine learning over logistic regression for clinical prediction models. J Clin Epidemiol. 2019;110:12–22. doi:10.1016/j.jclinepi.2019.02.004
33. Ye X, Shen B, Cai Z, Chen D, Wu Y. Bacterial pneumonia alters the respiratory microbiota and inflammatory profile via the lung microbiome-immune axis. Curr Microbiol. 2025;82(11):528. doi:10.1007/s00284-025-04482-w
34. Souque C, Gonzalez Ojeda I, Baym M. From petri dishes to patients to populations: scales and evolutionary mechanisms driving antibiotic resistance. Annu Rev Microbiol. 2024;78(1):361–382. doi:10.1146/annurev-micro-041522-102707
35. Xie R, Liu X, Wu H, Liu M, Zhang Y. Associations between systemic immune-inflammation index and abdominal aortic calcification: results of a nationwide survey. Nutr Metab Cardiovasc Dis. 2023;33(7):1437–1443. doi:10.1016/j.numecd.2023.04.015
36. Xie M, Yuan K, Zhu X, et al. Systemic immune-inflammation index and long-term mortality in patients with stroke-associated pneumonia. J Inflamm Res. 2023;16:1581–1593. doi:10.2147/JIR.S399371
37. Ma X, Yuan J, Tang L, et al. Predicting drug resistance: the use of novel inflammatory markers in identifying ESBL-producing Klebsiella pneumoniae. J Inflamm Res. 2025;18:2153–2168. doi:10.2147/JIR.S506046
38. Fischer S, Proschmann U, Akgun K, Ziemssen T. Lymphocyte counts and multiple sclerosis therapeutics: between mechanisms of action and treatment-limiting side effects. Cells. 2021;10(11):3177. doi:10.3390/cells10113177
39. Traub J, Hausser-Kinzel S, Weber MS. Differential effects of MS therapeutics on B cells-implications for their use and failure in AQP4-positive NMOSD patients. Int J Mol Sci. 2020;21(14):5021. doi:10.3390/ijms21145021
40. He L, Qiang R, Li W. The miR-3164/PAD4 axis regulates NETosis to prevent airway inflammation and remodeling through the TLR2/NF-kappaB signaling pathway. Eur J Med Res. 2025;30(1):947. doi:10.1186/s40001-025-03175-1
41. Zhou YQ, Feng DY, Li WJ, et al. Lower neutrophil-to-lymphocyte ratio predicts high risk of multidrug-resistant Pseudomonas aeruginosa infection in patients with hospital-acquired pneumonia. Ther Clin Risk Manag. 2018;14:1863–1869. doi:10.2147/TCRM.S179181
 © 2026 The Author(s). This work is published and licensed by Dove Medical Press Limited. The
full terms of this license are available at https://www.dovepress.com/terms
and incorporate the Creative Commons Attribution
- Non Commercial (unported, 4.0) License.
By accessing the work you hereby accept the Terms. Non-commercial uses of the work are permitted
without any further permission from Dove Medical Press Limited, provided the work is properly
attributed. For permission for commercial use of this work, please see paragraphs 4.2 and 5 of our Terms.
© 2026 The Author(s). This work is published and licensed by Dove Medical Press Limited. The
full terms of this license are available at https://www.dovepress.com/terms
and incorporate the Creative Commons Attribution
- Non Commercial (unported, 4.0) License.
By accessing the work you hereby accept the Terms. Non-commercial uses of the work are permitted
without any further permission from Dove Medical Press Limited, provided the work is properly
attributed. For permission for commercial use of this work, please see paragraphs 4.2 and 5 of our Terms.
Recommended articles
Bacterial Epidemiology and Antimicrobial Resistance Profiles of Respiratory Specimens of Children with Pneumonia in Hainan, China
Mai W, Liu Y, Meng Q, Xu J, Wu J
Infection and Drug Resistance 2023, 16:249-261
Published Date: 12 January 2023