Back to Journals » International Journal of Chronic Obstructive Pulmonary Disease » Volume 16
Predicting Future Health Risk in COPD: Differential Impact of Disease-Specific and Multi-Morbidity-Based Risk Stratification
Authors Groves D, Karsanji U ![]() , Evans RA, Greening N, Singh SJ, Quint JK
, Evans RA, Greening N, Singh SJ, Quint JK ![]() , Whittaker H, Richardson M, Barrett J, Sutch SP
, Whittaker H, Richardson M, Barrett J, Sutch SP ![]() , Steiner MC
, Steiner MC ![]()
Received 28 January 2021
Accepted for publication 4 May 2021
Published 16 June 2021 Volume 2021:16 Pages 1741—1754
DOI https://doi.org/10.2147/COPD.S303202
Checked for plagiarism Yes
Review by Single anonymous peer review
Peer reviewer comments 3
Editor who approved publication: Prof. Dr. Richard Russell
David Groves,1,* Urvee Karsanji,1,* Rachael A Evans,1 Neil Greening,1 Sally J Singh,1 Jennifer K Quint,2 Hannah Whittaker,2 Matthew Richardson,1 James Barrett,3 Stephen P Sutch,4 Michael C Steiner1
1NIHR Leicester Biomedical Research Centre – Respiratory, Department of Respiratory Sciences, College of Life Sciences, University of Leicester, Leicester, UK; 2National Heart and Lung Institute, Imperial College London, London, UK; 3Johns Hopkins HealthCare Solutions, Baltimore, MD, USA; 4Bloomberg School of Public Health, John Hopkins University, Department of Health Policy and Management, Baltimore, MD, USA
*These authors contributed equally to this work
Correspondence: Michael C Steiner
Leicester Biomedical Research Centre – Respiratory, University Hospitals of Leicester, Department of Respiratory Sciences, College of Life Sciences, University of Leicester Email [email protected]
Objective: Multi-morbidity contributes to mortality and hospitalisation in COPD, but it is uncertain how this interacts with disease severity in risk prediction. We compared contributions of multi-morbidity and disease severity factors in modelling future health risk using UK primary care healthcare data.
Methods: Health records from 103,955 patients with COPD identified from the Clinical Practice Research Datalink were analysed. We compared area under the curve (AUC) statistics for logistic regression (LR) models incorporating disease indices with models incorporating categorised comorbidities. We also compared these models with performance of The John Hopkins Adjusted Clinical Groups® System (ACG) risk prediction algorithm.
Results: LR models predicting all-cause mortality outperformed models predicting hospitalisation. Mortality was best predicted by disease severity (AUC & 95% CI: 0.816 (0.805– 0.827)) and prediction was enhanced only marginally by the addition of multi-morbidity indices (AUC & 95% CI: 0.829 (0.818– 0.839)). The model combining disease severity and multi-morbidity indices was a better predictor of hospitalisation (AUC & 95% CI: 0.679 (0.672– 0.686)). ACG-derived LR models outperformed conventional regression models for hospitalisation (AUC & 95% CI: 0.697 (0.690– 0.704)) but not for mortality (AUC & 95% CI: 0.816 (0.805– 0.827)).
Conclusion: Stratification of future health risk in COPD can be undertaken using clinical and demographic data recorded in primary care, but the impact of disease severity and multi-morbidity varies depending on the choice of health outcome. A more comprehensive risk modelling algorithm such as ACG offers enhanced prediction for hospitalisation by incorporating a wider range of coded diagnoses.
Keywords: COPD, UK primary care, CPRD, hospitalisation, mortality, multi-morbidity
Introduction
Chronic obstructive pulmonary disease (COPD) is a prevalent long-term condition associated with premature mortality, morbidity and healthcare cost.1 Hospitalisation for an exacerbation of COPD is an important risk indicator as subsequent two-year mortality after hospitalisation is approximately 30%.2 In most healthcare systems, COPD is predominantly managed in primary care, but patients with more advanced or complex disease who are at greater risk of premature mortality or hospitalisation may require more intensive, specialist care. Assessing future health risk is therefore of value in assisting clinicians make shared decisions with patients about their care needs and helping health policy-makers develop services with appropriate capacity to ensure patients’ planned and acute care needs can be met.
Several COPD risk stratification scores have been evaluated mostly relying on measures of COPD-specific disease severity.3,4,5,6 Often these incorporate a limited number of variables in the scoring system or are unsuitable for risk stratification in primary care populations because they include indices not routinely recorded in primary care. It is now appreciated that pattern and burden of pulmonary and non-pulmonary comorbid conditions has an important impact on symptoms and future health risk.7 While evidence exists that such multi-morbidity (usually defined by the presence of two or more chronic conditions)8,9 influences long-term health risk, COPD risk stratification models based on clinically coded comorbid conditions are lacking and it is unknown how they might compare with models incorporating COPD-specific disease severity indices in predicting risk or indeed whether stratification models combining disease severity and multi-morbidity would enhance prediction performance.
The Johns Hopkins Adjusted Clinical Groups (ACG) system is a well-established, multi-morbidity-based algorithm providing risk adjustment and predictive modelling capabilities and is widely used to support population health analysis (see Supplementary Appendix S1). It has been tested in numerous health systems in the UK and worldwide10,11 including in primary care studies in COPD.12,13 ACG integrates primary and secondary care data to summarise multi-morbidity by incorporating all ICD-coded and Read-coded diagnoses that are recorded and thereby estimates future healthcare utilisation risk. However, ACG considers an ICD-10 coded condition such as COPD as a unitary entity regardless of disease severity and it is unknown how the predictive power of ACG compares with disease-specific stratification methodologies, or methodologies where disease-specific indices are combined with patterns of multi-morbidity. Moreover, the utility of the ACG algorithm in predicting mortality is unknown.
We addressed these questions by interrogating primary care data from the UK Clinical Practice Research Datalink (CPRD) together with linked outcome databases of UK Hospital Episode Statistics (HES), the Office for National Statistics (ONS) and English 2015 Index of Multiple Deprivation (IMD).
We aimed to
- Use validated COPD codes to estimate the prevalence of COPD across a range of severities in relation to demographics, COPD-specific indices and multi-morbidity.
- Develop statistical models predicting all-cause mortality and all-cause hospitalisation within 12 months, assessing the relative value of models incorporating COPD-severity indices vs multi-morbidity indices.
- To derive and compare similar models to that above but using ACG, in order to further determine the relative value of a comprehensive multi-morbidity-based risk-profiling algorithm.
We derived and compared area under the curve (AUC) statistics between different outcome prediction models to derive insight into their relative performance for risk stratification.
Methods
Study Design, Participants, and Setting
This was a longitudinal cohort study using routinely collected healthcare data provided by the Clinical Practice Research Datalink (CPRD); the largest source of electronic primary care data representative of patients in the general UK population.14,15 Linked pseudonymised mortality data from the ONS was provided for this study by CPRD for patients in England. Data is linked by NHS Digital, the statutory trusted third party for linking data, using identifiable data held only by NHS Digital. Selected general practices consent to this process at a practice level, with individual patients having the right to opt-out. Hospital admission data were gathered from HES, and deprivation quintiles from the IMD (see Supplementary Appendix S2). Ethics approval was obtained from the Independent Scientific Advisory Committee overseeing CPRD (Protocol No. 18_138R).
The study population were patients over the age of 35 years with COPD, and alive and registered between the study-interval from 1 January 2009 to 31 July 2017 with linkage eligibility to HES and ONS databases. Patients must also have had at least one-year history of GP consultations, and a COPD diagnosis at least 7 days prior to the end of the study-interval (Figure 1). Patients who had an unusually high proportion of missing data for covariates were also excluded (see Supplementary Appendix S4). All patients analysed in the study had a coded COPD diagnosis determined using pre-specified medcodes and validated definitions16 (see Supplementary Appendix S3).
 |
Figure 1 Study index period and the start of follow-up. A) gives an example timeline for case enrolment to the cohort. Eligibility was determined by the presence of a previous COPD medcode and at least 1-year history of GP consultations. This is illustrated using a red circle and covariate values used within regression models are established as closely as possible to the point of case enrolment. In this case, the medcode was a new entry but for many cases in the cohort, the code for COPD was present at the onset of the CPRD cohort. The example shows a period of 1-year prior and a month after enrolment within which values were accepted. Outcomes of all-cause hospitalisation and mortality were recorded 12 months after the point of enrolment. (B) illustrates that the timespan of analysable patient data is highly variable depending on whether COPD was present at the onset of the CPRD cohort or diagnosed later during follow-up and whether the patient left the cohort (eg due to leaving the practice or death. |
Outcomes
All-cause mortality from ONS and hospitalisation from HES. ONS derives the underlying cause of death from death certificates and is coded using ICD-10.17 Similarly, HES derives hospital admissions for patients using ICD-10 codes.
Covariates
Table 1 lists and describes candidate variables which were assigned to demographic, COPD-specific or comorbidity groups together with predicted outcomes. COPD-specific covariates were quantitative, whereas comorbidities were binary and related the presence or absence of conditions.
 |
Table 1 Candidate Predictive Variables and Outcomes Used for Standard Regression Models |
Read-coded variables were assigned to the COPD-specific group based on their known relationship to COPD severity or risk of exacerbation/mortality in previous literature.3,4,5 Acute Exacerbation of COPD (AECOPD) was expected to be a key predictor for mortality and hospitalisation and we therefore recorded these events in the 12 months prior to case ascertainment, defined using a combination of diagnostic and therapy codes that have been shown to be valid.18 Based on GP records, we therefore defined AECOPD as any of the following:
- antibiotic (ABX) and steroid (OCS) prescriptions prescribed for 5–14 days,
- 2/3 symptoms from (cough, sputum, breathlessness) and (ABX or OCS for 5–14 days),
- a lower respiratory tract infection, or from hospital data COPD as primary diagnosis.
Read-coded comorbid conditions were categorised and incorporated into the analysis as outlined in Table 1. Categorisation and grouping of comorbidities was based on their relevance to clinical outcome and health status from previous studies.6,7,19,20,21 Categories included cardiac disease, diabetes mellitus, hypertension, anaemia, psychological disorder (interpreted as one or more of anxiety, depression or dementia), a cancer diagnosis, frailty (one or more of malnutrition, poor vision, incontinence, a history of falls, Social Services involvement), a musculoskeletal condition (one or more of rheumatoid arthritis, osteoarthritis, osteoporosis) and gastroesophageal reflux disorder (GERD) (Table 1). These comorbidities were identified using a combination of medcode lists of recorded GP diagnoses matched against CPRD and hospital diagnoses found by ICD-10 codes on HES files.
Statistical Analyses
Binomial logistic regression (LR) for each of the outcomes was the main basis for our comparisons. For all-cause mortality and all-cause hospitalisation, patients were randomised into 70% training and 30% test subsets. LR models incorporating COPD-specific variables (together with demographic data) were compared against models incorporating comorbidity variables, and then a combination of both COPD-specific and comorbidity variables. To supplement LR, we used Cox regression proportional hazards models to quantify risk at a point in time and discover whether coefficients, hazards ratios and predictive strength were comparable. Data cleaning and modelling procedures can be found in Supplementary Appendix S5, and to inform covariate selection in regression modelling graphs were used to determine interactions between variables in predicting association (see Supplementary Appendix S6).
The following models were generated:
Mortality (M)
- M_COPD (12-month all-cause mortality with demographic and COPD-specific predictors only)
- M_COPDcom (12-month all-cause mortality with demographic, COPD-specific predictors and multi-morbidity)
- M_com (12-month all-cause mortality with comorbidity predictors only)
Hospitalisation (H)
- H_COPD (12-month all-cause hospitalisation with demographic and COPD-specific predictors only)
- H_COPDcom (12-month all-cause hospitalisation with demographic, COPD-specific predictors and multi-morbidity)
- H_com (12-month all-cause hospitalisation with comorbidity predictors only)
Input to ACG (see Supplementary Appendix S1) consists of age, sex, resource usage indicators, hospital admission details, and all ICD-coded diagnoses and prescriptions in the previous year. From this data the patient is assigned to a single Adjusted Clinical Group (ACG) from which a hospitalisation risk estimate is provided and resource utilisation can be predicted. In addition, ACG produces a number of intermediary “grouper outputs” which provide diagnostic and risk categorisation information to supplement the ACG assignment.22 These grouper outputs (summarised in Supplementary Appendix S7) were used to generate the tailored ACG regression models as outlined below.
Two modelling approaches were followed for ACG analysis (Figure 2):
- Standard (std) ACG method. The ACG system provides standardised estimates of the hospitalisation risk within 12-months for each test case. Therefore, this value was compared with the known outcome and an ROC AUC generated.
- Tailored (tld) ACG method. ACG provides a wide range of derived grouper outputs (see Supplementary Appendix S1) for each patient on the training dataset. Therefore, the second model is a LR with hospitalisation as dependent variable and ACG outputs, which include the risk score from the standard ACG regression as independent variables. After a model has been built, an ROC AUC is derived based on the test data.
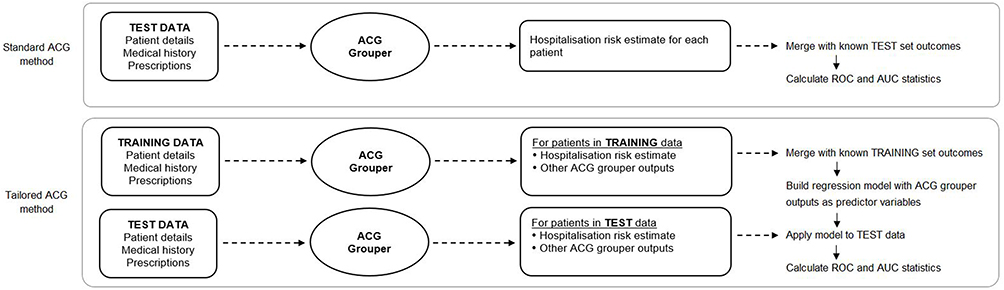 |
Figure 2 Production of ACG prediction performance measures for 12-month all-cause hospitalisation. Area Under the Curve (AUC) statistics are found as shown above for comparison against those for standard regression. Using patient details, healthcare usage, long-term conditions and prescriptions, the ACG grouper produces, for each patient, a list of outputs (Table 2). This is done separately for the training and test datasets. The standard ACG method only uses the test data; it combines ACG’s risk estimate for hospitalisation with the known binary outcome to produce an ROC curve and AUC. The ACG-tailored method uses all the ACG outputs. Treating them as independent predictive variables, a logistic regression model is derived on training data with the known outcome as the dependent variable. This is tested on the test data, producing an ROC and AUC. |
The ACG software does not provide a specific mortality risk estimate and so the tailored regression approach was also used to predict all-cause mortality. The following models were calculated:
- M_acgtld (ACG, 12-month all-cause mortality, tailored (tld) regression using derived ACG grouper outputs)
- H_acgstd (ACG, 12-mth all cause hospitalisation, standard (std) ACG model using single risk measure on test set)
- H_acgtld (ACG, 12-month all-cause hospitalisation, tailored (tld) regression using derived ACG grouper outputs)
For all regression modelling, a step-by-step approach was used where candidate covariates were grouped by type and groups considered in sequence. This staged approach (see Supplementaty Appendix S7) was combined with Akaike Information Criterion (AIC) based backward-elimination and factors considered were p-values, covariate coefficients, AIC and AUC on training data (see Supplementary Appendix S7).
Results
We identified 75,022 patients with COPD who met the inclusion and exclusion criteria (Figure 3), of whom 52.6% were male, with mean age 69.7 years (SD = 11.2) and mean body mass index (BMI) 27.5kg/m2 (SD = 6.2) (Table 2). Summary statistics are shown in Tables 2 and 3. Mean FEV1% predicted was 63.0 but with wide variation (SD = 22.9), confirming a broad range of disease severity. About a third had experienced at least one AECOPD in the year prior to model start date.
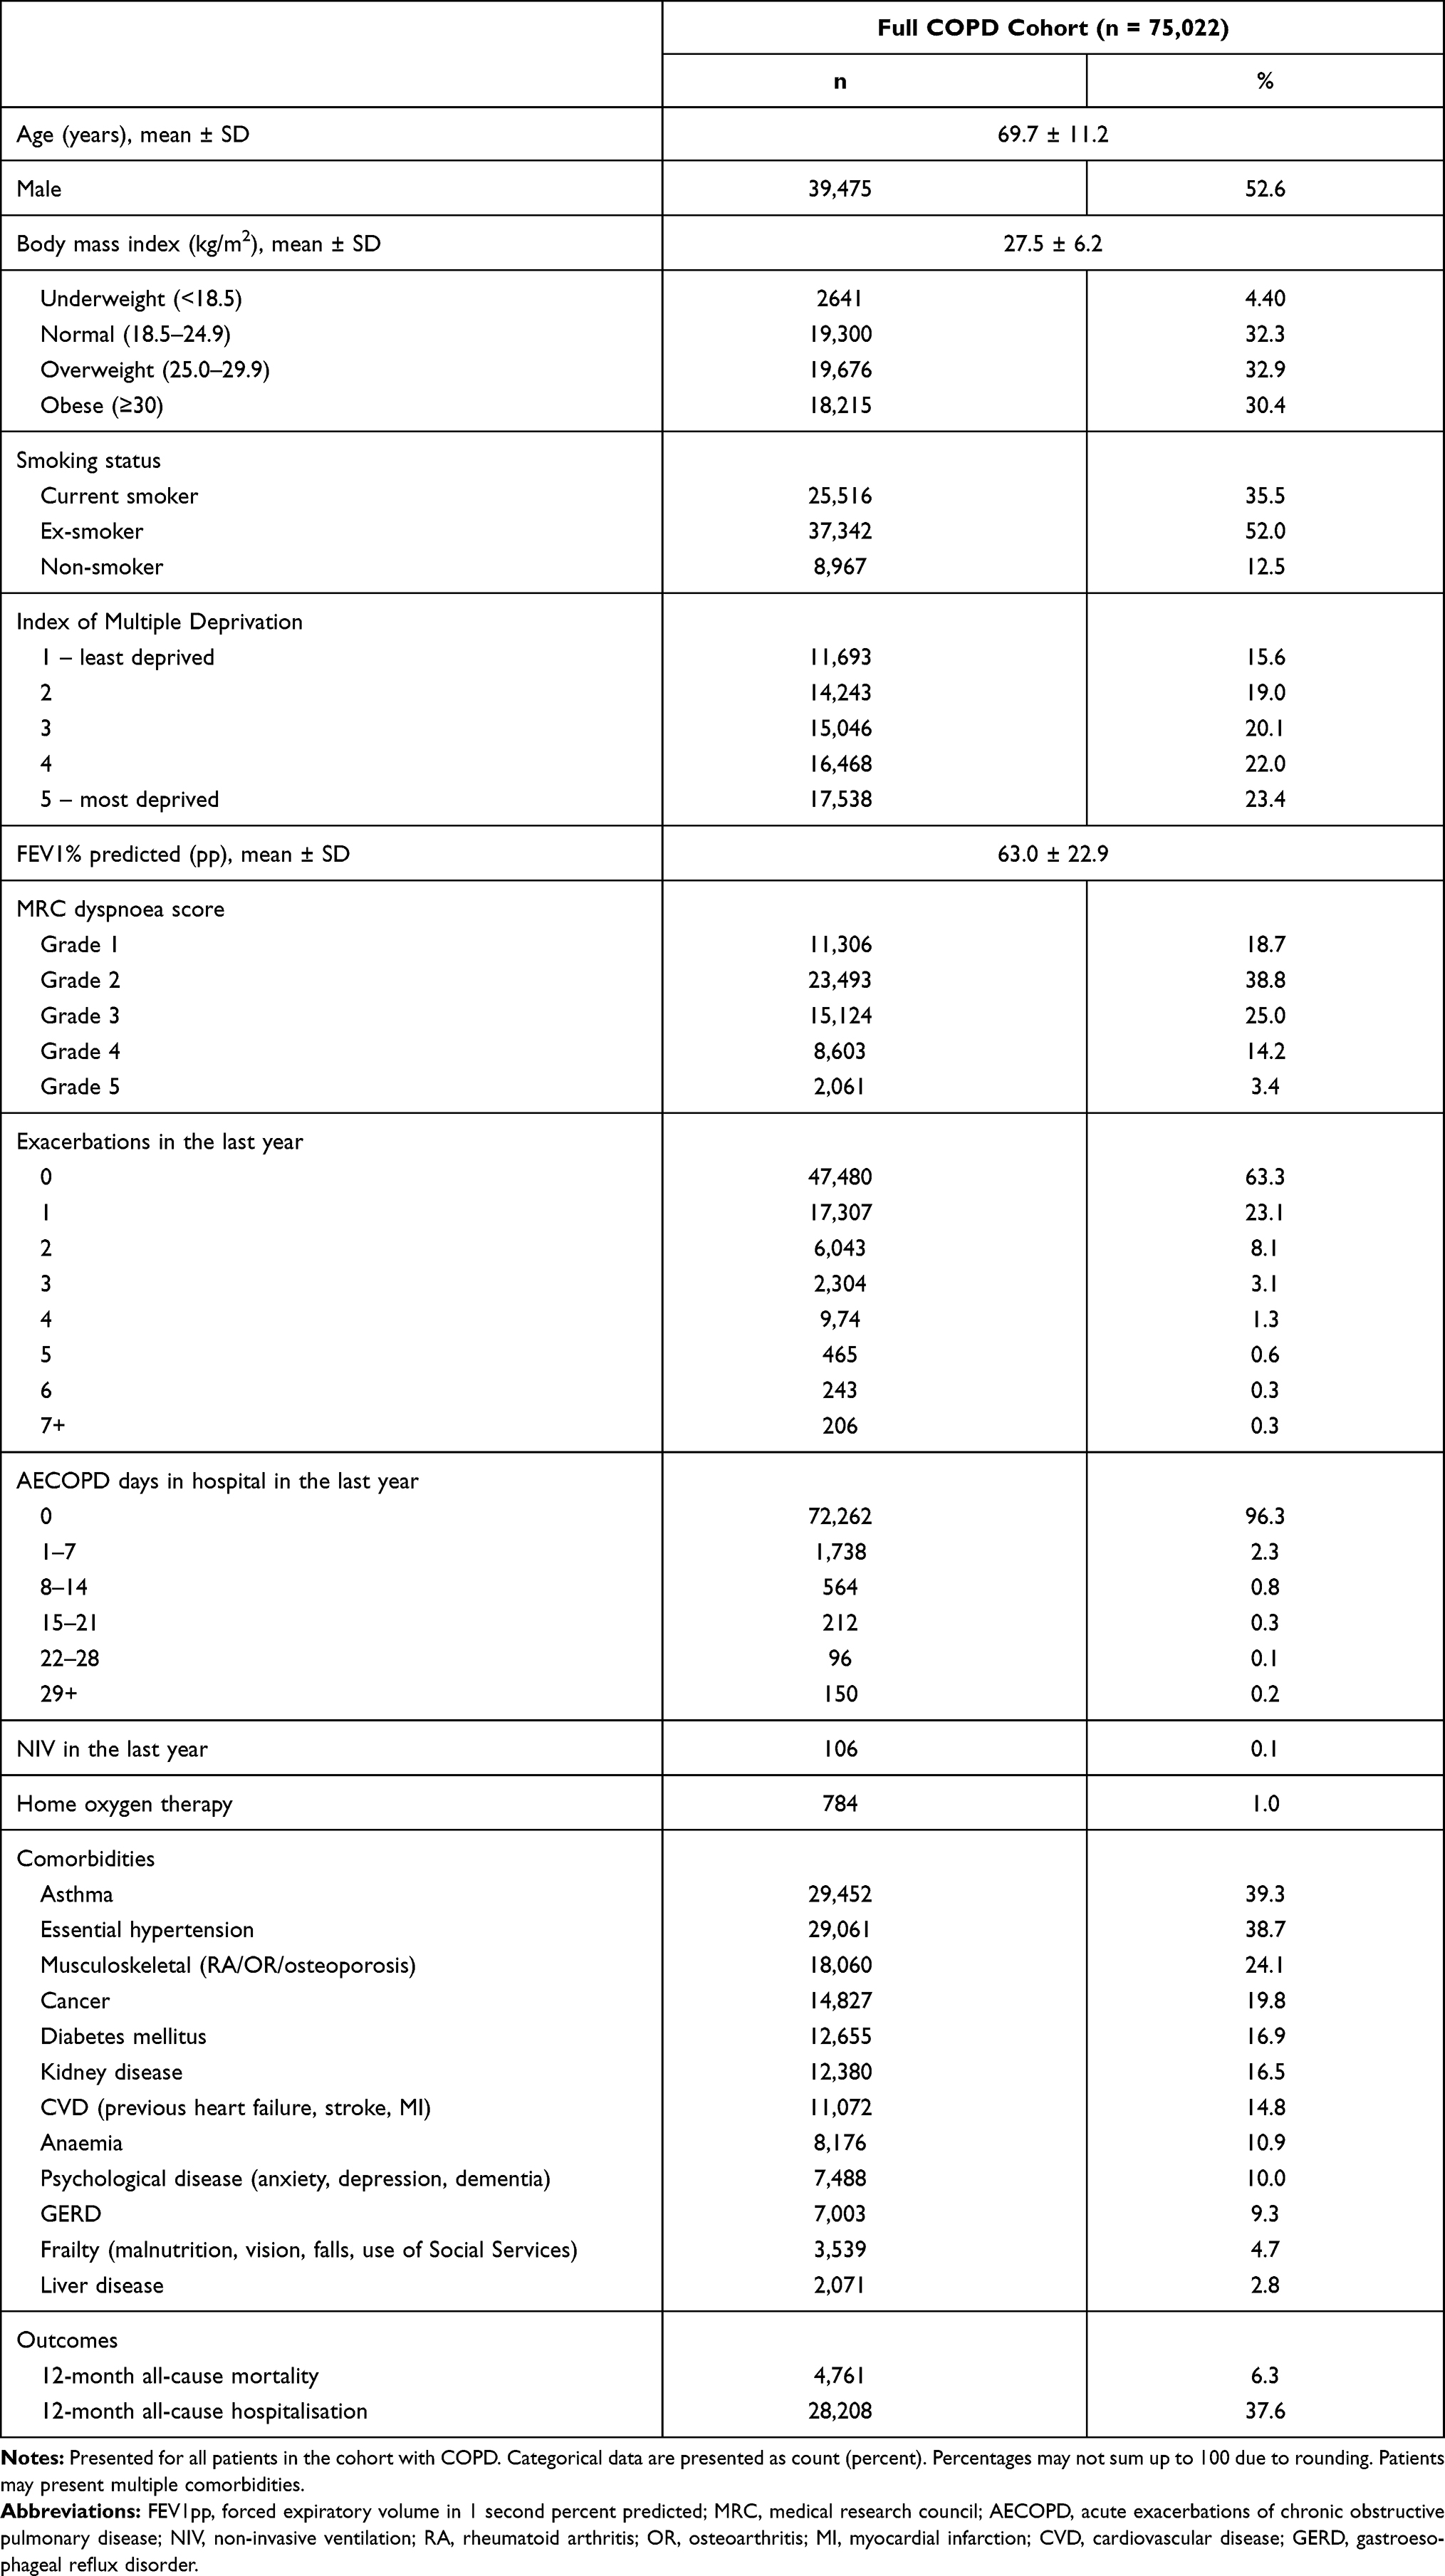 |
Table 2 Descriptive Statistics of Patient Cohort with COPD |
 |
Table 3 Mortality and Hospitalisation Group Comparisons |
 |
Figure 3 Flow chart of patient inclusion and exclusion. Medcode diagnoses16 were applied to the CPRD population to identify those with COPD during the time interval (n = 184,724). The filtering process of the patient data where cases missing essential links to HES, ONS and IMD were excluded, as were those without a COPD diagnosis or less than a year of GP consultation history. Finally, patients missing three or more key variables of FEV1pp, MRC, haemoglobin and eosinophil were removed. The lower part of the figure shows data censoring of patients that had <12 months follow-up and no outcome of hospitalisation or mortality, and randomisation prior to modelling. |
Table 3 provides mortality and hospitalisation comparisons within 12-months of COPD diagnosis. The four most prevalent comorbidities among those who died within 12-months were hypertension (56%), CVD (54%), asthma (38%) and cancer (33%). Of three-way interactions, the most prevalent was (hypertension, asthma, musculoskeletal, n = 4795, 12-month all-cause mortality = 10%) but (hypertension, kidney disease, musculoskeletal, n = 3,745, 12-month all-cause mortality = 21%) predicted the highest mortality.
Regression Methods for Mortality (M) and Hospitalisation (H)
Figure 4 and Table 4 compares AUC statistics between the LR models tested (full model details for regression output can be seen in Supplementary Appendix S7). AUCs and 95% CIs for all the models are summarised here and also provided in tabular form in the supporting information (Supplementary Appendix S7).
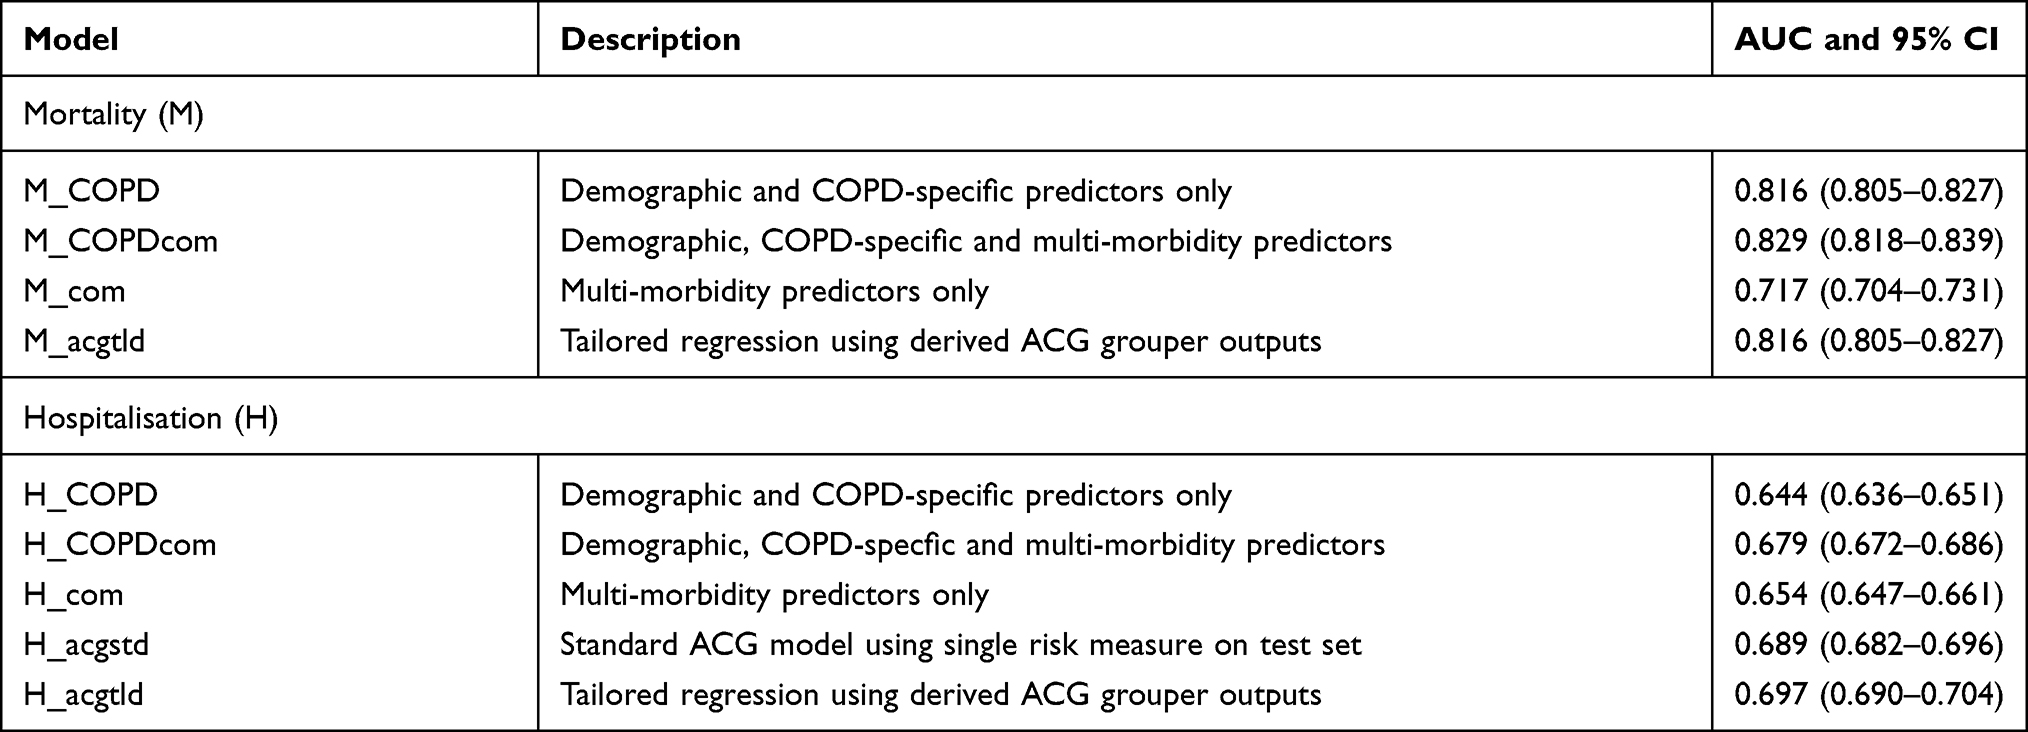 |
Table 4 ROC AUC Characteristics for Mortality (M) and Hospitalisation (H) |
 |
Figure 4 Model comparison. A graphical comparison of model classification on test cohort using the area under receiver operating characteristic (ROC) with 95% confidence intervals. x-Axis states which model has been used (see details below); y-axis identifies AUC (95% CI). Twelve-month all-cause mortality models, blue; 12-month all-cause hospitalisation predictors, red; ACG predictors, green. Abbreviations: M_COPD, mortality (disease specific); M_COPDcom, mortality (disease specific plus comorbidities); M_com, mortality (comorbidities only); M_acgltd, mortality (ACG-tailored regression); H_COPD, hospitalisation (disease specific); H_COPDcom, hospitalisation (disease specific plus comorbidities); H_com, hospitalisation (comorbidities only); H_acgstd, hospitalisation (ACG standard model); H_acgtld, hospitalisation (ACG-tailored regression). |
ROC areas under curve with 95% confidence intervals for all mortality and hospitalisation models (see Figure 4).
Mortality (M). The M_COPD model performed well in comparison to M_com. The combination of multi-morbidity and COPD-specific/demographic predictors (M_COPDcom) resulted in comparable risk prediction to that of COPD-specific/demographic factors alone (see Table 4 and Figure 4). CVD, hypertension, diabetes, liver and kidney disease, asthma, anaemia, psychological disorder frailty, cancer and GERD all had p-values under the significance threshold of 0.05, deeming them compatible between the data and entire model in the univariate analysis due to differences from the hypothesis prediction,23 but not musculoskeletal disorders. The tailored ACG regression-based mortality model (M_acgtld) was comparable to both the model using only demographic and COPD-specific predictors (M_COPD) and also the model combining COPD-specific and multi-morbidity predictors (M_COPDcom).
Hospitalisation (H). AUCs for hospitalisation prediction models were broadly lower than those for mortality. In contrast to mortality, the AUC for the model incorporating COPD-specific/demographic predictors (H_COPD) was lower than the model using multi-morbidity predictors only (H_com). Combining both the COPD-specific predictors and multi-morbidity predictors (H_COPDcom) resulted in improved prediction performance. For hospitalisation, the standard ACG regression model (H_acgstd) achieved an AUC higher than the combined COPD-specific and multi-morbidity-based prediction model (H_COPDcom), although the CIs overlap. The tailored ACG model (H_acgtld) performed comparably to the standard ACG model.
Survival Analysis
The Cox regression proportional hazards model (see Supplementary Appendix S7) were analogous to LR, containing almost all key predictors but with the addition of IMD for hospitalisation prediction. Multi-morbidity were valid predictors for hospitalisation but not musculoskeletal disorder for mortality. Differences between survival curves were more pronounced for mortality, then hospitalisation and S-curves are convex for mortality and concave for hospitalisation (see Supplementary Appendix S7) reflecting the comparatively longer-term nature of mortality compared to hospitalisation.
Discussion
This study demonstrates that the performance of risk stratification models for patients with COPD managed in primary care differs depending on the outcome in question (hospitalisation or mortality) and whether disease-specific characteristics or patterns of multi-morbidity are included as predictor variables. We show that LR models broadly performed better in predicting mortality than hospitalisation and that the incorporation of categorised multi-morbidity indices to such models did not enhance prediction performance. However, the ACG-tailored regression model (which incorporates the full range of derived grouper outputs from the algorithm (see Supplementary Appendix S1 and S7) performed comparably to the COPD-specific model in predicting mortality, suggesting that a more comprehensive incorporation of Read coded and other clinical data may assist with risk stratification. Overall predictive performance was lower for hospitalisation, but in contrast to mortality models, multi-morbidity-based models performed at least as well as COPD-specific models and the best prediction performance was provided by the tailored ACG regression model (see Supplementary Appendix S7).
Our observation of overall better prediction performance for mortality likely reflects the primacy of biological/pathophysiological factors predicting death. Our findings suggest that for mortality prediction, the severity of the reference condition (COPD) is a key indicator, as the addition of clinically important and prevalent multi-morbidity did not further enhance predictive power. However, the regression model including derived grouper outputs from the ACG grouper algorithm (see Supplementary Appendix S7) performed comparably to our disease-specific model in predicting mortality. ACG does not incorporate indices of individual disease severity, for example FEV1 or MRC score, but would have included ICD-codes that are surrogates for severity, for example the presence of respiratory failure if recorded and drug prescription data, and this might explain its enhanced performance. We categorised Read-coded multi-morbidity in conventional disease groupings (based on previous literature; see Table 1 and Supplementary Appendix S3) for the purposes of LR and this might have not detected the influence of rarer multi-morbidity that have an important impact and might have been represented in the ACG-tailored model. The pattern of multi-morbidity may also have an influence.
Our data suggests that hospitalisation is less easy to predict, presumably because hospital admission is influenced by a number of factors which may not be recorded in primary care records, for example social circumstances, family support and accessibility of local health care services. For hospitalisation, multi-morbidity regression models performed comparably to demographic and COPD-specific models. Combining morbidity and disease-specific factors enhanced prediction performance and the tailored ACG, which offers the most sophisticated model incorporating a range of ACG grouper outputs provided a further, modest improvement.
COPD varies widely in clinical phenotype and disease severity, and there is a body of literature investigating whether these characteristics have prognostic value for hospitalisation or mortality. The patient populations in which these proposed prognostic models have been validated have variously been drawn from research cohorts, acute and secondary care services and primary care.3,5,24 Likewise, the clinical measurements/characteristics incorporated into prognostic models has varied, often in relation to the setting and purposes for which data were originally collected. Initial prognostic scores such as the BODE (body mass index, FEV1, dyspnoea, and exercise capacity) index focused on an assessment of COPD severity to predict outcomes of all-cause mortality.3 More recently, evidence for the importance of multi-morbidity in COPD has accumulated and subsequent studies have suggested the number and pattern of comorbid conditions (categorised according to perceived clinical relevance) has a significant influence on clinical outcome.7,19,20,21 However, validated comorbidity risk prediction scores applicable to COPD populations (particularly those managed in primary care) are lacking and indeed the Charlson index, a risk score designed and validated 30 years ago is often cited to summarise the burden of multi-morbidity in COPD cohorts.25 To date, comparisons of risk prediction models including indices of the burden of multi-morbidity compared with disease severity in COPD have been limited. The CODEX index that includes comorbidity has been shown to improve model performance over and above other prediction models including ADO, DOSE and BODE using CPRD primary care data.20 The BARC (blood results (B), age (A), respiratory variables (airflow obstruction, exacerbations, smoking) (R) and comorbidities (C)) prediction model was also validated and derived within a CPRD population and has shown to perform better than previously published prediction scores without comorbidities.24 By contrast, our data suggest there is a differential influence of multi-morbidity and disease severity in predicting 12-month all-cause mortality and hospitalisation when a broader assessment of disease severity and comorbidity burden is incorporated than such previously reported risk scores. Importantly, we have demonstrated this differential effect using routinely collected primary care data in a cohort representative of clinical practice in the UK. Our comparison of performance of ACG regression models with our own models also highlights that the methodology used to group, count and incorporate multi-morbidity clusters into regression models may have an important impact on prediction performance.
We recognise limitations to the interpretation of our findings. In keeping with other studies using routinely collected data in primary care, missing data from the primary care record and outcome linkage was frequent (see Supplementary Appendix S4). However, we have used robust and consistent methods to manage missingness, including censoring cases where the proportion of missing data was too high and using multiple imputation. Likewise, clinically coded data in primary care in the UK is known to be subject to measurement and recording error, and we recognise that the indices included in our prognostic model are representations of the patient characteristics in the clinical record rather than confirmed clinical findings for each individual. For example, a significant proportion (around 40%) of patients in our COPD cohort were also coded for asthma. This might represent genuine clinical overlap between these conditions or misdiagnosis. However, such inaccuracy is likely to apply across the analysis and is therefore unlikely to detract from the comparison of risk stratification methodologies we have undertaken. As our findings specifically refer to 12-month all-cause mortality and hospitalisation, it cannot be assumed that longer-term outcomes would be predicted in the same patterns. While we included age in our predictive models, we recognise that differences might exist in the performance of such models (in particular the impact of multi-morbidity) in different age strata.
Increasing attention is being directed to the stratification of clinical populations based on future health risk in order to identify populations at risk of adverse outcomes to plan services and therapeutic interventions accordingly. It is recognised that the identification and management of multi-morbidity presents a challenge to health care service provision because of the disease focused organisation of most healthcare systems. Our findings demonstrate a differential impact of multi-morbidity and disease severity on the performance of risk profiling methodologies in a long-term condition such as COPD and indicate that the relative importance of multi-morbidity and disease severity will depend on the health outcome in question. The use of complex multi-morbidity based risk profiling methodologies such as ACG in combination with disease severity indices may assist in the prediction of healthcare utilisation. Although our findings principally have implications at a population level, understanding future health risk in relation to disease severity and multimorbidity may directly enhance patient care through better identification and prioritisation of present and future health needs for individuals with COPD based on clinical characteristics. The prognostic importance of disease and multi-morbidity indices highlights the importance of accurate coding of such clinical characteristics during routine clinical practice. If applicable to other long-term conditions, our findings have the potential to enhance the ability of health systems to understand clinical risk for the populations they serve and thereby plan primary, acute and community services accordingly for people with COPD and chronic diseases.
Transparency Statement
The lead authors (DG and UK) affirm this manuscript is an honest, accurate, and transparent account of the study being reported; that no important aspects of the study have been omitted; and that any discrepancies from the study as originally planned (and, if relevant, registered) have been explained.
Data Sharing Statement
Data are available on request from the Clinical Practice Research Datalink (CPRD). All data accessed complies with relevant data protection and privacy regulations. Their provision requires the purchase of a license and our license does not permit us to make them publicly available to all. We used data from the version collected in January 2018 and have clearly specified the data selected in our Methods section. To allow identical data to be obtained by others, via the purchase of a license, we will provide the code lists on request. Licences are available from the CPRD (http://www.cprd.com): The Clinical Practice Research Datalink Group, The Medicines and Healthcare products Regulatory Agency, 10 South Colonnade, Canary Wharf, London E14 4PU.
Author Contributions
All authors made substantial contributions to conception and design, acquisition of data, or analysis and interpretation of data; took part in drafting the article or revising it critically for important intellectual content; agreed to submit to the current journal; gave final approval of the version to be published; and agree to be accountable for all aspects of the work. David Groves and Urvee Karsanji are co-first authors.
Funding
This work was funded by the National Institute for Health Research (NIHR) Applied Research Collaboration East Midlands (CLAHRC EM) and supported by NIHR Applied Research Collaboration East Midlands (ARC EM) and the Leicester Real World Evidence Unit. The views expressed are those of the author(s) and not necessarily those of the NIHR or the Department of Health and Social Care.
Disclosure
JB and SS report personal fees from Johns Hopkins Health Solutions, outside the submitted work; JKQ reports grants and personal fees from AstraZeneca, grants and personal fees from Bayer, grants from Boehringer Ingelheim, grants from Chiesi, grants from Asthma UK, grants and personal fees from GSK, grants from MRC, grants from The Health Foundation, outside the submitted work; MS reports personal fees from GSK, non-financial support from Boehringer Ingelheim, outside the submitted work; NG reports grants, personal fees and non-financial support from GlaxoSmithKline, personal fees and non-financial support from Chiesi, personal fees and non-financial support from Boehringer Ingelheim, personal fees from AstraZeneca, outside the submitted work; RAE reports grants from CLARHC, during the conduct of the study; personal fees from Chiesi, personal fees from GSK, personal fees from TEVA, personal fees from BMJ, outside the submitted work.
The authors report no other conflicts of interest in this work.
References
1. Vogelmeier CF, Criner GJ, Martinez FJ, et al. Erratum to “Global Strategy for the Diagnosis, Management, and Prevention of Chronic Obstructive Lung Disease 2017 Report: GOLD Executive Summary” [Arch Bronconeumol. 2017;53:128-49]. Arch Bronconeumol. 2017;53(7):411–412. doi:10.1016/j.arbres.2017.06.001
2. Matheson MC, Bowatte G, Perret JL, et al. Prediction models for the development of COPD: a systematic review. Int J Chron Obstruct Pulmon Dis. 2018;13:1927–1935. doi:10.2147/COPD.S155675
3. Celli BR, Cote CG, Marin JM, et al. The body-mass index, airflow obstruction, dyspnea, and exercise capacity index in chronic obstructive pulmonary disease. N Engl J Med. 2004;350(10):1005–1012. doi:10.1056/NEJMoa021322
4. Puhan MA, Garcia-Aymerich J, Frey M, et al. Expansion of the prognostic assessment of patients with chronic obstructive pulmonary disease: the updated BODE index and the ADO index. Lancet. 2009;374(9691):704–711. doi:10.1016/S0140-6736(09)61301-5
5. Jones RC, Donaldson GC, Chavannes NH, et al. Derivation and validation of a composite index of severity in chronic obstructive pulmonary disease: the DOSE Index. Am J Respir Crit Care Med. 2009;180(12):1189–1195. doi:10.1164/rccm.200902-0271OC
6. Charlson ME, Pompei P, Ales KL, MacKenzie CR. A new method of classifying prognostic comorbidity in longitudinal studies: development and validation. J Chronic Dis. 1987;40(5):373–383. doi:10.1016/0021-9681(87)90171-8
7. Divo M, Cote C, de Torres JP, et al. Comorbidities and risk of mortality in patients with chronic obstructive pulmonary disease. Am J Respir Crit Care Med. 2012;186(2):155–161. doi:10.1164/rccm.201201-0034OC
8. National Institute for Health and Care Excellence (NICE). Multimorbidity: clinical assessment and management; 2016. NICE guideline [NG56].
9. World Health Organisation. Multimorbidity: technical Series on Safer Primary Care; 2016.
10. Austin PC, van Walraven C, Wodchis WP, Newman A, Anderson GM. Using the Johns Hopkins Aggregated Diagnosis Groups (ADGs) to predict mortality in a general adult population cohort in Ontario, Canada. Med Care. 2011;49(10):932–939. doi:10.1097/MLR.0b013e318215d5e2
11. Salisbury C, Johnson L, Purdy S, Valderas JM, Montgomery AA. Epidemiology and impact of multimorbidity in primary care: a retrospective cohort study. Br J Gen Pract. 2011;61(582):e12–21. doi:10.3399/bjgp11X548929
12. Ahnfeldt-Mollerup P, Lykkegaard J, Halling A, Olsen KR, Kristensen T. Resource allocation and the burden of co-morbidities among patients diagnosed with chronic obstructive pulmonary disease: an observational cohort study from Danish general practice. BMC Health Serv Res. 2016;16(1):121. doi:10.1186/s12913-016-1371-0
13. Kaszuba E, Odeberg H, Rastam L, Halling A. Impact of heart failure and other comorbidities on mortality in patients with chronic obstructive pulmonary disease: a register-based, prospective cohort study. BMC Fam Pract. 2018;19(1):178. doi:10.1186/s12875-018-0865-8
14. Kousoulis AA, Rafi I, de Lusignan S. The CPRD and the RCGP: building on research success by enhancing benefits for patients and practices. Br J Gen Pract. 2015;65(631):54–55. doi:10.3399/bjgp15X683353
15. Herrett E, Gallagher AM, Bhaskaran K, et al. Data Resource Profile: clinical Practice Research Datalink (CPRD). Int J Epidemiol. 2015;44(3):827–836. doi:10.1093/ije/dyv098
16. Quint JK, Mullerova H, DiSantostefano RL, et al. Validation of chronic obstructive pulmonary disease recording in the Clinical Practice Research Datalink (CPRD-GOLD). BMJ Open. 2014;4(7):e005540–e. doi:10.1136/bmjopen-2014-005540
17. Devis T, Rooney C. Death certification and the epidemiologist. Health Stat Q. 1999;1:21–33.
18. Rothnie KJ, Mullerova H, Hurst JR, et al. Validation of the recording of acute exacerbations of COPD in UK primary care electronic healthcare records. PLoS One. 2016;11(3):e0151357–e. doi:10.1371/journal.pone.0151357
19. Negewo NA, Gibson PG, McDonald VM. COPD and its comorbidities: impact, measurement and mechanisms. Respirology. 2015;20(8):1160–1171. doi:10.1111/resp.12642
20. Almagro P, Soriano JB, Cabrera FJ, et al. Short- and medium-term prognosis in patients hospitalized for COPD exacerbation: the CODEX index. Chest. 2014;145(5):972–980. doi:10.1378/chest.13-1328
21. Frei A, Muggensturm P, Putcha N, et al. Five comorbidities reflected the health status in patients with chronic obstructive pulmonary disease: the newly developed COMCOLD index. J Clin Epidemiol. 2014;67(8):904–911. doi:10.1016/j.jclinepi.2014.03.005
22. Starfield B, Weiner J, Mumford L, Steinwachs D. Ambulatory care groups: a categorization of diagnoses for research and management. Health Serv Res. 1991;26(1):53–74.
23. Greenland S, Senn SJ, Rothman KJ, et al. Statistical tests, P values, confidence intervals, and power: a guide to misinterpretations. Eur J Epidemiol. 2016;31(4):337–350. doi:10.1007/s10654-016-0149-3
24. Bloom CI, Ricciardi F, Smeeth L, Stone P, Quint JK. Predicting COPD 1-year mortality using prognostic predictors routinely measured in primary care. BMC Med. 2019;17(1):73. doi:10.1186/s12916-019-1310-0
25. Echave-Sustaeta JM, Comeche Casanova L, Cosio BG, Soler-Cataluña JJ, Garcia-Lujan R, Ribera X. Comorbidity in chronic obstructive pulmonary disease. Related to disease severity? Int J Chron Obstruct Pulmon Dis. 2014;9:1307–1314. doi:10.2147/COPD.S71849
 © 2021 The Author(s). This work is published and licensed by Dove Medical Press Limited. The
full terms of this license are available at https://www.dovepress.com/terms
and incorporate the Creative Commons Attribution
- Non Commercial (unported, 3.0) License.
By accessing the work you hereby accept the Terms. Non-commercial uses of the work are permitted
without any further permission from Dove Medical Press Limited, provided the work is properly
attributed. For permission for commercial use of this work, please see paragraphs 4.2 and 5 of our Terms.
© 2021 The Author(s). This work is published and licensed by Dove Medical Press Limited. The
full terms of this license are available at https://www.dovepress.com/terms
and incorporate the Creative Commons Attribution
- Non Commercial (unported, 3.0) License.
By accessing the work you hereby accept the Terms. Non-commercial uses of the work are permitted
without any further permission from Dove Medical Press Limited, provided the work is properly
attributed. For permission for commercial use of this work, please see paragraphs 4.2 and 5 of our Terms.