")
Back to Journals » International Journal of Nanomedicine » Volume 16
Precisely Fabricated Sulpiride-Loaded Nanolipospheres with Ameliorated Oral Bioavailability and Antidepressant Activity
Authors Mohyeldin SM , Samy WM, Ragab D, Abdelmonsif DA , Aly RG, Elgindy NA
Received 12 December 2020
Accepted for publication 28 January 2021
Published 9 March 2021 Volume 2021:16 Pages 2013—2044
DOI https://doi.org/10.2147/IJN.S296726
Checked for plagiarism Yes
Review by Single anonymous peer review
Peer reviewer comments 3
Editor who approved publication: Dr Thomas Webster
Salma M Mohyeldin,1 Wael M Samy,1 Doaa Ragab,1 Doaa A Abdelmonsif,2,3 Rania G Aly,4 Nazik A Elgindy1,5
1Department of Industrial Pharmacy, Faculty of Pharmacy, Alexandria University, Alexandria, Egypt; 2Department of Medical Biochemistry, Faculty of Medicine, Alexandria University, Alexandria, Egypt; 3Centre of Excellence for Research in Regenerative Medicine and Applications, Faculty of Medicine, Alexandria University, Alexandria, Egypt; 4Department of Surgical Pathology, Faculty of Medicine, Alexandria University, Alexandria, Egypt; 5Department of Industrial Pharmacy, College of Pharmacy, Arab Academy for Science, Technology and Maritime Transport, Alexandria, Egypt
Correspondence: Salma M Mohyeldin
Department of Industrial Pharmacy, Faculty of Pharmacy, Alexandria University, 1-Azarita Square, Alexandria, Egypt
Tel +20 1008024214
Fax +20 3 4873273
Email [email protected]
Background: Sulpiride (SUL), is a selective antidopaminergic drug that had extensive biological activities. However, its sparingly aqueous solubility and limited gastrointestinal permeability lead to scanty oral bioavailability which hinders its clinical efficacy.
Objective: SUL-loaded lipospheres (SUL-LPS) were designed to serve as an oral biocompatible nanovector for improving SUL permeability as well as conquering its low oral absorption and then in turn enhancing its antidepressant action.
Methods: SUL-LPS were fabricated via two processing techniques namely, melt emulsification and solvent evaporation. The impact of different lipid cores, phospholipid shells together with various surfactant concentrations and types on the lipospheres properties were screened. Detailed physicochemical elucidations were performed followed by ex vivo permeation appraisal using the non-everted intestine model. The pharmacokinetic parameters of SUL-LPS, free SUL and marketed product were assessed following oral administration to healthy rats. Reserpine-induced depression rat model was used to assess the antidepressant action of SUL-LPS on which full behavioural and biochemical analysis was conducted. Safety attributes of nanoencapsulated SUL on the brain and other internal organs were evaluated.
Results: The optimum LPS revealed an excellent nanosize with a narrow PdI, negative zeta potential and acceptable entrapment efficiency of 68.62 nm, 0.242, − 30.4 mV and 84.12%, respectively. SUL-LPS showed a sustained release pattern and 2.1-fold enhancement in the intestinal permeation parameters with low mucin interaction. Oral pharmacokinetic appraisal exhibited that LPS provided 3.4-fold improvement in SUL oral bioavailability together with long-circulating properties, relative to the free drug. Pharmacodynamic study confirmed the superior antidepressant action of SUL-LPS as evident by 1.6 and 1.25-fold elevation in the serotonin and dopamine expressions, respectively. Meanwhile, nanotoxicological appraisal proved the biocompatibility of SUL-LPS upon repetitive oral administration.
Conclusion: Rationally designed lipospheres hold promising in vitro and in vivo characteristics for efficient delivery of SUL with high oral bioavailability, antidepressant activity together with a good safety profile.
Keywords: sulpiride, lipospheres, ex vivo permeation, bioavailability, depression, toxicity
Corrigendum for this paper has been published.
Introduction
Depression is a life-debilitating psychiatric disorder and a main concern for global health that affects over 200 million of the worldwide population, according to the World Health Organization.1 It is frequently recognized by a persistent feeling of despair, accompanied by low mood, disturbed sleep, and psychomotor agitation or retardation.2,3 More importantly, depression is considered as one of the driving causes of suicide and homicide.3 Despite extensive attempts, the pathophysiology of depression is still complicated and poorly elucidated. Many theories are proposed to explain the basis of depression including imbalance within the serotonin, norepinephrine, dopamine, and monoaminergic neurotransmitters expression together with structural changes throughout the brain and the hypothalamus–pituitary–adrenal (HPA) axis.2,4
Sulpiride (SUL) is a known substituted benzamide derivative, with antidepressant action by preferentially blocking dopamine and serotonin receptors throughout the brain.5,6 Among different antidepressant drugs, SUL has demonstrated an enormous interest because of being non-toxic, fewer extrapyramidal side effects, lower affinity for other neuronal receptors, as well as its effective low cost.7 Unfortunately, SUL has several obstacles that must be confronted. According to the Biopharmaceutical Classification System (BCS), SUL is categorized as a class IV drug showing both poor aqueous solubility and limited intestinal permeability.8,9 Moreover, it was reported that SUL has a site-specific absorption located in the upper GIT, associated with extensive pre-systemic clearance. These obstacles, rather narrow its absorption window, leads to sporadic and highly variable absorption and low bioavailability (20–30%) following the oral administration of SUL, coupled with a relatively short half-life of 6 to 8 hours.5,10 Despite these challenges, SUL reveals a superior potency amongst the other antidepressant, hence, the development of strategies for enhancing its properties has become increasingly demanded.
Accordingly, several attempts including self microemulsfying carrier,8 microcapsules,5 solid dispersion,9 microsponges,10 and solid lipid nanoparticles11 have been conducted to overcome SUL pitfalls for oral administration, but with limited outcomes as theses attempts mainly addressed the issue of poor aqueous solubility. Hence, other platforms are needed to alleviate the oral delivery challenges and to enhance the pharmacological efficacy of SUL.
Lipid-based nanovectors have grabbed a great concern due to mimicking biological components with high biocompatibility and lower toxicity.12,13 Lipospheres (LPS) are one of the nanolipoidal platforms, which are composed of a solid hydrophobic lipid core surrounded by one or more phospholipid layers, embedded on their surface as mono or bilayers shell after rehydration with the aqueous medium.14 Structurally, they have been employed to synergize the properties of both solid lipid nanoparticles and liposomes. By their hydrophobic core, LPS possess a higher encapsulation efficiency with a controlled release of poorly soluble drugs, resembling solid lipid nanoparticles. Besides, their phospholipid shell arranged as bilayers, looking like liposomes, can enhance the solubility, permeability, release profile, as well as the bioavailability of hydrophobic drugs.14,15 Such a phospholipid shell covering the lipid core is also revealed to grant high colloidal stability during long-term storage.16 Hence, LPS can be considered as a promising nanoplatform gathering the privileges of both liposomes and solid lipid nanoparticles.
In the view of the aforementioned background, the current appraisal sheds light on elaborating a novel SUL-loaded lipospheres (SUL-LPS), aiming to improve intestinal permeability, oral absorption of SUL, and hence its antidepressant action while using less daily dose. To achieve such goals, SUL-LPS were prepared via a simple processing method with several preparative variables being investigated in order to control and optimize the process. Full physicochemical characterization of the prepared LPS was performed together with ex vivo intestinal permeation and in vivo oral pharmacokinetic attempts. Also, the reserpine-induced depression mimic rat model was conducted to provide supporting evidence for better-acting antidepressant therapy using our designed nanovectors. Eventually, the in vivo nanotoxicological attempt was performed to assess the safety attributes of LPS on the brain and other internal organs. To the best of our knowledge, this study is the first to elaborate and load SUL into biocompatible LPS for boosting its oral delivery and antidepressant activity.
Materials and Methods
Materials
Sulpiride (SUL) was kindly provided by Delta Pharm. Co., Egypt. Glyceryl monostearate (Geleol® TM), glyceryl palmitostearate (Precirol® ATO5, GPS), glyceryl dibehenate (Compritol®), stearoyl polyoxylglycerides (Gelucire 50/13, GEL) and glycol stearate (Tefose®63) were received from Gattefossé (Saint Priest, France). Glyceryl tristearate (Dynasan®118) was obtained as a kind gift by IOI Oleo Gmbh (Hamburg, Germany). Lipoid S75 (soybean phospholipid with 70% phosphatidylcholine, LS75), lipoid S100 (soybean phospholipid with 100% phosphatidylcholine, LS100), and phospholipon 90H (hydrogenated phosphatidylcholine, P90H) were generously supplied by Lipoid Co. (Ludwigshafen, Germany). Tween 80 (T80), polyvinyl alcohol (PVA), poloxamer 188 (PLX 188), poloxamer 407 (PLX 407) were purchased from Sigma Aldrich, (St. Louis, MO, USA). Mucin was obtained from the porcine stomach (Type III, bound sialic acid 0.5%–1.5%, partially purified powder) and was purchased from Sigma Aldrich, (St. Louis, MO, USA). Reserpine was purchased from Acros Organic (New Jersey, USA). Thiobarbituric acid (TBA), trichloracetic acid, Griess reagent, Ellman’s reagent [5,5′-dithiobis-(2-nitrobenzoic acid)], protease inhibitor cocktail, and bicinchoninic acid (BCA) protein quantitation kit were purchased from Sigma-Aldrich (St Louis, MO, USA). Caspase-3 colorimetric assay kit and tumor necrosis factor-α (TNF-α) immunoassay kit were obtained from R&D Systems Inc., Wiesbaden-Nordenstadt, Germany. Alanine aminotransferase (ALT), aspartate aminotransferase (AST), and creatinine assay kits were bought from Spectrum (Hannover, Germany). Urea assay kit was purchased from Diamond Diagnostics (Hannover, Germany). Dopamine ELISA kit was purchased from MyBioSource (MyBioSource, Inc., CA, USA) and the serotonin ELISA kit was purchased from Abcam (Abcam, Inc., MA, USA). All other chemicals and reagents used were of analytical grade.
Methods
HPLC Assay
A validated HPLC assay was performed for quantifying the concentration of SUL as reported by Kim et al,5 with slight modifications. In a brief, an isocratic eluent, consisting of 0.1% phosphoric acid, methanol, and acetonitrile (80:10:10, v/v), was utilized and eluted at a flow rate of 0.8 mL/min. A sample of 20 μL was injected into the HPLC system equipped with a photodiode array detector (Agilent 1200 series, France) and SUL was detected at a wavelength of 292 nm. The chromatographic separation was carried out using a reversed-phase C18 column (Agilent 5HC-C18, 250 x 4.6 mm).
Preparation and Optimization of SUL-Loaded Biocompatible Lipospheres
In the on-going study, two different techniques were performed for the preparation of LPS, namely, melt-emulsification and solvent evaporation methods.
Melt Emulsification Technique
The development of LPS was based on the emulsification of a mixture of lipids and the stabilizer in water as described by Esposito et al.17 The solid lipid core was molten in a thermostatically controlled water bath at a temperature ten-degrees above its melting point (80˚C). Afterward, a preheated aqueous phase (10 mL) containing the phospholipid coat and the surfactant was added to the lipid phase. Then, the mixture was emulsified using a rotor-stator homogenizer at 10,000 rpm for 10 min. followed by ultra-sonication using a probe sonicator (Sonoplus HD 3100; Germany) at a voltage of 50 watt for another 10 min. LPS were then allowed to solidify by cooling to room temperature and stored for further study.
Solvent Evaporation Technique
LPS were formulated via the solvent evaporation technique with slight modifications.18 Briefly, the lipid mixture composed of accurately weighed amounts of phospholipid coat and solid lipid core was dissolved in chloroform and methanol solvent mixture at a ratio (1:1 v/v). The mixture was incubated under moderate agitation at 40 °C for 15 min and afterward, the organic solvents were evaporated by stirring at 600 rpm and 40 °C. The deposited lipid film was melted at 80 °C and then hydrated by 10 mL of an aqueous dispersion containing an adequate amount of the stabilizer at the same temperature under magnetic stirring at 600 rpm for 10 min. To obtain a fine and homogenous emulsion of the acceptable size, the prepared dispersion underwent high shear homogenization followed by ultra-sonication as mentioned above. The final dispersion was cooled and maintained at ambient temperature for future investigation. For the preparation of SUL-LPS, SUL was added into the organic phase. Then, the following steps were done similarly as mentioned above.
For the optimization of SUL-LPS, different formulation parameters were investigated, regarding the type of lipid core, lipid coat, and surfactants, core to coat lipid ratio, surfactant concentration, and SUL loading. The impact of these variables on the resultant lipospheres properties was assayed. The composition of the screened formulations is detailed in Table 1.
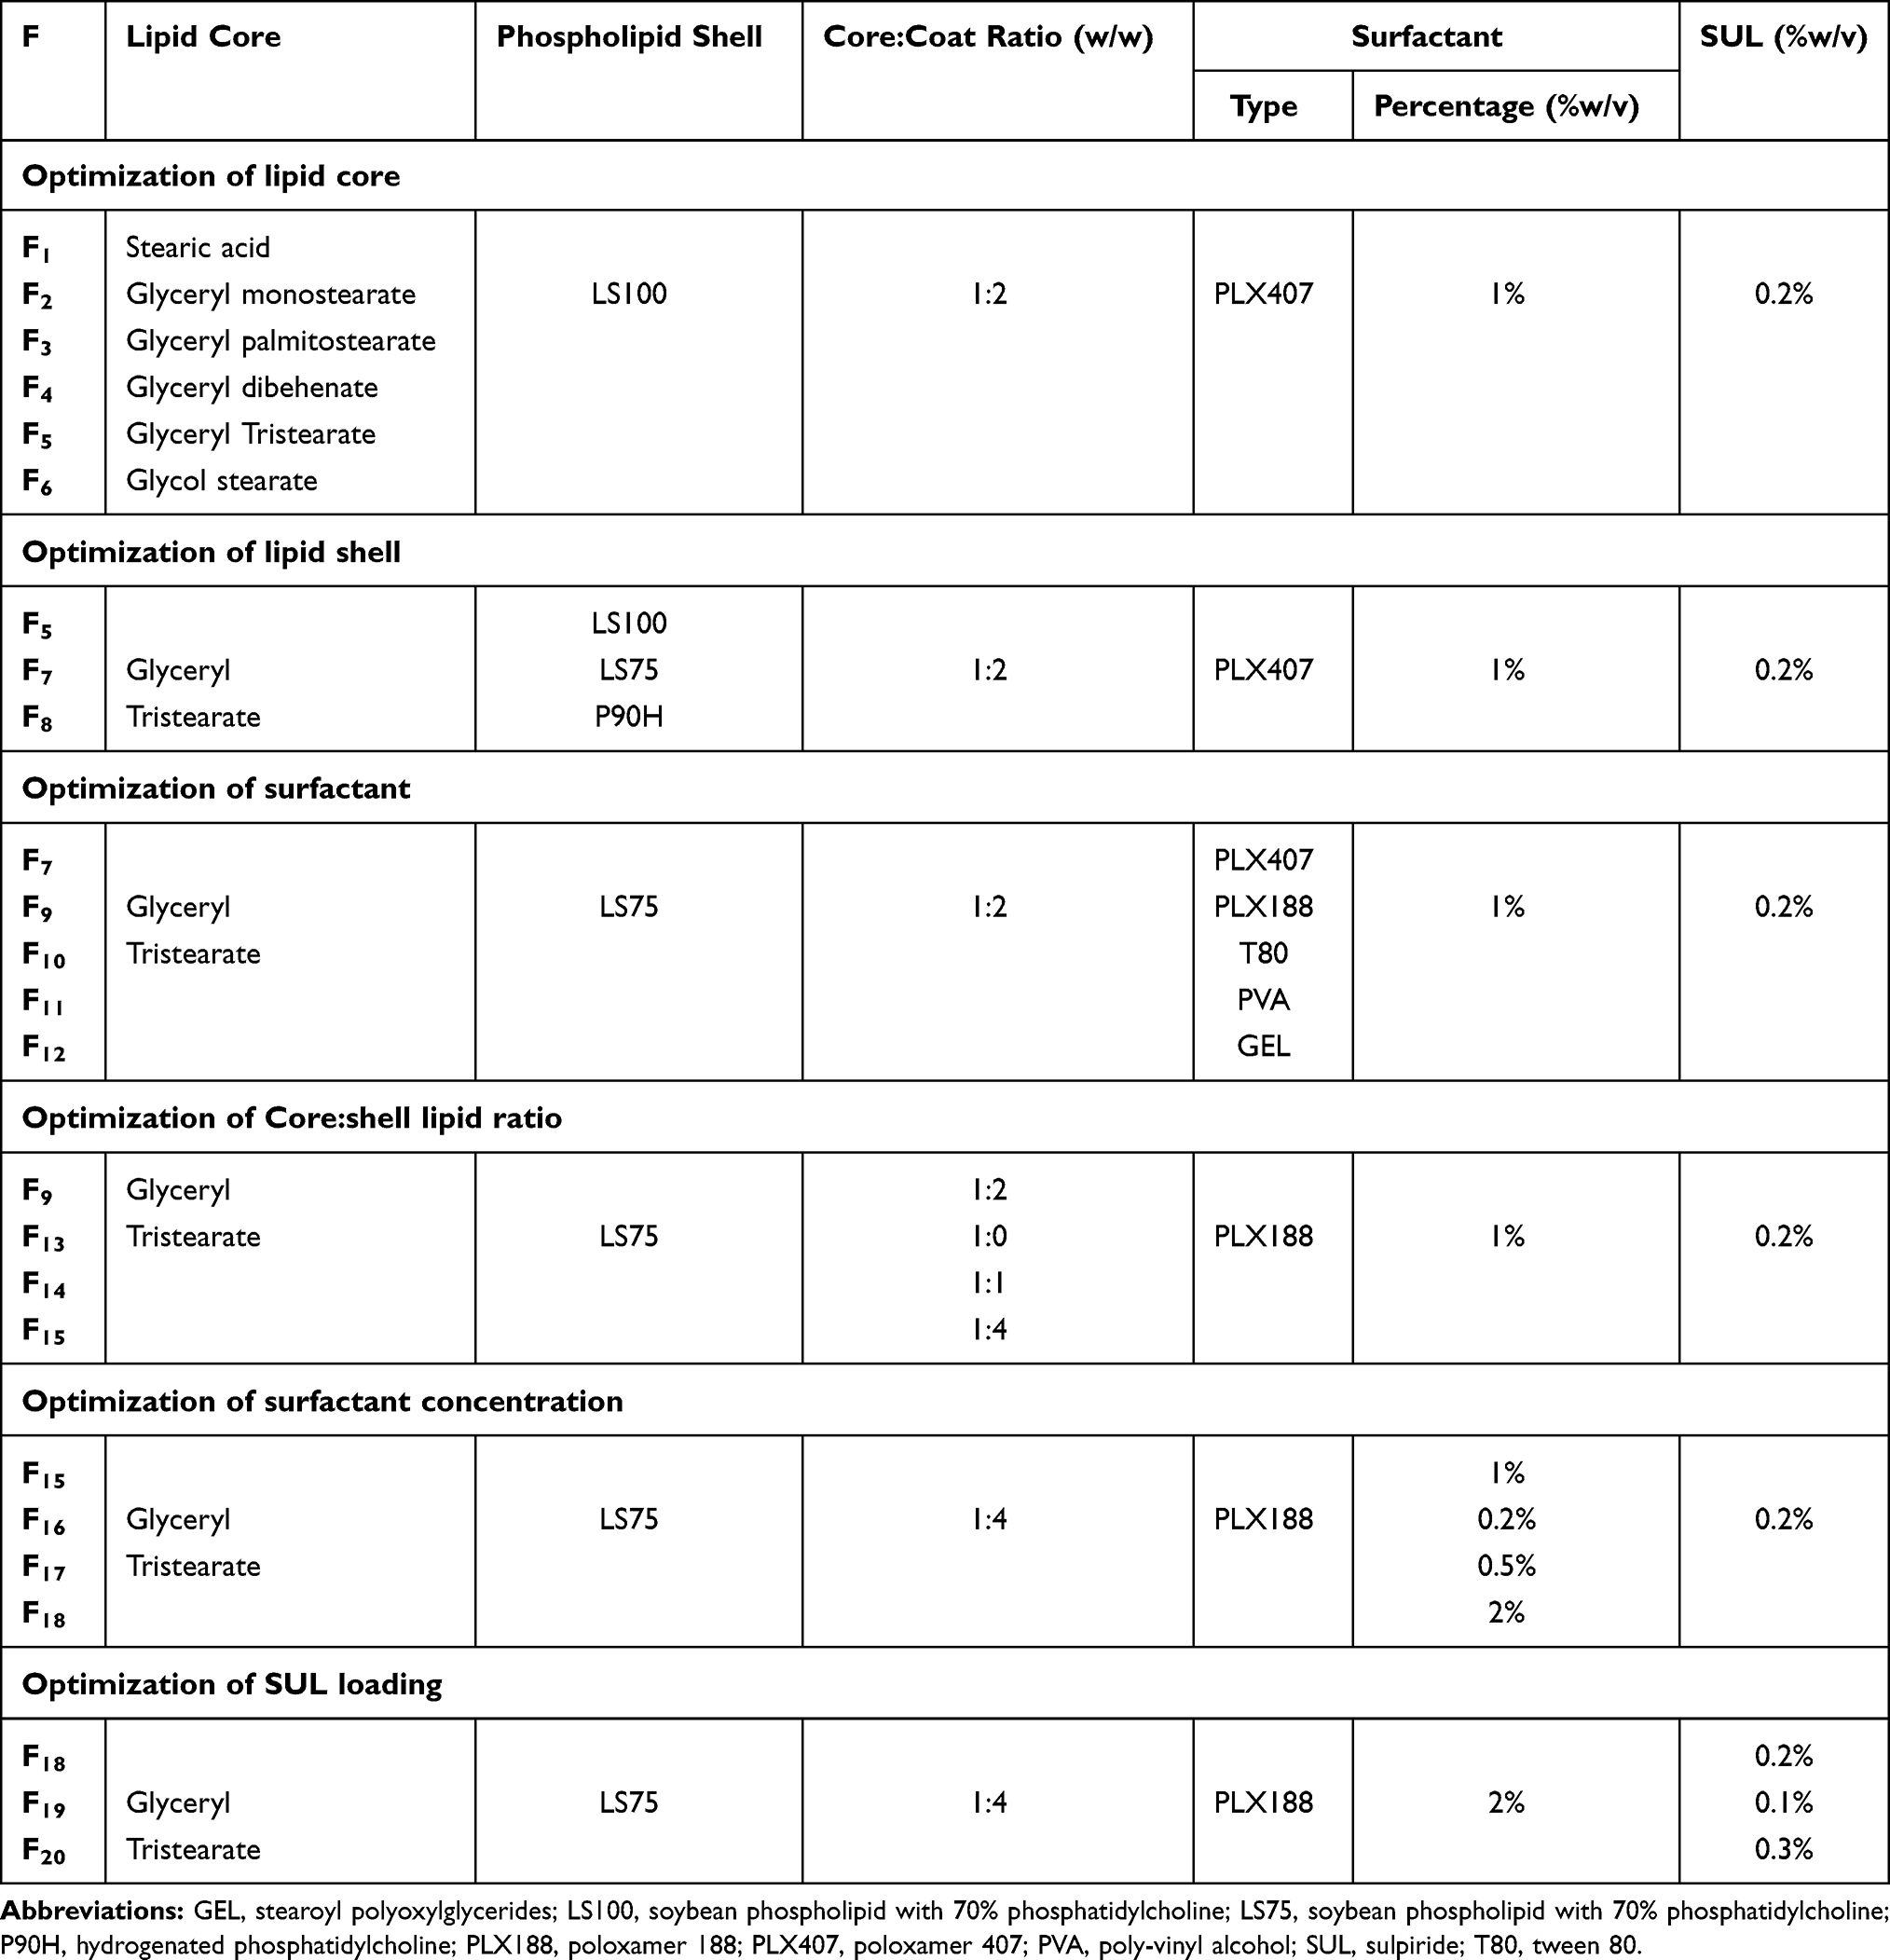 |
Table 1 Specification of Different SUL–LPS Prepared During the Optimization Attempts |
Characterization of SUL-Loaded Biocompatible Lipospheres
Assessments of Particle Size, Polydispersity Index (PdI) and Zeta Potential (ZP)
The mean globule size, polydispersity index (PdI), and zeta potential (ZP) analysis were conducted via NanoZS/ZEN3600 Zetasizer (Malvern Instruments, UK) using the photon correlation spectroscopy technique. The particle size was determined at a detection angle of 173° with the non-invasive backscattering technology. Prior to measurements, all samples were suitably diluted with distilled water to bypass the multi-scattering phenomena that resulted from a high concentration of particles.
For ZP assessments, a disposable folded capillary cell was loaded with 1 mL of each diluted LPS. The electrophoresis mobility was measured and converted into ZP values using ‘Dispersion Technology Software’ provided by the Malvern Zetasizer. Measurements were performed in triplicate at 25 ± 0.5 °C and data were recorded as mean ± SD.
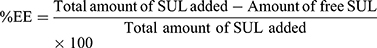
Measurements of SUL Encapsulation Efficiency (%EE)
An ultra-filtration approach was implemented to estimate the encapsulation efficiency of SUL. One mL of LPS dispersions was placed on the top of the centrifuge tube fitted with an ultrafilter (Vivaspin®6 Concentrator, 100,000 MWCO PES Membrane, Vivaproducts, Inc., USA) and centrifuged at 6000 rpm, for 30 min at room temperature. The filtrate containing un-encapsulated SUL was collected and assayed by HPLC at 292 nm as mentioned before. The percentage of encapsulation efficiency was calculated indirectly using the following equation:
In vitro Release Study
In order to maintain sink conditions, the solubility study of SUL in both 0.1M HCl and phosphate buffer pH 6.8 was performed as stated in the supplementary material “Methods” section. The membrane diffusion technique was applied to investigate the release profile of SUL from the different LPS dispersions compared with the pure drug. An adequate amount of LPS, equivalent to 20 mg of SUL was sealed in a cellulose ester dialysis tube (Visking R, 24 mm, MWCO 12,000–14,000, USA) and suspended in 75 mL of simulated gastric fluid (0.1 M HCl pH 1.2) for 2 h. Then the pH of the release medium was adjusted to 6.8 by the addition of 25 mL of 0.5 M Na2HPO4 for simulating the intestinal fluid as reported by Radwan et al,19 till the end of the experiment. The release system was kept in a shaking water bath at 100 rpm and 37◦C. At appointed intervals, an amount of 3 mL sample of the releasing medium was collected and compensated with the same volume of prewarmed fresh medium. Analysis of the released SUL was carried out by the HPLC at λ max 292 nm.
The obtained release data were fitted into different models of release kinetics (zero-order, first-order, Higuchi, Weibull, and Korsmeyer–Peppas models) in order to identify the relevant release mechanism of SUL. The selection of the appropriate mathematical model was depended on the magnitude of the correlation coefficient.
In vitro Assessments of Lipospheres-Mucin Interaction
Mucin powder was dispersed in water to prepare 0.5 mg/mL solution, stirred overnight, and then centrifuged at 10,000 rpm for 10 min to get the mucin-containing supernatant. Mucin dispersion was added dropwise to the elaborated LPS in a ratio of 1:1, vortexed for 2 min and then incubated in a shaking water bath at 50 rpm and 37 ± 0.5°C.20 At predetermined time intervals, samples were collected and assessed for mucin–nanoparticles interaction.
The mucoadhesive tendency of the elaborated LPS was assessed by two in vitro appraisals. Firstly, the turbidity of the mixtures was measured by a UV spectrophotometer (PG Instruments Ltd., UK) at 650 nm and compared with that of mucin dispersion. Secondly, the samples were evaluated for alteration on their physicochemical properties (particle size and ZP) at time zero and after incubation using the dynamic light scattering technique (Malvern Instruments). The appraisals were run in triplicate and data were expressed as mean ± SD.
Ex vivo Intestinal Permeability
Ex vivo intestinal permeation appraisal was emphasized based on the non-everted intestinal sac model as earlier reported.19,21
Animal Protocol
Healthy male Sprague Dawley rats, weighing 200–250 g, were obtained from the Faculty of Pharmacy, animal house unit–Alexandria University (Alexandria, Egypt). Experiments were done according to the approval and the ethical guidelines of the Animal Care & Use Committee of Alexandria University and followed the regulations of the National Research Council’s guide for the care and use of laboratory animals (approval no ALEXU-IACUC-82). Rats were kept under controlled conditions in a well-ventilated room (25 °C, 55% air humidity) with free access to standard laboratory diet and water. Prior to the experiment day, food was hindered but an absolute entry to water was provided.
Experimental Setup
The non-everted intestinal sac model was performed based on the method reported by Ezzat et al.21 Animals were sacrificed and then; the entire small intestine was immediately excised and flushed carefully with a warm normal saline solution (0.9%w/v NaCl) using a blunt-ended syringe. Eventually, the clean intestinal sac was cut into 10 cm long segments with an internal diameter of about 3 ± 0.2 mm. The lower end of the sac was tightly tied with a surgical silk thread, loaded, via a blunt syringe, with each formulation (equivalent to 2 mg SUL) and then sealed firmly from the other end by a thread, keeping an effective sac length of 8 ± 0.5 cm for permeation. Afterward, each intestinal sac was soaked in a glass beaker containing 100 mL of Ringer solution to ensure sink condition. For simulating in vivo situation, the entire system was kept at a temperature of 37 °C in a shaking water bath operated at 100 rpm and well aerated with 5% CO2 and 95% O2 (10–15 bubble/min). At designated intervals, samples were taken and instantly compensated with an equal volume of warm Ringer solution. Samples were then filtered through 0.22 μm syringe filter (Simple pure, USA) and quantified for their SUL content by HPLC at λ max 292 nm as previously mentioned. The selectivity of the HPLC method for SUL was verified using both peak purity profile and plots.22
Permeation Data Interpretation
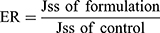
In order to investigate the ex vivo permeation profiles, data were expressed as a plot of the percentage of SUL permeated as a function of time. Jss is the steady-state flux (μg/h) and calculated from the slope of linear portion of the cumulative amount of drug (μg) permeated through the sac versus time. The apparent permeability coefficient (Papp) (cm/h) of the drug, the lag time, the time required to reach steady-state permeation, and the diffusion coefficient (D) were calculated according to Radwan et al.19
Furthermore, the enhancement ratio of SUL permeation was also calculated as follows:
Morphological Elucidation
The morphology of SUL-LPS was elucidated using the transmission electron microscope (TEM; JEM-100 CX Electron Microscope, JEOL, Japan) at a high voltage of 80 kV. One drop of freshly diluted dispersions was placed on a carbon-coated copper grid, leaving a thin film. Dispersions were subsequently stained with uranyl acetate solution for 30 s, followed by air-drying prior to imaging.
Solidification of SUL-Loaded Lipospheres
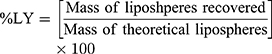
The dispersion containing 20 mg SUL was lyophilized at different concentrations of mannitol cryoprotectant (0, 2.5%, and 5%w/v) to obtain a free-flowing powder. Lyophilization was performed in a benchtop lyophilizer (Cryodos-50 lyophilizer, Telstar, Spain) at a pressure of 0.5 mbar with a shelf temperature of −50 °C for 24 h. The lyophilized samples were weighed and stored in a desiccator over CaCL2 at 25°C till further analysis. The LPS were redispersed by adding 5 mL of distilled water to the freeze-dried powders followed by vortex resuspension for 5 min. The reconstituted samples were then evaluated for particle size, zeta potential, and PdI as previously described. Moreover, the lyophilization yield (LY), the drug content (DC), and the redispersibility index (RI) were calculated as follows:
For the determination of SUL content, an accurately weighed amount of the freeze-dried powder containing theoretically 1 mg SUL was sonicated for 30 min in 5 mL methanol, the solution was filtered through 0.22 μm syringe filter (Simple pure, USA) and assayed by HPLC at λ max 292 nm.
where z-average is the corresponding value of LPS reconstituted from dried powder upon rehydration and z-average0 is the intensity-weighted mean particle diameter of the LPS prior to lyophilization measured by DLS.
Solid-State Characterization
Differential Scanning Calorimetry (DSC)
The thermal behaviour of pure SUL, glyceryl tristearate, LS75, PLX188, and SUL-LPS was assessed using a DSC-6 differential Scanning Calorimeter (PerkinElmer Inc., Waltham, MA, USA). Briefly, 5 mg of each sample was loaded into a hermetically sealed aluminum pan and then heated under a nitrogen atmosphere at a constant rate of 10°C/min, over a temperature range of 30–300 °C.
FTIR Spectroscopic Analysis
The structural analysis of pure SUL, glyceryl tristearate, LS75, PLX188, and the elaborated LPS was analyzed using FT-IR spectrometer (Perkin Elmer Spectrum RX1 System, Buckinghamshire, UK) after grinding and pressing with IR grade KBr. The IR fingerprints were recorded within the wavenumber region of 4000–400 cm−1.
Storage Stability Appraisal
Short-term stability of the freeze-dried LPS stored in tightly closed amber glass bottles in a desiccator at room temperature was assessed over a period of 3 months. The evaluation was done in terms of changes in the mean particle size, PdI, ZP as well as chemical stability (drug content). All the studies were conducted in triplicate and the average was taken.
In vivo Attempts
Animals and Dose Calculation
The present study was done on 50 adult- male Wistar rats (180–220 g, 8 weeks old). The animals were kept in standard metal cages at the animal house of the Alexandria Faculty of Medicine (21 ± 1°C, 65% relative humidity, and 10 h light/14 h dark cycle). After 2 weeks of acclimatization, the experiment was performed, and the animals were given standard chow and water ad libitum through the study period. The internationally accepted principles for laboratory use and care of the European Community (EEC Directive of 1986; 86/609/EEC) were adopted to reduce animals’ suffering. Additionally, the animals were handled according to the ethical guidelines of Alexandria University, and the Institutional Ethical Committee approval was obtained (IRB NO: 00007555-FWA NO: 00018699). In order to determine the appropriate animal dose of sulpiride, the human dose (150 mg/day)23 was extrapolated to rat dose using a specific mathematical equation based on rat/human body surface area ratio.24,25
In vivo Pharmacokinetic Study
Experimental Protocol
For in vivo pharmacokinetic appraisal, a total of fifteen healthy adult male rats were randomly assembled into three groups (5 rats per group; n=5). All rats were starved overnight but had free access to water until the end of the experiment. Each group got a single dose (15 mg/kg) of either free SUL suspension (Free SUL suspended in distilled water using 0.3% sodium carboxymethylcellulose), marketed product or optimized SUL-LPS via oral gavage. Under mild anesthesia, serial blood samples (0.5 mL) were pulled from every rat by retro-orbital vein puncture and collected into EDTA tubes at the appointed intervals: (0.25, 0.5, 1, 1.5,2,3, 4, 6, 8 and 24h). Afterward, the specimens were immediately centrifuged at 5000 rpm for 15 min. The obtained plasma was separated and stored at −20 °C pending further examination.
Bio-Sample Preparation and HPLC Analysis
Liquid–liquid extraction strategy was performed to extract sulpiride from plasma as previously reported with a slight modification.26 Briefly, plasma samples (100 μL) were mixed with 50 μL of 1M NaOH and 20 μL of paracetamol as an internal standard (50 μg/mL) via vortex for 10 sec. This mixture was extracted with 1 mL ethyl acetate via vortex-mixing for another 1 min at high speed and then subsequently centrifuged at 4000 rpm for 10 min. The organic layer was transferred into new glass tubes and evaporated to dryness. Afterward, the residues were reconstituted with 250 μL of the mobile phase of which 100 μL was injected into the HPLC column for quantification of SUL plasma concentration. The analysis was conducted using an HPLC system equipped with a photodiode array detector and the peak was detected at λ max 292 nm as mentioned above.27,28 To ensure the selectivity of the HPLC method, purity of SUL peak was fully checked via peak purity profile and plots.22 SUL concentration in plasma was calculated from the standard calibration curve relating analyte/IS peak area ratios to the expected concentration. The assay revealed highly linear relationships from 0.025 to 10 μg/mL of SUL., (R2 = 0.9974).
Pharmacokinetic Parameters
Pharmacokinetic interpretation of data was performed using a non-compartmental model by Microsoft Excel add-in program PK Solver program.29 Linear trapezoidal method was utilized to calculate the area under the plasma concentration-time profile curve (AUC0-t and AUC0-inf). The maximum plasma concentration (Cmax), time to reach this concentration (Tmax), mean residence time (MRT), elimination half-life (t1/2), and body clearance (CL) were subsequently determined for both groups.
In vivo Antidepressant Efficacy Attempts
The study design was illustrated in Figure 1. For the efficacy study, twenty randomly selected rats were divided into four groups (5 animals each). The groups encompassed: negative controls (saline-injected), positive control (reserpine injected and untreated), Free SUL (15 mg equivalent/kg suspended in distilled water using 0.3% w/v sodium carboxymethyl cellulose), and SUL-LPS (dose equivalent to 15 mg/kg SUL). Animals were given a single daily oral dose of the assigned treatment (2 mL) for 21 days. For the induction of a depressive state, all the animals’ groups, except for the negative controls, received a daily reserpine IP injection (0.2 mg/kg/day dissolved in 0.5% v/v dimethyl sulfoxide and 99.5% v/v sterile injected water) for 21 days. After 21 days, different treatment regimens were administered together with a maintenance dose of reserpine (0.1 mg/kg/day, IP injection) every 2 days to sustain the depressive state till the end of the study.30
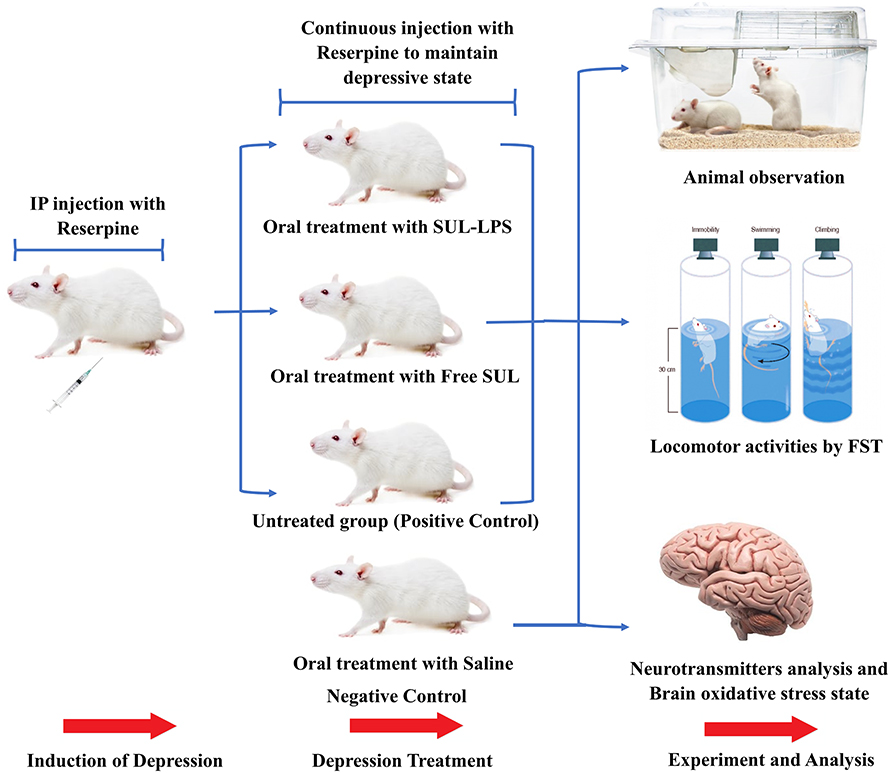 |
Figure 1 Study design of reserpine induced depression in male Wister rats. Rats with induced depression treated by oral administration of either SUL-LPS or free SUL at a dose equivalent to 15 mg/kg/day for 3 weeks. The efficacy of antidepressant was assessed according to three aspects: animal observation, locomotor activities and level of neurotransmitters and oxidative stress parameters in the brain. Abbreviations: FST, forced swim test; IP, intraperitoneal; SUL; sulpiride, SUL-LPS; sulpiride-loaded lipospheres. |
The induction of a depressive state was confirmed after three weeks of reserpine loading dose by the forced swim test. Furthermore, in order to monitor the progress and the potential improvement in their depressive state, animals’ weight, and food (g/day), and water consumption (mL/day) were recorded throughout the study period.
At the end of the experiment (6th week), the depressive state was evaluated using the forced swim test 24 h after the last dose of 21 days of treatment. Subsequently, animals were sacrificed by decapitation, brains were removed and rinsed in ice-cold saline. Tissue samples were then homogenized in 10 times (w/v) ice-cold phosphate-buffered saline (pH 7.4) containing protease inhibitor cocktail. The homogenate supernatant was obtained by centrifugation at (10,000 rpm, 15 min, 4 °C) for biochemical analysis. The total tissue protein concentration was determined in duplicate in the homogenate supernatant by BCA protein assay kit to normalize the tissue biochemical results.
Forced Swim Test
The forced swim test was performed following Porsolt et al (1978) protocol.31 The rats were individually tested on two consecutive days (1 session/day) in a non-transparent plastic cylinder (23 cm × 50 cm) containing 30 cm of water (25–26 °C). On the training (pre-test) session, each rat was allowed to swim in the cylinder for 15 min, then dried and returned to its home cage. Twenty-four hours later, the test session was performed as 5 min swimming with recording of the time of the escape-oriented behaviour. The detected behavioural parameters, in the order of priority, were: immobility (ie, floating time in the water where rat performs slight swimming movements in order to remain afloat), swimming (ie, coordinated and sustained movements with all four limbs), and climbing (ie, struggling where vigorous movements of four limbs occur with the front paws breaking against the wall of the cylinder).32 In order to evade any influence on the next subject, water was changed between rats.
Neurotransmitters (Dopamine and Serotonin) Analysis
Because of their relation to the pathophysiology of depression,4 dopamine and serotonin levels were quantified by ELISA in brain tissue. Concerning dopamine, the quantification was done according to the protocol provided by MyBioSource dopamine competitive immunoassay kit (MyBioSource, Inc., CA, USA). Regarding serotonin, ELISA was done according to the manufacturer’s instructions of the Abcam serotonin competitive immunoassay kit (Abcam, Inc., MA, USA). Accordingly, dopamine and serotonin concentrations were interpreted from their corresponding standard curve and their results were expressed in ng/g tissue.
Brain Oxidative Stress Biomarkers
Malondialdehyde (MDA), the end-product of lipid peroxidation, was quantified via thiobarbituric acid (TBA) reagent, and its results expressed in nmol/g tissue.33 Nitric oxide species; nitrite level, were detected by Griess Reagent and its result was expressed in μM/mg tissue protein.34 Further, the total antioxidant capacity (TAC) of the tissue was measured colorimetrically by evaluating the suppression of the formation of thiobarbituric acid reactive substances (TBARS) in the presence of the tissue antioxidants and its results were expressed in mM/mg tissue protein.35 Finally, reduced glutathione (GSH), one of the major antioxidant defence markers in the brain, was determined by the Ellman method and its results were expressed in mmol/g tissue.36
In vivo Nanotoxicological Attempts
For the toxicity study, fifteen randomly selected rats were divided into three groups (5 animals each). The groups encompassed: negative controls (received 2 mL saline), blank LPS, and SUL-LPS which received a dose equivalent to fixed SUL concentration of 15 mg/kg/day and total lipids of 500 mg/kg/day. Animals were given a single daily oral dose of the assigned treatment (2 mL) for 21 days.
The animals were observed daily following drug administration to detect any possible toxic responses to the given treatment (ie, fur, skin, mucous membrane, gastrointestinal changes, and mortalities). Animal body weight, which represents an index to toxicity state, was measured weekly via an electronic balance (Precisa Instrument, Dietikon, Switzerland). Besides, animals’ food (g/day) and water (mL/day) consumption were daily recorded and were represented by their mean per week of the study. A day after the last treatment dose, the animals were sacrificed by decapitation and a blood sample was withdrawn from each animal for separation of serum and determination of liver functions (ALT and AST) and kidney functions (urea and creatinine). Afterward, the major organs (liver, spleen, kidneys, brain, etc) were weighed, inspected for any substantial changes in shape and texture.
In order to detect any potential toxic effect of the given formulation on the brain, a part of each animal’s brain was rinsed in ice-cold saline and stored at −80 °C for homogenization and subsequent biochemical analysis of caspase-3 (as a marker of apoptosis) and TNF-α (as a marker of inflammation). For normalization of tissue biochemical results, aliquots of the homogenate supernatant were analyzed in duplicate for the total protein concentration by the BCA protein quantitation kit.
Biochemical Analysis
The activity of serum ALT and AST enzymes was determined colorimetrically at 546 nm following the protocol of Spectrum Assay Kit.37 Moreover, an enzymatic colorimetric method was adopted to determine serum urea level at 578 nm following Diamond Diagnostics Assay Kit instructions.38 Finally, buffered kinetic Jaffe reaction was performed to determine serum creatinine level at 492 nm via Spectrum Assay Kit.39
Brain Caspase-3 Assay
Brain caspase-3 enzymatic activity was measured by colorimetric reaction provided by the R&D Systems at a wavelength of 405 nm. Caspase-3 activity was normalized to total tissue protein and then was expressed relative to the baseline (control) levels.40
Brain TNF-α ELISA
The quantification of brain TNF-α was done following the protocol provided by R&D Systems Quantikine rat TNF-α sandwich immunoassay kit. TNF-α values were then interpreted from TNF-α standard curve and results were expressed in pg/mg tissue protein.
Histopathological Examination
After the animals’ sacrifice, the tissues of brain, stomach, intestine, liver, and kidney were collected and fixed in 10% v/v buffered formalin solution for histopathological examination. The tissues were embedded in paraffin wax, then 5μm sections were cut and stained with hematoxylin and eosin (H&E) for microscopic evaluation. Examination of all specimens was done using a light microscope (Leica, Germany) equipped with a digital camera.
Statistical Analysis
Data were expressed as the mean of three independent experiments ± standard deviation (SD). Statistical difference was judged out using unpaired Student’s t-test at the 5% level (p-value < 0.05; Graph Pad Prism Version 8; Graph Pad Software, Inc., La Jolla, CA, USA). Comparison between the groups was performed using F-test (ANOVA) followed by Tukey pairwise comparisons, the significance of the results was at the level of p-value < 0.05. For in vivo attempts, data were analyzed using IBM SPSS software package version 20.0. (Armonk, NY: IBM Corp). As for in vivo results, the Kolmogorov–Smirnov test was used to verify the normality of distribution. Furthermore, quantitative data were described using the range (minimum and maximum), mean, and standard error of mean. The following tests were done to compare between more than two groups of quantitative variables: F-test (ANOVA), for normally distributed variables, with Post Hoc test (Tukey) for pairwise comparisons and Kruskal Wallis test, for variables that did not show a normal distribution, with Post Hoc (Dunn’s multiple comparisons test) for pairwise comparisons. The significance of the obtained results was judged at the 5% level.
Results and Discussion
HPLC Assay of Sulpiride (SUL)
The retention time of sulpiride (SUL) was 5.33 ± 0.071 min. The peak appeared well separated, symmetrical, with no fronting or tailing. Also, the standard calibration curve was constructed by relating the measured peak area to the corresponding SUL concentration showing a high linear relationship from 1 to 100 μg/mL of SUL (r2 = 0.9996) with intra-day and inter-day precision and percentage error of the mean are lower than 2%.
Preparation and Optimization of SUL-Loaded Biocompatible Lipospheres
The poor bioavailability of SUL induces the preparation of novel drug delivery systems, particularly, nanoparticles. Being lipophilic, lipid-based nanoparticles were of privileges for SUL delivery on the account of ameliorating both its intestinal permeability and oral absorption.
As an essential preparatory step, the feasibility of LPS formation was conducted via two preparation techniques namely: solvent evaporation and melt emulsification. The selection criterion was the smallest particle size and PdI, as well as the formation of a stable uniform dispersion.
By observing the results (Figure S1A), the formulated LPS prepared by the solvent evaporation method exhibited a significantly lower particle size of 142.0 ± 3.606 nm with a PdI value of 0.239 ± 0.006, in contrast to its peer formulation prepared via the melt emulsification method (p-value < 0.001). Moreover, after 24 h of preparation, noticeable phase separation of LPS nanodispersion and large lipid aggregates were observed indicating the failure of this method to efficiently form a stable nanodispersion (Figure S1B). A possible explanation of this observation is the lower homogenization efficacy of the phospholipid/PLX407 mixture in the emulsified solid lipid melt in contrast to that in the solvent evaporation method, due to lower mobility of the phospholipid molecules. Thus, it might need more energy input or changes in the emulsifier amount to ensure efficient homogenization. Our findings were in accordance with an earlier reported attempt where lecithin/sodium glycocholate stabilized tripalmitin. LPS formulated via solvent evaporation yielded significantly smaller particles with a mean size value of 28 nm, than that of the melt-emulsified tripalmitin dispersion (124 nm).41 Consequently, proceeding with melt emulsification strategy was hindered and solvent evaporation strategy was picked out for the formulation of SUL-LPS. It is worthy mentioned that the solvent-emulsification evaporation method has numerous focal points, counting its simplicity, reproducibility, ease to be scaled up, and saving of time, compared to the other harsh and time-consuming ordinary strategies of preparation.15
For the optimization of SUL-LPS, twenty LPS formulations (F1-F20) were developed by the solvent-emulsification evaporation method, as illustrated in Table 1. The impact of formulation variables including different types of core lipid, surfactant, phospholipid shell, core lipid to coat lipid ratio, surfactant concentration, and SUL to core lipid on the physicochemical characteristics of LPS was assessed.
Characterization of SUL-Loaded Biocompatible Lipospheres
Assessments of Particle Size, Polydispersity Index (PdI) and Zeta Potential (ZP)
One of the basic standards for the design of LPS is to form a stable, uniform nanodispersion with adequate values of particle size, PdI, as well as zeta potential. These are crucial parameters that mainly allow efficient uptake in the intestine, especially in the lymphoid tissue, thus achieving an improvement of drug oral bioavailability.42 Figure 2 demonstrated the particle and PdI values of several batches of SUL-LPS (F1-F20). The particle size of the investigated LPS was in the nanometric range of 49.33 ± 6.46 to 396.9 ± 17.57 nm, along with low PdI values of less than 1, indicating an acceptable dispersion homogeneity. As far as, zeta potential was investigated, a high surface charge extended from almost −13 to −33 mV ideally produce repulsive forces that prohibit the agglomeration of the dispersed droplets. It was revealed that all studied formulations achieved perfect colloidal stability, as manifested by increased zeta potential values ≥-25 mV). Generally speaking, LPS are foreseen to carry a negative charge referred to phosphatidic acid and free fatty acid of lipid shell in a water phase with a neutral pH value.
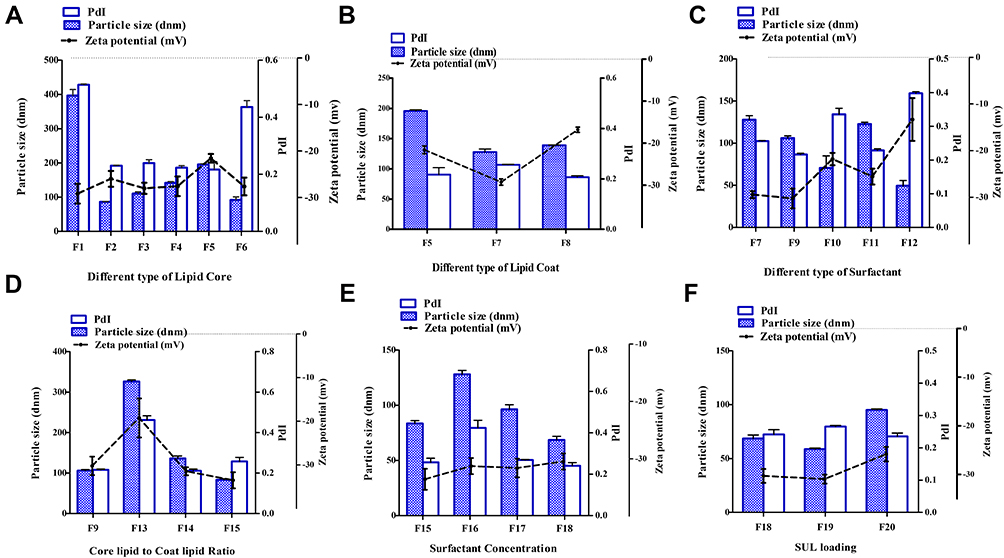 |
Figure 2 Influence of different formulation variables, including (A) lipid core type; (B) lipid coat type; (C) surfactant type; (D) core lipid to coat lipid ratio; (E) surfactant concentration and (F) SUL loading on the corresponding particle size, zeta potential and polydispersity index (PdI) of the investigated LPS (Table 1). Data were expressed as mean ± SD (n=3). Abbreviations: LPS, lipospheres; PdI, polydispersity index; SD, standard deviation; SUL, sulpiride. |
No doubt, the chemical nature of the solid core lipid will affect the physicochemical properties of the prepared LPS. Accordingly, various solid lipids, including fatty acids (stearic acid), glyceryl monostearate (Geleol® TM), glyceryl palmitostearate (Precirol® ATO5), glyceryl dibehenate (Compritol), glyceryl tristearate (Dynasan®118), and glycol stearate (Tefose®63) were screened for their capability to produce LPS (Table 1, F1-F6). From the results obtained, stearic acid based LPS (F1) exhibited a significantly higher particle size and PdI values of 396.9 ± 17.57 nm and 0.492 ± 0.039, respectively, relative to the other glyceride-based lipids (p-value ˂ 0.0001) as depicted in Figure 2A. Such an outcome could be ascribed to the relative hydrophobicity of stearic acid as a fatty acid, which could require more energy input to better packing with the phospholipid shell and assembly of LPS. Conversely, the rest of the glycerides-based lipid depicts some surface tension properties (HLB 2–5), thus improving the emulsifier film around the particles and more stabilization might be achieved. A similar finding was exhibited by Dudhipala and Veerabrahma43 Among different glyceride lipids, glyceryl monostearate (F2) succeeded to produce significant smaller nanoplatforms with a particle size value of 86.61± 0.55 nm, followed by glycol stearate (F6), glyceryl palmitostearate (F3), glyceryl dibehenate (F4) and glyceryl tristearate (F5) with values of 91.9 ± 8.75, 110.7 ± 5.30, 142.0 ± 3.61, and 195.8 ± 1.91 nm, respectively (Figure 2A). This variation in particle size depended on the hydrocarbon chain length of the glycerides where a long hydrocarbon chain length produces a greater particle size. Concurrently, from earlier attempts, it was evident that triglycerides of higher melting point and molecular weight could raise the system viscosity and hence resulting in a larger globule size.44 Regarding the polydispersity index, all glycerides showed a narrow particle size distribution pattern with values near to, or below, 0.3. Nevertheless, no obvious alteration was observed amongst all lipids investigated, within highly negative values of zeta potential as demonstrated in Figure 2A.
Furthermore, phospholipid shell is an imperative component of LPS formation, by promoting its biocompatibility and behaving as a physical boundary that diminishes drug leakage from nanoplatforms.44,45 In the current attempt, three types of phospholipid shells were compared for best formulation appraisal (Table 1, F5, F7, and F8). With regard to Figure 2B, the particle size of LPS based on LS100 (F5), LS75 (F7), and P90H (F8) was 195.8 ± 1.91, 127.9 ± 4.87, and 139.0 ± 0.75 nm. In addition, the zeta potential of all developed nanoplatforms varied from −16.85 ± 0.64 (F8) to −29.37 ± 0.75 mV (F7). Hence, the usage of LS75 (F7) as a lipid shell significantly decreased the value of particle size and increased the negativity of ZP. LS75 contains the lowest amount of phosphatidylcholine, the highest amount of phosphatidylethanolamine, lysophosphatidylcholine, and anionic substances. Therefore, the alteration in the nature of the head group of phospholipids could significantly impact the curvature of the shell and thereby the nanoplatforms size and charge.46 Moreover, the presence of phosphatidylethanolamine in LS75 might elucidate the highly negative zeta potential value relative to P90H and LS100.46
Another factor that affected the physicochemical properties of SUL-LPS is the surfactant or stabilizer used. During this study, several surfactants were evaluated at a concentration of 1% w/v, namely, PLX407, PLX188, T80, PVA, and GEL (Table 1, F7, F9, F10, F11, and F12, respectively). The type of surfactant employed for stabilization had a significant impact on the mean particle size of the prepared LPS (p-value= 0.0381) as demonstrated in Figure 2C. However, F12 ensured a smaller particle size value of 49.33 ± 6.46 nm, the nanoplatforms were physically unacceptable as confirmed by short stability with small aggregates precipitated within a week. As this surfactant had a low HLB value of 13, however, it was the perfect area for stabilization, its ability to reduce the surface tension was low and forbade their partition between the lipophilic and hydrophilic domain and hence resulted in the poor self-emulsification product.47 Moreover, GEL significantly decreased the negativity of zeta potential to −13.25 ± 4.59 mV that could be responsible for particle agglomeration. On the other hand, the order of particle size among the other surfactants was observed to be; T80 (F10, 70.67±14.29 nm) < PLX188 (F9, 106.2 ± 2.53 nm) < PVA (F11, 122.8 ± 2.02 nm) < PLX407 (F7, 127.9 ± 4.87 nm), respectively. This variation in particle size could be linked to their difference in molecular weight (T80, 1310 < PLX188, 8400 < PVA, 13,000 < PLX 407, 14,600). Thus, using the same concentration of the surfactant (1%w/v), the number of surfactant molecules will be lower for the poloxamers and PVA than for the T80, were not sufficient to surface coverage of LPS, leading to particle coalescence.48 Moreover, the nearness of bigger molecules of surfactants on the LPS surface could contribute to larger particle size. As far as the PdI was concerned, both F10 and F12 were more heterogeneous, multimodal nanoplatforms, evidenced by high PdI values of 0.336 ± 0.018 and 0.398 ± 0.005, respectively, in contrast to their peers.
Despite, the type of lipid shell and lipid core, their proportional compositions play a crucial role to ensure full stabilization of the colloidal system. Noteworthy, the absence of phospholipid shell (F13) produced heterogeneous LPS of larger values of both particle size (326.3 ± 3.7 nm), and PdI (0.4623 ± 0.02), as depicted in Figure 2D. In contrast, elevating the core:shell lipid ratio from 1:1 (F14) to 1:4 w/w (F15) could reduce the particle size, values from 136.1± 6.13 to 83.52 ± 2.61 nm, respectively, giving a significant decrease 1.6-fold (p-value < 0.05). This could be assigned to adsorptions of phospholipids on the surface of LPS and creation of additional water/oil interfaces upon boosting phospholipid content, hindering their agglomeration. These results agreed with those of El-Zaafarany et al,16 where triolein emulsomes became smaller in particle size accompanying by a higher ratio of phospholipid, presumably due to better packing with the solid lipid matrix and assembly of the particles with smaller size. Interestingly, the inclusion of phospholipid at the core:shell ratio (1:1 w/w) caused a remarkable increase in the negativity of zeta potential values from −19.25 ± 4.45 (F13) to −31.45 ± 0.92 mV (F14), confirming the above-mentioned hypothesis that phospholipid is the main participator to this negative charge. A further increment in the phospholipid content up to 1:4 w/w (F15) also kept the good stability of LPS dispersion with a ZP value of −33.5 ± 1.84 mV, but the variation in ZP values was insignificant between the different phospholipid ratios (p-value > 0.05).
Since a lower concentration of emulsifier (F16; 0.2% w/v) was insufficient to be well distributed within the LPS dispersion, several concentrations were investigated to the extent of 0.2%-2%w/v, relative to the formulations (F15-F18). Elevating the number of surfactant molecules could diminish the particle’s surface tension of the hydrophobic nanoplatforms and this eventually resulted in particle size reduction as well as improving their stability in an aqueous environment.49 Our outcomes got along with those findings, where modifying the concentration of the emulsifier noticeably influenced the particle size of the developed LPS (Figure 2E). Increasing the concentration of surfactants (F18, 2%w/v) led to a decrease in the particle size to 68.62 ± 3.19. All surfactant concentrations showed a comparable ZP value as expressed in Figure 2E. On the contrary, increasing SUL loading within LPS from 0.1 (F19) to 0.3% w/v (F20) with respect to total dispersion volume (Table 1), slightly elevated the particle size 1.6-fold, (Figure 2F). It was presumably ascribed to SUL adsorption on the surface of nanoplatforms, together with its entrapment within the lipid matrix. This phenomenon was in close accordance with previously reported findings.49,50 Meanwhile, the surface charge of the prepared LPS exhibited an insignificant reduction upon boosting drug loading.
Measurements of SUL Encapsulation Efficiency (%EE)
Assessment of EE plays a crucial role to confirm the ability of the LPS to be utilized as carriers for SUL and to estimate the suitability of the studied preparation technique. Our data revealed varied incorporation efficiency ranging from 51.81 to 91.64%, (Figure 3), impacted by different formulation variables. Due to the alteration in the composition of solid lipid employed as LPS matrices, the % EE of SUL was significantly (p-value < 0.05) affected. The order was as follows; glycol stearate (F6, 51.81 ± 2.21%) < glyceryl palmitostearate (F3, 62.81± 2.22%) < glyceryl dibehenate (F4, 71.92 ± 3.19%) < glyceryl tristearate (F5,73.81 ± 1.74%) < glyceryl monostearate (F2, 80.69 ± 2.33%) < stearic acid (F1, 91.03 ± 2.29%) as depicted in Figure 3A. Glycol stearate contains polyethylene glycol moieties in its structure, which increased the aqueous saturation solubility of SUL, leading to low EE values. On the other hand, stearic acid (F1) and glyceryl monostearate (F2) based LPS ensured higher encapsulation efficiency, mainly, assigned to the chemical and physical structure of solid lipid matrix where the presence of free carboxylic acid in their structures resulted in rapid dissolution of SUL in the lipid matrix and consequently augmented drug incorporation.
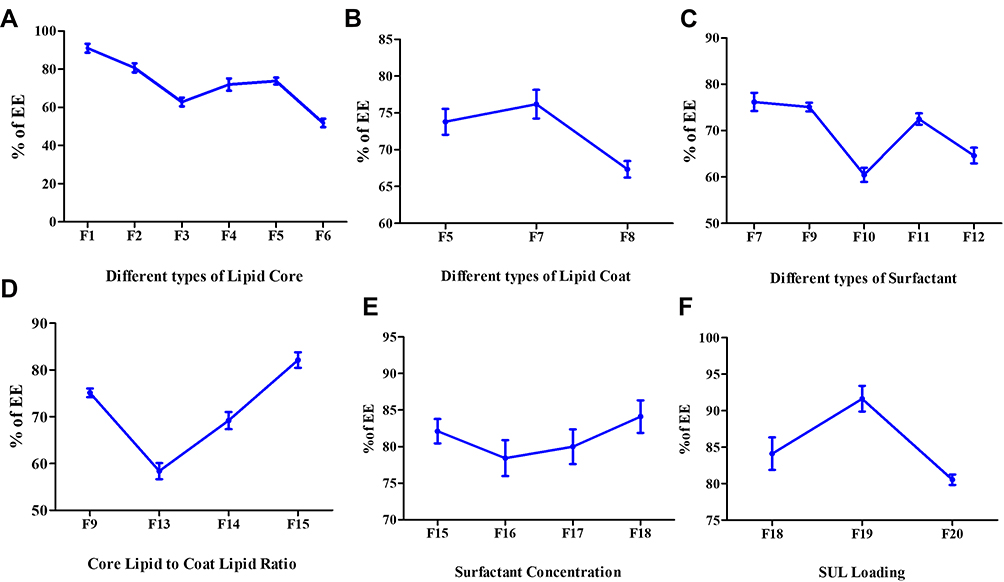 |
Figure 3 Influence of different formulation variables, including (A) lipid core type; (B) lipid coat type; (C) surfactant type; (D) core lipid to coat lipid ratio; (E) surfactant concentration and (F) SUL loading on the % of EE of SUL within the investigated LPS (Table 1). Values demonstrated as mean ± SD (n=3). Abbreviations: EE, encapsulation efficiency; LPS, lipospheres; SD, standard deviation; SUL, sulpiride. |
Regarding the type of lipid coat, replacing LS100 (F5) with LS75 (F7) had a negligible impact on the % EE of SUL (Figure 3B). Meanwhile, a low EE value of 67.34 ± 1.12% was noticed by the usage of saturated P90H (F8), relative to the unsaturated ones (73.81 ± 1.74 and 76.19 ±1.95% for LS100 (F5) and LS75 (F7), respectively). The increased unsaturation of fatty acyl chains in case of either LS100 or S75 would provide high membrane flexibility, which might permit more SUL to be encapsulated within LPS, Similar outcomes were pointed up by Sebaaly et al,46 where liposomes prepared by phospholipids with different fatty acid compositions affected the liposomal membrane characteristics. Meanwhile, the type of surfactant chosen had a notable impact on the EE of SUL onto LPS (Figure 3C). Both formulations containing T80 (F10) and GEL (F12) revealed lower % EE values of 60.49 ± 1.53 and 64.63 ± 1.68%, respectively, with respect to the poloxamers-based LPS (76.19 ± 1.95% and 75.13 ± 0.93% for PLX407 (F7) and PLX188 (F9) based formulations, respectively). It was early reported that tri-block copolymers provided a steric hindrance on the LPS surface and hence led to drug leakage reduction.51 Interestingly, a remarkable elevation in the % EE of SUL by 1.4-fold was monitored via increasing the proportion of lipid matrix to lipid shell ranging from 1:0 (F13) to 1:4 w/w (F15) (Figure 3D). The higher the phospholipid content within LPS, the more void space would be available for more drugs to be accommodated, offering a high % EE of SUL.16 On the other view, increasing the surfactant concentration from 0.2% (F16) to 2% w/v (F18) slightly pushed the % EE of SUL from 78.43 ± 2.44 to 84.12 ± 2.22%, respectively, (Figure 3E). This might be attributed to the capability of a surfactant to form a more rigid and intact film structure on the particle surface prohibiting drug expulsion from the lipid matrix. Moreover, upon increasing the surfactant content, the dispersion became slightly viscous, which prevented the partition of SUL in the external aqueous phase. Contrary to the early reported attempt,42 we did not detect any significant decrease in the % EE upon emulsifier content elevation, which might be due to the difference of either surfactant or drug nature, as well as the range of surfactant concentration chosen. Nevertheless, our findings were supported by previous reports in the literature.51,52
With regard to Figure 3F, increasing drug loading from 0.1% (F19) to 0.3%w/v (F20) slightly reduced the % EE of SUL from 91.64 ± 1.76 to 80.55 ± 0.707%, respectively. This observation could be clarified by the fact that elevating the drug concentration might alter the osmotic pressure difference between the lipid and aqueous phase, which eventually led to serious damage to the formation of emulsion droplets, causing rapid diffusion of SUL from the lipidic matrix of LPS to the external aqueous phase.18 Additionally, increasing SUL concentration would cause matrix and phospholipid shell saturation, leading to leakage of the excess drug out of LPS.20
In vitro Release Study
One of the crucial prerequisites in the preparation of nanoplatforms is obtaining a sustained release pattern of active agents into the surrounding environment. Hence, the release profile of free SUL and SUL-LPS (F1-F20) were evaluated in vitro at 37 °C ± 0.5 in 0.1 N HCl pH 1.2 for 2 h and then in phosphate buffer pH 6.8 for 8 h, in order to simulate the gastrointestinal tract environment. The saturation solubility of SUL in both 0.1 N HCl pH 1.2 and phosphate buffer pH 6.8 was found to be 14.36 ± 1.5 mg/mL and 5.70 ± 0.82 mg/mL at 37 ± 0.5°C, respectively. Thus, the sink condition was maintained in both media (more than 25-fold sink). The release pattern of free SUL showed rapid dissolution and reached almost 93.7% of the dose within the first two hours, Figure 4. Conversely, all developed LPS revealed a biphasic release manner for SUL characterized by initial burst release due to the desorption of SUL from the surface of LPS, followed by a prolonged diffusion of SUL from the interior lipidic core.18,44,45
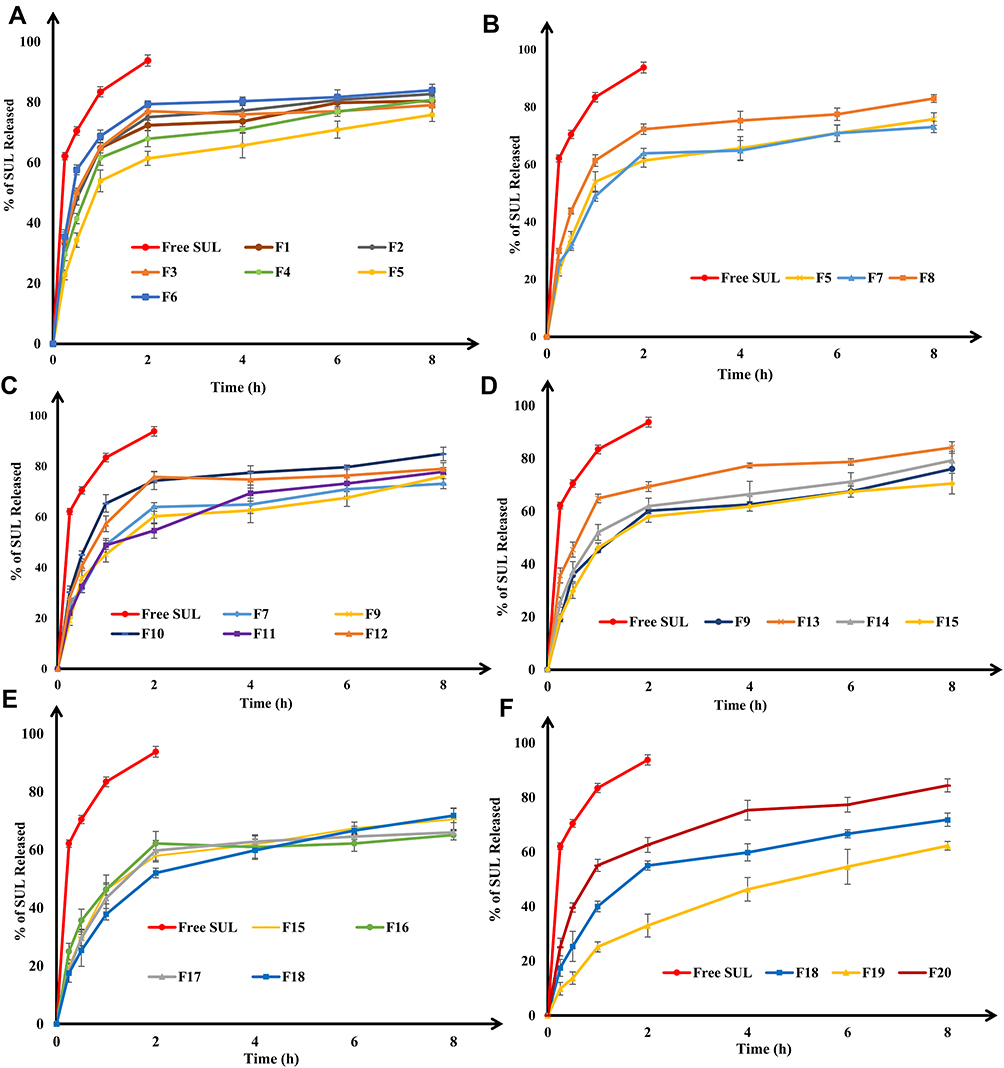 |
Figure 4 Influence of different formulation variables, including (A) lipid core type; (B) lipid coat type; (C) surfactant type; (D) core lipid to coat lipid ratio; (E) surfactant concentration and (F) SUL loading on the in vitro release of SUL from LPS (Table 1) in 0.1N HCL pH 1.2 for 2h, then phosphate buffer pH 6.8 for 8 h at 37 °C and 100 rpm. Data were expressed as mean ± SD (n=3). Abbreviations: LPS, lipospheres; SD, standard deviation; SUL, sulpiride. |
The investigated SUL-LPS, utilizing different types of lipidic matrices, demonstrated a significant impact on the SUL release rate (p-value < 0.05) as pointed out in Figure 4A. Among all lipidic matrices used, glycol stearate (F6) revealed the fastest release rate where 80.33 ± 1.34% of SUL released within 4h . Surprisingly, stearic acid (F1) and glyceryl monostearate (F2) based LPS which exhibited higher EE of SUL (91.03 ± 2.29% and 80.69 ± 2.33%, respectively), showed high diffusion rates of around 49% and 80% of SUL released after 30 min and 6 h, respectively. In contrast, F4 and F5 with EE values of 71.92 ± 3.19% and 73.81 ± 1.74%, respectively, ensured more sustained release manner where nearly 80.78 ± 2.32% and 75.84 ± 2.20% of SUL were released after 8 h with an initial burst drug release of 41.43 ± 1.71% and 34.30 ± 2.38% within the first half-hour, respectively. This might be ascribed to the hydrophobic long-chain fatty acids of both glyceryl dibehenate and glyceryl tristearate that could produce a less ordered lipid crystal with an increased number of lattice defects, enabling better embedding of the SUL within the lipid core, resulting in a more prolonged release impact.43 Furthermore, it was substantial to take into consideration the degree of polarity and crystallinity of the lipid used, which might affect the total amount released. The lipid with polar and highly crystalline characters revealed a high tendency to increase drug diffusion. A variation in release patterns caused by a difference in lipid polarity and crystallinity was also proposed by Jensen et al,53 in an attempt with betamethasone-17-valerate and glycerides with differing polarity.
Concerning the type of lipid coat (Figure 4B), formulations containing LS100 (F5) and LS75 (F7) showed a comparable release pattern, where almost 34.30 ± 2.38% and 31.54 ± 1.48% of SUL was released within the first half-hour. This was followed by a gradual increase in the drug release until reaching the value of 75.84 ± 2.20% and 73.09 ± 1.96% within 8 h, respectively. In contrast, the diffusion extent of SUL from P90H-based LPS (F8) was much higher with 43.83 ±1.04% and 82.99 ± 1.38% released within 30 min and 8 h, respectively. Such findings confirmed that phospholipids with different degrees of saturation, transition temperature, and composition could exert a significant influence on the properties of the prepared LPS. Meanwhile, by comparing the release outcome of formulations containing different types of surfactant in Figure 4C, PLX407, 188, and PVA (F7, F9, and F11, respectively) caused a reduction in the extent of SUL diffusion from LPS and retarded its release to the medium, relative to T80 and GEL (F10 and F12, respectively). Poloxamers and PVA, together with their viscosity-imparting properties, could be strongly adsorbed onto the surfaces of hydrophobic LPS, yielding a tight film with a higher packing density, suppressing the leakage of SUL from the LPS, consequently, slowing its release to the medium. Additionally, such variation in the release patterns could be linked to their significant difference in the particle size, where both T80 and GEL yielded smaller particles with values of 70.67±14.29 and 49.33 ± 6.46 nm, respectively. In fact, the smaller the particle size, the higher the surface area is available, resulting in a faster release rate.
Interestingly, the incorporation of phospholipid coat onto LPS at a ratio of 1:1 w/w succeeded in retarding the SUL initial burst release after 30 min from 45.49 ± 2.83% (F13) to 37.10 ± 1.57% (F14), as shown in Figure 4D. Phospholipid, besides elevating EE, creates an interfacial film that acts as a rate-limiting barrier against the diffusion of SUL out of the LPS into the aqueous medium. Another possibility is that a strong interaction between phospholipids and the solid triglyceride core might occur, leading to an immobilization of the interfacial film and consequently, permitting the retarded release of SUL across the phospholipid barrier.54 Nevertheless, a further increase in the ratio of lipid core and phospholipid shell to 1:4 (F15) w/w did not greatly influence the rate of SUL release from LPS. Such behaviour in the release pattern was also reported by El-Zaafarany et al,16 in an attempt with olanzapine encapsulated onto emulsomes with different proportions of phospholipid and triglycerides. Meanwhile, by inspection of the data in Figure 4E, the developed SUL-LPS, using different surfactant concentrations, presented a negligible influence on the SUL release rate.
On the contrary, a higher release was observed upon altering the ratio of SUL to lipid matrix ratio from 1:10 (F19) to 3:10 w/w (F20), Figure 4F. Increasing SUL loading remarkably boosted the initial burst release to 39.59 ± 1.69% in the first half-hour, relative to 25.33 ± 5.53% and 13.69 ± 2.25% released from the corresponding formulations F18 and F19, respectively. At higher SUL loading (F20), more drug molecules might be accumulated on the surface of LPS rather than in the lipidic matrix, resulting in a shorter diffusion path length and subsequent greater SUL release rate. In concordance with Makled et al,20 it could be concluded that increasing the concentration gradient of the drug would perform as a driving force for more drug diffusion.
Based on the aforementioned screening of the formulation compositions, three formulations (F9, F15, and F18, Table 1) grabbed our attention as they were characterized by adequate particle size, high drug loading, and % EE together with extended-release properties. Accordingly, they were chosen to assess their capability in potentiating the intestinal permeability of SUL and thus enhancing its oral absorption along with its clinical efficacy.
Furthermore, the release kinetics of SUL from the chosen nanoplatforms (F9, F15, and F18) were assessed by fitting the in vitro release data into mathematical models based on zero-order, first-order, Higuchi, and Weibull kinetic equations and then computing their correlation coefficient (R2). As observed in Table S1 (supplementary material) the goodness of fit for the three developed nanoplatforms was accomplished by Weibull kinetic model. Moreover, the Korsmeyer-Peppas model was used to elucidate the drug release mechanism from the different formulations under test. The calculated values of n were < 0.45, characterizing for the Fickian transport of drug diffusion.
In vitro Assessments of LPS-Mucin Interaction
SUL should be transported via the intestinal mucosal lining to the underlying epithelial layer to be effectively absorbed. Indeed, the GI mucus layer, a critical diffusion barrier, had a remarkable impact on the fate of active agents and drug delivery carriers in the gastrointestinal tract.55 The usage of nanoplatforms exhibited substantial improvements in drug delivery through the mucosal layer. They either prolong the residence time of nanocarriers, enhancing the association to mucus at the absorption site or promote their penetration across the mucus layer, delivering the payload close to the underlying epithelium.12
Studying the interaction of the nanoplatforms with mucus would illustrate the fate of these carriers to behave as a mucopenetrating delivery vehicle for orally administered drugs. In the current attempt, the interaction of LPS with mucin was roughly assessed in vitro either turbidimetrically or by monitoring any modifications in both particle size and ZP (Figure 5). Adsorption of mucin on the surface of nanoplatforms tends to increase their particle size as well as the negative of ZP values. In addition, an elevation in the absorbance of nanoparticle-mucin mixtures over mucin dispersions generally suggested mucin/particle interactions.20,56 The absorbance and ZP values of mucin/SUL dispersion were measured as control and revealed the absence of interaction between them (Figure 5A and B). Additionally, Figure 5A showed the non-significant fluctuation in the absorbance of all investigated LPS after mucin treatment over 2 h, reflecting a lack of LPS-mucin interaction. Moreover, a negligible alteration in either ZP or mean particle size was observed during 2 h incubation with mucin (Figure 5B and C), indicating the minimal impact of mucin on the LPS and thus a high opportunity for LPS penetration across the mucosal barrier. Such outcomes were in close accordance with the previously recorded attempt.56
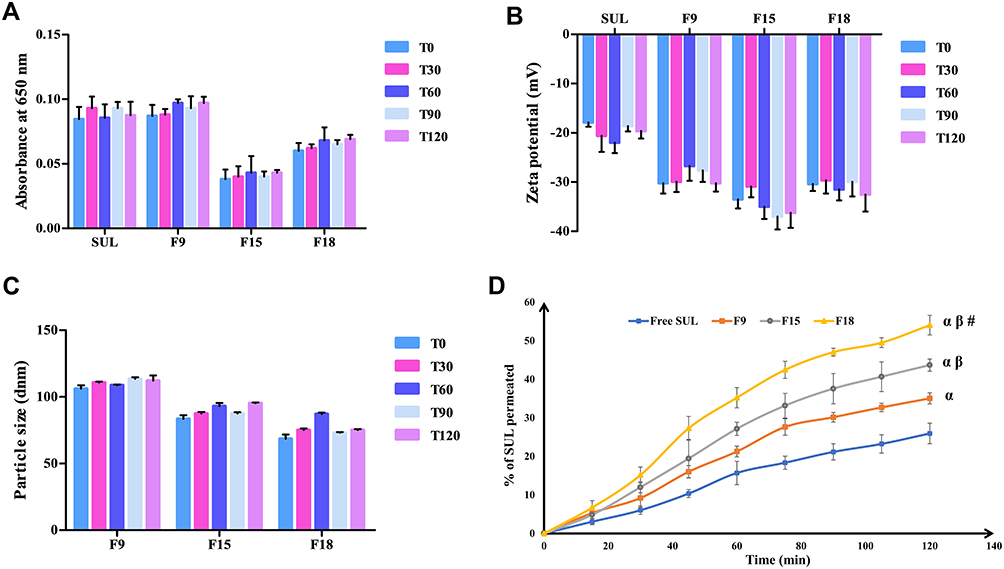 |
Figure 5 In vitro interaction of LPS with mucin evaluated by: (A) turbidimetry at 650 nm, (B) zeta potential, and (C) particle size measurements as a function of time (min), values were expressed as mean ± SD (Table 1), (D) Ex vivo intestinal permeation profiles of SUL from the LPS (F9, F15 and F18, Table 1) across non-everted rat intestine, in oxygenated Ringer solution at 37 ± 0.5 °C. Each value presented as mean ± SD, n=3. Statistically significant at αp-value < 0.05 vs free SUL, βp-value < 0.05 vs F9, and #p-value < 0.05 vs F15. Abbreviations: LPS, lipospheres; SD, standard deviation; SUL, sulpiride; T0, zero time; T30, time after 30 min; T60, time after 60 min; T90, time after 90 min; T120, time after 120 min. |
In order to confirm the above-mentioned outcome, the predictable role of LPS in potentiating the intestinal permeation of SUL should be assessed. Accordingly, the investigated SUL-LPS (F9, F15, and F18) was selected for the ex vivo intestinal permeation appraisal.
Ex vivo Intestinal Permeability Study
No doubt, screening the permeability of drug candidates throughout the intestinal mucosa could give a reliable indication of their oral absorption, relative bioavailability, and subsequently, their biological action. The non-everted rat intestinal sac technique revealed many reported privileges, including its simplicity, the possibility of utilizing a small quantity of the tested drug, the feasibility of frequent collection of serosal samples. The most important advantage is that the morphological characteristic of intestinal tissue remains intact, compared to the everted intestinal sac model.19,21,57
The comparative absorption of SUL, either from aqueous suspension or from LPS, was evaluated through the rat non-everted sac model. Results were depicted in Figure 5D, illustrating the ex vivo intestinal permeation profiles of free SUL and different elaborated SUL-LPS and in Table 2, showing their permeability parameters. As observed from Figure 5D, the cumulative amount of SUL permeated among different LPS across the intestinal mucous membrane was significantly (p-value < 0.05) higher than that from its aqueous suspension. It was clear that free SUL revealed a low intestinal permeation rate within the first minutes up to 2 h, coming to a permeation of 25.94 ± 2.66% w/v which could be explained by the low permeability of SUL (class IV drug) along with extensive clearance via intestinal P-glycoprotein efflux pump where SUL is reported to be a proper P-gp substrate.5 On the contrary, the % of SUL permeated from elaborated LPS after 2 h was in the range of 35.04 ± 1.45 (F9) to 54.03 ± 2.55% w/v (F18), enhancing its permeability through the intestinal barrier from 1.4 to 2.1.
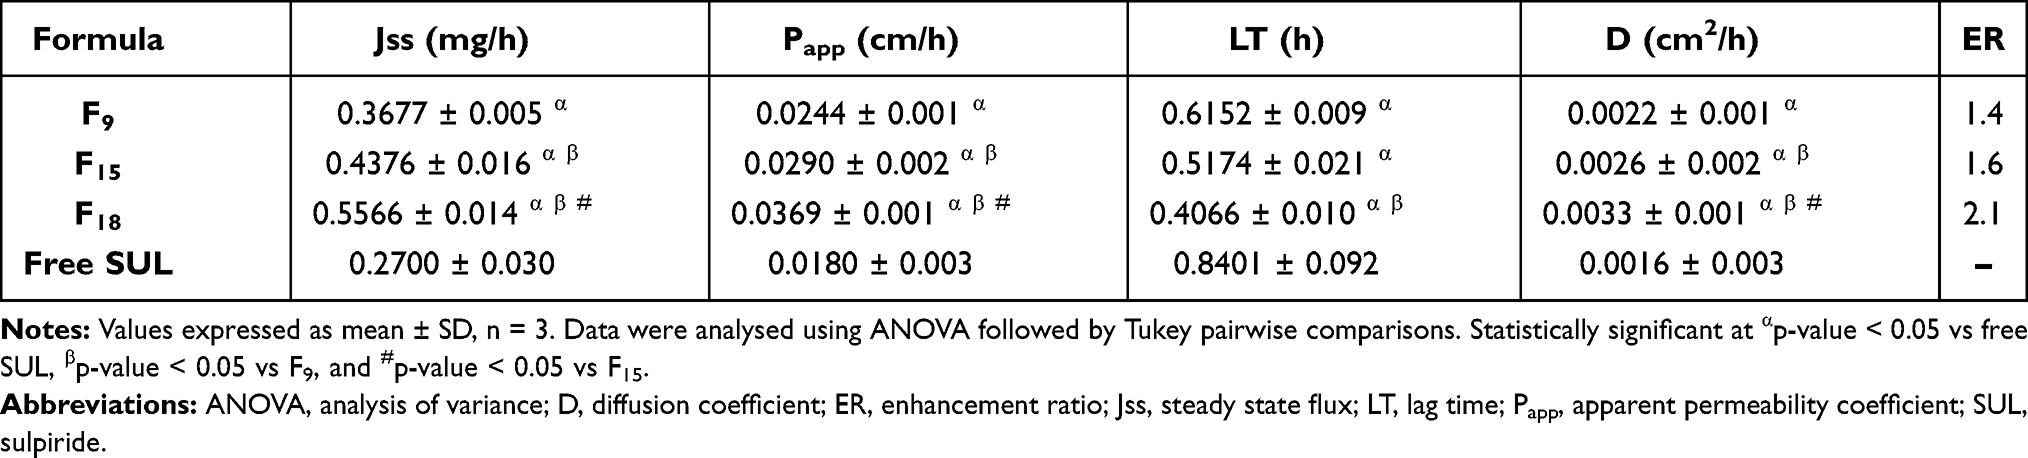 |
Table 2 Calculated Permeation Parameters of SUL-LPS Through Excised Non-Everted Rat Intestine Compared to Free SUL |
All investigated LPS displayed an obvious improvement in SUL permeation, evidenced by higher values of steady-state flux (Jss), apparent permeability (Papp), and diffusion coefficients (D), reaching up to 556.6 μg/h, 3.69 x10⁻² cm/h, and 3.30 x 10⁻³ cm2/h, respectively, (Table 2). Moreover, short lag time (LT) values, varying from 0.4066 ± 0.010 (F18) to 0.6152 ± 0.009 h (F9), were observed after the incorporation of SUL into different LPS, relative to that of free SUL (0.8401 ± 0.092 h). Hence, these outcomes confirmed the superiority of the LPS not merely in maintaining SUL release but as well increasing its intestinal permeability 2.1 times over its aqueous suspension.
Such a significant enhancement in SUL permeation (p-value < 0.05) could be ascribed to many probable facts. One of these facts is the nanometric size of the lipidic formulation, which boosted the contact surface area, thereby elongating the drug residence time. This would afford a greater chance for adhesion to the gut mucosal layer and full penetration into the intervillous space, achieving a high improvement in drug diffusion and in turn drug delivery.11,58 Furthermore, the inclusion of phospholipid (LS75) and other surfactants (PLX188), which serve as absorption enhancers, might have an important role in improving SUL absorption.
Comparing the intestinal absorptive behaviour of the selected LPS (F9, F15, and F18) revealed a significant difference (p-value < 0.05) as depicted in Figure 5D. The % of SUL permeated across the intestinal membrane was almost 35.04 ± 1.45, 43.66 ± 1.19, and 54.03 ± 2.55% w/v for F9, F15, and F18, respectively. Increasing the phospholipid concentration from 2 (F9) to 4% w/v (F15) raised Jss from 367.7 to 437.6 μg/h and consequently, elevated Papp through the intestinal membrane from 2.44 x10⁻² to 2.90 x10⁻² cm/h as well as D from 2.2 x10⁻³ to 2.6 x10⁻³ cm2/h. At a high concentration of PLX188 (F18, 2% w/v), further elevation in SUL permeation was demonstrated with Jss, Papp and D of 556.6 μg/h, 3.69 x10⁻² cm/h and 3.30 x 10⁻³ cm2/h, respectively. In fact, this absorption-enhancing impact could be a result of interacting the phospholipid head’s functional groups with the membrane components causing slight disorganization of the mucin layer and changing the lipid fluidity. This might allow deep penetration of SUL through the intestinal mucous membrane.57,59 Similar findings were noticed by Ahmed et al,60 where the incorporation of phospholipids into the nanomicellar complex increased the lipo-solubility and consequently intestinal absorption of rosuvastatin, relative to the pure drug. Besides, the presence of PLX188, a non-ionic surfactant, could enhance the mucus-penetrating properties of LPS by penetrating the epithelial cell membrane, altering membrane fluidity, disrupting its barrier function, and thus improving the transportation of SUL across intestinal tissue.11 The mucopenetrating impact of PLX was early reported by Chen et al,55 where surface modification of liposomes using PLX markedly enhanced intestinal mucosal permeability and oral absorption of cyclosporine. Besides, PLX188 could effectively block P-glycoprotein efflux transporters improving SUL permeability and hence its absorption. Its activity exerts via simultaneous depletion of intracellular ATP and membrane fluidization, resulting in modifications of the affinity of the P-gp transporter for the drug and ATP molecules.61
Thus, the ex vivo intestinal permeation attempt highlighted the role of safe phosphatidylcholine and poloxamer 188, in enhancing the desired absorption impact of LPS. In the view of the aforementioned outcomes, F18 comprising glyceryl tristearate as a lipid core supported by LS75 sheath at a ratio 1:4 w/w, respectively, as well as 2%w/v PLX188 as a stabilizing agent and 0.2%w/v SUL was selected as a promising candidate for further investigation.
Morphological Elucidation
Figure 6A is a schematic illustration of the LPS where a self-assembled phospholipid layer was embedded on the surface solid lipid core. In order to examine the shape and internal structure of the optimized SUL-LPS (F18), morphological elucidation was analyzed using transmission electron microscopy. Photomicrograph exhibited uniform, spherical, well-shaped particles with core and shell structure as illustrated in Figure 6B. The mean particle size obtained by TEM image was in good agreement with that estimated from the dynamic light scattering (DLS) technique (Figure 6C). Furthermore, it was noticed that the aggregation of nanoplatforms was effectively prevented, revealing a perfect colloidal stability as mentioned above in the ZP investigation (Figure 6D). The TEM showed a typical structure of LPS with one phospholipid monolayer concentrically around the solid lipid core as reported in earlier findings.18,44,45
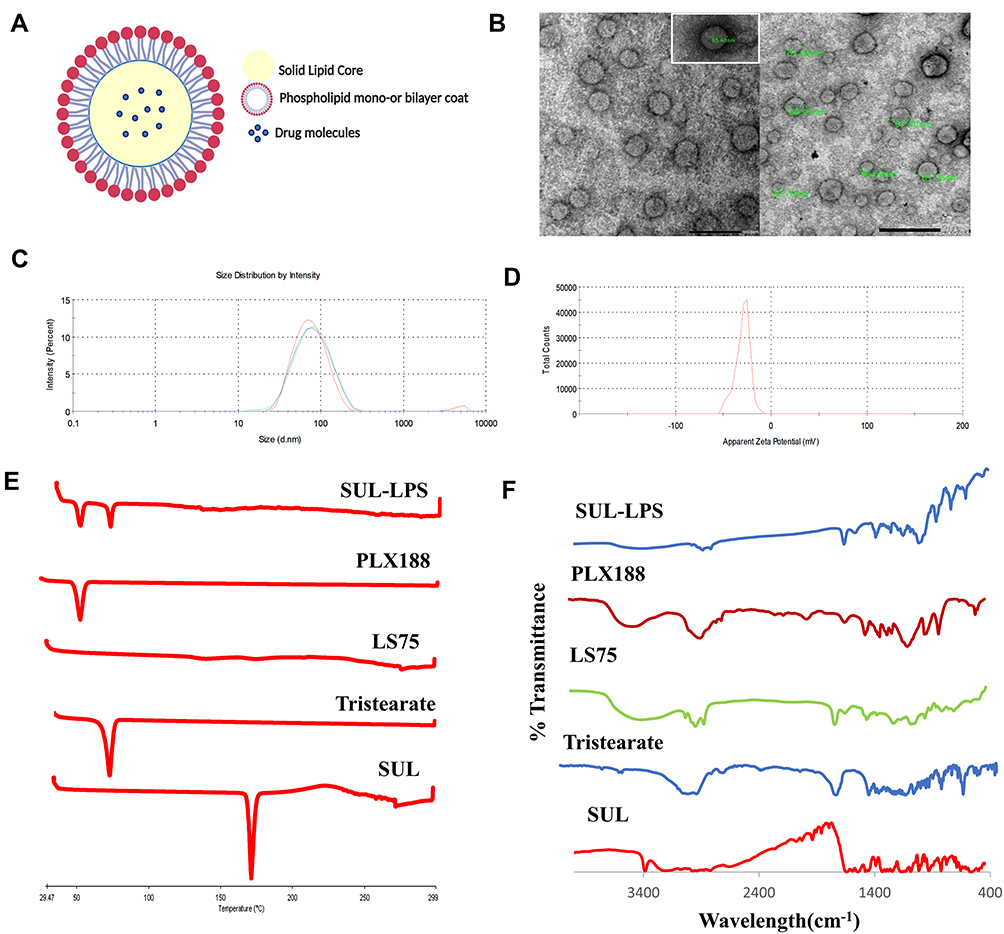 |
Figure 6 (A) Schematic representation of the LPS, (B) Transmission electron micrograph, (C) Particle size by intensity and (D) Zeta potential measurements of the optimized SUL-LPS (F18), (E) DSC thermograms and (F) FT-IR spectra of Raw SUL, Glyceryl tristearate, LS75, PLX188 and lyophilized SUL-LPS, F18. Abbreviations: DSC, differential scanning calorimetry; FT-IR, Fourier-transform infrared; LPS, lipospheres; LS75, soybean phospholipid with 70% phosphatidylcholine; PLX188, poloxmaer188; SUL; sulpiride, SUL-LPS; sulpiride-loaded lipospheres. |
Solidification of SUL-Loaded Lipospheres
In general, lyophilization is a friendly, effective, and well-known technique that converts the obtained nanocarriers into a dried form to extend and improve their long-term stability. Several saccharides were usually added as drying adjuvant to enhance the resistance of colloidal systems to freezing stress and hence prevented their agglomeration and conserved the original quality features after rehydration.50 Mannitol is widely used in lyophilization as a drying agent due to its high stability, high eutectic temperature, −1.5°C, of the mannitol-water system, and good caking properties with high mechanical strength. Thus, it could form a eutectic substance with water, which would inhibit the growth of ice crystals and reduce extrusion and mechanical damage to the nanoparticles. Also, with mannitol as lyoprotectant the lyophilized powder had good flow properties with acceptable compressibility and redispersibility indices, compared to the other lyoprotectants.62,63
The impact of freeze-drying on the physicochemical parameters of the selected SUL-LPS with different concentrations of mannitol was investigated as recorded in Table 3. All evaluated concentrations of mannitol yielded intact cake that was readily dispersible in deionized water relative to the collapsed sticky mass developed without using mannitol. Instead, the usage of 2.5% w/v mannitol, as a cryoprotectant, slightly maintained the original physicochemical properties of LPS after lyophilization, evidenced by an adequate redispersibility index of 1.17, acceptable drug remaining (89.83% w/w) as well as a relatively high yield (85.95% w/w). This gave a sign of the convenience of lyophilization as a drying process for LPS. However, a further increase in the mannitol concentration up to 5% w/v revealed non-significant improvement on the redispersibility properties of lyophilized LPS. Consequently, 2.5%w/v of mannitol was chosen as an optimum drying protectant concentration for SUL-LPS.
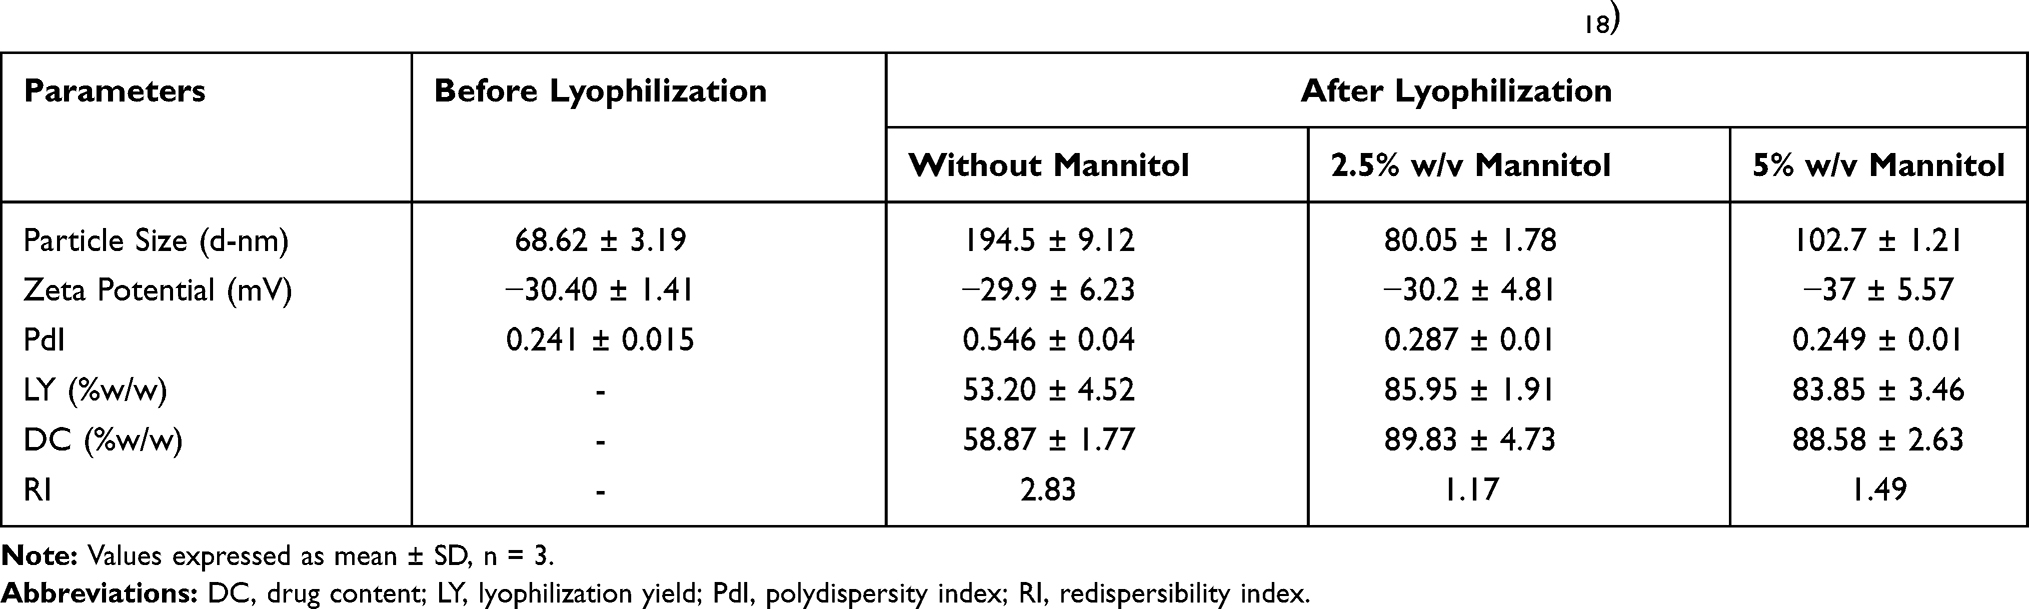 |
Table 3 Impact of Freeze-Drying on the Physicochemical Characteristics of the Optimized SUL-LPS (F18) |
Solid-State Characterization
Differential Scanning Calorimetry (DSC)
DSC is a valuable tool to study and estimate any physical modification in the crystalline pattern and thermal behaviour of SUL during the nanosizing operation. The DSC thermograms of raw SUL powder, glyceryl tristearate, LS75, PLX188, and lyophilized SUL-LPS (F18) were presented in Figure 6E. SUL showed a sharp characteristic endothermic peak at approximately 180 °C, in accordance with the early reported attempt.11 LS75 thermogram exhibited no endothermic peak, confirming its amorphous structure, while those of glyceryl tristearate and PLX188 displayed a typical endothermic peak at 73.4 and 56.2 °C, respectively. In spectrum illustrating freeze-dried LPS, the disappearance of SUL endothermic peak was noticed, indicating the possible transformation of SUL into an amorphous state or the complete encapsulation of SUL within the lipid matrix. Although the endothermic peaks of PLX 188 and glyceryl tristearate were recognized assuring the solid crystalline state of glyceryl tristearate inside the developed LPS.
Chemical Structure Determination by FTIR
For further detection of any possible change and chemical dug-lipid interaction, IR spectra of SUL, glyceryl tristearate, LS75, PLX118, and lyophilized LPS (F18) were investigated (Figure 6F). FT-IR spectrum of SUL was characterized by several peaks in the regions of 3385, 3212, and 3082 cm−1, attributed to the N-H group of sulfonamide, amide, and aromatic fragments, respectively. The spectrum also revealed an absorption band between 2968 and 2821 cm−1, corresponding to the C-H of the methylene and methyl groups. The C=O of the amide group displayed a band at 1643 cm−1 while skeletal stretching of the benzene ring could be noted at 1592 cm−1. In addition, SUL showed absorption bands at 1548, 1335, and 827 cm−1 correlated to N-H, SO2, and C-H, respectively, and characteristic peaks at 1171 and 1149 cm−1 related to C-O of the methoxy group. A similar FT-IR spectrum was early reported by Ibrahim et al.11
The IR spectrum of glyceryl tristearate exhibited several peaks at 2955 cm−1, correlated to C-H stretching vibration, at 2849 cm−1 due to –CH3 and –CH2 groups as well as at 1738 cm−1, assigned to C=O of the ester group. Other characteristic frequencies of methylene groups were recorded in the region between 716 and 1471 cm−1.64
For LS75, a broad absorption band representing the OH-stretching fragment at 3387 cm −1 was identified. Two sharp peaks relating to asymmetrical and symmetrical stretching of alkyl chains (CH2) could be observed at 2924 and 2854 cm −1, respectively. In addition, the spectrum revealed a typical peak at 1738 cm −1, assigned to the stretching vibrations of the ester carbonyl groups as well as strong characteristic phosphate group vibrational bands at 1232 and 1088 cm −1, correlated to the PO2− anti-symmetric and symmetric stretching mode, respectively. On the other hand, PLX188 characteristic bands appeared at 3457, 2876, 1344, and 1109 cm – 1, which were related to (O–H stretch, broad), (C–H, stretch aliphatic), (in-plane O–H bend) and (C–O stretch), respectively.64
Concerning the IR spectrum of SUL-LPS, it was noticed the disappearance of the characteristic absorption bands of SUL, which might be overlapped by the peaks of the other excipients. In addition, the drug might be converted into an amorphous state after encapsulation within the lipid core as observed early by DSC. Meanwhile, no additional absorption bands within the IR spectra of SUL-LPS were observed, excluding any signs of the chemical reaction between the drug and lipid as mentioned early.11
Storage Stability Appraisal
Assessment of physical stability is a crucial aspect for checking the performance of the developed LPS and the convenience of their utility as an effective drug carrier. The physical stability profile of optimized SUL-LPS (F18) was examined at 1, 2, and 3 months after storage in a desiccator at 25 ± 2°C. After rehydration, the formulation maintained the same particle size distribution, PdI, ZP, and % of drug content values with insignificant fluctuations over the period of 3 months as shown in Table S2 (supplementary material). Furthermore, HPLC chromatogram exhibited a single sharp peak at the same retention time without the appearance of any secondary peaks, furnishing further evidence for the chemical stability of SUL-LPS.
In vivo Pharmacokinetic Study
As stated before, SUL suffers from limited oral absorption with a relative bioavailability of less than 30% due to its low solubility and poor intestinal permeability.9 Thus, our ultimate objective is to achieve a potential improvement in the bioavailability of SUL by encapsulation into the optimized LPS. The lipid-based nanoparticles significantly boost the absorption of orally administrated drugs by upgrading intestinal permeability, preventing efflux transporters, and decreasing the extensive metabolism by CYP enzymes.58,65 Additionally, they significantly prolong the half-life of the drug in the circulation, increase the absorption window, and enhance the bioavailability of drugs. Thus, lower doses would be used, which in turn would lead to a lower incidence of systemic side effects.65
Concerning the feasibility of nanometric LPS as an oral delivery system for SUL, biological evaluation should be conducted in order to estimate their in vivo performance. Studying the oral pharmacokinetics could provide valuable information concerning the first phase of LPS delivery reaching the systemic circulation.66 Rats were considered as the best animal model for studying the oral pharmacokinetics, as they would provide a great estimate for the expectation of the drug’s absorption and highly mimic the intestinal mucosal barrier in humans.66 In this context, the assessment of SUL-LPS (F18) was performed with comparison to the free drug and marketed product as control by measuring SUL plasma levels at appointed intervals following oral administration of a single dose equivalent to 15 mg/kg into healthy male rats. Results were represented in Figure 7A, illustrating the oral pharmacokinetic profiles and in Table 4 showing the pharmacokinetic parameters derived from these profiles using non-compartmental analysis (t1/2, Cmax, Tmax, AUC 0–24, AUC 0-inf, CL and MRT0-inf) after SUL administration.
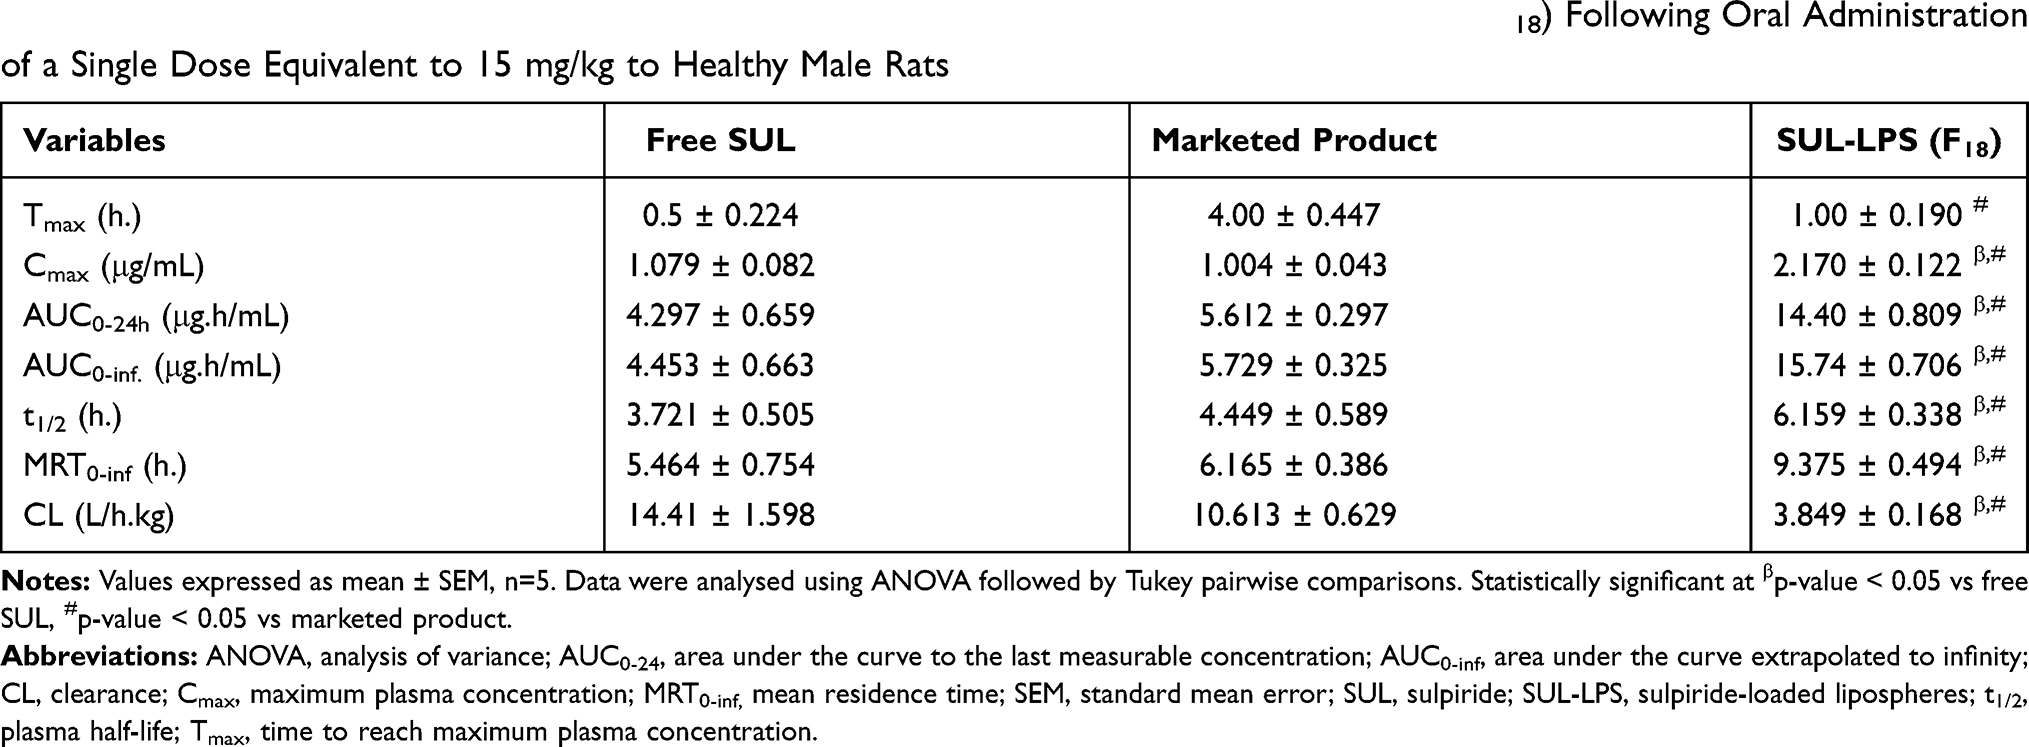 |
Table 4 Calculated Pharmacokinetic Variables of the Free SUL, Marketed Product, and SUL-LPS (F18) Following Oral Administration of a Single Dose Equivalent to 15 mg/kg to Healthy Male Rats |
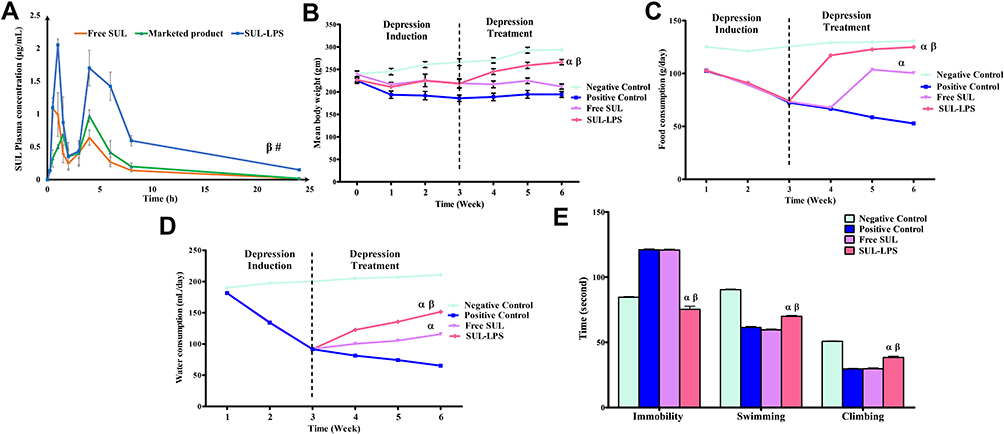 |
Figure 7 (A) Mean plasma concentration versus time profile of free SUL, marketed product and SUL-LPS (F18) following oral administration of a single dose equivalent to 15 mg/kg to healthy male rats, values were presented as mean ± SEM, n=5. Statistically significant at βp-value < 0.05 vs free SUL and #p-value < 0.05 vs marketed product. Influence of SUL-LPS and free SUL treatment on the (B) mean body weight of rats with induced depression, their (C) food and (D) water intake, as well as their (E) forced swim-induced immobility, swimming and climbing periods following oral administration of a dose equivalent to 15 mg/kg/day to rats with induced depression rats for 21 days. Results were expressed as mean ± SEM, (n=5). Statistically significant at αp-value < 0.05 vs positive control, and βp-value < 0.05 vs free SUL. Abbreviations: SEM, standard mean error; SUL, sulpiride; SUL-LPS; sulpiride-loaded lipospheres. |
SUL displayed a double-peak plasma concentration-time profile in the tested groups which were closely associated with previous reports exhibiting bi- or multi-phasic response due to different areas available for SUL absorption in the upper GIT at different absorption rates.10,67 After oral administration, free SUL and marketed product revealed a respective lower Cmax value of 1.079 ± 0.082 and 1.004 ± 0.043 μg/mL, which came in agreement with earlier findings, Table 4.5,9,10 On the contrary, nanoencapsulation of SUL within the fabricated LPS raised the Cmax value to 2.170 ± 0.122 μg/mL with slight retardation of the Tmax (1h), giving a significant increase in the amount of SUL reaching the systemic circulation by 2.01-fold (p-value < 0.05). Furthermore, SUL-LPS demonstrated a significant increase in AUC0-24 value by almost 3.4 and 2.6 times, compared with the free drug and the marketed product (p-value < 0.05). This reflects the essential role of nanoparticles in boosting drug bioavailability despite the non-significant difference in Tmax. Such results were in accordance with a study revealed by Zewail et al,49 where nanoencapsulated leflunomide showed higher AUC0-24 and Cmax values compared to that of the free candidate, whereas their Tmax values (4 h) remained the same.
Besides improving the extent of SUL absorption, LPS significantly succeeded in the elongation of the mean residence time (MRT0-inf) to 9.375 ± 0.494 h, indicating the incidence of sustained delivery with a long circulation time. This was also evident by a longer plasma half-life value (t1/2) of 6.159 ± 0.338 h, compared to that of the free drug (3.721 ± 0.505 h) and the marketed product (4.449 ± 0.589 h), Table 4. Notably, the mean blood clearance value (CL) exhibited a dramatic decline from 14.41 ± 1.598 and 10.613 ± 0.629 to 3.849 ± 0.168 L/h.kg in free drug, marketed product, and LPS, respectively.
In view of the aforementioned outcomes, the elaborated SUL-LPS showed a higher plasma level, wide absorption window along the GIT tract with a long circulation time, as evidenced by improved Cmax and AUC0–24 together with a long t1/2, demonstrating a great improvement in oral SUL bioavailability.
Upon reviewing the literature, several attempts had been conducted for enhancing the oral delivery of SUL. For instance, the oral administration of SUL solid dispersion using silica porous to rats at a dose of 10 m/kg led to a two-times increase in AUC0-24 value compared to the pure candidate.9 Moreover, Kim et al,5 reported about a three-fold increase in AUC0-24 value following oral administration of SUL-loaded quaternary microcapsules to rats at a dose of 5 mg/kg when compared to the free drug. Furthermore, the incorporation of SUL into Eudragit® RS100 microsponges was found to enhance the oral bioavailability of SUL in rabbits at a dose of 3 mg/kg by a two-fold increase relative to the unformulated candidate.
All previous attempts were carried out to improve SUL oral bioavailability of SUL and mainly focused on the traditional features to enhance bioavailability by increasing drug solubility. However, the elaborated SUL-LPS enhanced oral absorption of SUL via various approaches, as early mentioned in literature. The specific surface characteristics and morphology of LPS offered a high opportunity for better oral uptake. Their nanoscale dimensions combined with improved surface area could strongly enhance encapsulated drug diffusion and absorption through the GIT tract.42 Moreover, their surface decoration with the phospholipid (LS75), one of the cell membrane components, could stimulate SUL integration within the cells. Phospholipid could interact with mucous leading to a slight modulation of the mucosal membrane, an increase in the fluidity of the lipid bilayers and eventually promoting drug penetration along the GIT tract.59 Also, being amphiphilic moieties, they were able to penetrate the “unstirred water layer”, which serves as a permeability barrier along the GIT tract, thereby bringing the incorporated drug into closer contact with the cell membranes and enhancing its absorption.
In parallel, the distribution of the hydrophilic polyoxyethylene part of PLX188 on the surface of LPS might decrease the hydrophobic and electrostatic interactions with mucin, leading to the migration of nanocarriers through the mucus medium. Thus, the mucus clearance of LPS was minimized and as a result, intestinal penetration was improved.59 Concurrently, PLX 188 could effectively modulate the P-glycoprotein efflux system, leading to an enhancement of entrapped drug intestinal transport and bioavailability.50 These impacts came in agreement with the above-mentioned intestinal permeability enhancing action of LS75 and PLX188 noticed in the ex vivo study.
It is worth mentioning that LPS were also recognized by their capability of delaying gastric emptying rate, which elongated their gastric retention time, thereby keeping up the drug closely linked with the absorptive site for a prolonged time, conveying it in an abundant rate and eventually promoting its absorption.15
More importantly, via the digestion of lipid-based carriers, endogenous bile constituents are secreted and interact with tristearate digestion products (distearate, monostearate, and stearic acid) forming mixed micelles. These colloidal species offer a high solubilizing ambience within the GIT for poorly aqueous soluble drugs, providing a drug reservoir and facilitating their uptake by the enterocytes.58 Besides, these digestion products could selectively stimulate the endogenous chylomicron secretion, allowing lymphatic uptake ultimately reaching the systemic circulation by lymphatic drainage bypassing the hepatic first-pass metabolism.58,65 Eventually, a mechanistic overview of the significant improvement of SUL absorption might be based on four primary aspects including lymphatic uptake, P-glycoprotein efflux inhibition, surface characteristics, and nanometric size of LPS.
On account of poor permeability and oral absorption of SUL, parallel to the merits of LPS concerning safety and efficacy, lower doses of SUL encapsulated via LPS would be adequate for better therapeutic activity with respect to the free SUL suspension and consequently a lower prevalence of systemic toxicity. For supporting evidence, the antidepressant activity of free versus nanoencapsulated SUL was assessed. As well, the biocompatibility and safety of SUL-LPS were evaluated in normal healthy rats.
In vivo AntiDepressant Activity Attempt
Several animal models were previously reported to induce depression-like syndrome.68 Herein, drug-induced depression model was performed following repetitive administration of reserpine according to Shyong et al.30 Reserpine acts as monoamine re-uptake blocker that irreversibly inhibits the vesicular monoamine transporter for neuronal transmission or storage, thereby depleting catecholamine in the brain.30 Thus, IP administration (once per day for 3 weeks) of a low dose of reserpine (0.2 mg/kg) was adopted in this article for the induction of depression, followed by oral treatment with free SUL and SUL-loaded LPS at a dose equivalent to 15 mg/kg/day for successive 21 days.
Animal body weight, as well as their food and water intake, were monitored weekly till the end of the attempt as seen in Figure 7B–D, respectively. It was found that, within the first three weeks of the study, chronic administration of reserpine (0.2 mg/kg/day) exhibited significant weight loss (p-value < 0.05), in comparison to the negative healthy rats, which showed a gradual increase in their body weight (Figure 7B). Meanwhile, the percentage change in body weight of rats was recorded and was found to be 12.5% for negative healthy rats. In contrast, reserpinized animals revealed a significantly decreased body weight with almost a percentage of - 12.56%. Furthermore, by assessment of food and water consumption, reserpinized rats showed a significantly reduced food and water intake to reach almost 72.5 ± 0.51 g/day and 91.7 ± 0.22 mL/day compared to those of negative control rats (125.5 ± 0.29 g/day and 200.0 ± 0.02 mL/day, respectively, Figure 7C and D). These outcomes were in close accordance with previously reported findings, where the loss of body weight was accompanied by low appetite was an early foreteller of reserpine-induced amine depletion.69
Oral treatment with SUL-LPS together with reserpine for extra 21 days succeeded to increase the animal body weight compared to the untreated group, but free SUL treatment failed to achieve such a significant impact (Figure 7B). The increase in animal weight of SUL-LPS treated groups was 18.06% at the end of the treatment regimen. Moreover, both treated groups demonstrated a significant increase in the rat’s food and water consumption relative to those of the positive untreated group (52.80 ± 0.40 g/day and 65.30 ± 0.04 mL/day, respectively, p-value <0.05 each). In the case of the free SUL treated group, both rat’s food, and water consumptions were significantly boosted to 100.5 ± 0.08 g/day and 115.8 ± 0.51 mL/day, respectively. Meanwhile, oral treatment with SUL-LPS resulted in a further increase in the rat’s food and water intake to reach 125.0 ± 0.22 g/day and 151.5 ± 0.08 mL/day, respectively (Figure 7C and D). Based on these findings, SUL-LPS had the highest impact on counteracting the depressive effect of reserpine that was statistically significant versus free SUL treated and untreated groups (p-value < 0.05, each).
These observations were interesting fit with the aforementioned pharmacokinetic results and highlight the prominent role of SUL nanoencapsulation on boosting the antidepressant efficacy of the payload. For further confirmation, behavioural and biochemical studies have been conducted.
The forced swim test is the most utilized animal model for assessing the effectiveness of antidepressant moieties preclinically.31 In this model, each animal was obliged to swim in an inescapable cylinder of water. After an initial intense escape-oriented behaviour, the rat adopts a posture of immobility and passively floats with its heads above water without any further activity. This immobility behaviour supposed to reflect either the cessation of escape-related behavioural persistence or the development of a passive state inferring the loss of the animal’s capability to deal with stressful events.31,70 Accordingly, the duration to embrace this motionless posture, besides the total period spent for escape-directed behaviour including either swimming or climbing, were recorded in order to compare the antidepressant-like behaviour of SUL-LPS over free SUL.
As depicted in Figure 7E, IP injection of reserpine for 21 days caused a successful induction of depression as evidenced by significantly increased time of animals’ immobility, as well as a marked decline in swimming and climbing period (p-value < 0.05 each vs negative control). The impact of reserpine was partially reversed by oral treatment with SUL-LPS formulations for successive 21 days. Contrariwise, negligible impact on the animal behavioural parameters was observed upon treatment with free SUL, indicating its scanty delivery to the brain.
SUL-LPS treated group displayed the shortest duration of immobility (75.4 ± 2.29 sec) over positive control and free SUL treated groups (120.8 ± 0.73 and 121 ± 0.71 sec, p-value < 0.05 vs each; Figure 7E). Likewise, oral treatment with SUL-LPS produced a more significant elevation in the swimming period of 70 ± 0.71 sec as compared to the free SUL-treated and untreated group (59.6 ± 0.68 and 61.4 ± 0.87 sec, p-value < 0.05 vs each; Figure 7E). Additionally, rats treated via SUL-LPS depicted a significant increment in climbing time of 38.4 ± 0.93 sec, relative to 29.6 ± 0.51 and 29.8 ± 0.66 sec in the case of positive control and free SUL-treated groups, respectively (p-value < 0.05; vs each, Figure 7E). These further confirmed the capability of SUL-LPS to reduce the symptoms of depression, predicting the elevation in the level of neurotransmitters, which will be proved later by biochemical analysis.
The functional deficiency of monoamine neurotransmitters including serotonin, noradrenaline, and dopamine plays a pivotal role in the development of depression syndrome.4 Since, SUL is a specific dopamine receptor antagonist, its antidepressant potential is proceeded through preferentially blocking the presynaptic dopamine receptors and therefore increases dopamine neurotransmission. Further, SUL might cause dopamine receptor upregulation, which result in the inhibition of GABA release and a subsequent boost in serotonin release.5,6 Accordingly, the impact of free SUL and SUL-LPS on the serotonin and dopamine expressions were monitored and illustrated in Figure 8A and B, respectively.
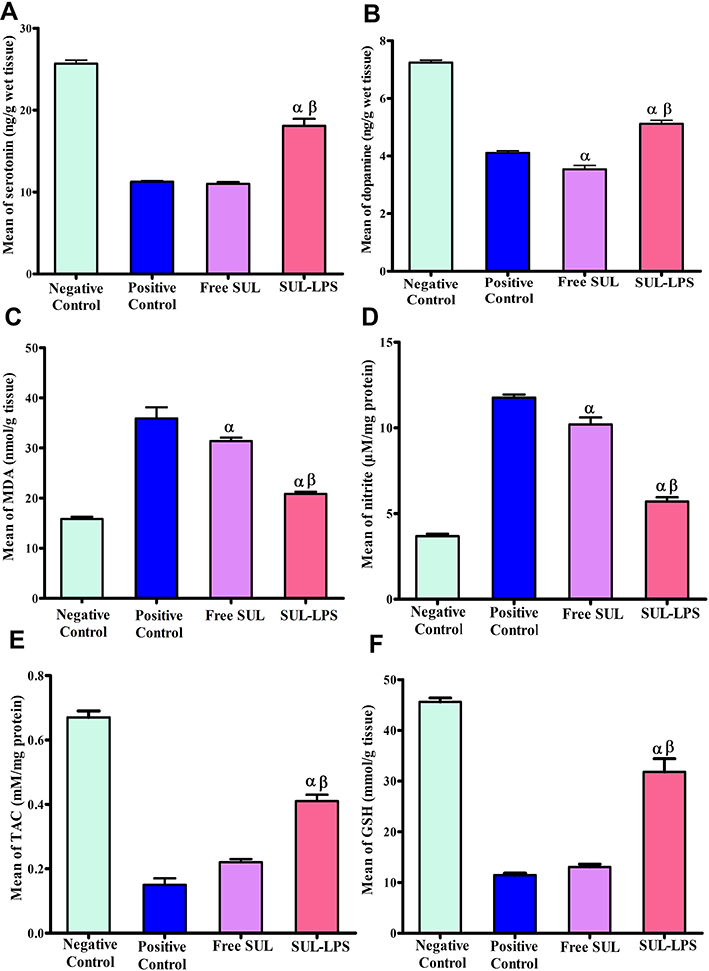 |
Figure 8 Influence of SUL-LPS and free SUL treatment on the level of monoamine neurotransmitters including (A) serotonin and (B) dopamine, as well as their influence on the level brain oxidative stress biomarkers including (C) MDA, (D) nitrite, (E) TAC and (F) GSH following oral administration of a dose equivalent to 15 mg/kg/day to rats with induced depression rats for 21 days. Results were expressed as mean ± SEM, (n=5). Statistically significant at αp-value < 0.05 vs positive control, and βp-value < 0.05 vs free SUL. Abbreviations: GSH, glutathione; MDA, malondialdehyde; SEM, standard mean error; SUL, sulpiride; SUL-LPS, sulpiride-loaded lipospheres; TAC, total antioxidant capacity. |
In the present attempt, chronic IP administration of reserpine caused a significant decrease in the level of serotonin and dopamine by 2.28 and 1.76-fold compared to healthy negative control rats, respectively (p-value < 0.05, Figure 8A and B), reflecting a successful induction of depression. Oral treatment via SUL-LPS exhibited 1.6 and 1.25 -fold elevation in both serotonin and dopamine expressions relative to the positive control group, respectively (p-value <0.05, Figure 8A and B). Comparatively, the group treated with free SUL had shown no additive impact in both levels of serotonin and dopamine as depicted in Figure 8A and B. This finding was in accordance with the behavioural test that inferred insufficient brain delivery of SUL without nanoplatforms.
Accordingly, SUL-LPS showed a prominent elevation in both serotonin and dopamine levels, which resulted in its superior antidepressant impact compared with free SUL. Moreover, their levels were nearly comparable to the negative control, inferring the success of the nanoplatforms to restore monoamine neurotransmitters.
Different studies highlighted that an increase in the free radical generation as a result of a lack of monoamines and depressive episodes may be conductive to brain oxidative stress, as well as mitochondrial and neurocellular damage.71,72 Elevated oxidative stress was mostly accompanied by abnormal alteration in the pro-oxidant and antioxidant parameters activity which can be normalized by successful antidepressant therapy. In the case of reserpinized positive control rats, a significant increase in MDA level was recorded to reach 35.9 ± 0.22 nmol/g tissue, which was 2.27-fold higher than the negative control group (p-value < 0.05, Figure 8C). The increase in MDA level was a response to excessive ROS-mediated lipid peroxidation of the cell membrane. Interestingly, treating rats with SUL-LPS succeeded in ameliorating lipid peroxidation as evidenced by significantly reduced MDA levels from 35.9 ± 0.22 nmol/g tissue, in the case of positive control to 20.84 ± 0.44 nmol/g tissue, in the case of SUL-LPS (p-value <0.05, Figure 8C). Contrariwise, the group treated via free SUL had shown a merely 1.14-fold reduction in MDA level relative to the positive control.
Additionally, a significantly increased brain level of nitrite, being an indicator of overexpression of nitric oxide species in the brain, was noticed in depressed control rats relative to healthy negative control rats (11.76 ± 0.18 versus 3.68 ± 0.14 µM/mg protein, respectively; p-value <0.05, Figure 8D). In both treated groups, nitrite expression was much significantly lower than that of the untreated positive control group (p-value < 0.05 vs each). Comparatively, treatment with SUL-LPS displayed the most prominent reduction in nitrite expression of 5.70 ± 0.25 µM/mg protein relative to 11.76 ± 0.18 and 10.20 ± 0.41 µM/mg protein in the case of positive control and free SUL-treated groups, respectively (p-value < 0.05 vs each; Figure 8D).
For further assessment of the degree of oxidative stress, the levels of TAC andGSH biomarkers were evaluated. Reserpine-treated rats significantly suppressed both TAC and GSH levels by 4.47 and 3.97-fold relative to the normal control rats (p-value < 0.05; Figure 8E and F, respectively). Oral treatment with SUL-LPS showed a significant elevation in the TAC level over the positive control group, while free SUL treatment failed to attain such a significant impact. SUL-LPS revealed the upregulation of TAC level reaching a value of 0.41± 0.02 mM/mg protein, which was 2.73 and 1.86-fold higher than the positive control and free SUL treated groups, respectively (p-value < 0.05 vs each; Figure 8E). Furthermore, the level of GSH, the major free radical scavenger in the brain, was significantly increased in the case of treatment with SUL-LPS by 2.77 and 2.43-fold relative to positive control and free SUL groups, respectively (p-value < 0.05 vs each; Figure 8F).
Overall, after 21 days of treatment, the developed nanoplatforms revealed clearly superior antidepressant efficacy accompanied by a prominent enhancement in the brain oxidative stress state compared to the free drug. Our behavioural and biochemical outcomes perfectly correlated with the above-mentioned data supporting the merits of LPS in boosting the uptake of SUL via prolonging drug release, enhancing its intestinal permeation, improving its oral bioavailability, and subsequent brain delivery with optimum concentration for antidepressant activity.
In vivo Nanotoxicological Attempt
Evaluating the toxicity of drug delivery nanoplatforms is a nowadays mandatory aspect to address, especially for those used in chronic therapy. Nanoplatforms as drug delivery systems demonstrate novel characteristics and functions defined by their small size and large surface area-related properties. Unluckily, these outstanding features might affect their safety and biocompatibility.73 Once nanoplatforms enter the systemic circulation, they are subjected to first-pass metabolism within the liver where they may accumulate or distribute via the vasculature to other organs and tissues of the human body. Therefore, the usage of nanoparticles might cause abnormal hematological, biochemical, or physiological responses after multiple administrations.73 Recently, in vivo subacute toxicity studies, ranging from 14 to 21 days, were reported to initially assess the toxicity of different nanoplatforms.19,42,74
In this regard, the possible toxic effect of blank and SUL-LPS was evaluated following oral administration of a dose equivalent to 15 mg/kg/day to healthy male rats for 21 days to mimic the duration of efficacy study. The mortality, behaviour alterations, gross anatomy, and biochemical tests (liver, renal, and brain functions) were monitored. Histopathological evaluation of different body organs was also performed.
Animal Observation
To address the above-mentioned issues, animals were observed regularly for 21 days and no mortality occurred in treated groups throughout the whole study. Moreover, none of the toxicity signs such as gross changes in animal’s skin and fur coloration, mucus membrane condition, and motor activity were noticed up to the end of the study. In the same manner, by weekly assessment of animals’ dietary status, a gradual increment in body weight of the control and LPS-treated rats over the period of 21 days occurred, as shown in Figure 9A. Eventually, the % increase in body weight of treated rats was comparable and found to be 7.66, 10.36, and 10.40% for the negative control, blank, and SUL-LPS, respectively, without any significant difference (Figure 9B). Additionally, the quantities of daily food (g/day) and water (mL/day) intake were determined, showing insignificant variations (p-value > 0.05) between the studied groups (Figure 9C and D). The feed consumption of the treated and the negative untreated groups followed a comparable increase pattern throughout the study period, reflecting the normal metabolism of the animals with perfect utilization of proteins and other nutrients. Thus, these findings highlight the enhancement in the animal s’ dietary state, indicating good health and precluding the toxicity of developed nanoparticles. Further clinical evaluation after animals sacrificing, revealed no organomegaly or other changes in the texture and shape of the animals’ organs (liver, kidney, spleen, heart, brain, and lung). Meanwhile, statistical analysis showed insignificant variation in the calculated % of organ weight relative to body weight between the control and treated groups (p-value > 0.05) as represented in Figure 9E.
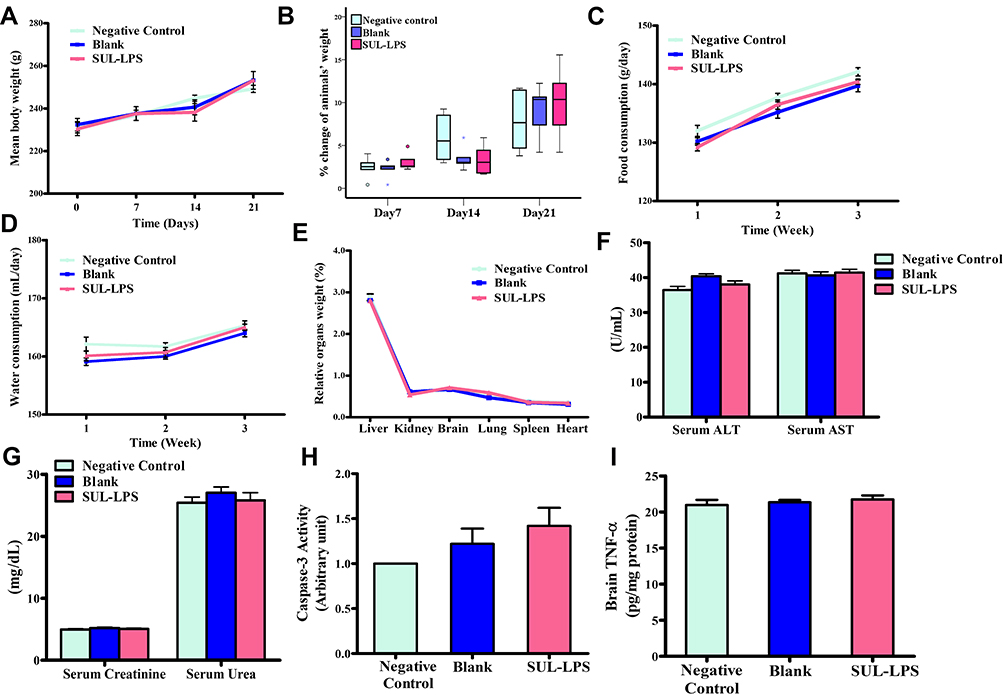 |
Figure 9 Influence of blank and SUL-LPS on (A) animals’ body weight, (B) % of animals’ body weight change (C) animals’ food consumption, (D) animals’ water consumption, (E) % of animals’ relative organs weights, (F) hepatic biomarkers, (G) renal biomarkers, (H) brain Caspase-3 activity and (I) brain TNF-α following oral administration of a dose equivalent to 15 mg/kg/day to healthy male rats for 21 days. Results were expressed as mean ± SEM, (n=5). F-test (ANOVA) followed by Tukey pairwise comparisons (% of weight change at day 21 (F= 1.735, p-value= 0.784); food consumption at day 21 (F= 1.823, p-value= 0.164); water consumption at day 21 (F= 2.794, p-value= 0.054); % relative organs weights, brain (F= 1.168, p-value= 0.355); liver (F= 0.613, p-value= 0.658); kidney (F= 2.699, p-value= 0.060); spleen (F= 0.926, p-value= 0.468); heart (F= 2.385, p-value= 0.086); lung (F= 2.766, p-value= 0.056) ALT (F= 2.707, p-value= 0.060); AST (F= 0.287, p-value= 0.883); urea (F= 0.643, p-value= 0.638); creatinine (F= 2.633, p-value= 0.065); Caspase-3 (F= 1.544, p-value= 0.228); TNF- α (F= 1.188, p-value= 0.346)). Abbreviations: ALT, alanine aminotransferase; ANOVA, analysis of variance; AST, aspartate aminotransferase; SEM, standard mean error; SUL, sulpiride; SUL-LPS, sulpiride-loaded lipospheres; TNF-α, tumor necrosis factor-alpha. |
Biochemical Analysis
Additionally, for the assessment of any possible systemic toxicity of the given formulation, biochemical indices related to liver and kidney functions were assessed within the control and treated groups. In this regard, the serum levels of ALT and AST were measured being the main reliable biomarkers of liver damage or injury. As demonstrated in Figure 9F, LPS revealed normal enzyme levels, giving a non-significant difference (p-value > 0.05) from the untreated control group. In the same manner, the level of kidney profile, serum urea, and creatinine, were examined to investigate the impact of developed nanoplatforms on the kidney. There was an insignificant difference (p-value > 0.05) of serum creatinine and urea levels among the control and all experimental groups, Figure 9G. Thus, repetitive administration of developed formulation for 21 consecutive days did not cause any modification in the metabolic process of rats. For further confirmation of nanoplatforms safety, the possible neurotoxic impact of the administrated formulation was evaluated. The levels of caspase-3 and TNF-α in the brain were estimated to be the main indicators of neural apoptosis and inflammatory reaction, respectively. No neurotoxic effect was caused by blank and SUL-LPS, as evidenced by the insignificant difference (p-value > 0.05) in the measured levels of caspase-3 and TNF-α with respect to the values of negative untreated control (Figure 9H and I). The latter outcomes revealed the good safety profile of blank and loaded LPS following multiple oral administration for 21 days.
Histopathological Examination
To further confirm or exclude the tissue combability of the developed nanoplatforms, histopathological examination of all isolated organs (brain, intestine, stomach, kidney, and liver) was performed in order to closely monitor cellular changes following multiple dosing of blank and SUL- LPS formulations for 21 days. These vital organs were chosen since the brain is the target organ for drug action, the stomach and intestine are the main absorption sites of the drug, the liver is responsible for nanoparticle uptake and metabolism and the kidney is the excretory organ for the drug and its metabolites.
Examination of the dissected organs of the negative control rats revealed classical architecture within normal histological limits. Brain sections showed normal neuroglial cells arranged in several layers with normal vasculature, Figure 10A. Also, examination of rat’s small intestine revealed a unique structure of intestine mucosa that is thrown up into a large number of folds. On each fold, the mucosa demonstrated normal projecting villi without blunting, erosion, and atrophy with normal mucin-secreting cells and goblet cells as well as invaginating intestinal crypts, lined by many goblet cells, Figure 10B. In the same manner, Figure 10C illustrated classical features of gastric mucosa which is thrown up into multiple longitudinal folds or gastric rugae. The mucosa showed narrow short regular gastric pits lined with simple columnar mucus-secreting epithelium. The lamina propria showed normal glands and vasculature. On the other avenue, photomicrograph of kidney sections collected from negative control rats exhibited a highly organized structure of renal cortical tissue with normal glomeruli, renal vasculature, and tubules. The proximal convoluted tubules appeared with intact limiting basement membrane and their lumens were lined by cuboidal cells together with well-developed brush borders, Figure 10D. Eventually, liver sections showed eosinophilic granular hepatocytes with vesicular nuclei arranged in anastomosing hepatic cords radiating from central veins and separated by well-defined hepatic sinusoids, as shown in Figure 10E.
 |
Figure 10 Photomicrograph of representative tissues within normal histologic limits of the brain (A, F and K), intestinal mucosa (B, G, and L), gastric mucosa (C, H and M), kidney (D, I and N) and liver (E, J and O) in negative control, blank, and SUL-LPS, respectively, ×200, H&E. Abbreviations: H&E, hematoxylin and eosin; SUL-LPS, sulpiride-loaded lipospheres. |
Similarly, all examined organs of rats treated with blank and SUL-LPS formulations demonstrated almost normal characteristic features without any marked signs of vascular or tissue injury, Figure 10F–O. Mucosal ulceration, nuclear pyknosis, cellular degeneration, and cytoplasmic vacuolation were not found in any examined tissues, denying the presence of any cytotoxic effect. These findings were in close accordance with those obtained previously by biochemical analysis, confirming the safety and biocompatibility of the studied formulation after 21day repetitive oral administration.
Conclusion
SUL-LPS were successfully elaborated via a well-established simple solvent evaporation technique using glyceryl tristearate as a lipid core supported by LS75 sheath at a ratio 1:4 w/w, respectively, as well as 2%w/v PLX188 as a stabilizing agent and 0.2%w/v SUL. The optimized LPS demonstrated adequate particle size, PdI, and ZP together with acceptable incorporation efficiency and sustained release manner over 8 h. The lyophilized platform also demonstrated high colloidal stability up to 3 months. LPS significantly enhanced the intestinal permeability of SUL ex vivo with and minimal mucin interaction as evidenced by turbidimetric, size, and ZP measurements. Moreover, in vivo oral pharmacokinetic attempts demonstrated an almost 3.4-fold improvement in the oral bioavailability of SUL after encapsulation into LPS. Meanwhile, SUL-LPS had a superior impact over the free drug on reversing the pro-depressive effect of reserpine, as evident from elevated serotonin and dopamine brain levels and enhanced locomotor activities of treated animals. As well, SUL-LPS effectively succeeded to attenuate the level of brain oxidative stress parameters compared to the free drug. Also, upon repetitive oral administration, SUL-LPS proved its biocompatibility on the brain, liver, intestine, stomach, and kidney without any toxicological sign. Overall, the development of SUL-LPS, not only, exhibited promising in vitro characteristics but also paving the way for an efficient attempt for improving the oral delivery and the pharmacological action of such poorly permeable drugs.
Acknowledgment
The authors would likely thank IOI Oleo Gmbh, Germany for the kind gift of Dynasan® 118 used in this study.
Disclosure
The authors report no conflicts of interest in this work.
References
1. World Health Organization. Depression; 2020. Available from: https://www.who.int/news-room/fact-sheets/detail/depression.
2. Haque S, Md S, Sahni JK, Ali J, Baboota S. Development and evaluation of brain targeted intranasal alginate nanoparticles for treatment of depression. J Psychiatr Res. 2014;48(1):1–12. doi:10.1016/j.jpsychires.2013.10.011
3. Kircanski K, Joormann J, Gotlib IH. Cognitive aspects of depression. Wiley Interdiscip Rev Cogn Sci. 2012;3(3):301–313. doi:10.1002/wcs.1177
4. Belujon P, Grace AA. Dopamine system dysregulation in major depressive disorders. Int J Neuropsychopharmacol. 2017;20(12):1036–1046. doi:10.1093/ijnp/pyx056
5. Kim DS, Kim DW, Kim KS, et al. Development of a novel l-sulpiride-loaded quaternary microcapsule: effect of TPGS as an absorption enhancer on physicochemical characterization and oral bioavailability. Colloids Surf B Biointerfaces. 2016;147:250–257. doi:10.1016/j.colsurfb.2016.08.010
6. Nakazato T, Horikawa HPM, Akiyama A. The dopamine D2 receptor antagonist sulpiride causes long-lasting serotonin release. Eur J Pharmacol. 1998;363(1):29–34. doi:10.1016/S0014-2999(98)00796-1
7. Ruether E, Schreyger F, Voegtle-Junkert U. Sulpiride in the treatment of depression - A review on safety and efficacy. Psychopharmakotherapie. 2007;14:3–13.
8. Chitneni M, Peh KK, Darwis D, Abdulkarim M, Abdullah GZ, Qureshi MJ. Intestinal permeability studies of sulpiride incorporated into self-microemulsifying drug delivery system (SMEDDS). Pak J Pharm Sci. 2011;24(2):113–121.
9. Kim DS, Choi JS, Kim DW, et al. Comparison of solvent-wetted and kneaded l-sulpiride-loaded solid dispersions: powder characterization and in vivo evaluation. Int J Pharm. 2016;511(1):351–358. doi:10.1016/j.ijpharm.2016.07.006
10. Younis MA, El-Zahry MR, Tallat MA, Tawfeek HM. Sulpiride gastro-retentive floating microsponges; analytical study, in vitro optimization and in vivo characterization. J Drug Target. 2020;28:386–397. doi:10.1080/1061186X.2019.1663526
11. Ibrahim WM, AlOmrani AH, Yassin AEB. Novel sulpiride-loaded solid lipid nanoparticles with enhanced intestinal permeability. Int J Nanomedicine. 2014;9:129–144. doi:10.2147/IJN.S54413
12. Liu Y, Yang T, Wei S, et al. Mucus adhesion- and penetration-enhanced liposomes for paclitaxel oral delivery. Int J Pharm. 2018;537(1–2):245–256. doi:10.1016/j.ijpharm.2017.12.044
13. Guada M, Lasa-Saracibar B, Lana H, Dios-Vieitez Mdel C, Blanco-Prieto MJ. Lipid nanoparticles enhance the absorption of cyclosporine A through the gastrointestinal barrier: in vitro and in vivo studies. Int J Pharm. 2016;500(1–2):154–161. doi:10.1016/j.ijpharm.2016.01.037
14. Dudala TB, Yalavarthi PR, Vadlamudi HC, et al. A perspective overview on lipospheres as lipid carrier systems. Int J Pharm Investig. 2014;4(4):149–155. doi:10.4103/2230-973X.143112
15. Elgart A, Cherniakov I, Aldouby Y, Domb AJ, Hoffman A. Lipospheres and pro-nano lipospheres for delivery of poorly water soluble compounds. Chem Phys Lipids. 2012;165(4):438–453. doi:10.1016/j.chemphyslip.2012.01.007
16. El-Zaafarany GM, Soliman ME, Mansour S, Awad GA. Identifying lipidic emulsomes for improved oxcarbazepine brain targeting: in vitro and rat in vivo studies. Int J Pharm. 2016;503(1–2):127–140. doi:10.1016/j.ijpharm.2016.02.038
17. Esposito E, Sguizzato M, Bories C, Nastruzzi C, Cortesi R. Production and characterization of a clotrimazole liposphere gel for candidiasis treatment. Polymers. 2018;10(2):160. doi:10.3390/polym10020160
18. Nasr M, Mansour S, Mortada ND, El Shamy AA. Lipospheres as carriers for topical delivery of aceclofenac: preparation, characterization and in vivo evaluation. AAPS PharmSciTech. 2008;9(1):154–162. doi:10.1208/s12249-007-9028-2
19. Radwan SE, Sokar MS, Abdelmonsif DA, El-Kamel AH. Mucopenetrating nanoparticles for enhancement of oral bioavailability of furosemide: in vitro and in vivo evaluation/sub-acute toxicity study. Int J Pharm. 2017;526(1–2):366–379. doi:10.1016/j.ijpharm.2017.04.072
20. Makled S, Nafee N, Boraie N. Nebulized solid lipid nanoparticles for the potential treatment of pulmonary hypertension via targeted delivery of phosphodiesterase-5-inhibitor. Int J Pharm. 2017;517(1–2):312–321. doi:10.1016/j.ijpharm.2016.12.026
21. Ezzat HM, Elnaggar YSR, Abdallah OY. Improved oral bioavailability of the anticancer drug catechin using chitosomes: design, in-vitro appraisal and in-vivo studies. Int J Pharm. 2019;565:488–498. doi:10.1016/j.ijpharm.2019.05.034
22. Abdel-Hay MH, Ragab MAA, Ahmed HM, Mohyeldin SM. The use of Arrhenius kinetics to evaluate different hydrolytic stability of amiloride hydrochloride and cyclopenthiazide using chromatographic methods. Microchem J. 2019;147:682–690. doi:10.1016/j.microc.2019.03.073
23. Maier W, Benkert O. Treatment of chronic depression with sulpiride: evidence of efficacy in placebo-controlled single case studies. Psychopharmacology. 1994;115(4):495–501. doi:10.1007/BF02245573
24. Nair AB, Jacob S. A simple practice guide for dose conversion between animals and human. J Basic Clin Pharm. 2016;7(2):27–31. doi:10.4103/0976-0105.177703
25. Paget GE, Barnes JM. CHAPTER 6 Toxicity Tests. In: Laurence DR, Bacharach AL, editors. Evaluation of Drug Activities. Academic Press; 1964:135–166.
26. Lin G, Wu H, Wang Z, et al. Determination of sulpiride in rabbit plasma by LC‐ESI‐MS and its Application to a pharmacokinetic study. LAT AM J PHARM. 2011;30(9):1775–1779.
27. Kim D, Kim W, Jeong S, Kim D, Yoo JW, Jung Y. Therapeutic switching of sulpiride, an anti-psychotic and prokinetic drug, to an anti-colitic drug using colon-specific drug delivery. Drug Deliv Transl Res. 2019;9(1):334–343. doi:10.1007/s13346-018-00599-7
28. Nobilis M, Vybíralová Z, Szotáková B, Sládková K, Kuneš M, Svoboda Z. High-performance liquid chromatographic determination of tiapride and its Phase I metabolite in blood plasma using tandem UV photodiode-array and fluorescence detection. J Chromatogr B Analyt Technol Biomed Life Sci. 2011;879(32):3845–3852. doi:10.1016/j.jchromb.2011.10.032
29. Zhang Y, Huo M, Zhou J, Xie S. PKSolver: an add-in program for pharmacokinetic and pharmacodynamic data analysis in Microsoft Excel. Comput Methods Programs Biomed. 2010;99(3):306–314. doi:10.1016/j.cmpb.2010.01.007
30. Shyong Y-J, Wang M-H, Kuo L-W, et al. Mesoporous hydroxyapatite as a carrier of olanzapine for long-acting antidepression treatment in rats with induced depression. J Control Release. 2017;255:62–72. doi:10.1016/j.jconrel.2017.03.399
31. Porsolt RD, Anton G, Blavet N, Jalfre M. Behavioural despair in rats: a new model sensitive to antidepressant treatments. Eur J Pharmacol. 1978;47(4):379–391. doi:10.1016/0014-2999(78)90118-8
32. Detke MJ, Rickels M, Lucki I. Active behaviors in the rat forced swimming test differentially produced by serotonergic and noradrenergic antidepressants. Psychopharmacology. 1995;121(1):66–72. doi:10.1007/BF02245592
33. Wills E. Mechanisms of lipid peroxide formation in animal tissues. Biochem J. 1966;99(3):667. doi:10.1042/bj0990667
34. Ozmen H, Polat F, Cukurovali A. Spectrophotometric determination of nitrite in water samples with 4‐(1‐methyl‐1‐mesitylcyclobutane‐3‐yl)‐2‐aminothiazole. Anal Lett. 2006;39(4):823–833. doi:10.1080/00032710600611590
35. Koracevic D, Koracevic G, Djordjevic V, Andrejevic S, Cosic V. Method for the measurement of antioxidant activity in human fluids. J Clin Pathol. 2001;54(5):356–361. doi:10.1136/jcp.54.5.356
36. Ellman GL. Tissue sulfhydryl groups. Arch Biochemistry Biophys. 1959;82(1):70–77. doi:10.1016/0003-9861(59)90090-6
37. Reitman S, Frankel S. A colorimetric method for the determination of serum glutamic oxalacetic and glutamic pyruvic transaminases. Am J Clin Pathol. 1957;28(1):56–63. doi:10.1093/ajcp/28.1.56
38. Tabacco A, Meiattini F, Moda E, Tarli P. Simplified enzymic/colorimetric serum urea nitrogen determination. Clin Chem. 1979;25(2):336–337. doi:10.1093/clinchem/25.2.336a
39. Heinegård D, Tiderström G. Determination of serum creatinine by a direct colorimetric method. Clin Chim Acta. 1973;43(3):305–310. doi:10.1016/0009-8981(73)90466-X
40. Casciola-Rosen L, Nicholson DW, Chong T, et al. Apopain/CPP32 cleaves proteins that are essential for cellular repair: a fundamental principle of apoptotic death. The J Exp Med. 1996;183(5):1957–1964. doi:10.1084/jem.183.5.1957
41. Siekmann B, Westesen K. Investigations on solid lipid nanoparticles prepared by precipitation in o/w emulsions. Eur J Pharm Biopharm. 1996;42(2):104–109.
42. Nazief AM, Hassaan PS, Khalifa HM, Sokar MS, El-Kamel AH. Lipid-based gliclazide nanoparticles for treatment of diabetes: formulation, pharmacokinetics, pharmacodynamics and subacute toxicity study. Int J Nanomedicine. 2020;15:1129–1148Z. doi:10.2147/IJN.S235290
43. Dudhipala N, Veerabrahma K. Improved anti-hyperlipidemic activity of rosuvastatin calcium via lipid nanoparticles: pharmacokinetic and pharmacodynamic evaluation. Eur J Pharm Biopharm. 2017;110:47–57. doi:10.1016/j.ejpb.2016.10.022
44. Jain A, Doppalapudi S, Domb AJ, Khan W. Tacrolimus and curcumin co-loaded liposphere gel: synergistic combination towards management of psoriasis. J Control Release. 2016;243:132–145. doi:10.1016/j.jconrel.2016.10.004
45. Jain A, Pooladanda V, Bulbake U, et al. Liposphere mediated topical delivery of thymoquinone in the treatment of psoriasis. Nanomedicine. 2017;13(7):2251–2262. doi:10.1016/j.nano.2017.06.009
46. Sebaaly C, Greige-Gerges H, Stainmesse S, Fessi H, Charcosset C. Effect of composition, hydrogenation of phospholipids and lyophilization on the characteristics of eugenol-loaded liposomes prepared by ethanol injection method. Food Biosci. 2016;15:1–10. doi:10.1016/j.fbio.2016.04.005
47. Ekambaram P, Abdul HSA. Formulation and evaluation of solid lipid nanoparticles of ramipril. J Young Pharm. 2011;3(3):216–220. doi:10.4103/0975-1483.83765
48. Martins S, Tho I, Souto E, Ferreira D, Brandl M. Multivariate design for the evaluation of lipid and surfactant composition effect for optimisation of lipid nanoparticles. Eur J Pharm Sci. 2012;45(5):613–623. doi:10.1016/j.ejps.2011.12.015
49. Zewail M, Nafee N, Helmy MW, Boraie N. Coated nanostructured lipid carriers targeting the joints - An effective and safe approach for the oral management of rheumatoid arthritis. Int J Pharm. 2019;567:118447. doi:10.1016/j.ijpharm.2019.118447
50. El-Lakany SA, Elgindy NA, Helmy MW, Abu-Serie MM, Elzoghby AO. Lactoferrin-decorated vs PEGylated zein nanospheres for combined aromatase inhibitor and herbal therapy of breast cancer. Expert Opin Drug Deliv. 2018;15(9):835–850. doi:10.1080/17425247.2018.1505858
51. Ravi PR, Aditya N, Kathuria H, Malekar S, Vats R. Lipid nanoparticles for oral delivery of raloxifene: optimization, stability, in vivo evaluation and uptake mechanism. Eur J Pharm Biopharm. 2014;87(1):114–124. doi:10.1016/j.ejpb.2013.12.015
52. Liu D, Cito S, Zhang Y, Wang CF, Sikanen TM, Santos HA. A versatile and robust microfluidic platform toward high throughput synthesis of homogeneous nanoparticles with tunable properties. Adv Mater. 2015;27(14):2298–2304. doi:10.1002/adma.201405408
53. Jensen LB, Magnussson E, Gunnarsson L, Vermehren C, Nielsen HM, Petersson K. Corticosteroid solubility and lipid polarity control release from solid lipid nanoparticles. Int J Pharm. 2010;390(1):53–60. doi:10.1016/j.ijpharm.2009.10.022
54. Chen CC, Tsai TH, Huang ZR, Fang JY. Effects of lipophilic emulsifiers on the oral administration of lovastatin from nanostructured lipid carriers: physicochemical characterization and pharmacokinetics. Eur J Pharm Biopharm. 2010;74(3):474–482. doi:10.1016/j.ejpb.2009.12.008
55. Chen D, Xia D, Li X, et al. Comparative study of Pluronic® F127-modified liposomes and chitosan-modified liposomes for mucus penetration and oral absorption of cyclosporine A in rats. Int J Pharm. 2013;449(1):1–9. doi:10.1016/j.ijpharm.2013.04.002
56. Nafee N, Makled S, Boraie N. Nanostructured lipid carriers versus solid lipid nanoparticles for the potential treatment of pulmonary hypertension via nebulization. Eur J Pharm Sci. 2018;125:151–162. doi:10.1016/j.ejps.2018.10.003
57. Luo Z, Liu Y, Zhao B, et al. Ex vivo and in situ approaches used to study intestinal absorption. J Pharmacol Toxicol Methods. 2013;68(2):208–216. doi:10.1016/j.vascn.2013.06.001
58. Poovi G, Damodharan N. Lipid nanoparticles: a challenging approach for oral delivery of BCS Class-II drugs. Futur J Pharm Sci. 2018;4(2):191–205. doi:10.1016/j.fjps.2018.04.001
59. Li X, Chen D, Le C, et al. Novel mucus-penetrating liposomes as a potential oral drug delivery system: preparation, in vitro characterization, and enhanced cellular uptake. Int J Nanomedicine. 2011;6:3151–3162. doi:10.2147/IJN.S25741
60. Ahmed MA, Al-mahallawi AM, El-Helaly SN, Abd-Elsalam WH. The effect of the saturation degree of phospholipid on the formation of a novel self-assembled nano-micellar complex carrier with enhanced intestinal permeability. Int J Pharm. 2019;569:118567. doi:10.1016/j.ijpharm.2019.118567
61. Rana H, Sunitha B, Kumar S, Avinash M. Influence of Poloxamer188 on the Intestinal Transport of Diltiazem Hydrochloride. IJIRSET. 2015;4:6922–6925. doi:10.15680/IJIRSET.2015.0408181
62. Jain S, Sharma JM, Jain AK, Mahajan RR. Surface-stabilized lopinavir nanoparticles enhance oral bioavailability without coadministration of ritonavir. Nanomedicine. 2013;8(10):1639–1655. doi:10.2217/nnm.12.181
63. Zhang H, Zhang F-M, Yan S-J. Preparation, in vitro release, and pharmacokinetics in rabbits of lyophilized injection of sorafenib solid lipid nanoparticles. Int J Nanomedicine. 2012;7:2901–2910. doi:10.2147/IJN.S32415
64. Rudhrabatla VP, Sudhakar B, Reddy KS. In vitro and in vivo assessment of designed melphalan loaded stealth solid lipid nanoparticles for parenteral delivery. Bionanoscience. 2019;1–23.
65. Das S, Chaudhury A. Recent advances in lipid nanoparticle formulations with solid matrix for oral drug delivery. AAPS PharmSciTech. 2011;12(1):62–76. doi:10.1208/s12249-010-9563-0
66. Fotaki N. Pros and cons of methods used for the prediction of oral drug absorption. Expert Rev Clin Pharmacol. 2009;2(2):195–208. doi:10.1586/17512433.2.2.195
67. Helmy SA. Therapeutic drug monitoring and pharmacokinetic compartmental analysis of sulpiride double-peak absorption profile after oral administration to human volunteers. Biopharm Drug Dispos. 2013;34(5):288–301. doi:10.1002/bdd.1843
68. Planchez B, Surget A, Belzung C. Animal models of major depression: drawbacks and challenges. J Neural Transm. 2019;126(11):1383–1408.
69. Park B-K, Kim YR, Kim YH, et al. Antidepressant-like effects of gyejibokryeong-hwan in a mouse model of reserpine-induced depression. Biomed Res Int. 2018;2018:5845491. doi:10.1155/2018/5845491
70. Yankelevitch-Yahav R, Franko M, Huly A, Doron R. The forced swim test as a model of depressive-like behavior. J Vis Exp. 2015;(97):52587.
71. Michel TM, Pülschen D, Thome J. The role of oxidative stress in depressive disorders. Curr Pharm Des. 2012;18(36):5890–5899. doi:10.2174/138161212803523554
72. Siwek M, Sowa-Kućma M, Dudek D, et al. Oxidative stress markers in affective disorders. Pharmacol Rep. 2013;65(6):1558–1571. doi:10.1016/S1734-1140(13)71517-2
73. Yildirimer L, Thanh NT, Loizidou M, Seifalian AM. Toxicology and clinical potential of nanoparticles. Nano Today. 2011;6(6):585–607. doi:10.1016/j.nantod.2011.10.001
74. Etman SM, Elnaggar YSR, Abdelmonsif DA, Abdallah OY. Oral brain-targeted microemulsion for enhanced piperine delivery in alzheimer’s disease therapy: in vitro appraisal, in vivo activity, and nanotoxicity. AAPS PharmSciTech. 2018;19(8):3698–3711. doi:10.1208/s12249-018-1180-3
 © 2021 The Author(s). This work is published and licensed by Dove Medical Press Limited. The full terms of this license are available at https://www.dovepress.com/terms.php and incorporate the Creative Commons Attribution - Non Commercial (unported, v3.0) License.
By accessing the work you hereby accept the Terms. Non-commercial uses of the work are permitted without any further permission from Dove Medical Press Limited, provided the work is properly attributed. For permission for commercial use of this work, please see paragraphs 4.2 and 5 of our Terms.
© 2021 The Author(s). This work is published and licensed by Dove Medical Press Limited. The full terms of this license are available at https://www.dovepress.com/terms.php and incorporate the Creative Commons Attribution - Non Commercial (unported, v3.0) License.
By accessing the work you hereby accept the Terms. Non-commercial uses of the work are permitted without any further permission from Dove Medical Press Limited, provided the work is properly attributed. For permission for commercial use of this work, please see paragraphs 4.2 and 5 of our Terms.