Back to Journals » Journal of Inflammation Research » Volume 16
Potential Proallergenic Activity of Phytopathogenic Erysiphe palczewskii and Erysiphe convolvuli in in vitro Studies
Authors Sztandera-Tymoczek M, Wdowiak-Wróbel S, Świderska U ![]() , Palusińska-Szysz M, Szuster-Ciesielska A
, Palusińska-Szysz M, Szuster-Ciesielska A
Received 2 July 2023
Accepted for publication 3 October 2023
Published 1 November 2023 Volume 2023:16 Pages 5039—5060
DOI https://doi.org/10.2147/JIR.S425383
Checked for plagiarism Yes
Review by Single anonymous peer review
Peer reviewer comments 2
Editor who approved publication: Professor Ning Quan
Monika Sztandera-Tymoczek,1 Sylwia Wdowiak-Wróbel,2 Urszula Świderska,3 Marta Palusińska-Szysz,2 Agnieszka Szuster-Ciesielska1
1Department of Virology and Immunology, Institute of Biological Sciences, Maria Curie-Skłodowska University, Lublin, Poland; 2Department of Genetics and Microbiology, Institute of Biological Sciences, Maria Curie-Skłodowska University, Lublin, Poland; 3Department of Botany, Mycology and Ecology, Institute of Biological Sciences, Maria Curie-Skłodowska University, Lublin, Poland
Correspondence: Agnieszka Szuster-Ciesielska, Department of Virology and Immunology, Institute of Biological Sciences, Maria Curie-Skłodowska University, Akademicka 19, 20-033, Lublin, Poland, Tel +48 81 537 59 43, Email [email protected]
Purpose: Allergic diseases have reached epidemic proportions globally, affecting nearly 30% of the world’s population. One of the most prominent sources of allergens is fungi, causing up to 6% of respiratory diseases in the general population. However, the cause of respiratory allergies is not always identifiable. Therefore, we studied the ability of two representatives of common powdery mildew (Erysiphales), Erysiphe palczewskii and Erysiphe convolvuli, to induce a proinflammatory response in in vitro models of the upper and lower respiratory tract.
Materials and Methods: Two cell lines, BEAS-2B and A549, were used to mimic upper and lower respiratory epithelial cells. The toxicity of fungal extracts was assessed with MTT and flow cytometry assay. The production of reactive oxygen species in the cells was measured with flow cytometry. ELISA tests were used to determine the production of proinflammatory cytokines. The presence of the cell integrity marker was assessed with the immunofluorescence method.
Results: In both cell lines, the extract of E. palczewskii and E. convolvuli microfungi induced marked production of proinflammatory IL-1β, TNF-α, and GM-CSF cytokines involved in developing allergic reactions. The higher levels of these cytokines with higher reactive oxygen species synthesis positively correlated with the disruption of epithelial cell junctions.
Conclusion: We conclude that E. palczewskii and E. convolvuli microfungi have strong proinflammatory and proallergenic potential, but this finding needs in vivo confirmation.
Plain Language Summary: Phytopathogenic microfungi, commonly found in human environments, act as plant parasites. They harm plant yields, the quality of agricultural products, and the aesthetic appeal of ornamental plants. Additionally, these fungi pose a potential threat to human health due to their role as prominent allergen sources. Among the most significant allergenic fungi are Alternaria, Aspergillus, Cladosporium, Penicillium, and Fusarium. However, it is worth noting that even widely prevalent phytopathogenic microfungi, such as E. palczewskii and E. convolvuli, may also induce allergy symptoms. These fungi cause extensive plant infestations, releasing vast spores, particularly during spring, summer, and autumn. Consequently, the dispersion of plants and their parasitic fungi increases the risk of human exposure to potential allergens. Since the underlying causes of allergies are not always identified through conventional skin or blood tests, it is crucial to describe new fungal allergens for hypersensitivity diagnosis. Our study demonstrates that parasitic microfungi exhibit significant pro-inflammatory properties in in vitro upper and lower respiratory tract models.
Keywords: phytopathogenic microfungi, Erysiphe palczewskii, Erysiphe convolvuli, airway epithelial cells, inflammatory response
Graphical Abstract:

Introduction
Fungal allergens are included in a group of over 750 allergens officially recognized by the World Health Organization and the International Union of Immunological Societies (WHO/IUIS).1 Nevertheless, although there is considerable understanding regarding the role of fungal allergens in developing allergic conditions, it is imperative to focus on exploring fungi as a significant origin of allergens in both fundamental scientific investigations and medical applications. The significance of this issue is demonstrated by respiratory allergies to fungi that are estimated to affect approximately 20–30% of atopic individuals and up to 6% of the general population.2 Another argument is that allergic reactions to fungi commonly affect the lower respiratory tract more often than pollen allergies.3
Phytopathogenic microfungi, which are plant parasites, are frequently encountered in human surroundings. These microorganisms give rice widespread plant infestations, resulting in decreased yields, deterioration in the quality of plant products, and diminished ornamental value of plants. The geographical location, air quality, human activities, local vegetation sources, and climate-related factors such as temperature, humidity, and extreme weather events play a crucial role in the physiology, distribution, pollen, and spore production of plants and fungi.4
However, it should be noted that phytopathogenic microfungi pose a potential risk to human health due to their role as a well-known and significant allergen source. Identifying the specific allergen causing an existing allergy is not always achievable through commonly used skin or blood tests. While genera Alternaria, Aspergillus, Cladosporium, Penicillium, and Fusarium5 are considered the most important allergenic fungi, it is important to acknowledge that widely prevalent indigenous and invasive phytopathogenic microfungi responsible for extensive plant infestations also serve as an allergen source.
In this work, we first present genetic identification and inflammatory properties of two representatives of common powdery mildew (Erysiphales): Erysiphe palczewskii parasitic on Caragana arborescens and Erysiphe convolvuli infesting Convolvulus arvensis. Using two cell model lines that reflect upper (BEAS-2B) and lower (A549) respiratory tract cells, here we report the high proinflammatory activity of the above microfungi and impairment of the function of the epithelial barrier of lung and bronchial cells. All these processes are the basis for the development of allergies and asthma. Therefore, our work significantly complements the knowledge of new potential fungal allergens.
Materials and Methods
Plant Material and Morphological Identification
The fungi selected for the study are biotrophic organisms that cannot be grown on artificial substrates in the laboratory. Therefore, the research material was obtained from the natural environment. Plant organs affected by powdery mildew (Erysiphales) species were collected in Lublin: Erysiphe convolvuli on Convolvulus arvensis L. on 10 Aug 2021 and 1−10 Sept 2021 (LBL M‒033119, leg. U. Świderska) and Erysiphe palczewskii on Caragana arborescens Lam. On 31 Aug 2021 (LBL M‒033118, leg. U. Świderska). Botanist and mycologist Dr. Urszula Świderska identified plant and fungal species. The host plants are commonly found in parks, gardens (Caragana arborescens), and wasteland (Convolvulus arvensis), and they are not under any species protection and do not occur in protected areas.
The material, ie, leaves and infecting fungi, was air-dried and deposited in the herbarium of Maria Curie-Skłodowska University in Lublin (LBL). In the first step, the morphological structures of the specimens were examined in microscopic preparations stained with Lactophenol Cotton Blue dye and observed using an Olympus BX53 light microscope (magnifications 40x, 100x, 400x, and 600x). Microphotographs of fungal diagnostic structures of the species were taken with a microscope Olympus digital camera SC180 and an Olympus SZ10 stereoscopic microscope with an Olympus camera XC50. Additionally, the structures were coated with gold in an Emitech K550X Sputter Coater, observed, and visualized with a scanning electron microscope (SEM) TESCAN Vega 3 LMU (Brno, Czech Republic). Samples containing the morphological structures of the fungus (mycelium, fruiting bodies – chasmothecia, conidiophores, and conidia) were then prepared for further laboratory analyses under the control of an Olympus SZ61 stereoscopic microscope. The collected material was placed in test tubes and then in liquid nitrogen vapor for 24 h and pulverized with a mortar and pestle. Powdered fungal material was used to prepare crude extracts.
Genetic Identification of Fungal Species
DNA Extraction
DNA isolation from fungal cells was carried out using a commercial DNeasy Plant Mini Kit (Qiagen) per the manufacturer’s instruction. The purity and concentration of genomic DNA were checked by NanoDrop™ 2000/2000c measurements (Thermo Fisher Scientific, USA). The extracted DNA was kept at –20°C.
Molecular Phylogeny
The phylogenetic similarity of the analyzed fungi was determined by comparative analysis of the partial sequences of the internal transcribed spacer (ITS) region, large subunit (LSU) sequences of the rRNA gene, and partial calmodulin (CAM), β-tubulin II (TUB2), and glutamine synthetase (GS) gene sequences. These sequences were amplified using primer pairs ITS1/ITS4, PM3/TW14, PMCAM1/PMCAM4R, BtubF5b/BtubR7a, and GSPM2/GSPM3R.6–10 All analyzed sequences were amplified in the PCR reaction using a ReadyMix™ Taq PCR Reaction Mix kit (Sigma-Aldrich) per the manufacturer’s instruction. 50 ng of template DNA and 0.4 mM of each primer were added to the reaction mixture. PCR reactions were carried out in a thermocycler (Perkin Elmer Cetus, Norwalk, USA) according to procedures described in the literature.6–10
The amplicons obtained were purified on columns using a Clean-Up purification kit (A&A Biotechnology) and sequenced with a Terminator Cycle sequencing kit. The sequencing reactions were read using a 3500 Genetic Analyzer according to the procedure specified by the producer (Life Technologies). The sequences were compared with relevant sequences in the GenBank database using the BLAST tool. The ClustalX2 program11 was used for sequence alignments analyzed in the GeneDoc program.12 A phylogenetic tree was constructed based on the generated sequence set using the MEGA11 program13 with the Neighbor-Joining (NJ) method. The two-parameter Kimura model was used as a nucleotide substitution model. jModelTest14 selected the best-fitting evolutionary model for each tested gene. The statistical significance of the tree was evaluated with a bootstrap test (1000 replicates). The phylogenetic tree was represented in the TreeView program.15
The GenBank Accession Numbers
The GenBank accession numbers of the analyzed sequences are as follows: LSU: OP744459; ITS: OP744426; GS: OP785145; TUB2: OP785143; CAM: OP781333 for E. convolvuli 1 and LSU: OP744460; ITS: OP744427; GS: OP785146; TUB2: OP785144; CAM: OP781334 for E palczewskii 2. The accession numbers of the reference strains are given on the phylograms.
Preparation of Crude Fungal Extracts
The fungal masses were washed three times with acetone and dried for 24 h at 37°C. The material was suspended in 0.05M Tris-HCl buffer pH 8.0 at a concentration of 1 mL per 10 mg dry weight and subjected to three cycles of sonication (cycle: 20s of sonication, 2 min of cooling) in a water bath at room temperature (Elmasonic S100H, Elma, Germany). The extraction was carried out overnight with shaking at 4°C; next, the extracts were centrifuged (804 × g, 10 min, 4°C). The supernatants were transferred into a membrane made of regenerated cellulose with the MW cut off at 6–8 kDa (Spectrum Laboratories, Rancho Dominguez, CA, USA) and dialyzed for 24 h at 4°C against 0.1M NH4HCO3 buffer pH 8.4 with changing the liquid three times. The material was lyophilized and resuspended in phosphate-buffered saline (PBS, Biomed, Poland). The protein concentration was measured with the Pierce ™ BCA Protein Assay Kit (Thermo Fisher Scientific, Waltham, MA, USA) using bovine serum albumin as a standard.16 Crude fungal extracts were portioned a’100 µL and stored at −80°C for further analysis.
Cell Lines and Culture Media
The in vitro studies were carried out using two adherent human airway cell lines: human cancer alveolar epithelial cells (line A549, ATCC# CCL-185) and human normal bronchial epithelial cells (line BEAS-2B, ATCC# CRL-9609). The A549 cells were cultured in a mixture of RPMI 1640 (Corning Media) and DMEM (Sigma-Aldrich) fluids (1:1, v/v), supplemented with 10% (v/v) heat-inactivated fetal bovine serum (FBS, EURx Molecular Biology Products) and 1% (v/v) penicillin–streptomycin solution (Sigma-Aldrich). The BEAS-2B cells were cultured in LHC-8 fluid (Gibco) with the addition of 10% (v/v) heat-inactivated FBS and 1% (v/v) penicillin–streptomycin solution, with the medium changed after 24 hr to LHC-8 fluid without the addition of FBS. BEAS-2B cells require the use of a serum-free medium to maintain their proper cuboidal and polygonal appearance typical for respiratory epithelium.17 Both cell cultures were maintained in standard conditions at 37°C with 5% CO2 flux and 95% humidity. The cells were grown to confluence and then passaged 1:3 with PBS solution without Ca2+ and Mg2+ ions and 0.25% trypsin solution with 0.02% EDTA (Biological Industries).
Cytotoxicity Study with MTT Assay
Cell viability was assessed by measuring their mitochondrial activity in reducing the yellow tetrazolium salt 3–(4,5 dimethyl–2–thiazolyl)–2,5–diphenyl–2H–tetrazolium bromide (MTT) to form purple formazan crystals. The spectrophotometric analysis of the dissolved crystals determined that the color and its intensity indicated the mitochondrial activity of viable cells.18 Briefly, the cells at a density of 1×10⁵ cells/mL (A549 cell line) or 2×10⁵ cells/mL (BEAS-2B cell line) in appropriate culture medium with 10% FBS were seeded into 96–well plates (100 µL/well) (Nunc, Roskilde, Denmark) and cultured at 37°C for 24 h. Then, the medium was removed, and 100 µL of the tested fungal extracts (in the concentration range of 0.09–400 µg of protein/mL) suspended in appropriate culture medium (RPMI 1640 + DMEM with 2% FBS for A549 cells; LHC-8 without serum for BEAS-2B cells) was added. The cultured cells were maintained in an incubator at 37°C for 24 h. The controls included non–treated cells and the medium alone. Blank wells without cell cultures were also prepared. Then, MTT assay was performed according to methods described elsewhere.19 The 570 nm optical absorbance (A) was quantified utilizing a VICTOR X4 Multilabel Plate Reader (Perkin Elmer, Waltham, MA, USA). The obtained data were expressed as (i) a percentage of cell viability relative to the control and (ii) IC50 (inhibitory concentration), representing the concentration that produced a 50% reduction in cytotoxic effect. Each experiment was conducted in triplicate, with 4–8 samples for each run. The percentage of viable cells was calculated according to the following formula:

Flow Cytometry
Cytotoxicity Study
The cells at a density of 1×10⁵ cells/mL (A549 cell line) or 2×10⁵ cells/mL (BEAS-2B cell line) in appropriate culture medium with 10% FBS were seeded into 24–well plates (1 mL/well) (Nunc, Roskilde, Denmark) and cultured at 37°C for 24 h. After medium removal, fresh ones were added with the tested fungal extracts (in the concentration range depending on MTT assay results, RPMI 1640 + DMEM with 2% FBS for the A549 cells and LHC-8 without serum for the BEAS-2B cells). Untreated cells served as a negative control, while cells treated with 5% DMSO (Sigma-Aldrich) were a positive control. After 24-hr incubation, cell culture supernatants from each well were collected into cytometric tubes. 150 µL of accutase (Corning Media) was added to each plate well and incubated until the cells detached. After this time, the contents of the individual wells were resuspended in 500 µL of the appropriate culture fluid (RPMI 1640 + DMEM with 2% FBS for the A54 cells and LHC-8 without serum for the BEAS-2 cells), transferred to cytometric tubes with the corresponding supernatants, and centrifuged (314 × g, 5 min at room temperature, RT). The supernatants were discarded, and the cells were washed in 500 µL of binding buffer (10X Annexin V Binding Buffer, 1:9 dilution in H2O, BD Biosciences). After centrifugation (314 × g, 5 min, RT), the cell pellet was resuspended in 100 µL of binding buffer with the addition of 5 µL of annexin V FITC (BD Biosciences) and 5 µL of propidium iodide (BD Biosciences), gently vortexed, and incubated for 15 min at room temperature protected from light. Then, 400 µL of binding buffer was added to each cytometry tube and analyzed using a flow cytometer (FACSCalibur™ Flow Cytometer, BD Biosciences) and Cell Quest Pro software. Each sample was performed in triplicate. The results are presented as a percentage of viable, apoptotic (early and late apoptotic), and necrotic cells of all analyzed cells. A representative flow cytometry gating strategy for this analysis is presented in appropriate figure.
Determination of Reactive Oxygen Species Production
Cells of both cell lines were suspended in PBS without Ca2+ and Mg2+ ions were supplemented with 1% FBS at a density of 2×10⁵ cells/mL. One mL of the cell suspension was poured into a cytometric tube with the addition of 1 µL of dihydrorhodamine 123 (DHR 123, Thermo Fisher Scientific) (output concentration of 5 mM/mL in PBS without Ca2+ and Mg2+ ions) and incubated for 15 min at 37°C. Then, selected doses of the fungal extracts (based on the results of the MTT test) were added to the cytometric tubes. Untreated cells served as a negative control, while cells treated with 5 µL of tert-butyl hydroperoxide (tBHP, Sigma-Aldrich) (final concentration of 50 µM in PBS) were a positive control. After 1-h incubation at 37°C, the tubes were centrifuged (314 × g, 5 min, RT), and the supernatant was removed. The cell pellet was resuspended in 500 µL of PBS supplemented with 1% FBS, and cytometric analyses were performed (FACSCalibur™ Flow Cytometer, BD Biosciences; Cell Quest Pro program). The results were presented as a percentage of reactive oxygen species producing and non-producing cells of all cells analyzed in three independent experimental replications.
Determination of Cytokine Production
In our experiments, we determined the ability of the fungal extract to induce the production of IL-1β, IL-6, TNF-α, TGF-β, and GM-CSF in both A546 and BEAS-2B cells. Briefly, the cells at a density of 1×10⁵ cells/mL (A549 cell line) or 2×10⁵ cells/mL (BEAS-2B cell line) in appropriate culture medium with 10% FBS were seeded into 24–well plates (1 mL/well) (Nunc, Roskilde, Denmark) and cultured at 37°C for 24 h. After medium removal, fresh ones were added with the tested fungal extracts; RPMI 1640 + DMEM with 2% FBS for A549, and LHC-8 without serum for the BEAS-2B cells. Based on the MTT assay results, two concentrations of the fungal extracts were chosen (i) giving 50% of IC50, (ii) the first one at which cell viability was in the range of 80–90%. Untreated cells served as a negative control. Each sample was performed in triplicate. After 24 hr of incubation at 37°C, culture supernatants were collected and centrifuged (314 × g, 5 min, RT). The samples were stored at −70°C for further analysis. Enzyme immunoassays (ELISA, Shanghai Coon Koon Biotech Co.) were performed according to the manufacturer’s procedure. The sensitivity of the ELISA test for the particular cytokines was as follows: IL-1β 10.0 pg/mL, IL-6 1.0 pg/mL, TNF-α 10.0 pg/mL, TGF-β 10.0 pg/mL, and GM-CSF 10.0 pg/mL.
Determination of the Presence of E-Cadherin and Occludin with Fluorescence Microscopy
The cells at a density of 3×10⁴ cells/mL (A549 cell line) or 6×10⁴ cells/mL (BEAS-2B cell line) in appropriate culture medium were seeded into 8-chamber slides (0.5 mL/chamber) (Thermo Fisher Scientific) and cultured at 37°C for 24 h. Then, the old medium with 10% FBS was replaced with fresh ones with the tested fungal extracts (in the same concentration range as for the determination of cytokines): RPMI 1640 + DMEM with 2% FBS for the A549 cells and LHC-8 without serum for the BEAS-2B cells. After 24-hr incubation at 37°C, the cell culture supernatant was removed, and the chambers were rinsed three times with PBS with Ca2+ and Mg2+ ions (500 µL/chamber). Next, the cells were fixed (4% paraformaldehyde, 400 µL/chamber, BD Biosciences) for 15 min at 37°C and washed with 500 µL of PBS three times. 400 µL of 0.1% Triton X-100 (Sigma-Aldrich) solution in PBS (to permeabilize cell membranes) was added to each chamber and incubated at room temperature for 15 min. After washing the cells three times with PBS (500 µL/chamber), 500 µL of 2% bovine serum albumin (BSA, Sigma-Aldrich) in PBS was added to each chamber to block non-specific antibody-binding sites. After 60-min incubation at room temperature, the cell supernatant was removed and 100 µL/well of primary antibody (for occludin – 5 µg/mL in 2% BSA; for E-cadherin - 2 µg/mL in 2% BSA) was added (Thermo Fisher Scientific). After an overnight incubation at 4°C, the chambers were rinsed three times with 500 µL of PBS and 100 µL/well of Alexa FluorTM 488-conjugated secondary antibody (2 µg/mL in 2% BSA) was added (Thermo Fisher Scientific). The slides were incubated for 45 min at room temperature protected from light. After removing the cell supernatants, 200 μL of DAPI (2 μg/mL in PBS) (Sigma-Aldrich) was added to each chamber and incubated in the dark for 5 min at room temperature. After this time, the walls of the chambers were removed, the slides were rinsed with PBS, and a few drops of glycerol/water solution (1/1, v/v) were applied. The slides were covered with coverslips. Images were collected using a DM4000B epifluorescence microscope (Leica, Wetzlar, Germany) equipped with filters Leica EL6000, a Leica DFC 500 camera, and image analysis LAS V3.1 Leica software.
Additional controls were also prepared with cells that were non-treated with the fungal extracts: (i) cells without antibodies and (ii) cells stained with only secondary antibodies labeled with a fluorescent dye to test the specificity of fluorescent staining.
Statistical Analysis
Normally distributed continuous variables are presented as mean ± SD based on a minimum of three independent experiments. The statistical significance of differences between measurements was assessed using either the Mann–Whitney U or one-way ANOVA, followed by Tukey’s post–hoc multiple-comparison test. Statistical analysis was performed using STATISTICA software version 12 (StatSoft. Inc., Tulsa, OK, USA), and a P value ≤ 0.05 was considered significant. The IC50 (inhibitory concentration) was calculated using GraphPad Prism software version 6 (GraphPad Software Inc., La Jolla, USA).
Results
Plant Material and Morphological Identification of Microfungi
Erysiphe palczewskii was identified based on the morphological characteristics of the species. The fungus produced an amphigenous coating composed of mycelium, conidiophores, and conidia, mycelium covering both sides of the Caragana arborescens leaves. Conidia ellipsoid-cylindrical, usually with dimensions of 25−38×12−20 µm. Chasmothecia were usually 90−120 µm in diameter, with appendages approximately 5−10(−20) in number, usually as long as the diameter of the chasmothecium, rarely slightly longer (up to 2.5 times). Asci: 4−8(−13) in number, ellipsoid or ellipsoid-obovoid, with dimensions of 47−52(−80) × 25−32(−45) µm, 4–7, usually 6-spored. Ascospores: ellipsoid-ovoid, with dimensions of 14−21×8−12 µm20,21 (Figure 1A a-f).
 |
Figure 1 (A) Erysiphe palczewskii on Caragana arborescens: a – disease symptom on infected leaves; b – chasmothecia and mycelium on the host leaf (lower side); c – chasmothecium with asci and ascospores in LM; d – apical part of the appendage in LM; e – chasmothecium with appendages in SEM; f – conidia in SEM. Scale bars: b – 1 mm; c, e – 50 µm; d – 20 µm; f – 10 µm. (B) Erysiphe convolvuli on Convolvulus arvensis: a – leaves of the host plant infected by the fungus; b – chasmothecia and mycelium on the leaf (lower side); c – chasmothecium with an ascus and ascospores in LM; d – conidia in LM; e – chasmothecium in SEM; f – conidia and hyphae in SEM. Scale bars: b – 1 mm; c, d, e – 50 µm; f – 20 µm. |
The morphological features of Erysiphe convolvuli were consistent with the description of the species. The fungus mainly infects Convolvulus arvensis leaves, usually covering them on both sides with a whitish coating composed of mycelium, not very numerous conidiophores, and conidia. Conidia are usually formed singly, ellipsoid, or cylindrical, with dimensions of 40−45×16−20 µm. Chasmothecia were mostly 100−120 µm in diameter, with appendages numerous simple or often irregularly and occasionally subdichotomously branched 1−2 times, 1.5−3 times as long as the chasmothecial diameter. Asci: 4−10 in number, usually 4−5, broadly ellipsoid-obovoid, with dimensions of 5−66×35−46 µm, 3−4(−5)-spored. Ascospores: ellipsoid-ovoid, with dimensions of 22−26×11−15 µm20 (Figure 1B a-f).
Genetic Identification of Microfungal Species and Molecular Phylogeny
Comparative sequence analysis of the Internal Transcribed Spacer (ITS) and Large Subunit (LSU) regions is widely used to classify and identify different groups of fungi. The study included 57 representatives of the Erysiphaceae family. The taxa included 37 species representing six genera isolated from various plant species. The analysis compared the sequences of ITS and LSU regions of the tested strains with the corresponding sequences available in the GenBank database. The phylogenetic tree was built from a combination of ITS and LSU genes. The analyzed strains, ie, E. convolvuli 1 and E. palczewskii 2, were grouped with strains representing the genus Erysiphe (with 100% bootstrap support). The similarity of the nucleotide sequences of the tested isolates to each other was 94%. The sequence similarity of these strains to the sequence of reference strains representing the genus Erysiphe ranged from 92% to 100%. ITS + LSU gene sequence similarities of the two isolates and other members of the family Erysiphaceae, ie, Arthrocladiella, Golovinomyces, Podosphaera, Leveillula, and Phyllactinia, were in the range of 75, 75–76, 67–69, 67, and 66–68%, respectively.
In the phylogenetic tree, all strains of the genus Erysiphe formed a cluster with 100% bootstrap support. The isolate of E. palczewskii 2 isolated from Caragana arborescens, ie, a plant originating from the north-eastern part of Poland, formed (with bootstrap support of 99%) a typical monophyletic cluster with two strains of E. palczewskii isolated from Caragana arborescens plants originating from Ukraine and Switzerland (Figure 2). The other analyzed isolate, ie, E. convolvuli 1 obtained from the Convolvulus arvensis plant growing in the north-eastern area of Poland, was characterized by the highest coefficient of sequence similarity (99–100%) to strains of the species E. convolvuli (isolated from Convolvulus spp. in the USA, South Korea, and China), together forming a monophyletic group with bootstrap support of 100% (Figure 2). The other members of the Erysiphaceae family included in ITS + LSU phylogenetic analysis formed three separate clusters on the tree, including strains of the genera Arthrocladiella, Golovinomyces, Podosphaera, Leveillula, and Phyllactinia (Figure 2).
 |
Figure 2 Phylogenetic analysis of partial ITS+LSU gene sequences were determined with the Neighbor- Joining method. The numbers in the nodes indicate the levels of bootstrap support obtained with the use of 1000 resampled datasets. The branch points have bootstrap values ≥55%. The accession numbers for the reference sequences are given in parentheses. |
The analysis of ITS and LSU regions indicates that they may be insufficient markers to determine the taxonomic affiliation of powdery mildew at the species level. Therefore, in addition to the analysis of ribosomal DNA (rDNA), taxonomic and phylogenetic studies are increasingly using comparative analysis of the sequence of other genes, eg, TUB2 (β-tubulin), GS (glutamine synthetase), CAM (calmodulin), or RPB2 (DNA-directed RNA polymerase II subunit). Analyses of multiple genes can complement results obtained from nrDNA analyses. They are also helpful in determining phylogenetic relationships between different taxa and allow more accurate determination of the taxonomic position at the species level for closely related species that cannot be separated by analysis based only on ITS and LSU sequences.10
To confirm the taxonomic position of the studied isolates established based on the combined ITS + LSU sequences, comparative sequence analysis of three genes, ie, TUB2 (β-tubulin), GS (glutamine synthetase), and CAM (calmodulin), was performed. A phylogenetic tree was created for each analyzed region (Figures 3 and 4). However, it should be emphasized that the lack of sequences for some members of the Erysiphaceae family in the GenBank database meant that they could not be included in the analyses.
 |
Figure 3 Phylogenetic analysis of partial TUB2 gene sequences were determined with the Neighbor- Joining method. The numbers in the nodes indicate the levels of bootstrap support obtained with the use of 1000 resampled datasets. The branch points have bootstrap values ≥55%. The accession numbers for the reference sequences are given in parentheses. |
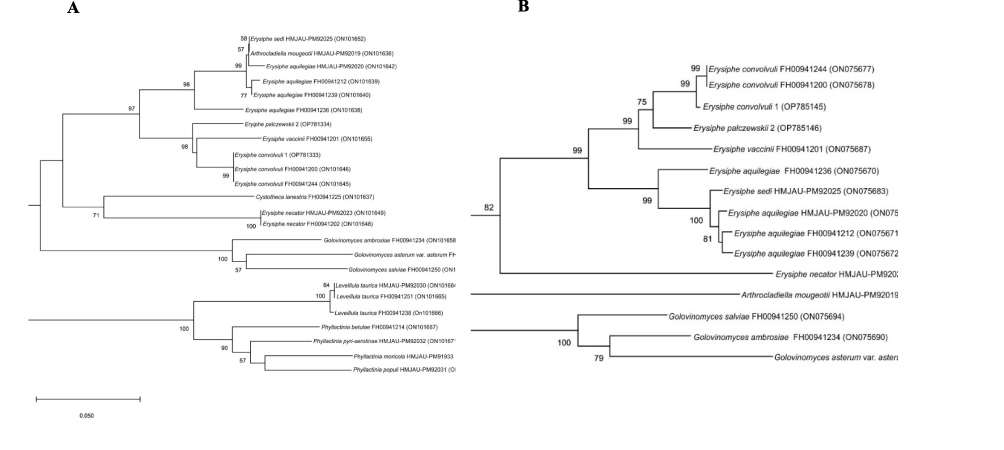 |
Figure 4 Phylogenetic relationships of partial CAM (A) and GS (B) gene sequences determined by Neighbor-Joining gene phylogeny. The numbers in the nodes indicate the levels of bootstrap support obtained with the use of 1000 resampled datasets. The branch points have bootstrap values ≥55%. The accession numbers for the reference sequences are given in parentheses. |
The similarity of the E. convolvuli 1 nucleotide sequence to the corresponding E. palczewskii 2 gene sequences was 95% for the CAM and TUB2 genes and 96% for GS. On phylogenetic trees based on the sequences of genes mentioned above, the studied isolates were grouped with representatives of the genus Erysiphe (Figures 3 and 4). The degree of similarity of the nucleotide sequences of E. convolvuli 1 and E. palczewskii 2 to the corresponding sequences of representatives of the Erysiphe genus ranged from 84% to 93% for CAM, from 89% to 96% for TUB2, and from 79% to 93% for GS. The analyzed isolates showed the lowest degree of nucleotide sequence similarity to the Erysiphe necator sequence. In phylogenetic trees, the E. convolvuli 1 isolate forms a well-supported monophyletic clade (99–100% bootstrap support) with E. convolvuli species strains (Figures 3 and 4). These results confirm that E. convolvuli 1 belongs to the genus Erysiphe and simultaneously indicate that this isolate is a member of E. convolvuli.
In the case of phylogenetic trees for CAM and GS, E. palczewskii 2 forms a common group with strains of E. vaccinii and E. convolvuli species with bootstrap support of 98% and 99%, respectively (Figure 4A and B). On the phylogenetic tree for the TUB2 gene, E. palczewskii 2 forms a typical cluster with strains of the E. lespedezae species (84% bootstrap support) (Figure 3). The comparison of the CAM, TUB2, and GS gene sequences of E. palczewskii 2 to the sequence of the corresponding genes from the GenBank database confirmed that the isolate belongs to the genus Erysiphe. Due to the lack of CAM, TUB2, and GS gene sequences for E. palczewskii in the databases, it is currently impossible to confirm its species position based on ITS + LSU sequence analysis.
In the case of the other members of the Erysiphaceae family, the degree of similarity of the CAM, GS, and TUB2 gene sequences to the corresponding sequence genes of E. convolvuli 1 and E. palczewskii 2 was significantly lower and amounted to 74–83%, 67–76%, and 70–73%, respectively.
Characteristics of Biological Properties of Erysiphe Palczewskii
Cytotoxicity Study (MTT Assay and Flow Cytometry)
The E. palczewskii extract exhibited increased cytotoxic activity against alveolar epithelial cells (cell line A549) and bronchial epithelial cells (cell line BEAS-2B) in the same 50–400 µg protein/mL concentration range. In comparison to the control sample, the assessment of cell viability showed that, depending on the protein concentration of the fungal extract, the number of viable cells was reduced by 20–86% in the A549 line and by 19–79% in BEAS-2B (Figure 5A). The IC50 value, ie, the concentration of the extract at which cell viability was reduced by 50%, was determined to be 77.9±3.2 µg protein/mL for the A549 cells and 152.9±4.1 µg protein/mL for the BEAS-2B cells.
 |
Figure 5 (A) Viability of A549 and BEAS-2B cells after 24-hour incubation with the E. palczewskii fungal extract (MTT method). The viability of the control cells is presented as 100%. * - statistically significant difference compared to the control sample (Mann–Whitney U-test), *P≤0.05; **P≤0.01; ***P≤0.001. a - statistically significant difference compared to the BEAS-2B cells, P≤0.05 (one-way ANOVA with Tukey’s post–hoc multiple comparison test). Data are representative of three independent experiments (with 4–8 samples each). (B) gating strategy for measurement four cell populations: viable, necrotic, early, and late apoptotic. (C) Evaluation of cell viability in the A549 line after 24-hour incubation with the E. palczewskii fungal extract. (D) Evaluation of cell viability in the BEAS-2B line after 24-hour incubation with the E. palczewskii fungal extract. C(-) - negative control (without the addition of the fungal extract), C(+) - positive control (DMSO [5%]). * - statistically significant difference compared to the negative control sample (Mann–Whitney U-test), *P≤0.05; **P≤0.01; ***P≤0.001. a - statistically significant difference compared to the BEAS-2B cells, a - P≤0.05; A - P≤0.01 (one-way ANOVA with Tukey’s post–hoc multiple comparison test). Data are representative of three independent samples. |
Based on the results obtained with the MTT method, only the concentration range of 400–12.5 µg protein/mL was selected for the cytometric analysis of the A549 cells. A549 cells with the addition of 5% DMSO served as a positive control. A gating strategy used to determine sub-populations of viable, necrotic, early, and late apoptotic cells is presented in Figure 5B. After 24-hr incubation with the E. palczewskii extract in the concentration range of 50–400 µg protein/mL, double staining with annexin V-FITC and propidium iodide revealed a significant increase in the percentage of A549 cells undergoing early apoptosis from 3.2±0.4% (negative control) to 19.3±1.4–28.0±3.2%. In the same range of extract concentrations, the rate of necrotic cells increased by 9–14%, and a statistically significant increase in the number of apoptotic A549 cells from 25.5±4.2% (negative control) to 36.6±2.7–60.5±2.0% was noted (Figure 5C). Representative cytometric dot blots are presented in S1 Figure.
Based on the results obtained with the MTT method, only the concentration range of 400–25 µg protein/mL was selected for the cytometric analysis of the BEAS-2B cells. Compared to the control sample, the E. palczewskii extract in the concentration range of 50–400 µg protein/mL proportionally reduced the percentage of viable BEAS-2B cells by 14–47%. This was accompanied by a significant increase in the number of apoptotic cells ranging from 14.5±1.8% to 42.7±4.5%, depending on the protein concentration in the extract. In addition, the E. palczewskii extract caused a significant increase (by about 5–12% at 200–400 µg protein/mL) in the percentage of cells with an early apoptotic phenotype (Figure 5D). In the concentration range from 400 to 50 µg protein/mL A549 cells were more than BEAS-2B cells sensitive to the toxic effects of E. palczewskii extract since the differences in the percentage of necrotic, apoptotic, and viable cells were statistically significant. Representative cytometric dot blots are presented in S2 Figure.
Determination of Reactive Oxygen Species Production (Flow Cytometry)
To determine whether reactive oxygen species (ROS) may be the probable cause of the cytotoxic effect of the fungal extract, a cytometric analysis was performed using dihydrorhodamine 123 dye. Experiments carried out with both cell lines and the E. palczewskii extract in the concentration range of 50–400 µg protein/mL did not distinguish subpopulations of cells that produced or did not produce reactive oxygen species (probably due to the high toxicity of the extract concentrations). The gating strategy used to determine ROS-producing cells is presented in Figure 6A. Statistically significant changes were observed only at the concentration of 25 µg protein/mL of the extract; compared to the negative control, the percentage of ROS-producing A549 and BEAS-2B cells increased by 34% and 28%, respectively (Figure 6B and C). There were no statistically significant differences between lines A549 and BEAS-2B in their ability to produce ROS under contact with E. palczewskii extract. Representative cytometric histograms are presented in S3 Figure (A549 cell line) and in S4 Figure (BEAS-2B cell line).
 |
Figure 6 Effect of the E. palczewskii extract and on the production of reactive oxygen species (ROS) with gating strategy (A) in the A549 (B) and BEAS-2B (C) cells after 24-hour incubation. C(-) - negative control (without the addition of the fungal extract), C(+) - positive control (tBHP [50µM]), ROS(-) – ROS non-producing cells, ROS(+) – ROS producing cells. * - statistically significant difference compared to the negative control sample (Mann–Whitney U-test), *P≤0.05; **P≤0.01; ***P≤0.001. Data are representative of three independent samples. |
Determination of Cytokine Production
Proinflammatory cytokines with high importance in the development of allergic reactions were selected for the study: IL-1β, IL-6, TNF-α, TGF-β, and GM-CSF. Following the principle of selection of concentrations for the study of cytokine production (described in Chapter 4.7.), two concentrations of E. palczewskii extract were used here: 12.5 µg protein/mL and 39 µg protein/mL for the A549 line and 25 µg protein/mL and 76 µg/protein/mL for the BEAS-2B line. The level of cytokines was determined after 24-incubation of the cells with selected concentrations of the fungal extract.
The experiments showed a statistically significant increase in IL-1β production in the alveolar epithelial cells after incubation with the higher (39 µg protein/mL) and lower (12.5 µg protein/mL) concentrations of the E. palczewskii extract - 7.3± 0.6 pg/mL and 21.2±0.86 pg/mL, respectively. Bronchial epithelial cells produced IL-1β even more intensively – at the level of 8.9±0.6 pg/mL (for the extract concentration of 76 µg protein/mL) and 25.65±1.2 pg/mL (for the extract concentration of 25 µg protein/mL) (Figure 7A). IL-6 levels increased after treatment of the A549 and BEAS-2B cells with only the lower extract concentrations, but the results were not statistically significant. Regardless of the cell line type, the higher concentrations of the E. palczewskii extract did not induce the production of this cytokine (Figure 7B). The analyses showed that, in the presence of the lower concentrations of the fungal extract, the level of TNF-α produced in the A549 cells (7.1±1.0 pg/mL) and BEAS-2B cells (10.8±0.7 pg/mL) significantly exceeded the production of this cytokine when the higher concentrations of the extract were used (Figure 7C). Regardless of the concentration of the E. palczewskii extract, the cells of both lines did not produce TGF-β. Statistically significant increases in the level of GM-CSF, ie, 23.5±1.1 pg/mL and 26.5±1.1 pg/mL, were observed at the lower concentrations of the tested extract: 12.5 µg protein/mL (line A549) and 25 µg protein/mL (line BEAS-2B) (Figure 7D). In conclusion, the lower concentrations of E. palczewskii extract were more effective in inducing proinflammatory cytokines (except TGF-β) at similar levels in the cells of both lines.
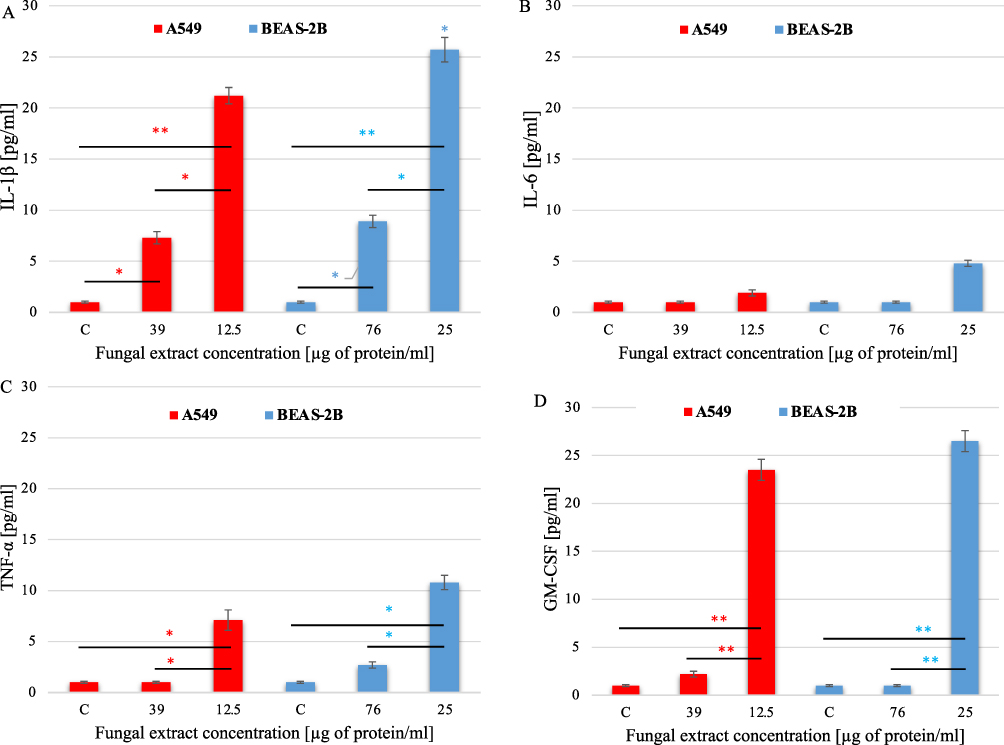 |
Figure 7 Production of cytokines IL-1β (A), IL-6 (B), TNF-α (C), and GM-CSF (D) in the A549 and BEAS-2B cells after 24-hour contact with different concentrations of the E. palczewskii extract. C – negative control cells (not treated with the fungal extract). * - statistically significant difference compared between groups (one-way ANOVA with Tukey’s post–hoc multiple comparison test), *P≤0.05; **P≤0.01. Data are representative of three independent samples. |
Evaluation of Epithelial Cell Integrity
To determine the ability of E. palczewskii extracts to impair the function of the epithelial barrier of lung and bronchial cells, the presence of intercellular junction proteins E-cadherin and occludin was determined by immunofluorescence. The same concentrations of the fungus extract were used in the determination of cytokine production: 12.5 µg of protein/mL and 39 µg of protein/mL for the A549 cells and 25 µg protein/mL and 76 µg protein/mL for the BEAS-2B cells.
In alveolar epithelial control cells (untreated with the fungal extract), continuous, regular green fluorescence of E-cadherin was observed at the cell borders surrounding the plasma membrane, which is the cellular connection between adjacent epithelial cells. The location of E-cadherin in the A549 cells treated with both concentrations of the E. palczewskii extract was similar to that in the control cells. However, the fluorescence intensity was significantly reduced proportionally to the increase in the extract concentration. In contrast to E-cadherin, the analysis of the presence of occludin after exposure of the A549 cells to both concentrations of the fungus extract revealed a practically complete decrease in fluorescence intensity, indicating a probable lack of this protein (Figure 8A).
 |
Figure 8 Effect of the E. palczewskii and E. convolvuli extracts on the presence of E-cadherin and occludin in the A549 (A) and BEAS-2B (B) cells (representative photos from three independent replicates). Control (-) - fungal extract-untreated cells incubated with secondary antibody only; Control (+) - fungal extract-untreated cells incubated with primary and secondary antibody. Cell nuclei stained with DAPI (blue). Bars: 50 µm. |
In the BEAS-2B cells exposed to the E. palczewskii extract at a concentration of 25 µg protein/mL, an uneven distribution of E-cadherin and reduced intensity of occludin fluorescence along the basolateral surface of the cells were observed, compared to the control. However, in the cultures of bronchial epithelial cells, after 24-hr incubation with the fungus extract at the concentration of 76 µg protein/mL, E-cadherin and occludin were characterized by dispersion, and their fluorescence intensity was significantly reduced, suggesting a decrease in the amount of these proteins (Figure 8B).
Characteristics of Biological Properties of Erysiphe Convolvuli
Cytotoxicity Study (MTT Assay and Flow Cytometry)
In the case of the A549 cells, the E. convolvuli extract was toxic in the concentration range of 6.25–400 µg protein/mL. Only at the extract concentration of 3.125 µg protein/mL the cell viability was 88.60%, compared to the control sample. However, the E. convolvuli extract showed cytotoxic activity towards the BEAS-2B cells in a lower concentration range of 100–400 µg protein/mL; their viability compared to the control sample was 50.7±3.4–12.9±0.1%, respectively. The A549 cells turned out to be more sensitive to the effect of the extract. Their viability in the concentration range of 6.25–100 was statistically significantly lower than that of the BEAS-2B cells (Figure 9A). The IC50 value was determined to be 28.42±1.3 µg protein/mL for the A549 cells and 101.1±2.5 µg protein/mL for the BEAS-2B cells.
 |
Figure 9 (A) Viability of A549 and BEAS-2B cells after 24-hour incubation with the E. convolvuli fungal extract (MTT method). The viability of the control cells is presented as 100%. * - statistically significant difference compared to the control sample (Mann–Whitney U-test), *P≤0.05; **P≤0.01; ***P≤0.001. a - statistically significant difference compared to the BEAS-2B cells, P≤0.05 (one-way ANOVA with Tukey’s post–hoc multiple comparison test). Data are representative of three independent experiments (with 4–8 samples each). (B) gating strategy for measurement four cell populations: viable, necrotic, early and late apoptotic. (C) Evaluation of cell viability in the A549 line after 24-hour incubation with the E. convolvuli fungal extract. (D) Evaluation of cell viability in the BEAS-2B line after 24-hour incubation with the E. convolvuli fungal extract. C(-) - negative control (without the addition of the fungal extract), C(+) - positive control (DMSO [5%]). * - statistically significant difference compared to the negative control sample (Mann–Whitney U-test), *P≤0.05; **P≤0.01; ***P≤0.001. a - statistically significant difference compared to the BEAS-2B cells, a - P≤0.05; A - P≤0.01 (one-way ANOVA with Tukey’s post–hoc multiple comparison test). Data are representative of three independent samples. |
Similar cytotoxicity results were obtained for both lines in the cytometric study. A gating strategy used to determine sub-populations of viable, necrotic, early, and late apoptotic cells is presented in Figure 9B. The E. convolvuli extract significantly decreased the survival of the A549 cells in the concentration range of 3.125–400 µg protein/mL; the percentage of viable cells was 12.9±0.1–0.4±0.06%, respectively. This was accompanied by a significant increase in the rate of cells in the early phase (up to 48.9±0.7%) and apoptotic cells (up to 52.5±4.1%) (Figure 9C). Representative cytometric dot blots are presented in S5 Figure.
The E. convolvuli extract significantly reduced the number of viable BEAS-2B cells starting from the concentration of 50 µg protein/mL and higher (52.7±2.2 and 1.8±0.4% for the concentration of 400 µg protein/mL). In the same concentration range, a significant increase in the percentage of apoptotic cells was noted from 38.3±1.0% to 84.7±1.0%. Regardless of the type of cells, the tested extract did not cause cell necrosis (Figure 9D). A549 cells were more than BEAS-2B cells sensitive to the cytotoxic effect of E. convolvuli extract since the differences between both those cell lines in the percentage of necrotic, apoptotic, and viable cells were statistically significant. Representative cytometric dot blots are presented in S6 Figure.
Determination of Reactive Oxygen Species Production (Flow Cytometry)
Probably, the excessively high toxicity of the E. convolvuli extract (50–400 µg protein/mL for A549; 100–400 µg protein/mL for BEAS-2B) did not allow separation of the cells into ROS producing and non-producing subpopulations. However, the A549 cells generated ROS after 1 hr of contact with the fungal extract in the 6.25–25 µg protein/mL concentration range. The gating strategy used to determine ROS-producing cells is presented in Figure 10A. Compared to the negative control, we noted an approximately 26–48% increase in the level of ROS, respectively (Figure 10B). The BEAS-2B cells did not produce ROS at non-toxic concentrations (Figure 10C). In the concentration range from 25 to 6.25 µg protein/mL, the differences in ROS production by the A549 and BEAS-2B cells under stimulation with E. convolvuli extract were statistically significant. Representative cytometric histograms are presented in S7 Figure (A549 cell line) and in S8 Figure (BEAS-2B cell line).
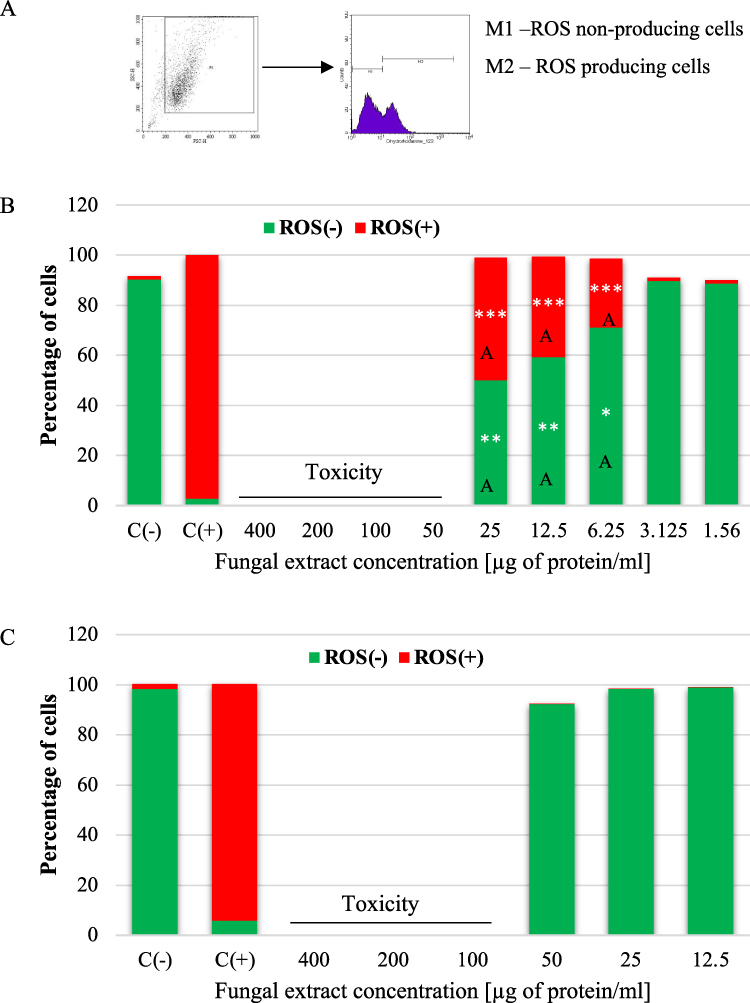 |
Figure 10 Effect of the E. convolvuli extract on the production of reactive oxygen species (ROS) with gating strategy (A) in the A549 (B) and BEAS-2B (C) cells after 24-hour incubation. C(-) - negative control (without the addition of the fungal extract), C(+) - positive control (tBHP [50µM]), ROS(-) - ROS non-producing cells, ROS(+) - ROS producing cells. * - statistically significant difference compared to the negative control sample (Mann–Whitney U-test), *P≤0.05; **P≤0.01; ***P≤0.001. a - statistically significant difference compared to the BEAS-2B cells, a - P≤0.05; A - P≤0.01 (one-way ANOVA with Tukey’s post–hoc multiple comparison test). Data are representative of three independent samples. |
Determination of Cytokine Production
Similar to E. palczewskii, E. convolvuli induced higher production of proinflammatory cytokines at lower extract concentrations. The A549 cells produced a significantly higher level of IL-1β (18.3±0.4 pg/mL) at the extract concentration of 1.56 µg protein/mL, while the concentration of 14.2 µg protein/mL induced lower production of this cytokine (40.6±0.2 pg/mL). A similar relationship was observed for the BEAS-2B cells: the level of IL-1β was 29.5±1.4 pg/mL after cell stimulation with the extract concentration of 25 µg protein/mL and 5.6±0.8 pg/mL after incubation of the cells with 50 µg protein/mL (Figure 11A). In both A549 and BEAS-2B cells, a slight increase in the IL-6 concentration was observed, which remained at a similar level (2.78±0.1 pg/mL and 2.2±0.8 pg/mL) only in response to the lower extract doses (A549 - 1.56 µg protein/mL; BEAS-2B - 25 µg protein/mL, respectively) (Figure 11B). The exposure of the A549 cells to 1.56 µg protein/mL of the E. convolvuli extract slightly increased the TNF-α levels (3.65±0.1 pg/mL). In turn, the BEAS-2B cells produced significantly higher levels of TNF-α (15.7±1.4 pg/mL) after the stimulation with the extract at the concentration of 25 µg protein/mL than after the application of the extract at the concentration of 50 µg protein/mL (TNF-α=1.9±0.1 µg/mL) (Figure 11C). Regardless of the concentration of the E. convolvuli extract, the cells of both lines did not produce TGF-β. In the case of GM-CSF, only the lower E. convolvuli extract concentrations (for the A549 cells - 1.56 µg protein/mL; for the BEAS-2B cells – 25 µg protein/mL) induced significant production of this cytokine, ie, 27.8±1.3 pg/mL and 21.5±2.3 pg/mL, respectively (Figure 11D).
 |
Figure 11 Production of cytokines IL-1β (A), IL-6 (B), TNF-α (C), and GM-CSF (D) in the A549 and BEAS-2B cells after 24-hour contact with different concentrations of the E. convolvuli extract. C – negative control cells (not treated with the fungal extract). * -statistically significant difference compared between groups (one-way ANOVA with Tukey’s post–hoc multiple comparison test), *P≤0.05; **P≤0.01. Data are representative of three independent samples. |
Evaluation of Epithelial Cell Integrity
To determine the presence of intercellular junction proteins E-cadherin and occludin, the same concentrations of E. convolvuli extract were used as in the determination of cytokine production: 1.56 µg of protein/mL and 14.2 µg of protein/mL for the A549 cells and 25 µg protein/mL and 50 µg protein/mL for the BEAS-2B cells.
Immunofluorescence microscopy demonstrated the lack of both E-cadherin and occludin junction proteins when the A549 cells were incubated with higher fungal extract concentrations, ie, 14.2 µg of protein/mL. The reduction of the fungal extract concentration to 1.56 µg of protein/mL facilitated detection of the presence of both proteins; however, their fluorescence intensity was significantly lower than that in the control sample (Figure 8A).
At higher concentrations of the E. convolvuli extract (50 µg protein/mL), both junction proteins practically disappear from the BEAS-2B cell surface. Although E-cadherin and occludin were present in the treatment with the lower fungal extract concentration (25 µg protein/mL), their fluorescence intensity was lower than that of the control (Figure 8B).
Discussion
Allergic conditions are regarded as the epidemics of the twentieth century, with a continuously rising incidence, and are projected to impact over 30% of the population in developed nations.
Fungi are known to be the most prominent source of allergens. A catalog of the fungal allergens described comprises 174 allergens for the phylum Ascomycota and 30 for the phylum Basidiomycota, with the essential allergenic fungi belonging to the genera Alternaria, Aspergillus, Cladosporium, Penicillium, and Fusarium.1,2 Here, for the first time, we present two phytopathogenic microfungi belonging to the Erysiphales order, Erysiphe palczewskii and Erysiphe convolvuli, exhibiting allergenic potential. Additionally, to support the microscopic identification of the studied fungal species, we describe their identification at the molecular level.
The fungal species isolated from Caragana arborescens Lam. and Convolvulus arvensis L. represent the Erysiphe genus. The sequence LSU+ITS analysis result revealed 92–100% similarity between the isolates in this study and the members of the Erysiphe genus. The identification and molecular characterization of the studied isolates to the species level by the analysis of the LSU and ITS regions, partial beta-tubulin, calmodulin, and glutamine synthetase genes showed that they represent E. convolvuli and E. palczewskii species.
An essential element of the pathogenesis of the disease is the entry of spores into the body. This is possible due to their small size, which does not exceed 10 µm.22 Although the size of E. palczewskii and E. convolvuli ascospores exceeds 10 µm, their penetration into bronchi and alveoli in humans is also probable since even larger fungal hyphae are inhalable.23
The development of allergy and asthma is based on inflammatory responses to an allergen. A critical role in amplifying allergic inflammation is played by T-helper type 2 cell-derived cytokines such as interleukin (IL)-4, IL-5, and IL-13.24,25 However, the airway epithelium also produces a set of cytokines driving inflammatory responses and inducing airway remodeling, ie, proinflammatory IL-1β and IL-6, GM-CSF (recruitment of granulocytes and monocytes), TNF-α (responsible for epithelial integrity), and TGFβ (airway remodeling).26 In an in vitro study of inflammatory reactions after contact with our two fungal extracts, we used two common in such study model cell lines: human normal bronchial epithelial cells (BEAS-2B)27 and human lung carcinoma epithelial cells (A549).27–29 Both E. palczewskii and E. convolvuli extracts induced marked release of IL-1β, TNF-α, and GM-CSF in airway epithelial cells, with BEAS-2B being more sensitive. There are no data to compare with the microfungi studied here; however, in the same BEAS-2B cell line, hyphal fragments of Aspergillus fumigatus and Penicillium chrysogenum did not induce IL-1β and TNF-α release.30 In response to stimulation with conidia or mycelial fragments of A. fumigatus, A549 cells responded by increased production of TNF-α and GM-CSF.31 This may indicate a fungal species-dependent and a cell-dependent inflammatory response. Our research has validated that the airway epithelium, rather than solely serving a mechanistic role, actively contributes to developing asthma and other allergic conditions.
The airway epithelium is the first line of interaction with the external environment. In asthma, this protective barrier function of the airway epithelial layer is disrupted, leading to its remodeling. The cause of epithelial cell impairment is infectious factors, eg, viruses, and non-infectious factors, eg, allergens, including fungi.32,33 A crucial aspect of epithelial remodeling in asthma involves the disruption of cell–cell contact proteins responsible for maintaining the mechanical connection between neighboring epithelial cells, thereby ensuring the barrier’s integrity. The basic structural components of epithelial junctions are E-cadherin and occludin.32,34 Their decreased expression was proven in some allergic disorders, eg, allergic rhinitis, chronic rhinosinusitis,35 and asthma.32,36 There may be several reasons for the epithelial impairment and/or decreased expression of epithelial junction proteins: fungal proteases, cytokines, and reactive oxygen species.34 It is well known that E-cadherin and occludin are prominent proteins involved in forming epithelial tight junctions. Therefore, studying their expression indirectly indicates the condition of epithelial barriers. To determine the presence of those junction proteins, an immunofluorescence method is also used.37–39
Many aeroallergens (mite, pollen, cat, dog, fungal spp.) have protease activity. They have the ability to induce the disruption of the epithelial barrier and E-cadherin connections through both direct means (such as proteolytic activity) and indirect means (by activating pattern-recognition receptors (PRRs)).33 Also, pro-inflammatory cytokines may influence epithelium integrity. Saito T. et al have shown that TNF-α and IL-6 reduced E-cadherin expression in Madin-Darby canine kidney (MDCK) cells.40 In human bronchial epithelial cells (HBEC), TNF-α caused loss of occludin and claudins from tight junctions with redistribution of E-cadherin.41 Shiozaki et al reported that TNF-α and TGF-β1 decreased the expression of E-cadherin and occludin in A549 cells.42 It is well established that fungal aeroallergens also induce the synthesis of proinflammatory cytokines. In human epithelial cell line A549, IL-6 and IL-8 mRNA levels were enhanced by Aspergillus fumigatus proteases due to the induction of the respective genes.43 These results were confirmed by a more recent experiment conducted by Bellanger et al, where exposure of A549 cells to live A. fumigatus conidia induced a four- to fivefold increase in the mRNA levels of the genes encoding IL-8, TNF-α, and GM-CSF.44 Several studies have also shown that infection of bronchial epithelial cells with A. fumigatus leads to the release of pro-inflammatory cytokines, mostly IL-6, IL-8, or TNF-α.45,46 As stated above, the E. palczewskii and E. convolvuli extracts used in our studies induced marked release of IL-1β, TNF-α, and GM-CSF in the airway epithelial cells.
Although all known ROS were found to be cytotoxic, there is also strong evidence that oxidative stress disrupts epithelial and/or endothelial tight junctions in the lungs.47,48 For instance, hydrogen peroxide-induced redistribution of E-cadherin from intercellular junctions into the intracellular compartment rapidly increased tyrosine phosphorylation of both occludin and E-cadherin, breaking these tight junctions.49 Fungi can also induce reactive oxygen species, eg, Alternaria exposure causes oxidative stress in human airway epithelial cells.49,50 In our study, both E. palczewskii and E. convolvuli extracts reduced visibility of E-cadherin and occludin in the A549 and BEAS-2B cells, as indicated by the fluorescence method. This was in line with the enhanced production of TNF-α in both these cell lines after contact with the fungal extracts. Additionally, the E. palczewskii extract applied in the studied concentrations induced reactive oxygen species production in cell lines A549 and BEAS-2B, while the E. convolvuli extract caused ROS production only in the A549 cells. These results may explain the disruption of the epithelial barrier upon inhalation of the analyzed microfungi; however, this issue requires an in vivo study to confirm.
Conclusion
Taken together, our data from an in vitro cell model reflecting the upper and lower respiratory epithelium for the first time demonstrate that the Erysiphe palczewskii and Erysiphe convolvuli microfungal parasites of common plants have proinflammatory and hence possible proallergenic potential. Extracts of these microfungi induce proinflammatory cytokines and reactive oxygen species production, which positively correlate with attenuation/disruption of tight junction proteins, E-cadherin and occludin, in bronchial and alveolar epithelial cell models. However, to confirm the possible proinflammatory and proallergenic potential of Erysiphe palczewskii and Erysiphe convolvuli, the in vivo model should be studied in the future. One limitation of this study is the use of microfungal extracts that need to be standardized to indicate the most active components.
Data Sharing Statement
The article contains all the necessary data pertaining to the study. The original findings presented in the research are included in the article and supplementary material. For additional inquiries, please contact the corresponding author.
Author Contributions
All authors made a significant contribution to the work reported, whether that is in the conception, study design, execution, acquisition of data, analysis, and interpretation, or in all these areas; took part in drafting, revising, or critically reviewing the article; gave final approval of the version to be published; have agreed on the journal to which the article has been submitted; and agree to be accountable for all aspects of the work.
Funding
This work was supported by National Science Centre (Poland) project OPUS N 2019/35/B/NZ6/00472.
Disclosure
The authors declare that the research was conducted without any commercial or financial relationship that could be construed as a potential conflict of interest.
References
1. Crameri R, Garbani M, Rhyner C, Huitema C. Fungi: the neglected allergenic sources. Allergy. 2014;69(2):176–185. doi:10.1111/all.12325
2. Zukiewicz-Sobczak WA. The role of fungi in allergic diseases. Postepy Dermatol Alergol. 2013;30(1):42–45. doi:10.5114/pdia.2013.33377
3. Horner WE, Helbling A, Salvaggio JE, Lehrer SB. Fungal allergens. Clin Microbiol Rev. 1995;8(2):161–179. doi:10.1128/CMR.8.2.161
4. Cecchi L, D’Amato G, Ayres JG, et al. Projections of the effects of climate change on allergic asthma: the contribution of aerobiology. Allergy. 2010;65(9):1073–1081. doi:10.1111/j.1398-9995.2010.02423.x
5. Fukutomi Y, Taniguchi M. Sensitization to fungal allergens: resolved and unresolved issues. Allergol Int. 2015;64(4):321–331. doi:10.1016/j.alit.2015.05.007
6. White TJ, Bruns TD, Lee SB, Taylor JW. Amplification and Direct Sequencing of Fungal Ribosomal RNA Genes for Phylogenetics. In: Innis MA, Gelfand DH, Sninsky JJ, White TJ, editors. PCR Protocols: A Guide to Methods and Applications. Academic Press; 1990:315–322.
7. Mori Y. Evolutionary analysis of the powdery mildew fungi (Erysiphales) using nucleotide sequences of the nuclear ribosomal DNA. Mycologia. 2000;92:74–93.
8. Takamatsu S, Kano Y. PCR primers are useful for nucleotide sequencing of the rDNA of the powdery mildew fungi. Mycoscience. 2001;42:135–139.
9. Hsiao H-YA HA, Hsu -C-C, Wang C-J, Shen Y-M. New Records of Powdery Mildews from Taiwan: erysiphe ipomoeae comb. Nov., E. aff. betae on Buckwheat, and E. neolycopersici comb. Nov. on Cardiospermum halicacabum. Diversity. 2022;14:204. doi:10.3390/d14030204
10. Bradshaw MJGG-X, Guan G-X, Nokes L, Braun U, Liu S-Y, Pfister DH. Secondary DNA Barcodes (CAM, GAPDH, GS, and RpB2) to Characterize Species Complexes and Strengthen the Powdery Mildew Phylogeny. Front Ecol Evol. 2022;10:918908. doi:10.3389/fevo.2022.918908
11. Thompson JD, Higgins DG, Gibson,TJ. CLUSTAL W: improving the sensitivity of progressive multiple sequence alignment through sequence weighting, position-specific gap penalties and weight matrix choice. Nucleic Acids Res. 1994;22(22):4673–4680. doi:10.1093/nar/22.22.4673
12. Nicholas KB. GeneDoc. Pittsburgh Supercomputing Center, Pittsburgh. 1997.
13. Tamura K, Stecher G, Kumar S, Battistuzzi FU. MEGA11: molecular Evolutionary Genetics Analysis Version 11. Mol Biol Evol. 2021;38(7):3022–3027. doi:10.1093/molbev/msab120
14. Darriba D, Taboada GL, Doallo R, Posada D. jModelTest 2: more models, new heuristics and parallel computing. Nat Methods. 2012;9(8):772. doi:10.1038/nmeth.2109
15. Page RD. TreeView: an application to display phylogenetic trees on personal computers. Comput Appl Biosci. 1996;12(4):357–358. doi:10.1093/bioinformatics/12.4.357
16. Menezes EA, Gambale W, Macedo MS, Abdalla DS, Paula CR, Croce J. Biochemical, antigenic and allergenic characterization of crude extracts of Drechslera (Helminthosporium) monoceras. Mycopathologia. 1995;131(2):75–81. doi:10.1007/BF01102882
17. Zhao F, Klimecki WT. Culture conditions profoundly impact phenotype in BEAS-2B, a human pulmonary epithelial model. J Appl Toxicol. 2015;35(8):945–951. doi:10.1002/jat.3094
18. Mosmann T. Rapid colorimetric assay for cellular growth and survival: application to proliferation and cytotoxicity assays. J Immunol Methods. 1983;65(1–2):55–63. doi:10.1016/0022-1759(83)90303-4
19. Wojciechowska A, Bregier Jarzebowska R, Komarnicka UK, et al. Isothiocyanate l-argininato copper(II) complexes - Solution structure, DNA interaction, anticancer and antimicrobial activity. Chem Biol Interact. 2021;348:109636. doi:10.1016/j.cbi.2021.109636
20. Sałata B. Grzyby (Mycota). Workowce (Ascomycetes) Mączniakowe (Erysiphales). PAN, Instytut Botaniki. 1985;15:246.
21. Braun U. CRTA. Taxonomic manual of the Erysiphales (Powdery Mildews). CBS Biodiversity Series. 2012;11:1–707.
22. Kurup VP, Shen HD, Banerjee B. Respiratory fungal allergy. Microbes Infect. 2000;2(9):1101–1110. doi:10.1016/s1286-4579(00)01264-8
23. Luo Y, Liu F, Deng L. Innate and Adaptive Immune Responses Induced by Aspergillus fumigatus Conidia and Hyphae. Curr Microbiol. 2023;80. doi:10.1007/s00284-022-03102-1
24. Nakajima H, Takatsu K. Role of cytokines in allergic airway inflammation. Int Arch Allergy Immunol. 2007;142(4):265–273. doi:10.1159/000097357
25. Lambrecht BN, Hammad H, Fahy JV. The Cytokines of Asthma. Immunity. 2019;50(4):975–991. doi:10.1016/j.immuni.2019.03.018
26. Gandhi VD, Vliagoftis H. Airway epithelium interactions with aeroallergens: role of secreted cytokines and chemokines in innate immunity. Front Immunol. 2015;6:147. doi:10.3389/fimmu.2015.00147
27. Verstraelen S, Bloemen K, Nelissen I, Witters H, Schoeters G, Van Den Heuvel R. Cell types involved in allergic asthma and their use in in vitro models to assess respiratory sensitization. Toxicol In Vitro. 2008;22(6):1419–1431. doi:10.1016/j.tiv.2008.05.008
28. Blume C, Foerster S, Gilles S, et al. Human epithelial cells of the respiratory tract and the skin differentially internalize grass pollen allergens. J Invest Dermatol. 2009;129(8):1935–1944. doi:10.1038/jid.2008.459
29. Crossen AJ, Ward RA, Reedy JL, et al. Human Airway Epithelium Responses to Invasive Fungal Infections: a Critical Partner in Innate Immunity. J Fungi. 2022;9:1. doi:10.3390/jof9010040
30. Oya E, Becher R, Ekeren L, Afanou AKJ, Ovrevik J, Holme JA. Pro-Inflammatory Responses in Human Bronchial Epithelial Cells Induced by Spores and Hyphal Fragments of Common Damp Indoor Molds. Int J Environ Res Public Health. 2019;16:6. doi:10.3390/ijerph16061085
31. Osherov N. Interaction of the pathogenic mold Aspergillus fumigatus with lung epithelial cells. Front Microbiol. 2012;3:346. doi:10.3389/fmicb.2012.00346
32. Heijink IH, Kuchibhotla VNS, Roffel MP, et al. Epithelial cell dysfunction, a major driver of asthma development. Allergy. 2020;75(8):1902–1917. doi:10.1111/all.14421
33. Nawijn MC, Hackett TL, Postma DS, van Oosterhout AJ, Heijink IH. E-cadherin: gatekeeper of airway mucosa and allergic sensitization. Trends Immunol. 2011;32(6):248–255. doi:10.1016/j.it.2011.03.004
34. Rao R. Oxidative stress-induced disruption of epithelial and endothelial tight junctions. Front Biosci. 2008;13:7210–7226. doi:10.2741/3223
35. Grimm D, Hwang PH, Lin YT. The link between allergic rhinitis and chronic rhinosinusitis. Curr Opin Otolaryngol Head Neck Surg. 2023;31(1):3–10. doi:10.1097/MOO.0000000000000865
36. Yuksel H, Ocalan M, Yilmaz O. E-Cadherin: an Important Functional Molecule at Respiratory Barrier Between Defence and Dysfunction. Front Physiol. 2021;12:720227. doi:10.3389/fphys.2021.720227
37. Gao N, Raduka A, Rezaee F. Respiratory syncytial virus disrupts the airway epithelial barrier by decreasing cortactin and destabilizing F-actin. J Cell Sci. 2022;135:16. doi:10.1242/jcs.259871
38. Carlier FM, Dupasquier S, Ambroise J, et al. Canonical WNT pathway is activated in the airway epithelium in chronic obstructive pulmonary disease. EBioMedicine. 2020;61:103034. doi:10.1016/j.ebiom.2020.103034
39. Petecchia L, Sabatini F, Usai C, Caci E, Varesio L, Rossi GA. Cytokines induce tight junction disassembly in airway cells via an EGFR-dependent MAPK/ERK1/2-pathway. Lab Invest. 2012;92(8):1140–1148. doi:10.1038/labinvest.2012.67
40. Saito T, Yoshida K, Matsumoto K, et al. Inflammatory cytokines induce a reduction in E-cadherin expression and morphological changes in MDCK cells. Res Vet Sci. 2014;96(2):288–291. doi:10.1016/j.rvsc.2014.02.005
41. Hardyman MA, Wilkinson E, Martin E, et al. TNF-alpha-mediated bronchial barrier disruption and regulation by src-family kinase activation. J Allergy Clin Immunol. 2013;132(3):665–675 e8. doi:10.1016/j.jaci.2013.03.005
42. Shiozaki A, Bai XH, Shen-Tu G, et al. Claudin 1 mediates TNFalpha-induced gene expression and cell migration in human lung carcinoma cells. PLoS One. 2012;7(5):e38049. doi:10.1371/journal.pone.0038049
43. Borger P, Koeter GH, Timmerman JA, Vellenga E, Tomee JF, Kauffman HF. Proteases from Aspergillus fumigatus induce interleukin (IL)-6 and IL-8 production in airway epithelial cell lines by transcriptional mechanisms. J Infect Dis. 1999;180(4):1267–1274. doi:10.1086/315027
44. Bellanger AP, Millon L, Khoufache K, et al. Aspergillus fumigatus germ tube growth and not conidia ingestion induces expression of inflammatory mediator genes in the human lung epithelial cell line A549. J Med Microbiol. 2009;58(Pt 2):174–179. doi:10.1099/jmm.0.005488-0
45. Balloy V, Sallenave JM, Wu Y, et al. Aspergillus fumigatus-induced interleukin-8 synthesis by respiratory epithelial cells is controlled by the phosphatidylinositol 3-kinase, p38 MAPK, and ERK1/2 pathways and not by the toll-like receptor-MyD88 pathway. J Biol Chem. 2008;283(45):30513–30521. doi:10.1074/jbc.M803149200
46. Tomee JF, Wierenga AT, Hiemstra PS, Kauffman HK. Proteases from Aspergillus fumigatus induce release of proinflammatory cytokines and cell detachment in airway epithelial cell lines. J Infect Dis. 1997;176(1):300–303. doi:10.1086/517272
47. Yamaya M, Sekizawa K, Masuda T, Morikawa M, Sawai T, Sasaki H. Oxidants affect permeability and repair of the cultured human tracheal epithelium. Am J Physiol. 1995;268(2 Pt 1):L284–93. doi:10.1152/ajplung.1995.268.2.L284
48. Zhang Q, Lin JL, Thomas PS. Reactive Oxygen Species and Obstructive Lung Disease. Laher I, editor. Systems Biology of Free Radicals and Antioxidants. Springer; 2014.
49. Iijima KKT, Uchida M, Anderson EL, et al. Oxidative stress responses to the fungal allergen Alternaria mediate IL-33 secretion by airway epithelial cells and type 2 immunity in the airways. J Allergy Clin Immunol. 2016;137:AB199.
50. Zaidman NA, O’Grady KE, Patil N, et al. Airway epithelial anion secretion and barrier function following exposure to fungal aeroallergens: role of oxidative stress. Am J Physiol Cell Physiol. 2017;313(1):C68–C79. doi:10.1152/ajpcell.00043.2017
 © 2023 The Author(s). This work is published and licensed by Dove Medical Press Limited. The
full terms of this license are available at https://www.dovepress.com/terms
and incorporate the Creative Commons Attribution
- Non Commercial (unported, 3.0) License.
By accessing the work you hereby accept the Terms. Non-commercial uses of the work are permitted
without any further permission from Dove Medical Press Limited, provided the work is properly
attributed. For permission for commercial use of this work, please see paragraphs 4.2 and 5 of our Terms.
© 2023 The Author(s). This work is published and licensed by Dove Medical Press Limited. The
full terms of this license are available at https://www.dovepress.com/terms
and incorporate the Creative Commons Attribution
- Non Commercial (unported, 3.0) License.
By accessing the work you hereby accept the Terms. Non-commercial uses of the work are permitted
without any further permission from Dove Medical Press Limited, provided the work is properly
attributed. For permission for commercial use of this work, please see paragraphs 4.2 and 5 of our Terms.
Recommended articles
The Potential Proallergenic Activity of Tranzschelia pruni-spinosae and Phragmidium rubi-idaei in vitro Studies
Sztandera-Tymoczek M, Wdowiak-Wróbel S, Świderska U, Palusińska-Szysz M, Szuster-Ciesielska A
Journal of Inflammation Research 2025, 18:1107-1125
Published Date: 25 January 2025
In vitro Study of Fungus-Like Organisms Peronospora ficariae and Wilsoniana bliti as Potential Inhalant Allergens
Sztandera-Tymoczek M, Wdowiak-Wróbel S, Świderska U, Palusińska-Szysz M, Szuster-Ciesielska A
Journal of Inflammation Research 2025, 18:10445-10466
Published Date: 4 August 2025