Back to Journals » Journal of Inflammation Research » Volume 14
Potential Biomarkers Associated with Differential Manifestations of Ulcerative Colitis (UC) in Uyghur and Han Population in China
Authors Lu JJ, Maimaiti M, Liu H, Liu WD, Hui WJ, Huang XL, Gao F ![]()
Received 27 August 2021
Accepted for publication 23 October 2021
Published 30 December 2021 Volume 2021:14 Pages 7431—7441
DOI https://doi.org/10.2147/JIR.S335293
Checked for plagiarism Yes
Review by Single anonymous peer review
Peer reviewer comments 3
Editor who approved publication: Professor Ning Quan
Jia Jie Lu, Munila Maimaiti, Huan Liu, Wei Dong Liu, Wen Jia Hui, Xiao Ling Huang, Feng Gao
Department of Gastroenterology, People’s Hospital of Xinjiang Uygur Autonomous Region, Urumqi, Xinjiang Uygur Autonomous Region, People’s Republic of China
Correspondence: Feng Gao
Department of Gastroenterology, People’s Hospital of Xinjiang Uygur Autonomous Region, No. 91 Tianchi Road, Urumqi, 830001, Xinjiang Uygur Autonomous Region, People’s Republic of China
Email [email protected]
Background: Ulcerative colitis (UC) is one of the main subtypes of inflammatory bowel disease (IBD). The incidence of UC in the Xinjiang region is relatively high in China and the manifestations of UC in Uyghur and Han patients are usually differential. This study aimed to identify potential biomarkers of UC.
Methods: All miRNA and mRNA were extracted from the tissue samples obtained from participants in Xinjiang. Differential expression analysis was performed on all mRNAs and miRNAs. The target genes of miRNAs were predicted via three databases. The clusterProfiler package was used for GO and KEGG pathway enrichment analysis.
Results: Preliminarily, four miRNAs and 15 genes were associated with the differential manifestations of UC in Uyghur and Han patients. Through the co-expression network construction and further screening in more samples, two miRNAs (hsa-miR-141-5p and hsa-miR-378a-5p) and three genes (ARNTL2, CLDN1 and SLC6A14) were found to be more crucial. These 15 genes were enriched in tight junction, NF-κB, and several other pathways.
Conclusion: Two miRNAs (hsa-miR-141-5p and hsa-miR-378a-5p) and three genes (ARNTL2, CLDN1, and SLC6A14) associated with the differential manifestations of UC in Uyghur and Han population were identified, which were potential biomarkers.
Keywords: ulcerative colitis, miRNA, biomarkers, Uyghur, Han
Introduction
Ulcerative colitis (UC) is one of the main subtypes of inflammatory bowel diseases (IBD), which is a kind of chronic and relapsing disease in the digestive system.1,2 Increasing incidence of UC has been observed in many countries recently and Northern Europe has the highest reported incidence, about 500 per 100,000 people.3 Typically, UC is characterized by diffuse and continuous inflammation of the mucosa and submucosa of the colon and rectum, which finally results in the occurrence of ulcers.4–6 And the most common and representative symptoms of UC comprise of abdominal pain, bloody stools, bloody diarrhea, tenesmus, and so on.4,7 Not only that, UC is closely associated with the occurrence of colorectal cancer.8 At present, the diagnosis of UC mainly relies on clinical evaluation, fecal or serological biomarkers and endoscopy, but these methods are far from meeting the increasing needs of clinical diagnoses.9 Despite the incidence of UC in China being low, the number of UC patients is growing annually.10 Furthermore, the incidence of UC in Xinjiang region was relatively high in China.11 Besides, some differential manifestations of UC in Uyghur and Han patients have been documented previously, such as more moderate/severe forms and a higher complication rate,12 higher endoscopic detection rate of UC,11 and elevated frequency of positive antineutrophilic cytoplasmic antibodies (ANCA)13 in Uyghur patients, which might result from the differential genetic background of patients. Accordingly, novel potential biomarkers will help us further understand the causes of differential manifestations of UC in various ethnic groups.
In recent decades, many researchers have explored potential biomarkers in UC, not only serologic markers but also target genes in UC.14–16 Compared with endoscopy, biomarkers are not so expensive and the invasiveness of applying biomarkers in UC patients is relatively low.17,18 Thus, there are numerous studies on biomarkers in UC. A recent study has reported that 270 differentially expressed genes were identified between UC samples and healthy control samples.16 And CXCR2 has been documented to be a biomarker as a treatment target in UC.19 Moreover, it has been reported that SLC6A14 and DUOXA2 might be new targets for UC gene therapy.20 Unfortunately, the present UC diagnoses are still uncertain and limited in some cases despite being conducted by expert clinicians.15,21,22 Therefore, further exploration is still needed in order to find more reliable biomarkers in UC. To the best of our knowledge, no previous research has focused on differential manifestations of UC in Uyghur and Han patients in Xinjiang region, China. Thus, our findings would be potentially beneficial for target treatments in differential ethnic groups of UC patients.
In this study, through a joint analysis of miRNAs and mRNAs extracted from Uyghur and Han UC patients, we proposed to identify potential biomarkers related to the differential manifestations of UC in Uyghur and Han populations, so as to further understand the mechanisms of UC in different ethnic groups, and lay the foundation for UC targeted therapies in the future.
Materials and Methods
Research Object
There were a total of 32 participants with complete follow-up data and specimens who participated in the present study, which all came from the People’s Hospital of Xinjiang Uygur Autonomous Region in Urumqi, Xinjiang, China, from February 2020 to November 2020. The adult patients all met clinical diagnostic guidelines.23 All the experiments were approved by the Ethics Committee of People’s Hospital of Xinjiang Uygur Autonomous Region (Ethical code: Xinjiang District Hospital Ethics Committee 2015110), and informed consents were obtained from all subjects. Colonic mucosa tissue samples were collected from ulcerative colitis patients and healthy participants, and the same types of samples were randomly divided into two groups for subsequent bioinformatic prediction and experimental validation. Each group included four Uighur patients with ulcerative colitis (UIU), four Uighur healthy participants (UIN), four Han patients with ulcerative colitis (HU), and four Han healthy participants (HN) (all had no autoimmune disease or genetic diseases). All samples were quickly frozen and stored at −80°C. The detailed clinical information of all subjects is shown in Supplementary Table S1.
MiRNA Chip Experiment
The total RNA of samples were extracted according to the Trizol method. And quality control was performed on total RNA, including spectrophotometer quantify and formaldehyde denaturing gel electrophoresis. The miRNA was isolated from the total RNA using the mirVana™ miRNA Isolation Kit (AM1561) and 200 ng was taken for further experiment. MiRNAs were analyzed using miRNA microarray according to Agilent standard procedures. The miRNA expression data of samples was detected using the Agilent Human miRNA Microarray platform.
mRNA Chip Experiment
The total RNA of samples were extracted according to the Trizol method. And quality control was performed on total RNA, including spectrophotometer quantify and agarose gel electrophoresis. The mRNA chip analysis was performed following the Affymetrix standard procedure. The mRNA expression profile was detected using Affymetrix PrimeView Human Gene Expression Array.
Chip Differentially Expressed Analysis
The raw data of miRNA expression profile was normalized using Agilent GeneSpring software. The raw data of mRNA expression profile (.cel file) was normalized according to the robust multichip average (RMA)24 algorithm.
Based on the linear model, the limma package25 was used to perform differential expression analysis on the normalized miRNA and mRNA expression data, respectively. Differentially expressed miRNAs (DEMs) and differentially expressed genes (DEGs) were screened according to the |Log2FC|>0.5 and p-value<0.05.
Prediction of miRNA Target Genes
The target genes of DEMs were predicted via three databases, including TargetScanHuman database (version 7.2) (http://www.targetscan.org/vert_72/),26 miRTarBase database (version 7.0) (http://mirtarbase.mbc.nctu.edu.tw/php/index.php),27 and miRDB database (version 6.0) (http://mirdb.org/index.html).28 Those target genes were considered to be more reliable, which appeared in two or more databases simultaneously.
Functional Enrichment Analysis
The clusterProfiler package29 in R language was used for Gene ontology (GO) (including Biological Process, Molecular Function, and Cellular Component) and Kyoto Encyclopedia of Genes and Genomes (KEGG) pathway enrichment analysis. GO terms and KEGG pathways with a p-value<0.05 were considered as significantly enriched.
RNA Extraction and Quantitative-PCR (qPCR)
Total RNA was isolated from tissues by Trizol reagent (Cat# 15596-026, Invitrogen, CA) and quantified by Nanodrop lite (Thermo, USA). MiRNA was purified with RNasey Mini Kit (Qiagen). Complementary DNA (cDNA) was obtained by TIANScript RT kit (Cat# KR104-02, TIANGEN, Beijing, China) after reverse transcription. The quantitative PCR experiment was performed and repeated for all samples by Light-Cycler480 (Roche, USA) for 40 cycles, at 95°C for 10 seconds, annealing temperature for 60 seconds, and 95°C for 15 seconds. SuperRealPreMix Plus kits (Cat# FP205, TIANGEN, Beijing, China) were prepared for qPCR, and mRNA levels of target mRNA and miRNA were normalized to that of β-actin. The primers of target mRNA and miRNA and β-actin are listed in the Tables 1 and 2. The data of qPCR was analyzed and calculated by the 2–ΔΔCt formula.
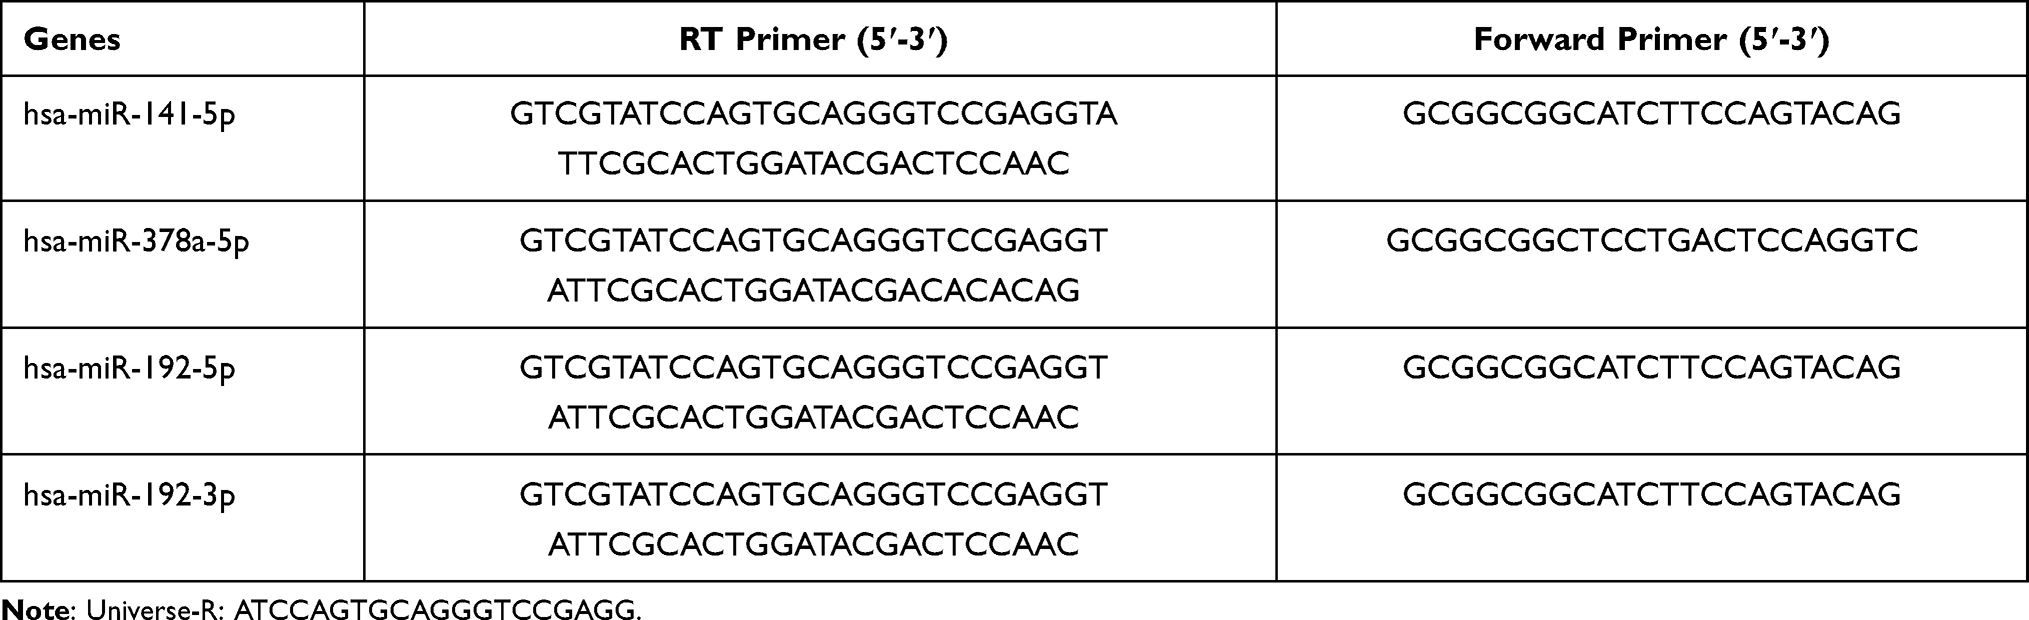 |
Table 1 miRNA Primer Sequences for RT-PCR |
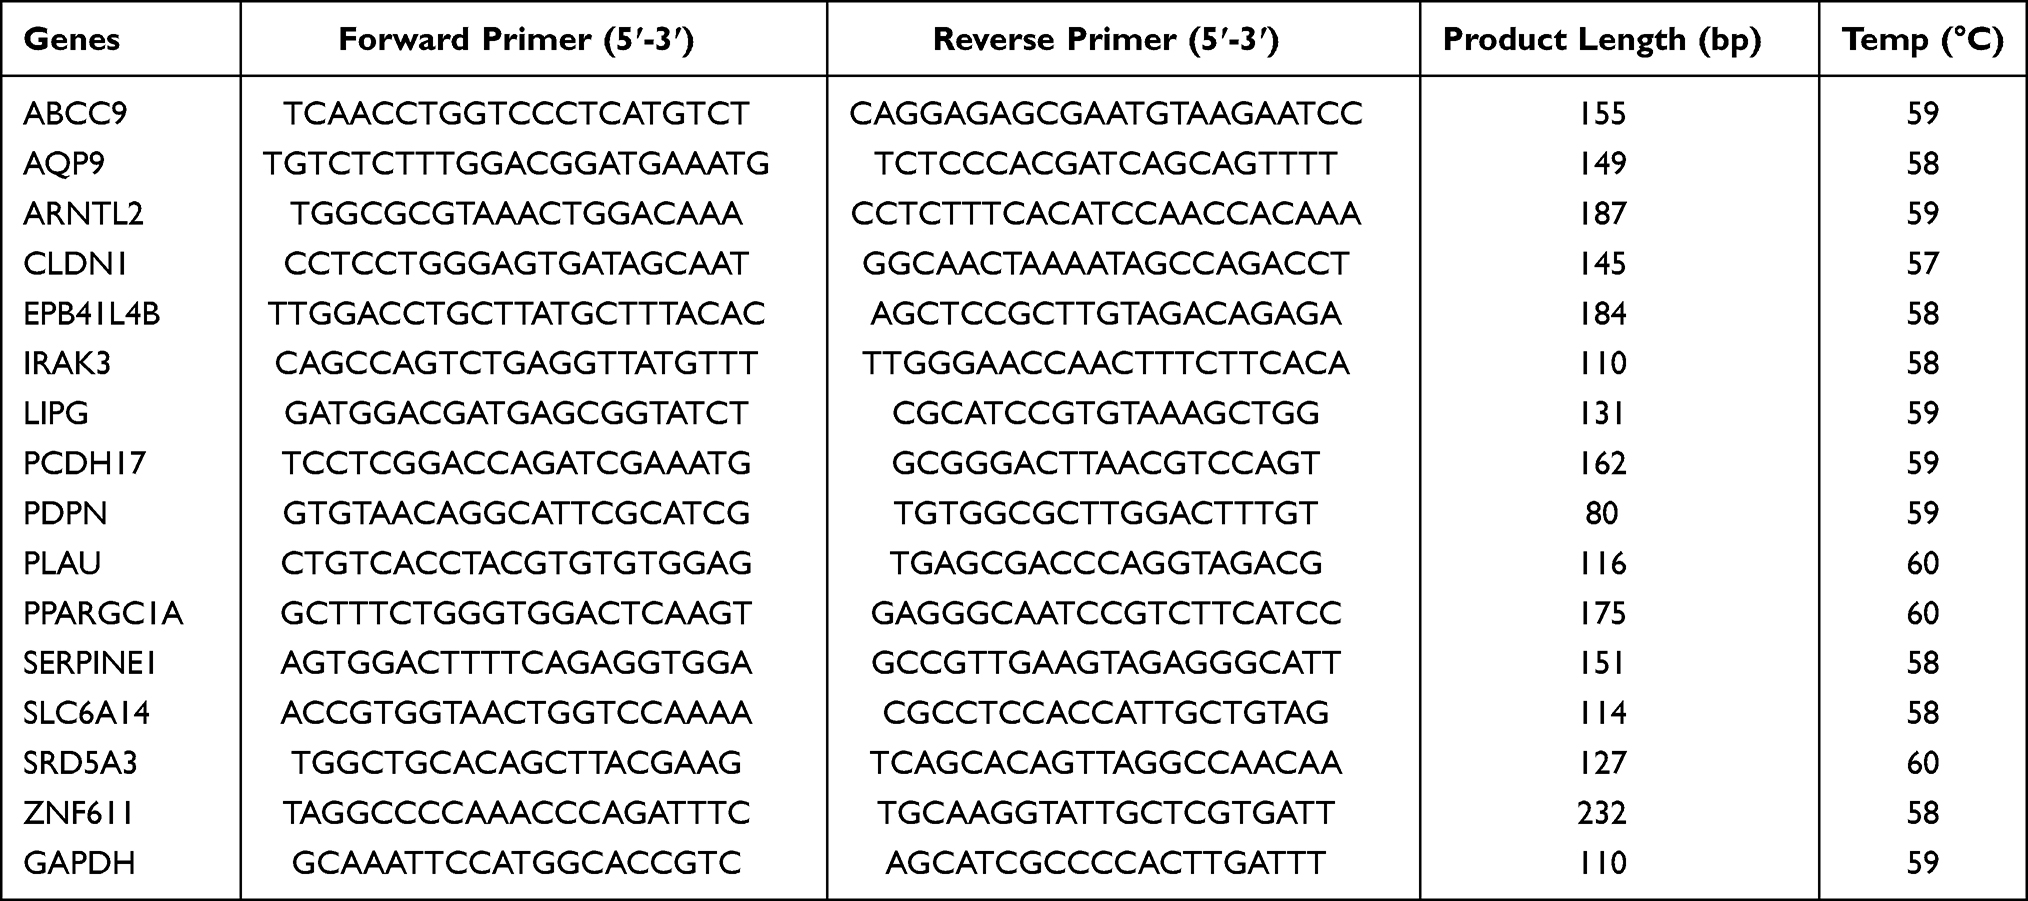 |
Table 2 mRNA Primer Sequences for RT-PCR |
Results
Potential miRNAs That Led to Differential Manifestations of UC in Uyghur and Han Population
The distribution of normalized miRNA data of 16 samples is shown in Supplementary Figure S1A. Differential expression analysis was performed based on the expression levels of all miRNAs, and miRNA expression levels of samples were compared between different groups. Compared with the UIN group, there were 128 differentially expressed miRNAs (DEMs) in the UIU group, among which 50 miRNAs were upregulated and 78 miRNAs were downregulated (Figure 1A); the expression levels of DEMs were significantly different between the two groups (Figure 1E). Compared with the HN group, there were 57 DEMs in the HU group, including 15 upregulated miRNAs and 42 downregulated miRNAs (Figure 1B); the expression levels of DEMs were significantly different between two groups (Figure 1F). Compared with the HU group, there were 135 DEMs in the UIU group, among which 110 miRNAs were upregulated and 25 miRNAs were downregulated (Figure 1C); the expression levels of DEMs were significantly different between the two groups (Figure 1G). Compared with the HN group, there were 70 DEMs in the UIN group, among which 68 miRNAs were upregulated and two miRNAs were downregulated (Figure 1D); the expression levels of DEMs were significantly different between the two groups (Figure 1H).
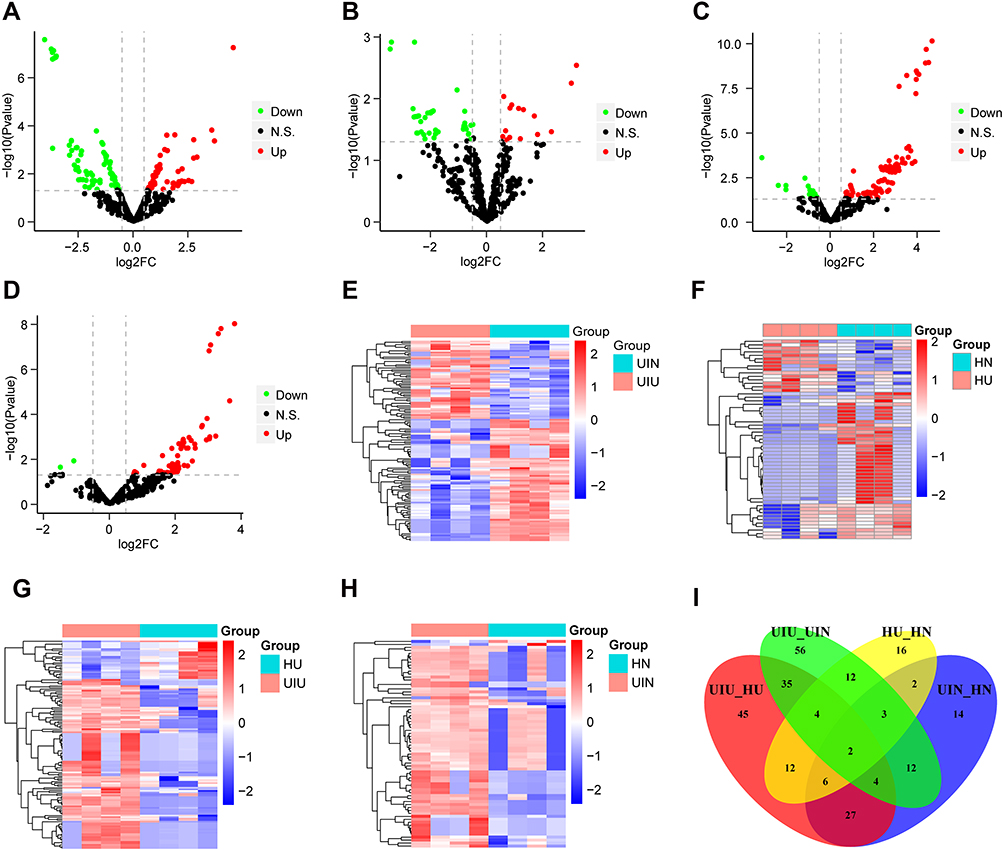 |
Figure 1 Differentially expressed miRNAs. (A–D) The volcano plots of differentially expressed miRNAs of four pairs of comparison, including UIU versus UIN, HU versus HN, UIU versus HU, UIN versus HN. The x-axis: log2FC value; the y-axis: −log10 (p-value); red: upregulation; green: downregulation; black: non-significant difference. (E–H) The expression level heat maps of differentially expressed miRNAs of four pairs of comparison, including UIU versus UIN, HU versus HN, UIU versus HU, UIN versus HN. The x-axis: miRNA; the y-axis: sample; red: high expression; blue: low expression. (I) Venn diagram of differentially expressed miRNAs. |
In the comparison between UIU versus UIN and HU versus HN, there were 21 shared DEMs and their expression levels were significantly different, which were considered as important miRNAs related to the pathogenesis of UC. Among these 21 miRNAs, six were also differentially expressed in the UIU group relative to the HU group. Meanwhile, two DEMs in the UIN group relative to the HN group were removed. Finally, the remaining four miRNAs were key miRNAs that led to differential manifestations of UC in Uyghur and Han populations, comprising hsa-miR-141-5p, hsa-miR-378a-5p, hsa-miR-192-5p, and hsa-miR-192-3p (Figure 1I).
Potential mRNAs That Led to Differential Manifestations of UC in Uyghur and Han Population
The distribution of normalized mRNA data of 16 samples is shown in Supplementary Figure S1B. Differential expression analysis was conducted based on the expression levels of all mRNAs, and mRNA expression levels were compared among various groups. Compared with the UIN group, there were 2,688 differentially expressed genes (DEGs) in the UIU group, which included 1,390 upregulated genes and 1,298 downregulated genes (Figure 2A); the expression levels of differentially expressed genes were significantly different between the two groups (Figure 2E). Compared with the HN group, 822 DEGs were significantly differential in the HU group, among which, 381 genes were upregulated and 441 genes were downregulated (Figure 2B and F). Compared with the HU group, 633 DEGs were identified in the UIU group, including 435 upregulated genes and 198 downregulated genes (Figure 2C); and the DEGs’ expression were significantly different between the two groups (Figure 2G). Compared with the HN group, a total of 68 DEGs were identified in the UIN group, among which 35 and 33 genes were upregulated and downregulated, respectively (Figure 2D); the expression levels of DEGs were significantly different between the two groups (Figure 2H).
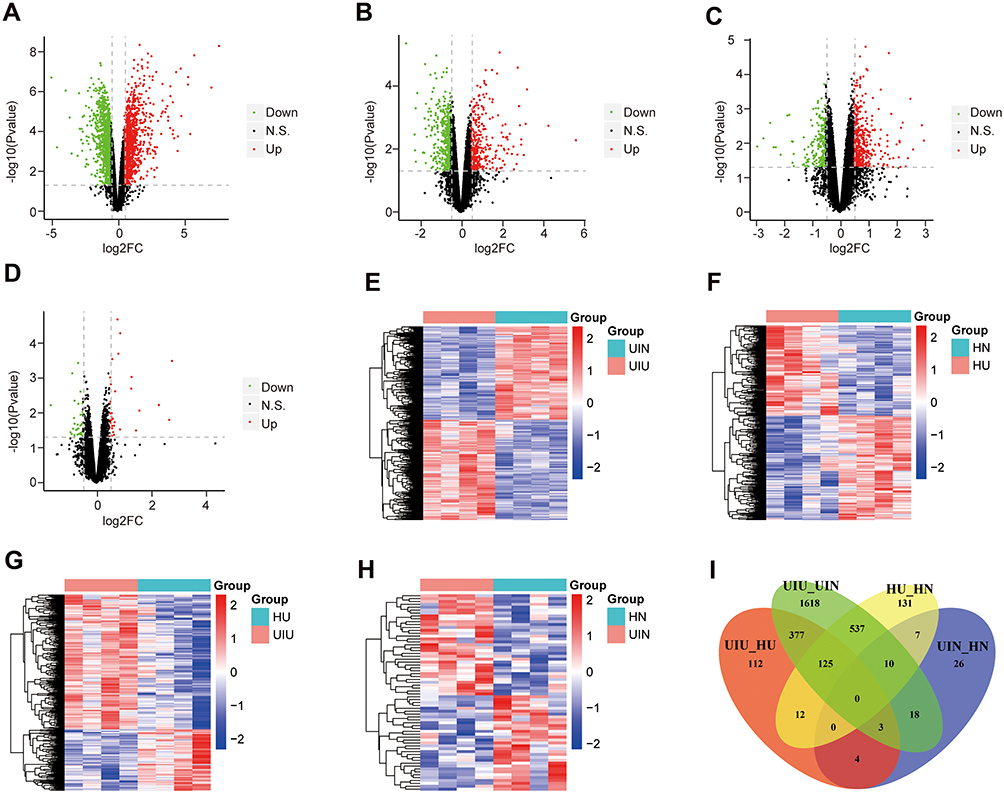 |
Figure 2 Differentially expressed mRNAs. (A–D) The volcano plots of differentially expressed genes of four pairs of comparison, including UIU versus UIN, HU versus HN, UIU versus HU, UIN versus HN. The x-axis: log2FC value; the y-axis: −log10 (p-value); red: upregulation; green: downregulation; black: non-significant difference. (E–H) The expression level heat maps of differentially expressed genes of four pairs of comparison, including UIU versus UIN, HU versus HN, UIU versus HU, UIN versus HN. The x-axis: mRNA; the y-axis: sample; red: high expression; blue: low expression. (I) Venn diagram of differentially expressed genes. |
In the comparison between UIU versus UIN and HU versus HN, there were 672 shared DEGs and their expression levels were significantly different, which were considered as important genes related to the pathogenesis of UC. Among these 672 genes, 125 genes (Supplementary Table S2) were also differentially expressed in the UIU group relative to the HU group, which were key genes that led to differential manifestations of UC in Uyghur and Han populations (Figure 2I).
Significantly Enriched GO Terms and KEGG Pathways
A functional enrichment analysis was done on the 125 genes that might cause differential manifestations of UC in Uyghur and Han populations. The genes were enriched in a total of 1,674 Biological Process terms (BP), among which 453 terms were significantly enriched (p-value<0.05). Besides, the genes were significantly enriched in 31 Cellular Component (CC) terms (p-value<0.05) and 48 Molecular Function (MF) terms (p-value<0.05). Additionally, 125 genes were enriched in 149 KEGG pathways, among which 34 pathways were significantly enriched (p- value<0.05) (Supplementary Table S3). Among them, the top 10 significantly enriched BP, CC, and MF terms are displayed in Figure 3A–C. The top 10 significantly enriched KEGG pathways are shown in Figure 3D.
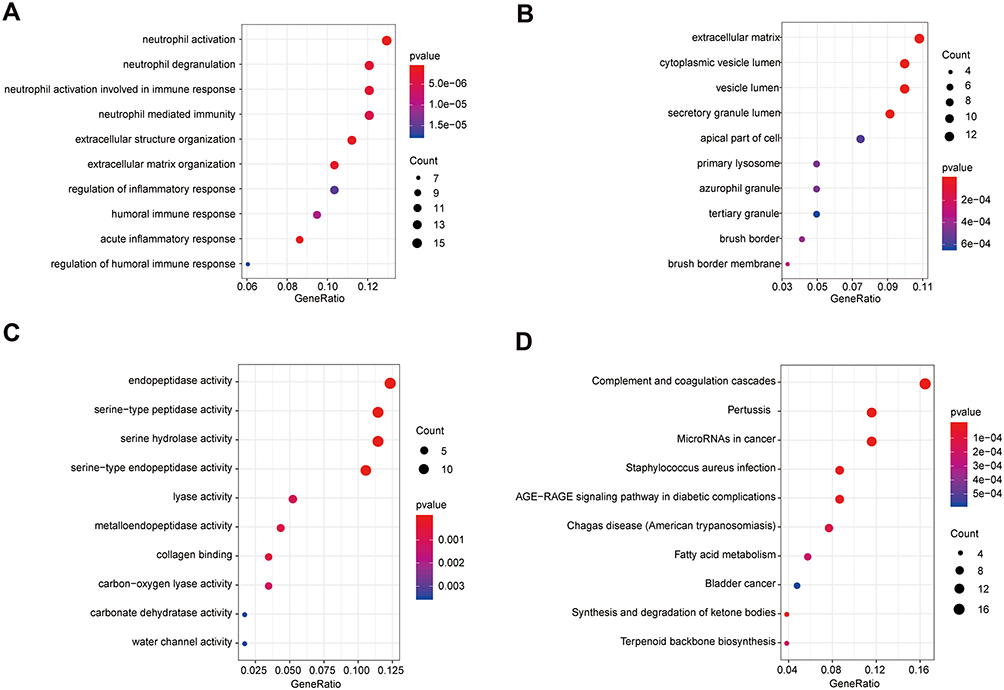 |
Figure 3 Significantly enriched terms of 125 mRNAs (top 10). (A) The top 10 significantly enriched BP terms. (B) The top 10 significantly enriched CC terms. (C) The top 10 significantly enriched MF terms. (D) The top 10 significantly enriched KEGG pathways. The x-axis: Generatio; the y-axis: GO or KEGG terms. |
MiRNA Target Gene Prediction and miRNA/mRNA Joint Analysis
The target genes of the four miRNAs were predicted using the TargetScanHuman database, miRTarBase database, and miRDB database, which were considered to be more reliable if they appeared in two or more databases simultaneously. And 8,779 target genes were predicted in the TargetScanHuman database, 1,572 target genes were predicted in the miRTarBase database, and 1,648 target genes were predicted in the miRDB database. Among them, a total of 2,383 target genes appeared in two or three databases simultaneously (Figure 4A).
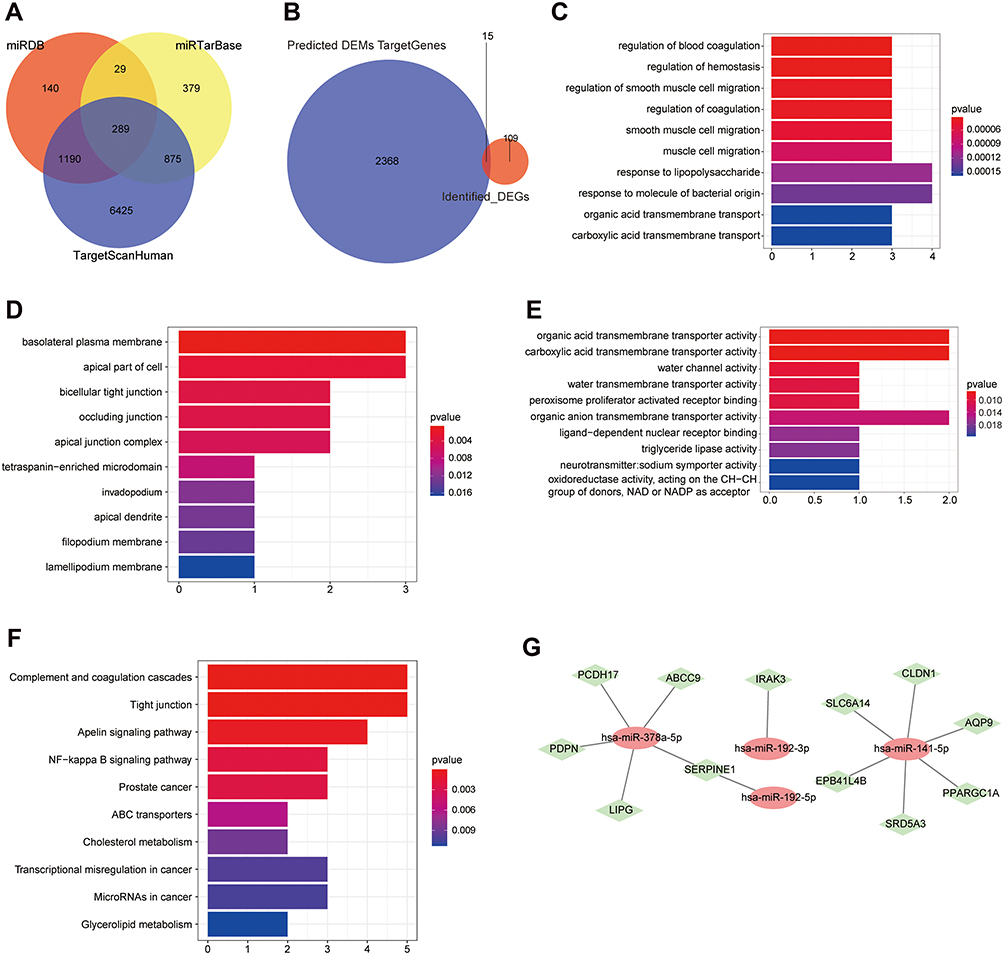 |
Figure 4 MiRNA target gene prediction and miRNA/mRNA joint analysis. (A) The target gene Venn diagram of four miRNAs predicted by different databases. (B) Venn diagram of overlap of target genes and 125 mRNAs. (C) The top 10 significantly enriched BP terms of the 15 intersection genes. (D) The top 10 significantly enriched CC terms of the 15 intersection genes. (E) The top 10 significantly enriched MF terms of the 15 intersection genes. (F) The top 10 significantly enriched KEGG pathways. (G) Co-expression network diagram of miRNAs and mRNAs. Red oval node: miRNA; green diamond node: mRNA. |
There were 15 shared genes between 2,383 target genes and 125 DEGs, including ABCC9, AQP9, ARNTL2, CLDN1, EPB41L4B, IRAK3, LIPG, PCDH17, PDPN, PLAU, PPARGC1A, SERPINE1, SLC6A14, SRD5A3, and ZNF611 (Figure 4B). These 15 genes subsequently underwent enrichment analysis so as to know more about their roles in UC. The 15 genes were significantly enriched in total 321 BP terms (p-value<0.05), 17 CC terms (p-value<0.05), and 27 MF terms (p-value<0.05). The genes were significantly enriched in 22 KEGG pathways (p-value<0.05) and the detailed enriched results ae shown in Supplementary Table S4. Among them, the top 10 significantly enriched BP, CC, MF, and KEGG terms are displayed in Figure 4C–F.
As we all know, miRNAs played a crucial role in regulation of mRNA expression. To explore the regulatory networks between miRNAs and mRNAs in the pathogenesis of Uyghur UC and Han UC, a co-expression network was constructed based on the further joint analysis of four miRNAs and 15 mRNAs (Figure 4G). The node degree of hsa-miR-141-5p was six and the node degree of hsa-miR-378a-5p was five, which both interacted with multiple target genes. The node degree of hsa-miR-192-5p and hsa-miR-192-3p was one. Collectively, hsa-miR-141-5p and hsa-miR-378a-5p were more important miRNAs that resulted in differential manifestations of UC in Uyghur and Han populations.
Clinical Validation of mRNA and miRNA Levels
Subsequently, the mRNA and miRNA levels of four other clinical groups (eight samples in each group) were detected to validate the clinical analysis by bioinformatics method. The qPCR results showed that three mRNAs and two miRNAs were remarkably different between groups, indicating that target genes could potentially diagnose UC (Figure 5A and B). Besides, the analysis of another 12 mRNAs and twomiRNAs showed a significant distinction, however, the results of HN and UIN groups were different, suggesting that these genes were not suitable for clinical diagnosis because it might be difficult to distinguish (Supplementary Figure S2A and B). Finally, the qPCR results indicated the three genes, ARNTL2, CLDN1, SLC6A14, and two miRNAs, hsa-miR-141-5p and hsa-miR-378a-5p, might be related to the UC, parallel with the bioinformatics analysis.
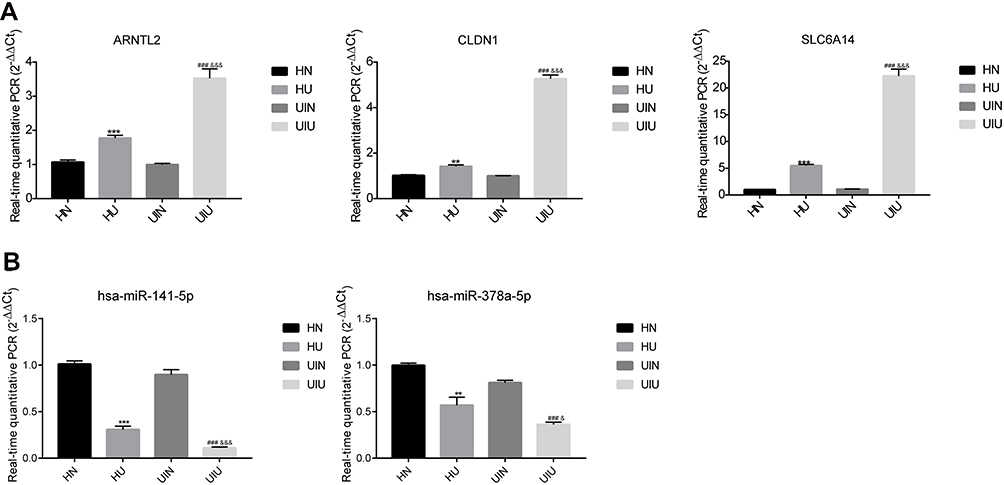 |
Figure 5 The relative mRNAs and miRNAs expression level of significantly differentially expressed gene in four groups. (A) mRNA; (B) miRNA. *p<0.05, **p<0.01, ***p<0.001 versus HN group; #p<0.05, ##p<0.01, ###p<0.001 versus UIN group; &p<0.05, &&p<0.01, &&&p<0.001 versus HU group. |
Discussion
UC is a complicated IBD, which resulted from genetics, environmental factors, dysregulated immune responses, and many other factors.30 To date, the pathogenesis of UC still remains unclear.31 The differential manifestations of UC in Uyghur and Han patients observed in our locally clinical work reminded us of the present study. In this study, via a comprehensive analysis of miRNAs and mRNAs extracted from Uyghur and Han UC tissues samples, we have explored the potential miRNAs and genes associated with the differential manifestations of UC in Uyghur and Han population. Subsequently, hsa-miR-141-5p and hsa-miR-378a-5p were found to be more important miRNAs leading to differential manifestations of UC in Uyghur and Han population. Moreover, three genes, ARNTL2, CLDN1, and SLC6A14, were screened to be potential biomarkers related to the differential manifestations of UC in Uyghur and Han populations.
Our present research was based on the UC samples collected from Xinjiang region in China. Through the multiple comparison among various groups (UIU, UIN, HU, HN), potential miRNAs and mRNAs associated with the differential manifestations of UC in Uyghur and Han patients were then preliminarily found, comprising four miRNAs and 125 genes. Furthermore, 15 overlapped genes were then identified between all miRNAs’ target genes and 125 DEGs, which were used for co-expression network construction. Finally, hsa-miR-141-5p and hsa-miR-378a-5p were more important miRNAs associated with the differential manifestations of UC in Uyghur and Han patients. And our further experiments were consistent with the bioinformatic analyses. Increasing studies have suggested that some miRNAs played an important role in the regulation and pathogenesis of IBD.32,33 For example, miR-141 directly regulated CXCL5 expression, meanwhile influencing the AKT signaling pathway.34 Additionally, it has been indicated that miR-141-3p might be involved in the colorectal cancer development in the rectosigmoid colon in UC patients.35 Moreover, miR-378a-3p could regulate IL-33 expression in an inflammatory environment in HT-29 cells, so as to further understand the pathogenesis of UC.36 Thus, our data was consistent with the previous research, but our study firstly suggested that miR-141-5p and miR-378a-5p were associated with the differential manifestations of UC in Uyghur and Han populations. Moreover, via the further experimental screening of the 15 genes in additional UC clinical samples in Xinjiang region, ARNTL2, CLDN1, and SLC6A14 were related to the differential manifestations of UC in Uyghur and Han populations. Several recent studies have documented the role of potential biomarkers in UC. AQP9 and CLDN2 have been reported to regulate the physiological properties in tight junctions in UC patients.37 And ARNTL2, as a circadian gene, was differentially expressed in Crohn’s disease and UC and ARNTL2 was upregulated in UC.38 Weber et al39 has evidenced that upregulated CLDN1 expression might be involved in transformation in IBD-associated neoplasia. As for SLC6A14, it was a cancer-specific amino acid transporter and was crucial for tumor growth,40 which has been evidenced to be a potential tissue biomarker for UC.20 Collectively, all the evidence above supported our research. And these miRNAs and genes might serve as potential biomarkers, which would be beneficial for the target treatments for Uyghur/ Han UC patients in the future. However, the detailed mechanisms behind these miRNAs and genes in UC in Uyghur and Han population were still unclear and needed lots of further exploration.
Additionally, an enrichment analysis was performed on the 15 genes, which might reveal the functions related to the differential manifestations of UC in Uyghur and Han populations. The 15 genes were significantly enriched in 321 BP terms, 17 CC terms, 27 MF terms, and 22 KEGG pathways. We found that several cancer related pathways were noticed, including Prostate cancer, Transcriptional misregulation in cancer, MicroRNAs in cancer, and Proteoglycans in cancer, which indicated that there might be a certain correlation between cancer and differential manifestations of UC in Uyghur and Han populations. Although some previous studies have demonstrated the possible interplay between UC and various cancers,41–43 however, it should be further studied in UC patients in Uyghur and Han populations. Moreover, tight junction played an essential role in the maintenance of intestinal epithelial barrier function,44 meanwhile, tight junction was reported to be involved in UC and other IBD.45,46 Some former studies indicated that several genes played their roles in UC through regulating the NF-κB signaling pathway.47–49 Consequently, the differential manifestations of UC in Uyghur and Han population probably resulted from a complex regulation network, which deserved large amounts of work in the future.
In conclusion, based on the samples collected from Uyghur and Han UC patients in Xinjiang region, via a joint analysis of miRNA and mRNA data and further experimental validation, we have identified two miRNAs (hsa-miR-141-5p and hsa-miR-378a-5p) and three genes (ARNTL2, CLDN1, and SLC6A14) that were associated with the differential manifestations of UC in Uyghur and Han population. These genes were mainly enriched in tight junction, NF-κB, and several other pathways. Our findings are expected to provide more information of UC research and targeted treatment in Uyghur and Han population in the future.
Data Sharing Statement
The datasets used and analyzed in the present research are available from the corresponding author on reasonable request.
Ethics Approval and Consent to Participate
All the experiments were approved by the Ethics Committee of People’s Hospital of Xinjiang Uygur Autonomous Region in accordance with the Declaration of Helsinki. [Ethical code: Xinjiang District Hospital Ethics Committee 2015110.]
Patient Consent for Publication
Informed consents were obtained from all subjects.
Funding
This research was funded by the National Natural Science Foundation of China (Grant No. 81560091).
Disclosure
The authors declare that they have no conflicts of interest in this work.
References
1. Zhou H, Xi L, Ziemek D, et al. Molecular profiling of ulcerative colitis subjects from the TURANDOT trial reveals novel pharmacodynamic/efficacy biomarkers. J Crohns Colitis. 2019;13(6):702–713. doi:10.1093/ecco-jcc/jjy217
2. Malik TA. Inflammatory bowel disease: historical perspective, epidemiology, and risk factors. Surg Clin North Am. 2015;95(6):1105–1122. doi:10.1016/j.suc.2015.07.006
3. Ng SC, Shi HY, Hamidi N, et al. Worldwide incidence and prevalence of inflammatory bowel disease in the 21st century: a systematic review of population-based studies. Lancet. 2017;390(10114):2769–2778. doi:10.1016/S0140-6736(17)32448-0
4. Danese S, Fiocchi C. Ulcerative colitis. N Engl J Med. 2011;365(18):1713–1725. doi:10.1056/NEJMra1102942
5. Khor B, Gardet A, Xavier RJ. Genetics and pathogenesis of inflammatory bowel disease. Nature. 2011;474(7351):307–317. doi:10.1038/nature10209
6. Feuerstein JD, Moss AC, Farraye FA. Ulcerative colitis. Mayo Clin Proc. 2019;94(7):1357–1373. doi:10.1016/j.mayocp.2019.01.018
7. Wehkamp J, Stange EF. Recent advances and emerging therapies in the non-surgical management of ulcerative colitis. F1000Res. 2018;7:1207. doi:10.12688/f1000research.15159.1
8. Bopanna S, Ananthakrishnan AN, Kedia S, Yajnik V, Ahuja V. Risk of colorectal cancer in Asian patients with ulcerative colitis: a systematic review and meta-analysis. Lancet Gastroenterol Hepatol. 2017;2(4):269–276. doi:10.1016/S2468-1253(17)30004-3
9. Arora G, Mannalithara A, Singh G, Gerson LB, Triadafilopoulos G. Risk of perforation from a colonoscopy in adults: a large population-based study. Gastrointest Endosc. 2009;69(3 Pt 2):654–664. doi:10.1016/j.gie.2008.09.008
10. Ng SC, Kaplan GG, Tang W, et al. Population density and risk of inflammatory bowel disease: a prospective population-based study in 13 countries or regions in Asia-Pacific. Am J Gastroenterol. 2019;114(1):107–115. doi:10.1038/s41395-018-0233-2
11. Gao F, Aheman A, Lu JJ, Abuduhadeer M, Li YX, Kuerbanjiang A. Association of HLA-DRB1 alleles and anti-neutrophil cytoplasmic antibodies in Han and Uyghur patients with ulcerative colitis in China. J Dig Dis. 2014;15(6):299–305. doi:10.1111/1751-2980.12143
12. Aheman A, Luo HS, Gao F. Association of fucosyltransferase 2 gene variants with ulcerative colitis in Han and Uyghur patients in China. World J Gastroenterol. 2012;18(34):4758–4764. doi:10.3748/wjg.v18.i34.4758
13. Aheman A, Gao F, Kuerbanjiang A, Li YX, Abuduhadeer M. Difference in DRB1* gene polymorphisms between Han and Uyghur ulcerative colitis patients in China. World J Gastroenterol. 2013;19(17):2709–2713. doi:10.3748/wjg.v19.i17.2709
14. Muthas D, Reznichenko A, Balendran CA, et al. Neutrophils in ulcerative colitis: a review of selected biomarkers and their potential therapeutic implications. Scand J Gastroenterol. 2017;52(2):125–135. doi:10.1080/00365521.2016.1235224
15. Nakov R. New markers in ulcerative colitis. Clin Chim Acta. 2019;497:141–146. doi:10.1016/j.cca.2019.07.033
16. Lei Y, Chen Y, Lin Z, Tian D, Han P. Comprehensive analysis of key biomarkers, immune infiltration and potential therapeutic agents for ulcerative colitis. Life Sci. 2020;260:118437. doi:10.1016/j.lfs.2020.118437
17. Fefferman DS, Farrell RJ. Endoscopy in inflammatory bowel disease: indications, surveillance, and use in clinical practice. Clin Gastroenterol Hepatol. 2005;3(1):11–24. doi:10.1016/S1542-3565(04)00441-0
18. Flynn S, Eisenstein S. Inflammatory bowel disease presentation and diagnosis. Surg Clin North Am. 2019;99(6):1051–1062. doi:10.1016/j.suc.2019.08.001
19. Shi L, Han X, Li JX, et al. Identification of differentially expressed genes in ulcerative colitis and verification in a colitis mouse model by bioinformatics analyses. World J Gastroenterol. 2020;26(39):5983–5996. doi:10.3748/wjg.v26.i39.5983
20. Zhang J, Wang X, Xu L, Zhang Z, Wang F, Tang X. Investigation of potential genetic biomarkers and molecular mechanism of ulcerative colitis utilizing bioinformatics analysis. Biomed Res Int. 2020;2020:4921387.
21. Han NY, Choi W, Park JM, Kim EH, Lee H, Hahm KB. Label-free quantification for discovering novel biomarkers in the diagnosis and assessment of disease activity in inflammatory bowel disease. J Dig Dis. 2013;14(4):166–174. doi:10.1111/1751-2980.12035
22. Berry D, Reinisch W. Intestinal microbiota: a source of novel biomarkers in inflammatory bowel diseases? Best Pract Res Clin Gastroenterol. 2013;27(1):47–58. doi:10.1016/j.bpg.2013.03.005
23. Rubin DT, Ananthakrishnan AN, Siegel CA, Sauer BG, Long MD. ACG Clinical guideline: ulcerative colitis in adults. Am J Gastroenterol. 2019;114(3):384–413.
24. Irizarry RA, Hobbs B, Collin F, et al. Exploration, normalization, and summaries of high density oligonucleotide array probe level data. Biostatistics. 2003;4(2):249–264. doi:10.1093/biostatistics/4.2.249
25. Ritchie ME, Phipson B, Wu D, et al. limma powers differential expression analyses for RNA-sequencing and microarray studies. Nucleic Acids Res. 2015;43(7):e47. doi:10.1093/nar/gkv007
26. Agarwal V, Bell GW, Nam JW, Bartel DP. Predicting effective microRNA target sites in mammalian mRNAs. Elife. 2015;4. doi:10.7554/eLife.05005
27. Chou CH, Shrestha S, Yang CD, et al. miRTarBase update 2018: a resource for experimentally validated microRNA-target interactions. Nucleic Acids Res. 2018;46(D1):D296–D302. doi:10.1093/nar/gkx1067
28. Chen Y, Wang X. miRDB: an online database for prediction of functional microRNA targets. Nucleic Acids Res. 2020;48(D1):D127–D131. doi:10.1093/nar/gkz757
29. Yu G, Wang LG, Han Y, He QY. clusterProfiler: an R package for comparing biological themes among gene clusters. OMICS. 2012;16(5):284–287. doi:10.1089/omi.2011.0118
30. Baumgart DC, Carding SR. Inflammatory bowel disease: cause and immunobiology. Lancet. 2007;369(9573):1627–1640. doi:10.1016/S0140-6736(07)60750-8
31. Ramos GP, Papadakis KA. Mechanisms of disease: inflammatory bowel diseases. Mayo Clin Proc. 2019;94(1):155–165. doi:10.1016/j.mayocp.2018.09.013
32. Tili E, Michaille JJ, Piurowski V, Rigot B, Croce CM. MicroRNAs in intestinal barrier function, inflammatory bowel disease and related cancers-their effects and therapeutic potentials. Curr Opin Pharmacol. 2017;37:142–150. doi:10.1016/j.coph.2017.10.010
33. Mei Z, He Y, Feng J, et al. MicroRNA-141 promotes the proliferation of non-small cell lung cancer cells by regulating expression of PHLPP1 and PHLPP2. FEBS Lett. 2014;588(17):3055–3061. doi:10.1016/j.febslet.2014.06.020
34. Cai M, Chen S, Hu W. MicroRNA-141 is involved in ulcerative colitis pathogenesis via aiming at CXCL5. J Interferon Cytokine Res. 2017;37(9):415–420. doi:10.1089/jir.2017.0019
35. Ranjha R, Aggarwal S, Bopanna S, Ahuja V, Paul J. Site-specific microRNA expression may lead to different subtypes in ulcerative colitis. PLoS One. 2015;10(11):e0142869. doi:10.1371/journal.pone.0142869
36. Dubois-Camacho K, Diaz-Jimenez D, De la Fuente M, et al. Inhibition of miR-378a-3p by inflammation enhances IL-33 levels: a novel mechanism of alarmin modulation in ulcerative colitis. Front Immunol. 2019;10:2449. doi:10.3389/fimmu.2019.02449
37. Taman H, Fenton CG, Hensel IV, Anderssen E, Florholmen J, Paulssen RH. Transcriptomic landscape of treatment-naive ulcerative colitis. J Crohns Colitis. 2018;12(3):327–336. doi:10.1093/ecco-jcc/jjx139
38. Palmieri O, Mazzoccoli G, Bossa F, et al. Systematic analysis of circadian genes using genome-wide cDNA microarrays in the inflammatory bowel disease transcriptome. Chronobiol Int. 2015;32(7):903–916. doi:10.3109/07420528.2015.1050726
39. Weber CR, Nalle SC, Tretiakova M, Rubin DT, Turner JR. Claudin-1 and claudin-2 expression is elevated in inflammatory bowel disease and may contribute to early neoplastic transformation. Lab Invest. 2008;88(10):1110–1120. doi:10.1038/labinvest.2008.78
40. McCracken AN, Edinger AL. Targeting cancer metabolism at the plasma membrane by limiting amino acid access through SLC6A14. Biochem J. 2015;470(3):e17–e19. doi:10.1042/BJ20150721
41. Haddad A, Al-Sabbagh MQ, Al-Ani H, et al. Inflammatory bowel disease and prostate cancer risk: a systematic review. Arab J Urol. 2020;18(4):207–212. doi:10.1080/2090598X.2020.1761674
42. Yashiro M. Ulcerative colitis-associated colorectal cancer. World J Gastroenterol. 2014;20(44):16389–16397. doi:10.3748/wjg.v20.i44.16389
43. Taleban S, Elquza E, Gower-Rousseau C, Peyrin-Biroulet L. Cancer and inflammatory bowel disease in the elderly. Dig Liver Dis. 2016;48(10):1105–1111. doi:10.1016/j.dld.2016.05.006
44. Lee B, Moon KM, Kim CY. Tight junction in the intestinal epithelium: its association with diseases and regulation by phytochemicals. J Immunol Res. 2018;2018:2645465. doi:10.1155/2018/2645465
45. Landy J, Ronde E, English N, et al. Tight junctions in inflammatory bowel diseases and inflammatory bowel disease associated colorectal cancer. World J Gastroenterol. 2016;22(11):3117–3126. doi:10.3748/wjg.v22.i11.3117
46. Rawat M, Nighot M, Al-Sadi R, et al. IL1B increases intestinal tight junction permeability by up-regulation of MIR200C-3p, which degrades occludin mRNA. Gastroenterology. 2020;159(4):1375–1389. doi:10.1053/j.gastro.2020.06.038
47. Shen J, Cheng J, Zhu S, et al. Regulating effect of baicalin on IKK/IKB/NF-kB signaling pathway and apoptosis-related proteins in rats with ulcerative colitis. Int Immunopharmacol. 2019;73:193–200. doi:10.1016/j.intimp.2019.04.052
48. Bing X, Xuelei L, Wanwei D, Linlang L, Keyan C. EGCG maintains Th1/Th2 balance and mitigates ulcerative colitis induced by dextran sulfate sodium through TLR4/MyD88/NF-kappaB signaling pathway in rats. Can J Gastroenterol Hepatol. 2017;2017:3057268. doi:10.1155/2017/3057268
49. Yan S, Xu X, Li Q, Hui Y, Li J, Wei H. [Progress in the study of macrophage activation and ulcerative colitis from the Notch/NF-kappaB/NLRP3 signaling pathway]. Zhong Nan Da Xue Xue Bao Yi Xue Ban. 2019;44(10):1174–1178. Chinese.
 © 2021 The Author(s). This work is published and licensed by Dove Medical Press Limited. The
full terms of this license are available at https://www.dovepress.com/terms
and incorporate the Creative Commons Attribution
- Non Commercial (unported, 3.0) License.
By accessing the work you hereby accept the Terms. Non-commercial uses of the work are permitted
without any further permission from Dove Medical Press Limited, provided the work is properly
attributed. For permission for commercial use of this work, please see paragraphs 4.2 and 5 of our Terms.
© 2021 The Author(s). This work is published and licensed by Dove Medical Press Limited. The
full terms of this license are available at https://www.dovepress.com/terms
and incorporate the Creative Commons Attribution
- Non Commercial (unported, 3.0) License.
By accessing the work you hereby accept the Terms. Non-commercial uses of the work are permitted
without any further permission from Dove Medical Press Limited, provided the work is properly
attributed. For permission for commercial use of this work, please see paragraphs 4.2 and 5 of our Terms.