Back to Journals » Drug Design, Development and Therapy » Volume 16
Population Pharmacokinetic Modelling for Nifedipine to Evaluate the Effect of Parathyroid Hormone on CYP3A in Patients with Chronic Kidney Disease
Authors Fu C ![]() , Pei Q
, Pei Q ![]() , Liang W, Yang B, Li W
, Liang W, Yang B, Li W ![]() , Liu J, Tan H, Guo C
, Liu J, Tan H, Guo C ![]() , Zhang H
, Zhang H ![]() , Yang G
, Yang G ![]()
Received 19 February 2022
Accepted for publication 30 June 2022
Published 13 July 2022 Volume 2022:16 Pages 2261—2274
DOI https://doi.org/10.2147/DDDT.S362607
Checked for plagiarism Yes
Review by Single anonymous peer review
Peer reviewer comments 2
Editor who approved publication: Dr Tuo Deng
Chengxiao Fu,1,2,* Qi Pei,3,* Wu Liang,4 Bo Yang,2 Wei Li,5 Jun Liu,5 Hongyi Tan,1,4 Chengxian Guo,1,4 Hao Zhang,5 Guoping Yang1,4
1Center for Clinical Pharmacology, The Third Xiangya Hospital, Central South University, Changsha, People’s Republic of China; 2The First Affiliated Hospital, Department of Pharmacy, Hengyang Medical School, University of South China, Hengyang, People’s Republic of China; 3Department of Pharmacy, The Third Xiangya Hospital, Central South University, Changsha, People’s Republic of China; 4Research Center of Drug Clinical Evaluation of Central South University, Changsha, People’s Republic of China; 5Department of Nephrology, The Third Xiangya Hospital, Central South University, Changsha, People’s Republic of China
*These authors contributed equally to this work
Correspondence: Guoping Yang; Hao Zhang, Email [email protected]; [email protected]
Purpose: Parathyroid hormone (PTH) can induce the downregulation of CYP3A in chronic kidney disease (CKD). Nevertheless, the effect of PTH on CYP3A-mediated clearance pathways from a clinical perspective remains unclear.
Methods: This study employed population pharmacokinetic (PopPK) modeling to delineate potential changes in CYP3A activity in patients with CKD. Pharmacokinetic data for nifedipine, a typical CYP3A substrate, as well as covariate information, were prospectively collected from 157 patients with a total of 612 concentrations. PopPK data analysis was performed using a nonlinear mixed-effects model.
Results: The pharmacokinetics of nifedipine were optimally described according to a one-compartment model with zero-order absorption and first-order elimination. The estimated population parameters (and interindividual variability) were apparent clearance (CL/F) 49.61 L/h (58.33%) and apparent volume of distribution (V/F) 2300.26 L (45.62%), and the PTH level negatively correlated with CL/F. In comparison with the reference level, it was observed that the dosage of nifedipine should be reduced with the maximum boundary value of PTH, after a Monte Carlo simulation.
Conclusion: This study provides insight into the effects of PTH on CYP3A-mediated clearance pathways. Moreover, PTH could be used as a guide for the appropriate administration of CYP3A eliminated drugs in patients with CKD.
Keywords: chronic kidney disease, parathyroid hormone, CYP3A, population pharmacokinetic, nifedipine
Introduction
Chronic kidney disease (CKD) is one of the most common diseases worldwide, with the number of incidences steadily increasing.1 Impaired kidney function, observed in CKD patients, can alter the elimination of a drug from the kidney.2,3 CKD may also affect drug disposition by altering the enzyme function in extrarenal organs including the liver and the intestines.4 It has recently been reported that, in patients with CKD, the metabolism of CYP450 in the liver and intestine is altered, causing pharmacokinetic changes and an increase in the occurrence of adverse drug events.5 As such, regulatory agencies recommend conducting clinical trials for nonrenally eliminated drugs. This is to satisfy the requirements for potential dosage adjustments in CKD patients, on the account of kidney function stratification, which is considered a “worst-case scenario”.6 However, there are no justified and generalized instructions for dedicated CKD study designs. Also, the dosage adjustment of nonrenally eliminated drugs is still not a conventional practice observed with CKD patients.
CKD is often concomitant with secondary hyperparathyroidism (SHPT), and the level of parathyroid hormone (PTH) in peripheral circulation significantly increases.7 PTH is secreted by the parathyroid gland and is widely distributed in the liver, kidney, small intestine, and other internal organs. As such, the hormone participates in the regulation of multiple protein functions.8–12 It was also reported that PTH may be the main factor in the downregulation of CYP3A in CKD.13 CYP3A is one of the most vital metabolic pathways and involves the metabolism of 50–60% of drugs on the market,14 including midazolam, nifedipine, tacrolimus, and cyclosporine.
Recently, using the SHPT rat model, primary rat hepatocytes, and a human colon carcinoma cell line, Watanabe et al demonstrated that elevated serum PTH levels reduced CYP3A expression in both the liver and small intestine. This resulted in a considerable decrease in the activity of CYP3A, and a significant increase in the area under the curve (AUC) of midazolam.15 In a retrospective study of 12 subjects, it was proposed that surveying serum PTH levels could forecast the trough level for the initial tacrolimus administration. A significant positive correlation between serum PTH and tacrolimus trough concentration 4 days before renal transplantation was observed. Therefore, it was proposed that PTH may be an indicator of the initial tacrolimus dosage in kidney transplantation patients.16 In contrast, a study including 63 Japanese kidney transplant recipients demonstrated that PTH levels were not associated with CYP3A phenoconversion. This phenoconversion was assessed via the plasma concentration of 4β-hydroxycholesterol, which is a biomarker of CYP3A activity.17 The contrasting findings were considered a result of limited clinical data availability. Therefore, further large-scale clinical trials are needed to understand the impact of PTH on CYP3A in CKD patients. In addition, both the influence of PTH on the pharmacokinetics of drugs eliminated by nonrenal pathways and the dosage adjustments for CKD patients should be investigated.
PopPK modeling is a model technique developed to represent the population of interest. The process of modeling is to discriminate covariates that may account for potential sources of variability.18 A prospective observational study was conducted with 157 CKD subjects treated with nifedipine (a CYP3A substrate) to investigate the population pharmacokinetics of the drug and to clarify the effect of PTH on hepatic CYP3A. In addition, the role of PTH in characterizing the pharmacokinetics of drugs predominantly metabolized by CYP3A quantitatively in CKD patients was also explored.
Materials and Methods
Patient Recruitment and Data Collection
The investigational protocol was approved by the Medical Ethics Committee of the Third Xiangya Hospital of Central South University. The study was conducted in accordance with the legal requirements of the Declaration of Helsinki, and with the contemporary Chinese guidelines for Good Clinical Practice. This study was registered at https://register.clinicaltrials.gov (NCT03695107). The subjects were patients with CKD who received nifedipine tablets from the Department of Nephrology, The Third Xiangya Hospital, Central South University, from August 2017 to April 2019. All patients signed an informed consent form before inclusion. Nifedipine tablets used in this study were formulated for controlled release (CR, 30 mg/tablet) and were produced by Bayer, Germany.
The study included Chinese male or female patients (≥18 years old) who were diagnosed by clinicians as CKD accompanied by hypertension and were treated with nifedipine tablets. Besides, those patients with dialysis treatment prior to the study were excluded. Pharmacokinetic, demographic, and covariate data, including physical examination and laboratory tests, were collected retrospectively from patient medical records.
Sample Collection and Bioanalytical Assay
Patients with CKD and hypertension were treated with nifedipine for 7 days. The sparse blood samples were collected at predose (C0, trough concentration), 3–4 h post-dose (C1, concentration of time point in absorption phase), 6–8 h post-dose (C2, concentration of time point in elimination phase), and 24 h post-dose (C3, trough concentration) on the 7th day.
The blood samples were centrifuged at 3000 × g for 10 min at 4°C, and the plasma was stored in the dark at −80°C until analysis. Nifedipine plasma concentrations were determined using a high-performance liquid chromatography-tandem mass spectrometry method. Before analysis, the plasma samples were thawed and vortexed. Ten microliters of a 100 ng/mL solution of nifedipine-d6 (internal standard) was added, followed by 200 μL of acetonitrile. The mixture was then subjected to vortex oscillation for 30 s, followed by centrifugation at 13,000 × g at 4°C for 10 min. After which, 100 μL of supernatant was obtained, and 10 μL of the sample was injected for analysis.
Chromatographic separation was performed using a liquid chromatograph (Agilent 1260, USA) equipped with an Agilent eclipse XDB-C18 (2.1 mm× 150 mm, 5 μm) at 40°C. The mobile phase was a mixture of methanol (containing 0.1% NH3·H2O) and water (containing 5 mM ammonium acetate) (35:65, v/v) at a flow rate of 0.4 mL/min. Mass spectrometry was performed using a triple quadrupole mass spectrometer (Agilent 6460, USA) in the positive electrospray ionization mode. The fragmentation voltage was 100 V and the collision energy was 1 eV for nifedipine (parent ion m/z 347.1→ son ion m/z 315.1). For nifedipine-d6 (parent ion m/z 353.1→ son ion m/z 318.1), the fragmentation voltage was 80 V, and the collision energy was 1 eV. The parameters of the ion source were as follows: gas temperature, 300°C; gas flow, 11 L/min; nebulizer, 15 psi; and capillary, 4000 V. The results showed that the linear range of nifedipine was 1–200 ng/mL. The lower limit for the quantification of nifedipine in human plasma was 1 ng/mL. The RSD of intra-and inter-day precision of nifedipine in plasma samples (1 ng/mL) was 5.88% and 19.42%, respectively.
DNA Extraction and Genotyping Analysis
The DNA for genomic analysis was extracted using a commercially available EZNA® SQ Blood DNA Kit II. Through the Sanger dideoxy DNA sequencing method with the ABI 3730xl sequencer (ABI Co., Sangon Biotech Co. Ltd. Shanghai, China), CYP3A4*1G rs2242480,19,20 CYP3A4 rs4646437,21 CYP3A5*3 rs776746,22 NR1I2 rs2276707,23–25 NF-κB rs28362491,24,25 IL-3 rs181781,21 and MDRD1-C3435T rs104564226,27 were detected, all of which may influence the expression of CYP3A and/or play important roles in nifedipine disposal.
Development of the Population Pharmacokinetic Model
Based on the concentration of nifedipine, the first-order conditional estimation-extended least squares (FOCE-ELS) was calculated via the Phoenix NLME software and a nonlinear mixed effect model method.
The model parameters were assumed to follow log-normal distributions, and the inter-individual variability for each structural parameter was modeled using Eq. (1): Pi = PTV * exp (ηi).
Here, Pi represents a parameter for the ith individual, PTV is the typical value of the parameter, and ηi is a random variable with a mean of zero and a variance of ω2.
A log transformation of the data was required, and the residual variability was modeled using an additive error, as shown in Eq. (2): CObs = CPred + CEps
Here, CObs is the observed value, CPred is the predicted value, and CEps is the intra-individual variability with a mean of zero and a variance of σ2.
Population Pharmacokinetic Covariate Model Selection
In the basic PK structural model, covariates were introduced: PTVij = PTVj × (COVRik/ ) ^θjk. Among them, PTVij is the jth parameter value of the ith subject, PTVj is the typical population value of the jth pharmacokinetic parameter, COVRik is the kth covariate of the ith subject, and
  is the median value. The deviation degree of individual parameter value from the population typical value when there was a unit change between the individual covariate and its median value was represented by θjk.
The covariates of sex, age, BMI, PTH, Hb, renal function, liver function, combination therapy, and genotypes of CYP3A4, CYP3A5, NR1I2, NF-κB, IL-3, and MDRD1, were analyzed in the model by means of a stepwise approach. The identification of significant covariates was conducted: an increase of more than 3.841 in the objective function value (OFV) was considered significant (P < 0.05, df = 1) for inclusion, and a decrease of more than 7.879 in the OFV was considered significant (P < 0.005, df = 1) for backward exclusion.
The following graphs were prepared to evaluate the goodness-of-fit (GOF): observed (OBS) versus population predicted concentrations (PRED), OBS versus individual predicted concentrations (IPRED), conditional weighted residuals (CWRES) versus time, and CWRES versus PRED.
Model Evaluation
The final PopPK model was evaluated as a whole, including the model fit parameters and GOF plots. A predicted-corrected visual predictive check (pc-VPC) was then used to test the final model based on 1000 simulation predictions. And bootstrapping was performed 1000 times to verify the final model.
Monte Carlo Simulation
Taking the nifedipine 30 mg/tablet once a day as an example, the median level of significant covariates for the subjects was used as the reference. Considering the range of influencing factors associated with the subjects in the model, the AUC between 0 and infinity (AUC0-∞) of which the corresponding equation used was AUC0-∞=Dose/CL was investigated, and each covariate at the boundary value and each scenario simulated 1000 sets of virtual data. Other scenarios included the minimum boundary value, maximum boundary value, and factor interaction with the minimum boundary value. Pharmacokinetic parameters were calculated, and descriptive statistical and graphical analyses were performed.
The AUC of the dose-adjusted drug exposure in each simulation scenario was compared with that of the reference. The adjusted doses were 7.5 mg (1/4, tablet), 15 mg (1/2 of tablet), and 22.5 mg (3/4 of tablet). Using a computer simulation and adjusting the administered dose, the adjusted dosage was determined to be in accordance with the reference.
Results
Patients and the Frequency of CYP3A4, CYP3A5, NR1I2, NF-κB, IL-3, and MDR1 Genotypic Variants
Data were prospectively collected from 157 patients with CKD. The median age was 54 years (range, 24–84 years), and the median body mass index was 23.4 kg/m2 (range 15.81–36.70 kg/m2). A total of 612 blood concentration–time measurements were collected (Figure 1). The number of nifedipine concentrations per patient ranged from two to four. The demographic characteristics are summarized in Table 1.
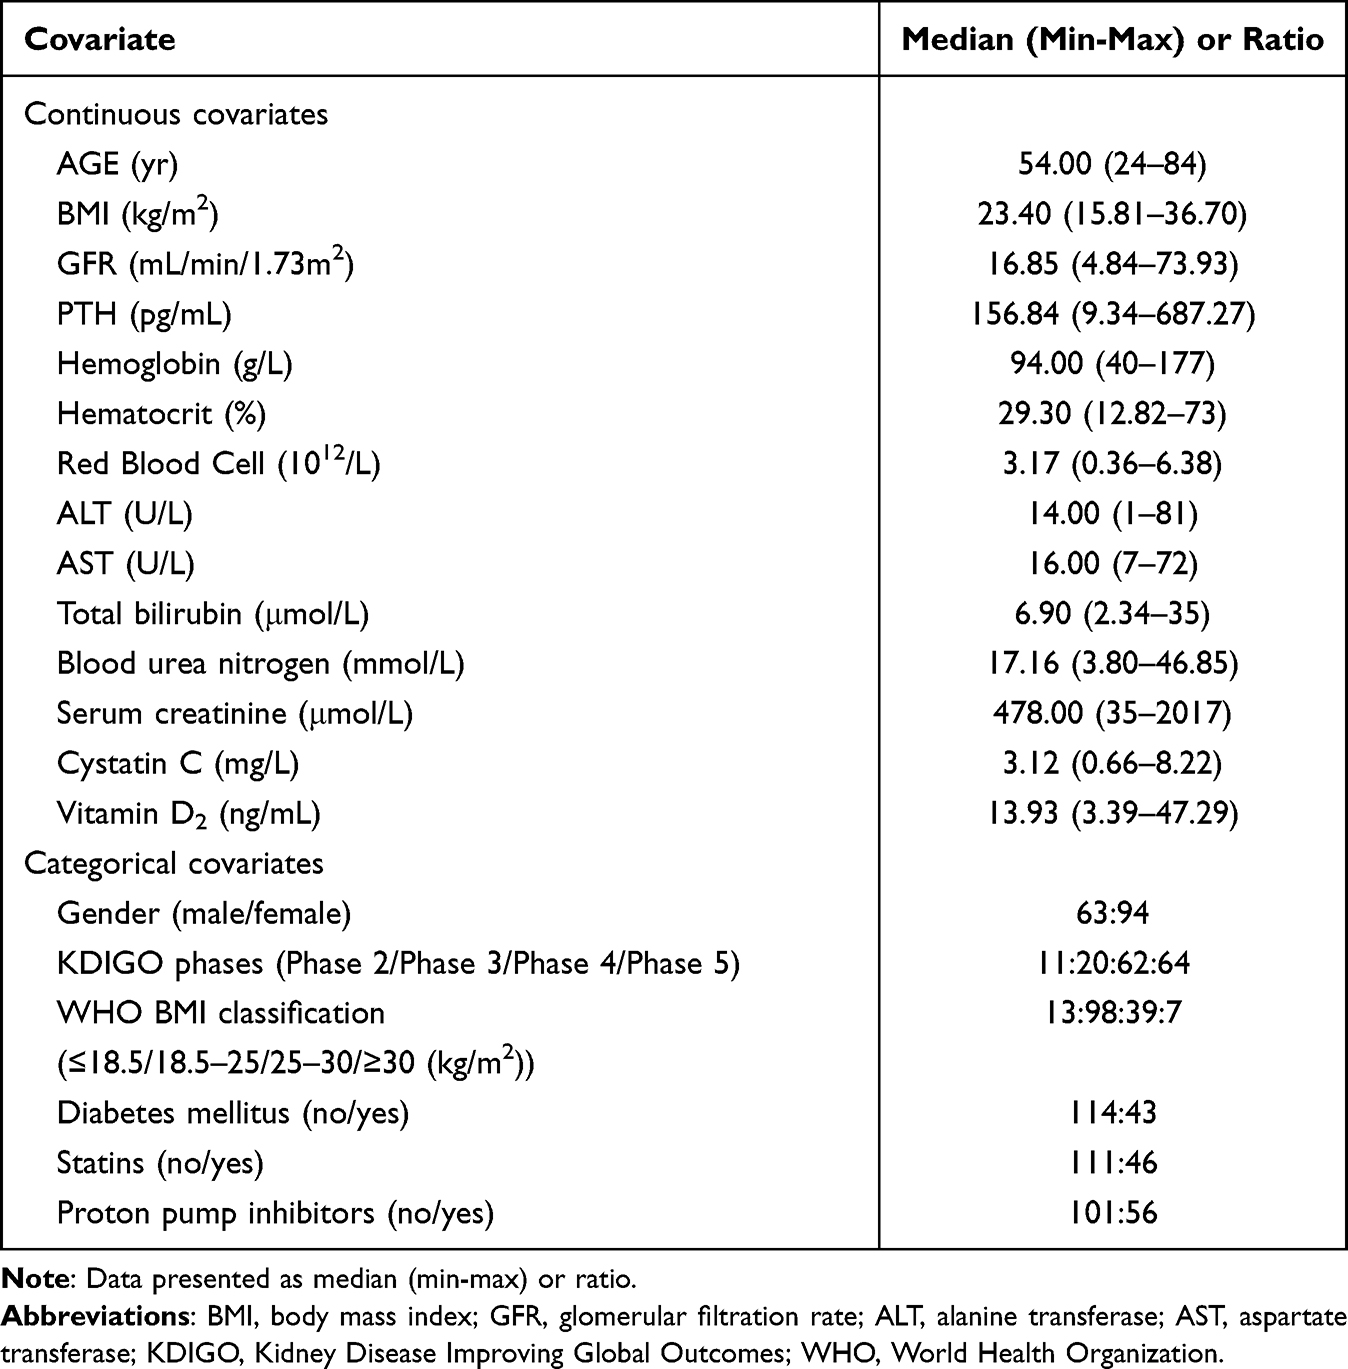 |
Table 1 Descriptive Statistical Analysis of Covariates (n = 157) |
 |
Figure 1 Plot of nifedipine concentrations versus the actual sampling time after dose. |
All DNA samples were analyzed, and deviation from the anticipated proportions of genotypes in the population predicted by Hardy-Weinberg equilibrium28 was not observed. The distribution frequencies of the genotypes of CYP3A4, CYP3A5, NR1I2, NF-κB, IL-3, and MDR1 in each group are listed in Table 2.
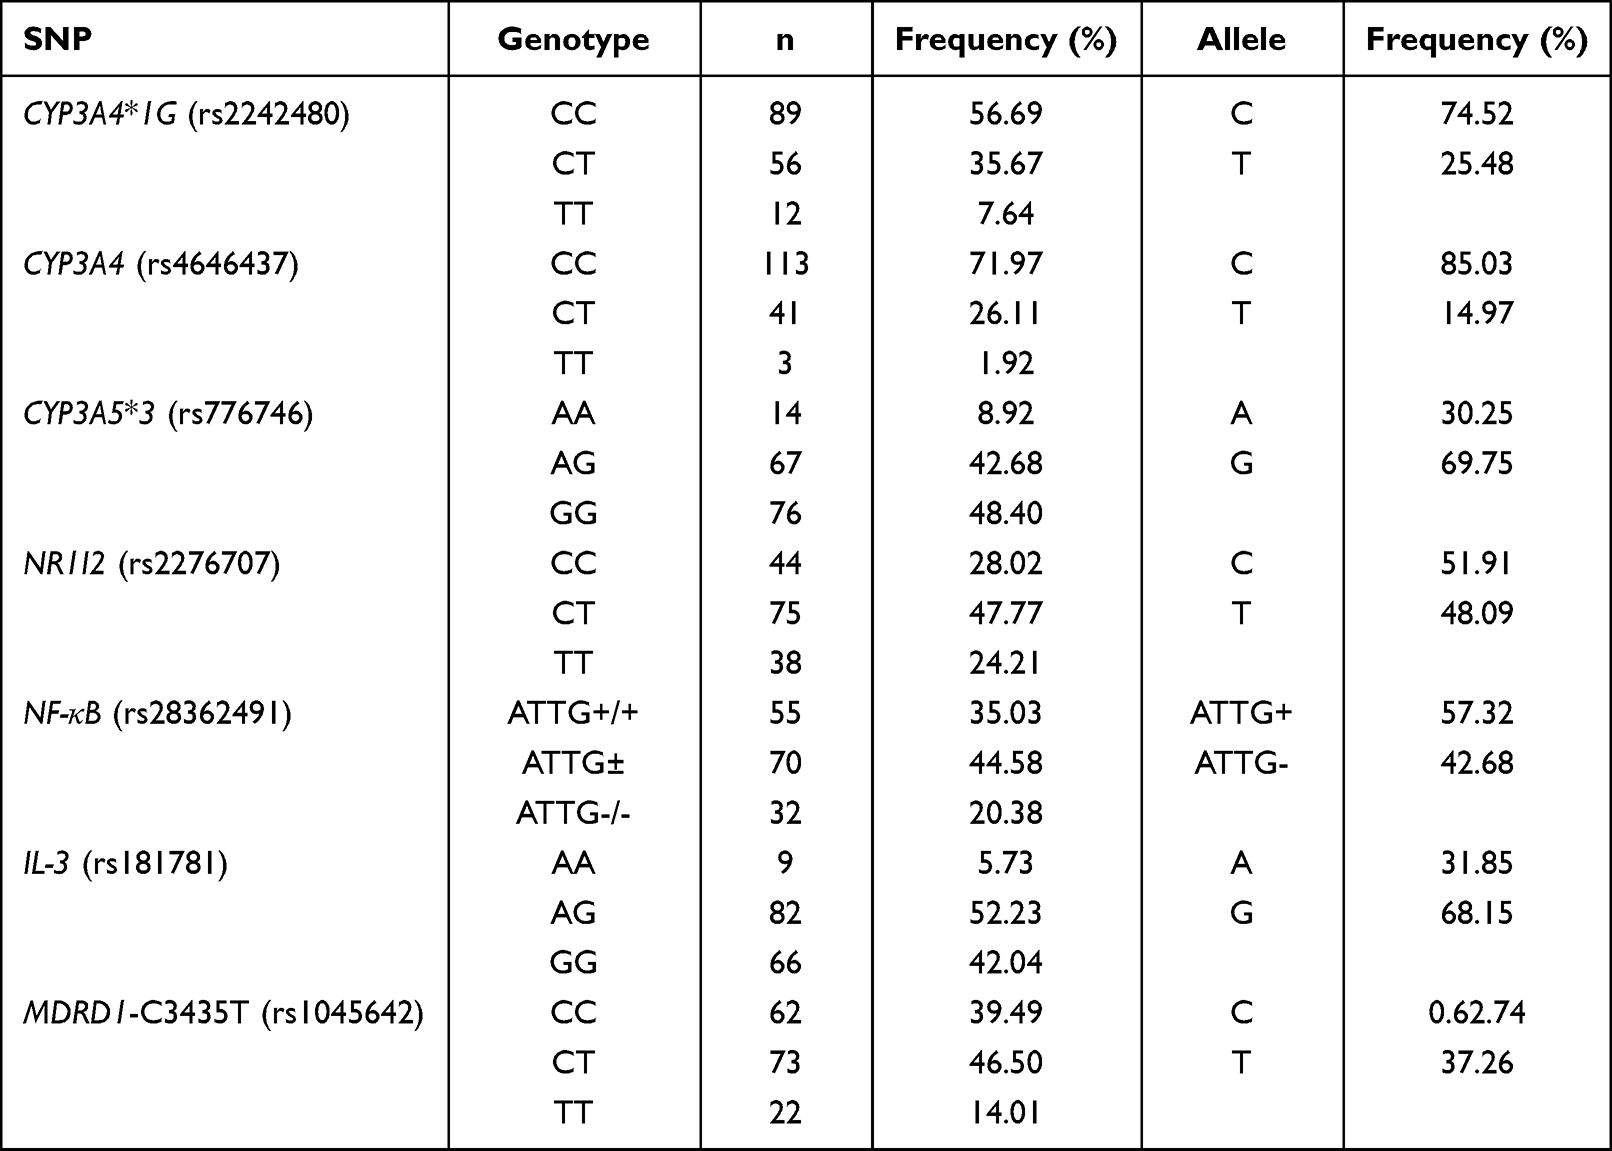 |
Table 2 Allelic and Genotype Frequency of CYP3A4, CYP3A5, NR1I2, NF-κB, IL-3, and MDRD1 in Chinese Patients with CKD (n = 157) |
Population Pharmacokinetic Modelling
Through the data obtained from 157 subjects and 612 concentrations, a base model was established, and the one-compartment model was investigated, based on the nifedipine concentration time curve and literature reports.29 The results indicated that OFV (5141.5) and AIC (5155.5) of zero-order absorption and first-order elimination, respectively, were smaller than those of the other models (Table S1); the fitting values were closer to the observed values. Therefore, the one-compartment model with zero-order absorption and first-order elimination was selected as the base model.
Most of the concentration data collected in this study were in the range of 10–100 ng/mL. The residual data fitted by the additive residual model were evenly distributed. Therefore, the additive error model was chosen as residual error model. The CV of each parameter in the one-compartment model with zero-order absorption and first-order elimination was less than 10%. The inter-individual variation of parameters apparent volume of distribution (V/F), the elimination rate constant (Ke), and the zero-order absorption rate constant (K0) were 51.58%, 27.01%, and 63.02%, respectively. The results are presented in Table S1.
Population Pharmacokinetic Covariate Modeling
It was found that age, hemoglobin (Hb), and PTH had significant effects on apparent clearance (CL/F), while alanine aminotransferase (ALT) had significant effects on the apparent volume of distribution (V/F). These covariates with significant influences were added to the model, and the final fitting results were obtained. In this study, PTH displayed a significant statistical impact on CL/F by reducing the OFV by 7.879 units (P < 0.005) in the base model. In addition, a decrease of 7.879 units (P < 0.005) in the OFV was also observed depending on the age or Hb level. Patients ages 24 to 84 years, and those with an increase in PTH or Hb level, achieved lower CL than those with higher levels.
Covariate analysis for the inter-individual variation of parameters demonstrated that ALT reduced the OFV by 7.879 units (P < 0.01). Patients with higher ALT levels had higher V/F compared to those with lower ALT levels.
The expression of PK parameters in the final model was as follows:


K0 = tvK0* exp(nK0), where tv* is the typical population value and d*d* is the correction coefficient. dV/FdALT* is the correction coefficient of ALT to V/F, dCL/FdAge* is the correction coefficient of Age to CL/F, dCL/FdHb* is the correction coefficient of Hb to CL/F, dCL/FdPTH* is the correction coefficient of PTH to CL/F.
The final population pharmacokinetic model revealed that after introducing the covariates as age, Hb, PTH, and ALT, inter-individual variation of parameters decreased from 59.42% to 45.64%, and CL/F decreased from 63.60% to 58.32%. These parameters were set as follows: tvV/F = 2300.26 L, and tvCL/F = 49.61 L/h. The results are shown in Tables S2 and 3.
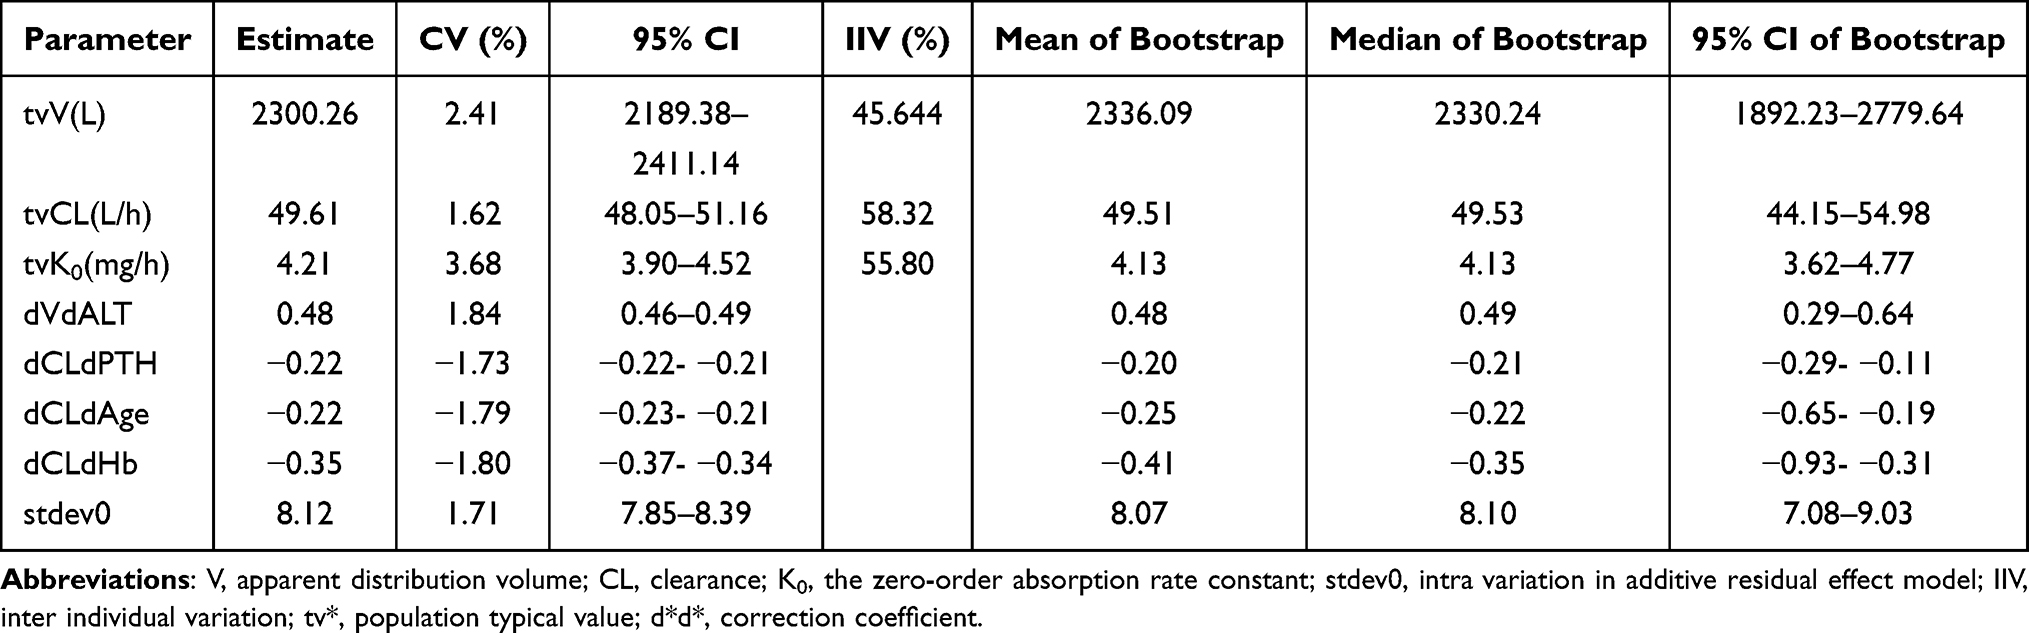 |
Table 3 The Comparison of Fitting Parameters Between Final Model and Bootstrap Verification |
Model Evaluation
In the final model, both PRED and IPRED displayed good visual agreement with observed values. Figure 2 shows basic goodness-of-fit plots for the base and final population pharmacokinetic models.
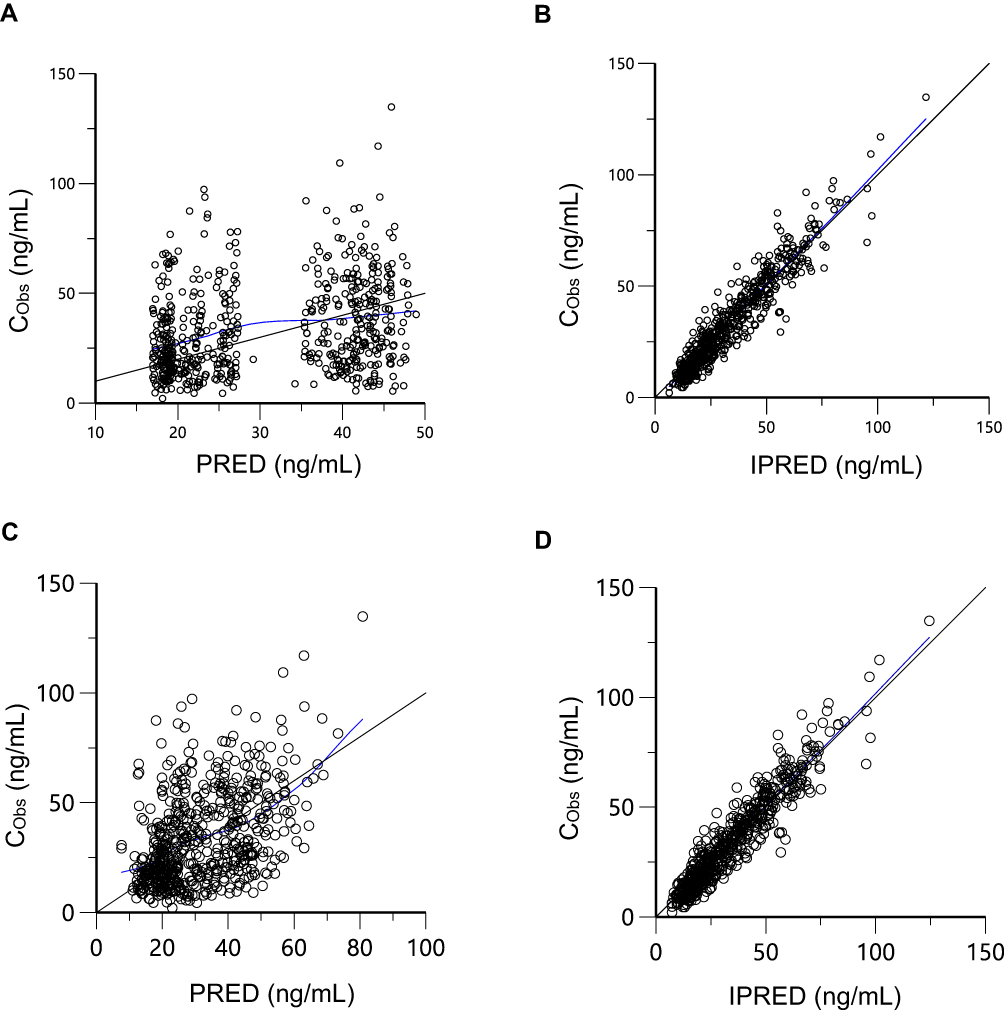 |
Figure 2 Goodness-of-fit plots for the base and final model. (A) CObs versus PRED for base model; (B) CObs versus IPRED for base model; (C) CObs versus PRED for final model; (D) CObs versus IPRED for final model. Abbreviations: CObs, observed concentration; PRED, predicted concentration; IPRED, individual predicted concentration. |
Most of the CWREs were between −2 and 2 and were evenly distributed above and below the coordinate y = 0. The predicted values for the different time (time), PRED, and subjects were well fitted with the measured values. Therefore, the final model adequately represents the data, as shown in Figure 3A–C.
 |
Figure 3 Distribution of conditional weighted residuals for the final model. (A) CWRES versus time; (B) CWRES versus PRED; (C) CWRES versus subject; (D) QQ diagram of CWRES; (E) histogram of CWRES. The blue line is the Loess trend line. Abbreviations: CWRES, conditional weighted residuals; PRED, predicted concentration. |
The CWREs of the final model resided on the diagonal of Y = X in the QQ diagram. The frequency distribution of the CWREs and subsequently the final residual model fundamentally conformed to a normal distribution. This indicated that model fitting was good (Figure 3D–E).
The final model demonstrated high stability, and all the 1000 replications ran successfully in the bootstrap for the final model. The median and 95% confidence intervals of the parameters from the bootstrap analysis were consistent with the estimation from the final model. This indicated that the parameters were estimated with good precision, and the final model was robust (Table 3).
The pc-VPC of the final model of 1000 simulations grouped by renal function is shown in Figure 4. The observed concentration was included in the range of the confidence intervals, and the median and 95% confidence interval lines were located close to the center of the results. This suggests that the predictive power of the model is sufficient.
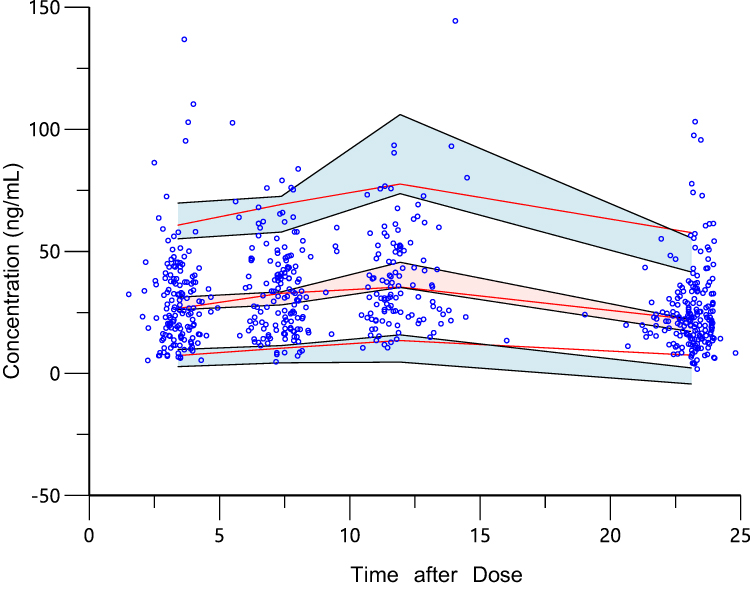 |
Figure 4 Predicted-corrected visual predictive checks or 1000 simulations. The pc-VPC chart generated by final model after 1000 Monte Carlo simulations. The red lines were 5%, 50%, and 95% percentile lines of measured values, and the shaded parts were 90% confidence intervals of predicted values of 5%, 50%, and 95% percentile lines. The percentile lines were fundamentally included in the 90% confidence interval of the predicted values. It was demonstrated that there was no deviation in the final prediction result of the model, and the trend of the model prediction was close to the measured value. |
Dosing Regimen Simulation
Taking nifedipine 30 mg once a day, as an example, the median level of covariates for the subjects was set as the reference: age = 54 years, Hb = 94 g/L, and PTH = 156.84 pg/mL. The range for the influencing factors was age: 24–84 years, Hb: 40–177 g/L, and PTH: 9.34–687.27 pg/mL. The AUC was investigated to assess if each covariate was at the boundary value. Each scenario simulated 1000 sets of virtual data, and the PK parameters were calculated. Scenario 1 was used as a reference. Scenarios A1, A2, and A3 were the minimum boundary values for age, Hb, and PTH, respectively. B1, B2, and B3 were scenarios with age and Hb; Hb and PTH; and age and PTH with minimum boundary value. Scenarios C1, C2, and C3 were the maximum boundary values of age, Hb, and PTH, respectively. As shown in Figure 5, a positive correlation was observed between AUC and each covariate (age, Hb, and PTH). PTH varied in a wide range (9.34–156.84) and had the greatest impact on AUC in scenarios A3 and C3.
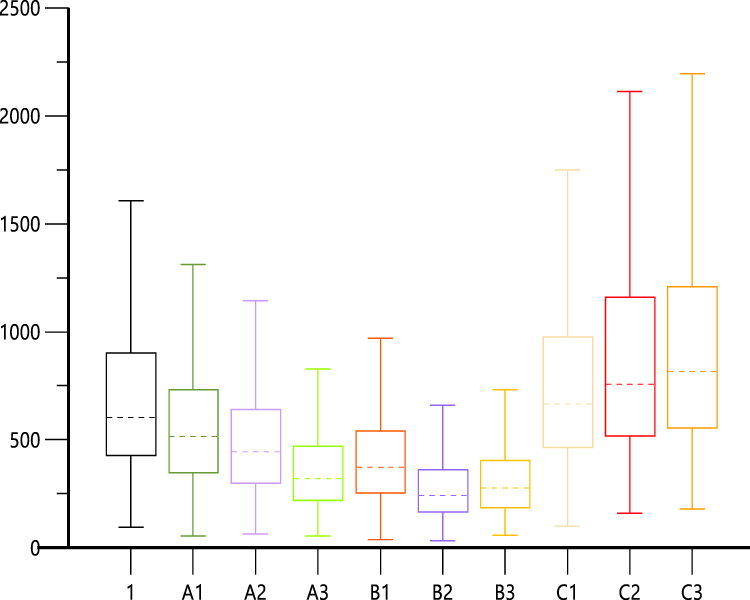 |
Figure 5 The box diagram of AUC simulated in different scenarios. The dotted line was the median level and the legend referring to Table 4. Scenario 1 was used as a reference. Scenarios A1, A2, and A3 were the minimum boundary values for age, Hb, and PTH, respectively. B1, B2, and B3 were scenarios with age and Hb; Hb, and PTH; and age and PTH with minimum boundary value. Scenarios C1, C2, and C3 were the maximum boundary values of age, Hb, and PTH, respectively. |
The dose of nifedipine was adjusted for each simulation. The overall summary is presented in Table 4. Compared with the reference level, the dosage of nifedipine may be increased by 7.5, 15, and 22.5 mg (or 30 mg) with the minimum boundary values of age, Hb, and PTH, respectively. In addition, the dosage of nifedipine may be reduced by 7.5 mg, with the maximum boundary value of PTH. As observed in scenario B1–3, the dose might be increased by 22.5, 45, and 37.5 mg with the minimum boundary value of age and Hb, Hb and PTH, as well as age and PTH, respectively.
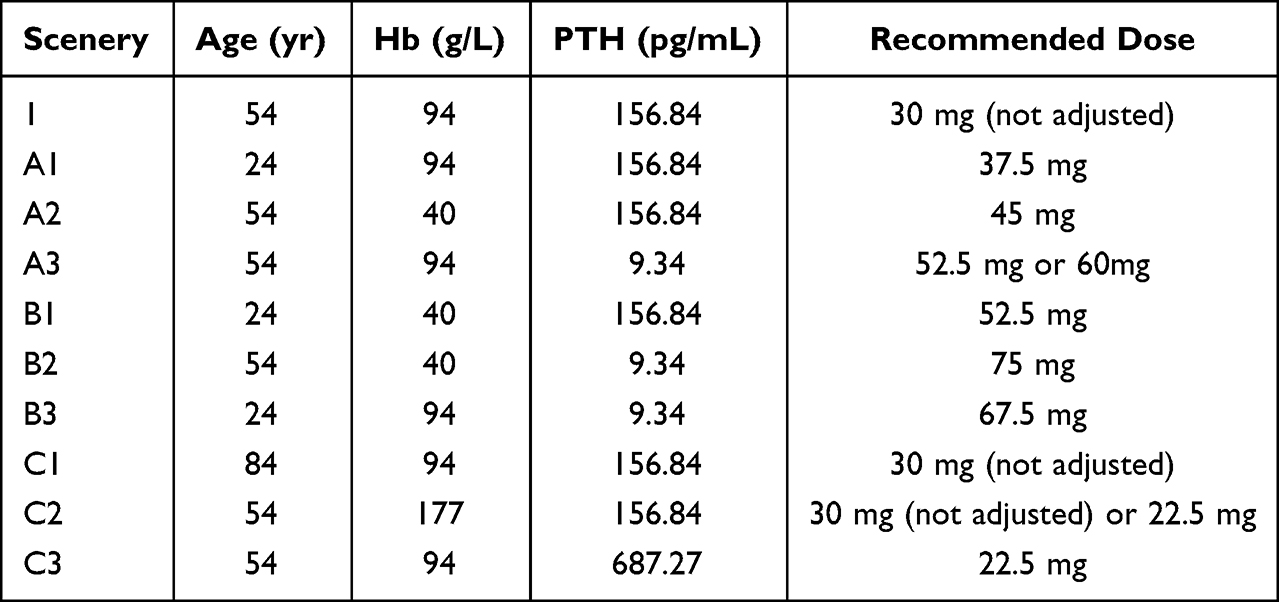 |
Table 4 Dosage Adjustment for Nifedipine in Different Scenarios |
Discussion
To the best of our knowledge, this is the first population pharmacokinetic study on nifedipine as a typical CYP3A substrate, in CKD patients. To determine the extent of the contribution of PTH to the changes in CYP3A expression and the pharmacokinetics of CYP3A eliminated drugs, we developed a PopPK model of nifedipine, by performing a prospective study of 157 Chinese CKD subjects. In this study, PTH demonstrated a significant negative correlation with CL in the PopPK model (also referring to Figure 6). In comparison with the reference, the dosage of nifedipine was reduced to the maximum boundary value of PTH after a Monte Carlo simulation.
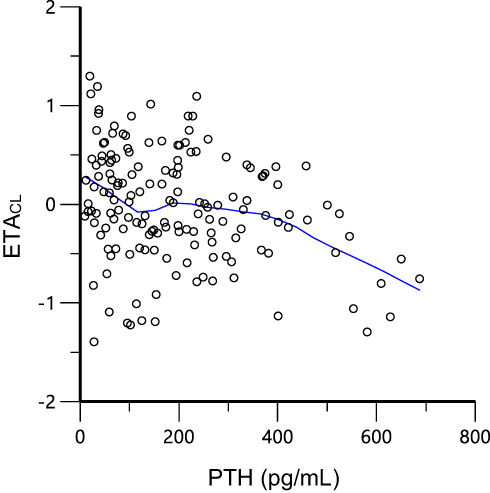 |
Figure 6 The relation between clearance and PTH. Green line, LOESS line. |
PTH, as a middle molecule uremic toxin, may be the prime mediator involved in the downregulation of liver CYP450 in CKD rats.13 Therefore, successful clinical translation was brought into focus.30,31 It was observed that PTH exerted a suppressive effect on CYP3A expression via multiple signaling pathways including the NF-κB/PXR pathway.15 However, as previously mentioned, reports on this finding from recent clinical trials are inconsistent.16,17 One explanation is that these were retrospective and observational studies with a limited number of enrolled patients. In addition, other covariates (additional physiological and genetic data) were not taken into account.16 In another a study of 48 subjects to examined CYP3A5 polymorphism and serum PTH level affect the tacrolimus blood concentration/dose (C/D) ratio before kidney transplantation in patients with end-stage renal failure, a significant positive correlation was found between tacrolimus C/D and PTH concentrations. Meanwhile, the multivariable linear regression analysis identified serum PTH level as significant factors associated with tacrolimus C/D.32 However, these analyses were performed on account of a single dose-normalized blood tacrolimus concentration, and not clearance. Therefore, it could not be inferred that the fluctuation of tacrolimus blood concentration was a result of reduced metabolic capacity.32 Our study evaluated whether serum PTH level influence the clearance of nifedipine in view of multiple blood levels, where the effects of serum PTH levels and CYP3A activity were confirmed.
For genetic factors, CYP3A genetic polymorphisms including CYP3A5*3 rs776746,22 CYP3A4*1G rs2242480,19,20 CYP3A4 rs4646437;21 genetic polymorphisms of NF-κB/PXR metabolism pathway proteins including NFKB1 rs2836249124,25 and NR1I2 rs2276707;23–25 and immune-related genes including IL-3 rs18178121 may influence the expression of CYP3A and play important roles in nifedipine metabolism. In addition, the multidrug resistance gene MDRD1, which encodes P-gp, was reported to be involved in the transport of nifedipine.26,27 However, in our study population, the investigated polymorphisms did not influence nifedipine CL/F. For confirmation, these analyses should be repeated in other cohorts.
The physiological and pathological state of an individual is the most important factor that affects drug response. Injuries to the liver and kidney can impact drug disposal, leading to significant changes in the pharmacokinetic and pharmacodynamic properties of the drugs.33–35 This was observed in our PopPK model with CKD patients. Similar to PTH, Hb and CL/F were negatively correlated. This may be consistent with other findings in these reports,36,37 which raised this possibility that low hemoglobin values obtained from low hematocrit values, potentially leading to a decrease in bound nifedipine, while an increase in free nifedipine stimulates metabolic enzyme disposal and causes an increase in CL/F. However, hematocrit did not have significant covariates in the final model of CL/F. This finding arouses our interest and future exploration of it is also required.
Moreover, it was observed that there was no significant relationship between the severity of CKD and CYP3A4/5-mediated clearance via systematic and quantitative assessment.38 These conflicting results may be ascribed to the classification of CKD subjects primarily based on measured creatinine clearance or GFR. In this study, CYP3A clearance was not significantly correlated with serum creatinine or GFR. However, it was demonstrated that PTH may be a superior index to characterize the elimination pathway of CYP3A, particularly in the case of nonrenally eliminated drugs.
To validate these findings, however, further large-scale studies with more covariates and multicenter clinical trials are required. This will provide a better explanation for the variation among individuals.
Conclusion
In conclusion, a population pharmacokinetic model of nifedipine was developed. This model adequately described the genetic and non-genetic factors in patients with CKD. This PopPK model confirmed the suppressive effect of PTH on the clearance of nifedipine (a substrate of CYP3A4) and may offer insights into the role of PTH in the characterization of CYP3A. This study may contribute to the design of and the optimal administration schedule for using CYP3A substrates in CKD patients.
Data Sharing Statement
All the relevant data are shown in the manuscript.
Funding
This work was supported by the National Major New Drug Creation Project of China (No. 2020ZX09201–010), National Scientific Foundation of China (No. 81673519), Medical Technology Innovation Guidance Project of Hunan Province Science and Technology Department (No. 2020SK51805), and Scientific Research Fund Project of Hunan Provincial Health Commission (No. 20201980).
Disclosure
The authors report no conflicts of interest in this work.
References
1. Webster AC, Nagler EV, Morton RL, Masson P. Chronic kidney disease. Lancet. 2017;389(10075):1238–1252. doi:10.1016/S0140-6736(16)32064-5
2. Lea-Henry TN, Carland JE, Stocker SL, Sevastos J, Roberts DM. Clinical pharmacokinetics in kidney disease: fundamental principles. Clin J Am Soc Nephrol. 2018;13(7):1085–1095. doi:10.2215/CJN.00340118
3. Roberts DM, Sevastos J, Carland JE, Stocker SL, Lea-Henry TN. Clinical pharmacokinetics in kidney disease: application to rational design of dosing regimens. Clin J Am Soc Nephrol. 2018;13(8):1254–1263. doi:10.2215/CJN.05150418
4. Tan ML, Yoshida K, Zhao P, et al. Effect of chronic kidney disease on nonrenal elimination pathways: a systematic assessment of CYP1A2, CYP2C8, CYP2C9, CYP2C19, and OATP. Clin Pharmacol Ther. 2018;103(5):854–867. doi:10.1002/cpt.807
5. Ladda MA, Goralski KB. The effects of CKD on cytochrome P450–mediated drug metabolism. Adv Chronic Kidney D. 2016;23(2):67–75. doi:10.1053/j.ackd.2015.10.002
6. Tan M, Zhao P, Zhang L, et al. Use of physiologically based pharmacokinetic modeling to evaluate the effect of chronic kidney disease on the disposition of hepatic CYP2C8 and OATP1B drug substrates. Clin Pharmacol Ther. 2019;105(3):719–729. doi:10.1002/cpt.1205
7. James BC, Hwang JL, Grogan RH, Kaplan EL, Sarne D, Angelos P. Leontiasis ossea caused by long-standing hyperparathyroidism secondary to chronic renal failure. Surgery. 2014;156(6):1644–1646. doi:10.1016/j.surg.2014.08.082
8. Klin M, Smogorzewski M, Ni Z, Zhang G, Massry SG. Abnormalities in hepatic lipase in chronic renal failure: role of excess parathyroid hormone. J Clin Invest. 1996;97(10):2167–2173. doi:10.1172/JCI118657
9. Nashiki K, Taketani Y, Takeichi T, et al. Role of membrane microdomains in PTH-mediated down-regulation of NaPi-IIa in opossum kidney cells. Kidney Int. 2005;68(3):1137–1147. doi:10.1111/j.1523-1755.2005.00505.x
10. Segawa H, Yamanaka S, Onitsuka A, et al. Parathyroid hormone-dependent endocytosis of renal type IIc Na-Pi cotransporter. Am J Physiol-Renal. 2007;292(1):F395–F403. doi:10.1152/ajprenal.00100.2006
11. Sugimoto R, Watanabe H, Ikegami K, et al. Down-regulation of ABCG2, a urate exporter, by parathyroid hormone enhances urate accumulation in secondary hyperparathyroidism. Kidney Int. 2017;91(3):658–670. doi:10.1016/j.kint.2016.09.041
12. Watson PH, Fraher LJ, Hendy GN, et al. Nuclear localization of the type 1 PTH/PTHrP receptor in rat tissues. J Bone Miner Res. 2000;15(6):1033–1044. doi:10.1359/jbmr.2000.15.6.1033
13. Michaud J, Naud J, Chouinard J, et al. Role of parathyroid hormone in the downregulation of liver cytochrome P450 in chronic renal failure. J Am Soc Nephrol. 2006;17(11):3041–3048. doi:10.1681/ASN.2006010035
14. Luo G, Guenthner T, Gan LS, Humphreys WG. CYP3A4 induction by xenobiotics: biochemistry, experimental methods and impact on drug discovery and development. Curr Drug Metab. 2004;5(6):483–505. doi:10.2174/1389200043335397
15. Watanabe H, Sugimoto R, Ikegami K, et al. Parathyroid hormone contributes to the down-regulation of cytochrome P450 3A through the cAMP/PI3K/PKC/PKA/NF-κB signaling pathway in secondary hyperparathyroidism. Biochem Pharmacol. 2017;145:192–201. doi:10.1016/j.bcp.2017.08.016
16. Hirataa K, Watanabeb HC, Toyoda M, et al. Effect of serum parathyroid hormone on tacrolimus therapy in kidney transplant patients: a possible biomarker for a tacrolimus dosage schedule. Biol Pharm Bull. 2019;42(5):786–791. doi:10.1248/bpb.b18-00976
17. Suzuki Y, Muraya N, Fujioka T, et al. Factors involved in phenoconversion of CYP3A using 4beta-hydroxycholesterol in stable kidney transplant recipients. Pharmacol Rep. 2019;71(2):276–281. doi:10.1016/j.pharep.2018.12.007
18. Kiang TK, Sherwin CM, Spigarelli MG, Ensom MH. Fundamentals of population pharmacokinetic modelling: modelling and software. Clin Pharmacokinet. 2012;51(8):515–525. doi:10.1007/BF03261928
19. Huang L, Wang J, Yang J, et al. Impact of CYP3A4/5 and ABCB1 polymorphisms on tacrolimus exposure and response in pediatric primary nephrotic syndrome. Pharmacogenomics. 2019;20(15):1071–1083. doi:10.2217/pgs-2019-0090
20. Zhang W, Yuan JJ, Kan QC, et al. Influence of CYP3A5*3 polymorphism and interaction between CYP3A5*3 and CYP3A4*1G polymorphisms on post-operative fentanyl analgesia in Chinese patients undergoing gynaecological surgery. Eur J Anaesthesiol. 2011;28(4):245–250. doi:10.1097/EJA.0b013e3283438b39
21. Liu MZ, He HY, Zhang YL, et al. IL-3 and CTLA4 gene polymorphisms may influence the tacrolimus dose requirement in Chinese kidney transplant recipients. Acta Pharmacol Sin. 2017;38(3):415–423. doi:10.1038/aps.2016.153
22. Wang X, Yan L, Cao H, et al. Effect of CYP3A4*1G, CYP3A5*3, POR*28, and ABCB1 C3435T on the pharmacokinetics of nifedipine in healthy Chinese volunteers. Int J Clin Pharmacol Ther. 2015;53(09):737–745. doi:10.5414/CP202211
23. Lu T, Zhu X, Xu S, et al. Dosage optimization based on population pharmacokinetic analysis of tacrolimus in Chinese patients with nephrotic syndrome. Pharm Res. 2019;36(3):45. doi:10.1007/s11095-019-2579-6
24. Zhang Y, Li JL, Fu Q, et al. Associations of ABCB1, NFKB1, CYP3A, and NR1I2 polymorphisms with cyclosporine trough concentrations in Chinese renal transplant recipients. Acta Pharmacol Sin. 2013;34(4):555–560. doi:10.1038/aps.2012.200
25. Zhao G, Liu M, Wu X, et al. Effect of polymorphisms in CYP3A4, PPARA, NR1I2, NFKB1, ABCG2 and SLCO1B1 on the pharmacokinetics of lovastatin in healthy Chinese volunteers. Pharmacogenomics. 2017;18(1):65–75. doi:10.2217/pgs.16.31
26. Dorababu M, Nishimura A, Prabha T, et al. Effect of cyclosporine on drug transport and pharmacokinetics of nifedipine. Biomed Pharmacother. 2009;63(9):697–702. doi:10.1016/j.biopha.2009.04.031
27. Lee CK, Choi JS, Choi DH. Effects of HMG-CoA reductase inhibitors on the pharmacokinetics of nifedipine in rats: possible role of P-gp and CYP3A4 inhibition by HMG-CoA reductase inhibitors. Pharmacol Rep. 2015;67(1):44–51. doi:10.1016/j.pharep.2014.08.005
28. Abramovs N, Brass A, Tassabehji M. Hardy-Weinberg equilibrium in the large scale genomic sequencing era. Front Genet. 2020;11:210. doi:10.3389/fgene.2020.00210
29. Chung M, Reitberg DP, Gaffney M, Singleton W. Clinical pharmacokinetics of nifedipine gastrointestinal therapeutic system. A controlled-release formulation of nifedipine. Am J Med. 1987;83(6B):10–14. doi:10.1016/0002-9343(87)90630-9
30. Pea F. From bench to bedside: perspectives on the utility of pharmacokinetics/pharmacodynamics in predicting the efficacy of antifungals in invasive candidiasis. Mycoses. 2020;63(8):854–858. doi:10.1111/myc.13121
31. Yu M, Xu J, Zheng J. Renal clearable luminescent gold nanoparticles: from the bench to the clinic. Angew Chem Int Ed Engl. 2019;58(13):4112–4128. doi:10.1002/anie.201807847
32. Tanaka R, Suzuki Y, Watanabe H, et al. Association of CYP3A5 polymorphisms and parathyroid hormone with blood level of tacrolimus in patients with end-stage renal disease. Clin Transl Sci. 2021;14(5):2034–2042. doi:10.1111/cts.13065
33. Anderson GD, Anderson GD, Hakimian S, Hakimian S. Pharmacokinetic of antiepileptic drugs in patients with hepatic or renal impairment. Clin Pharmacokinet. 2014;53(1):29–49. doi:10.1007/s40262-013-0107-0
34. Nguyen L, Holland J, Ramies D, et al. Effect of renal and hepatic impairment on the pharmacokinetics of cabozantinib. J Clin Pharmacol. 2016;56(9):1130–1140. doi:10.1002/jcph.714
35. Verbeeck RK, Musuamba FT. Pharmacokinetics and dosage adjustment in patients with renal dysfunction. Eur J Clin Pharmacol. 2009;65(8):757–773. doi:10.1007/s00228-009-0678-8
36. Li L, Li CJ, Zheng L, et al. Tacrolimus dosing in Chinese renal transplant recipients: a population-based pharmacogenetics study. Eur J Clin Pharmacol. 2011;67(8):787–795. doi:10.1007/s00228-011-1010-y
37. Meng XG, Guo CX, Feng GQ, et al. Association of CYP3A polymorphisms with the pharmacokinetics of cyclosporine a in early post-renal transplant recipients in China. Acta Pharmacol Sin. 2012;33(12):1563–1570. doi:10.1038/aps.2012.136
38. Yoshida K, Sun B, Zhang L, et al. Systematic and quantitative assessment of the effect of chronic kidney disease on CYP2D6 and CYP3A4/5. Clin Pharmacol Ther. 2016;100(1):75–87. doi:10.1002/cpt.337
 © 2022 The Author(s). This work is published and licensed by Dove Medical Press Limited. The
full terms of this license are available at https://www.dovepress.com/terms
and incorporate the Creative Commons Attribution
- Non Commercial (unported, 3.0) License.
By accessing the work you hereby accept the Terms. Non-commercial uses of the work are permitted
without any further permission from Dove Medical Press Limited, provided the work is properly
attributed. For permission for commercial use of this work, please see paragraphs 4.2 and 5 of our Terms.
© 2022 The Author(s). This work is published and licensed by Dove Medical Press Limited. The
full terms of this license are available at https://www.dovepress.com/terms
and incorporate the Creative Commons Attribution
- Non Commercial (unported, 3.0) License.
By accessing the work you hereby accept the Terms. Non-commercial uses of the work are permitted
without any further permission from Dove Medical Press Limited, provided the work is properly
attributed. For permission for commercial use of this work, please see paragraphs 4.2 and 5 of our Terms.