")
Back to Journals » Journal of Multidisciplinary Healthcare » Volume 12
Physical activity levels of allied health professionals working in a large Australian metropolitan health district – an observational study
Authors Zafiropoulos B , Alison JA , Heard R
Received 2 October 2018
Accepted for publication 26 November 2018
Published 3 January 2019 Volume 2019:12 Pages 51—62
DOI https://doi.org/10.2147/JMDH.S189513
Checked for plagiarism Yes
Review by Single anonymous peer review
Peer reviewer comments 2
Editor who approved publication: Dr Scott Fraser
Bill Zafiropoulos,1,2 Jennifer A Alison,1,2 Robert Heard3
1Faculty of Health Sciences, Discipline of Physiotherapy, University of Sydney, Sydney, NSW 2141, Australia; 2Allied Health Professorial Unit, Sydney Local Health District, Sydney, NSW 2050, Australia; 3Faculty of Health Sciences, Discipline of Behavioral and Social Sciences in Health, University of Sydney, Sydney, NSW 2141, Australia
Purpose: The aim of this observational cross-sectional study was to determine if allied health professionals working in a large metropolitan health district were meeting the minimal physical activity (PA) recommendations and the proportion that occupational PA contributed to the recommended PA levels. A secondary aim was to determine possible relationships between self-report questionnaire measures of PA and PA measured by accelerometry.
Materials and methods: Allied health professionals, working in the Sydney Local Health District (SLHD) in 2016–2017, completed the Active Australia Survey (AAS), Occupational Sitting and Physical Activity Questionnaire (OSPAQ), International Physical Activity Questionnaire Long form (IPAQ-L), and wore the ActiGraph GT1M accelerometer for 7 days consecutively.
Results: Based on accelerometry results, allied health professionals (N=126) spent a mean (SD) of 51 (23) minutes in moderate-to-vigorous physical activity (MVPA)/day, representing 171% of the total recommended MVPA/day, with work contributing 76% to this recommendation. Participants walked a mean of 10,077 (2,766) steps/day, meeting 100% of the recommended 10,000 steps/day, with work contributing 54% to this recommendation. Sedentary behaviors were predominant throughout the entire day and work day. Compared with the ActiGraph MVPA time measurements, AAS MVPA time showed a fair level of agreement [intraclass correlation coefficient (ICC)=0.44, P<0.01], while OSPAQ and IPAQ-L MVPA time showed no agreement (ICC=0.05, P=0.27; ICC=0.13, P=0.10, respectively).
Conclusion: Allied health professionals working in a large metropolitan health district met the daily PA recommendations based on accelerometry measures but tended to overreport their MVPA on self-report questionnaires.
Keywords: occupational physical activity, sedentary behavior, questionnaires
Introduction
Physical inactivity refers to a lack of moderate-to-vigorous physical activity (MVPA) with decreased time spent in activities involving energy expenditure of at least three metabolic equivalent tasks (METs) throughout the week.1 Physical inactivity can occur as a result of a multitude of factors and has been correlated to individual (eg, age, sex, health status, self-efficacy, occupation), physical (eg, accessibility and availability of exercise facilities and equipment, seasonality), and social environmental factors (eg, urban planning, transportation systems, parks, and trails).2,3 Levels of physical inactivity are increasing in many countries, and this has been linked to increases in morbidity and mortality,2 with major implications for the general health of populations worldwide.1,4–6 Participation in sufficient physical activity (PA) levels throughout the day is associated with significant health benefits,1 such as decreased risk of diabetes mellitus, cardiovascular disease, certain types of cancers, depression, and all-cause mortality,7–11 with an overall decrease in health system utilization.12 PA throughout the day is accumulated through leisure time activities, transportation, domestic tasks, and occupational activities.1,13
To achieve the health benefits of PA, it is recommended that individuals engage in 150 minutes of moderate intensity aerobic exercise and at least 75 minutes of vigorous intensity aerobic PA (or an equivalent combination of moderate and vigorous intensity PA) each week.1,14 Participation in MVPA demonstrates a dose–response relationship with cardiorespiratory health (with associated risk reductions in coronary heart disease, cardiovascular disease, stroke, and hypertension),1 with additional health benefits observed with up to 300 minutes of moderate-intensity PA/week.15,16 Therefore, it has been suggested that individuals aged 18–64 years perform at least 30 minutes of MVPA on most days of the week.1,14,17,18 The number of steps/day representative of the minimal requirement of 30 minutes of MVPA/day in healthy adults (aged 18–64 years) is 7,100–11,000 steps,18,19 and it is widely accepted that 10,000 steps/day is a reasonable and achievable target.17,18 PA levels have also been monitored using self-report questionnaires in population-based studies with varying levels of test–retest reliability and validity.20,21
Technological advancements and modern lifestyles (including occupational, domestic, and screen-based leisure activities) have led to increases in sedentary behaviors22–28 and physical inactivity,11,29 which have been linked to the development of chronic disease.30–38 Sedentary behaviors within the workplace (eg, sitting, screen-based activities) with energy expenditure 1.0–1.5 METs39,40 contribute to overall physical inactivity.41–43 Studies have demonstrated that individuals with less PA at work are also likely to demonstrate less leisure time PA.44,45
Occupations in health care may be more active and health care professionals may have greater levels of health literacy, education, and clinical expertise, which may facilitate healthy lifestyle behaviors such as maintaining higher levels of daily PA.46,47 Although some studies have investigated PA levels in health professionals,48–52 few studies have investigated occupational PA levels53,54 and its contribution to recommended PA levels. A study investigating occupational PA levels across various occupational sectors using accelerometry classified health sector occupations as being associated with intermediate levels of occupational PA according to the proportion of total PA spent in MVPA.54 In addition, a Dutch study investigating the contribution of occupational PA levels to overall total PA levels across occupational sectors reported that occupational PA in health care sector occupations contributed ~30% to the overall total PA.53 Therefore, work-related PA may be an important contributor to overall total PA levels in the health sector.54 Furthermore, no studies have specifically investigated the PA levels of the allied health workforce.
The primary aim of this study was to determine if allied health professionals working in a large health district were meeting the recommended daily PA guidelines and the proportion that occupational PA contributed to this recommendation. The secondary aim of the study was to determine if there was any relationship between subjective self-report levels of PA via questionnaires and objective accelerometer measures of PA in allied health professionals.
Materials and methods
This study was a prospective observational study with cross-sectional design and was registered with the Australian and New Zealand Clinical Trials Registry (ACTRN12616000514404).
Sample
Participants were recruited from allied health professionals working in the Sydney Local Health District (SLHD). Allied health disciplines included in the study were physiotherapy, occupational therapy, psychology, nutrition and dietetics, speech pathology, pharmacy, podiatry, radiography, and social work. Allied health employees, deemed fit for work, aged 20–70 years and working in inpatient, outpatient, or community health services were invited to participate in this study. A minimum sample size of 112 participants was sufficient to demonstrate a ±1,000 step difference from the recommended 10,000 steps/day for daily PA, with P<0.05 and power of 0.80 (continuous outcome noninferiority trial).55
Procedures
The study was conducted in the SLHD between April 2016 and December 2017. Staff were invited to participate via the distribution of a flyer and departmental e-mail, which provided basic information regarding the study procedures. Participation in the study was voluntary, and written informed consent was obtained from all participants. At initial assessment, demographic information, employment status, and position details were collected. Participants were asked to complete three validated questionnaires: the Active Australia Survey (AAS),20,56 the Occupational Sitting and Physical Activity Questionnaire (OSPAQ),57–59 and the long form version of the International Physical Activity Questionnaire (IPAQ-L).60–62
Participants wore a PA monitor (ActiGraph GT1M uniaxial accelerometer, Pensacola, Florida, USA) for 7 days consecutively. The ActiGraph GT1M detects human movement in the range of 0.05–2 gravity force with the signal filtered at a bandwidth of 0.25–2.5 Hertz63 and has good test–retest reliability and validity.64–66 Participants wore the activity monitor in the midaxillary line on their right hip via an elasticized band during waking hours and removed the monitor during bathing/showering or swimming activities. Participants were asked to continue their normal leisure and workplace activities during the data collection period. Activity counts were recorded in 1-minute epochs, which were used to calculate the relative intensity of PA performed. Adult Freedson cut points were utilized to describe the relative intensity of PA.67,68 For the activity data to be included in the analyses, participants had to wear the ActiGraph for a minimum of 10 hours a day (as representative of a full day’s wear) with a minimum of 4 days total wear.69–71 ActiLife version 6.10.4 software was used to download data and manage raw output data from the ActiGraph GT1M devices. Participants also kept a log of days and times worked during the 7-day data collection period. Participants were asked to rate the tolerability of wearing the ActiGraph device as intolerable, somewhat tolerable, neutral, tolerable, or very tolerable. Study data were collected and managed using Research Electronic Data Capture (REDCap).72
Statistical analyses
Quantitative data were analyzed using IBM SPSS Statistics for Windows, version 22.0 (IBM Corporation, Armonk, NY, USA). Normally distributed data were summarized as means and SDs, and data that were not normally distributed were summarized as medians and IQRs.
Absolute agreement between subjective questionnaire self-report measures and corresponding objective ActiGraph measures of time spent in various categories of PA were assessed using intraclass correlation coefficients (ICC) using a two-way mixed model with absolute agreement. Subjective items within the individual questionnaires for corresponding MET levels were compared with similar ActiGraph measures of PA. Repeatability and the level of agreement were interpreted as follows: poor (<0.40), fair to good (0.40–0.75), and excellent (>0.75).73 Bland–Altman plots were used to determine the level of difference between subjective questionnaire self-report and objective ActiGraph measures. Specifically, questionnaire items reflecting time spent in MVPA for the AAS, OSPAQ, and IPAQ-L were summed within each questionnaire with a daily MVPA time calculated which was compared with the ActiGraph MVPA minutes/day. Questionnaires with items reflecting time spent in work MVPA (ie, OSPAQ and IPAQ-L) were treated similarly with the calculated daily work MVPA time compared with the ActiGraph MVPA minutes/day during work hours.
Differences between key variables were analyzed via dependent samples t-tests or Wilcoxon signed rank tests and correlations were examined using Pearson’s correlations or Spearman’s rho correlations. The strength of correlation effect size was interpreted as small (0.10–0.29), medium (0.30–0.49), and large (≥0.50).74 The level of statistical significance was set at P<0.05.
Ethics statement
Ethics approval was obtained from the Human Research Ethics Committee of the Sydney Local Health District (SLHD) (Protocol Number X15-0435 and HREC/15/RPAH/580). This study was conducted in accordance with the Declaration of Helsinki.
Results
Demographics and ActiGraph wear
Of the 514 allied health professionals informed about the study, 126 agreed to participate in this study. The participant demographic data are presented in Table 1. ActiGraph tolerability of wear was rated as greater than or equal to tolerable by 86% (n=108) with 12% (n=15) neutral and 2% (n=3) providing no response. The mean (SD) overall number of days the ActiGraph was worn for >10 hours wear each day was 6.5 (0.8) days. Participants wore the ActiGraph for a mean of 4.2 (1.0) work days and worked a mean of 35.8 (9.0) hours/week.
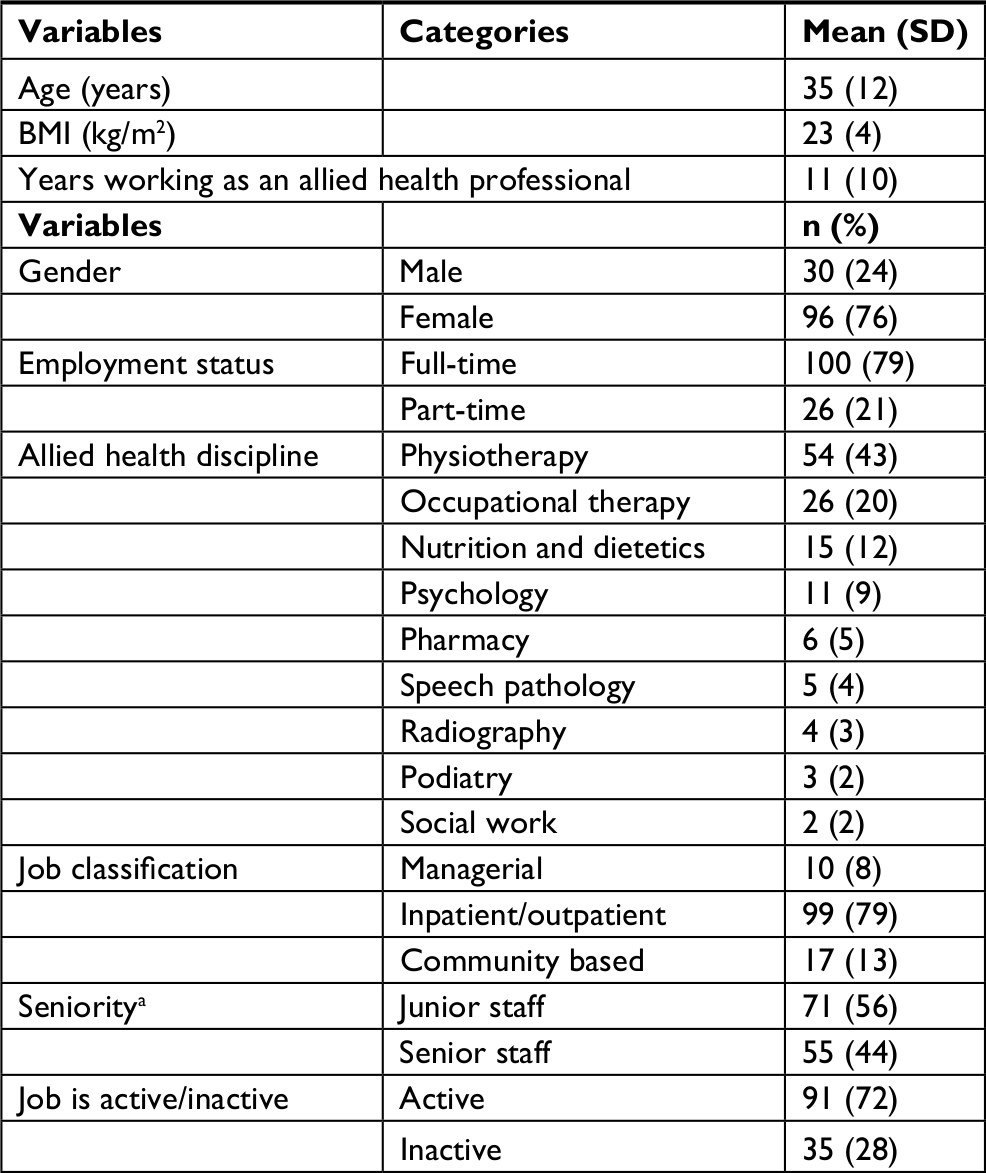 | Table 1 Allied health participants’ demographic data (N=126) Note: aSeniority, ≥ level 3 or ≥ grade 2 or ≥ senior clinical psychologist. Abbreviation: BMI, body mass index. |
ActiGraph accelerometer measures of PA levels
ActiGraph PA data for the participants’ entire day and during work hours are presented in Table 2. In addition, 82% (n=103) of allied health participants met the minimum PA MVPA guidelines of ≥30 minutes/day.1,14 Within our sample, 46% (n=57) walked greater than the recommended 10,000 steps/day,18 30% (n=38) walked between 8,000 and 10,000 steps/day, and 25% (n=31) walked <8,000 steps/day.
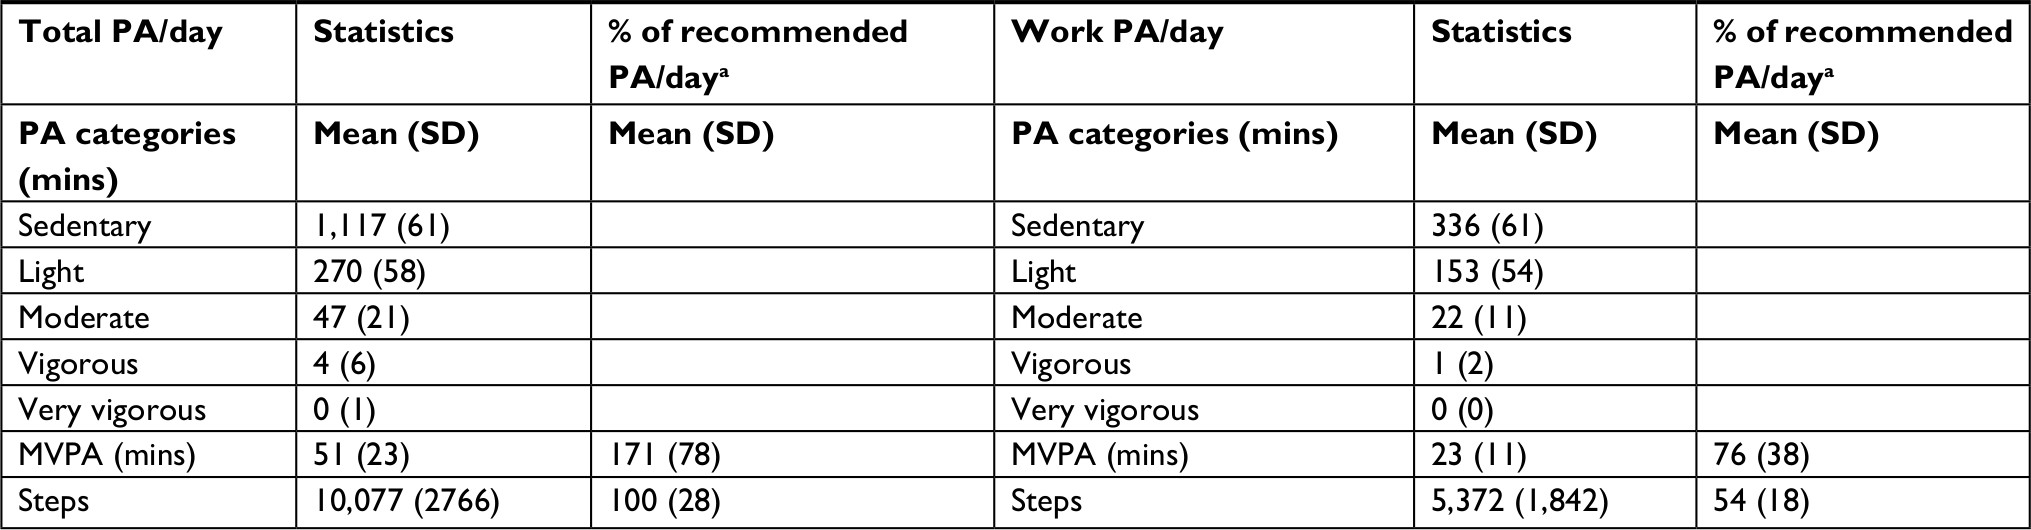 | Table 2 Allied health participants’ ActiGraph (GT1M) PA data (N=126) Note: aRecommended daily PA level: 30 minutes of MVPA/day,1,14 10,000 steps/day.18 Abbreviations: MVPA, moderate-to-vigorous physical activity; PA, physical activity. |
Self-report PA questionnaires and the level of agreement with ActiGraph accelerometer measurements
Table 3 provides a summary of the self-report questionnaire measurement of PA levels for the AAS (Table 3a), IPAQ-L (Table 3b), and OSPAQ (Table 3c). The level of absolute agreement between subjective questionnaire measures of PA and objective ActiGraph measures of PA are in Table 4. Bland–Altman plots for questionnaire variables which demonstrated significant agreement with ActiGraph measures are presented in Figure 1.
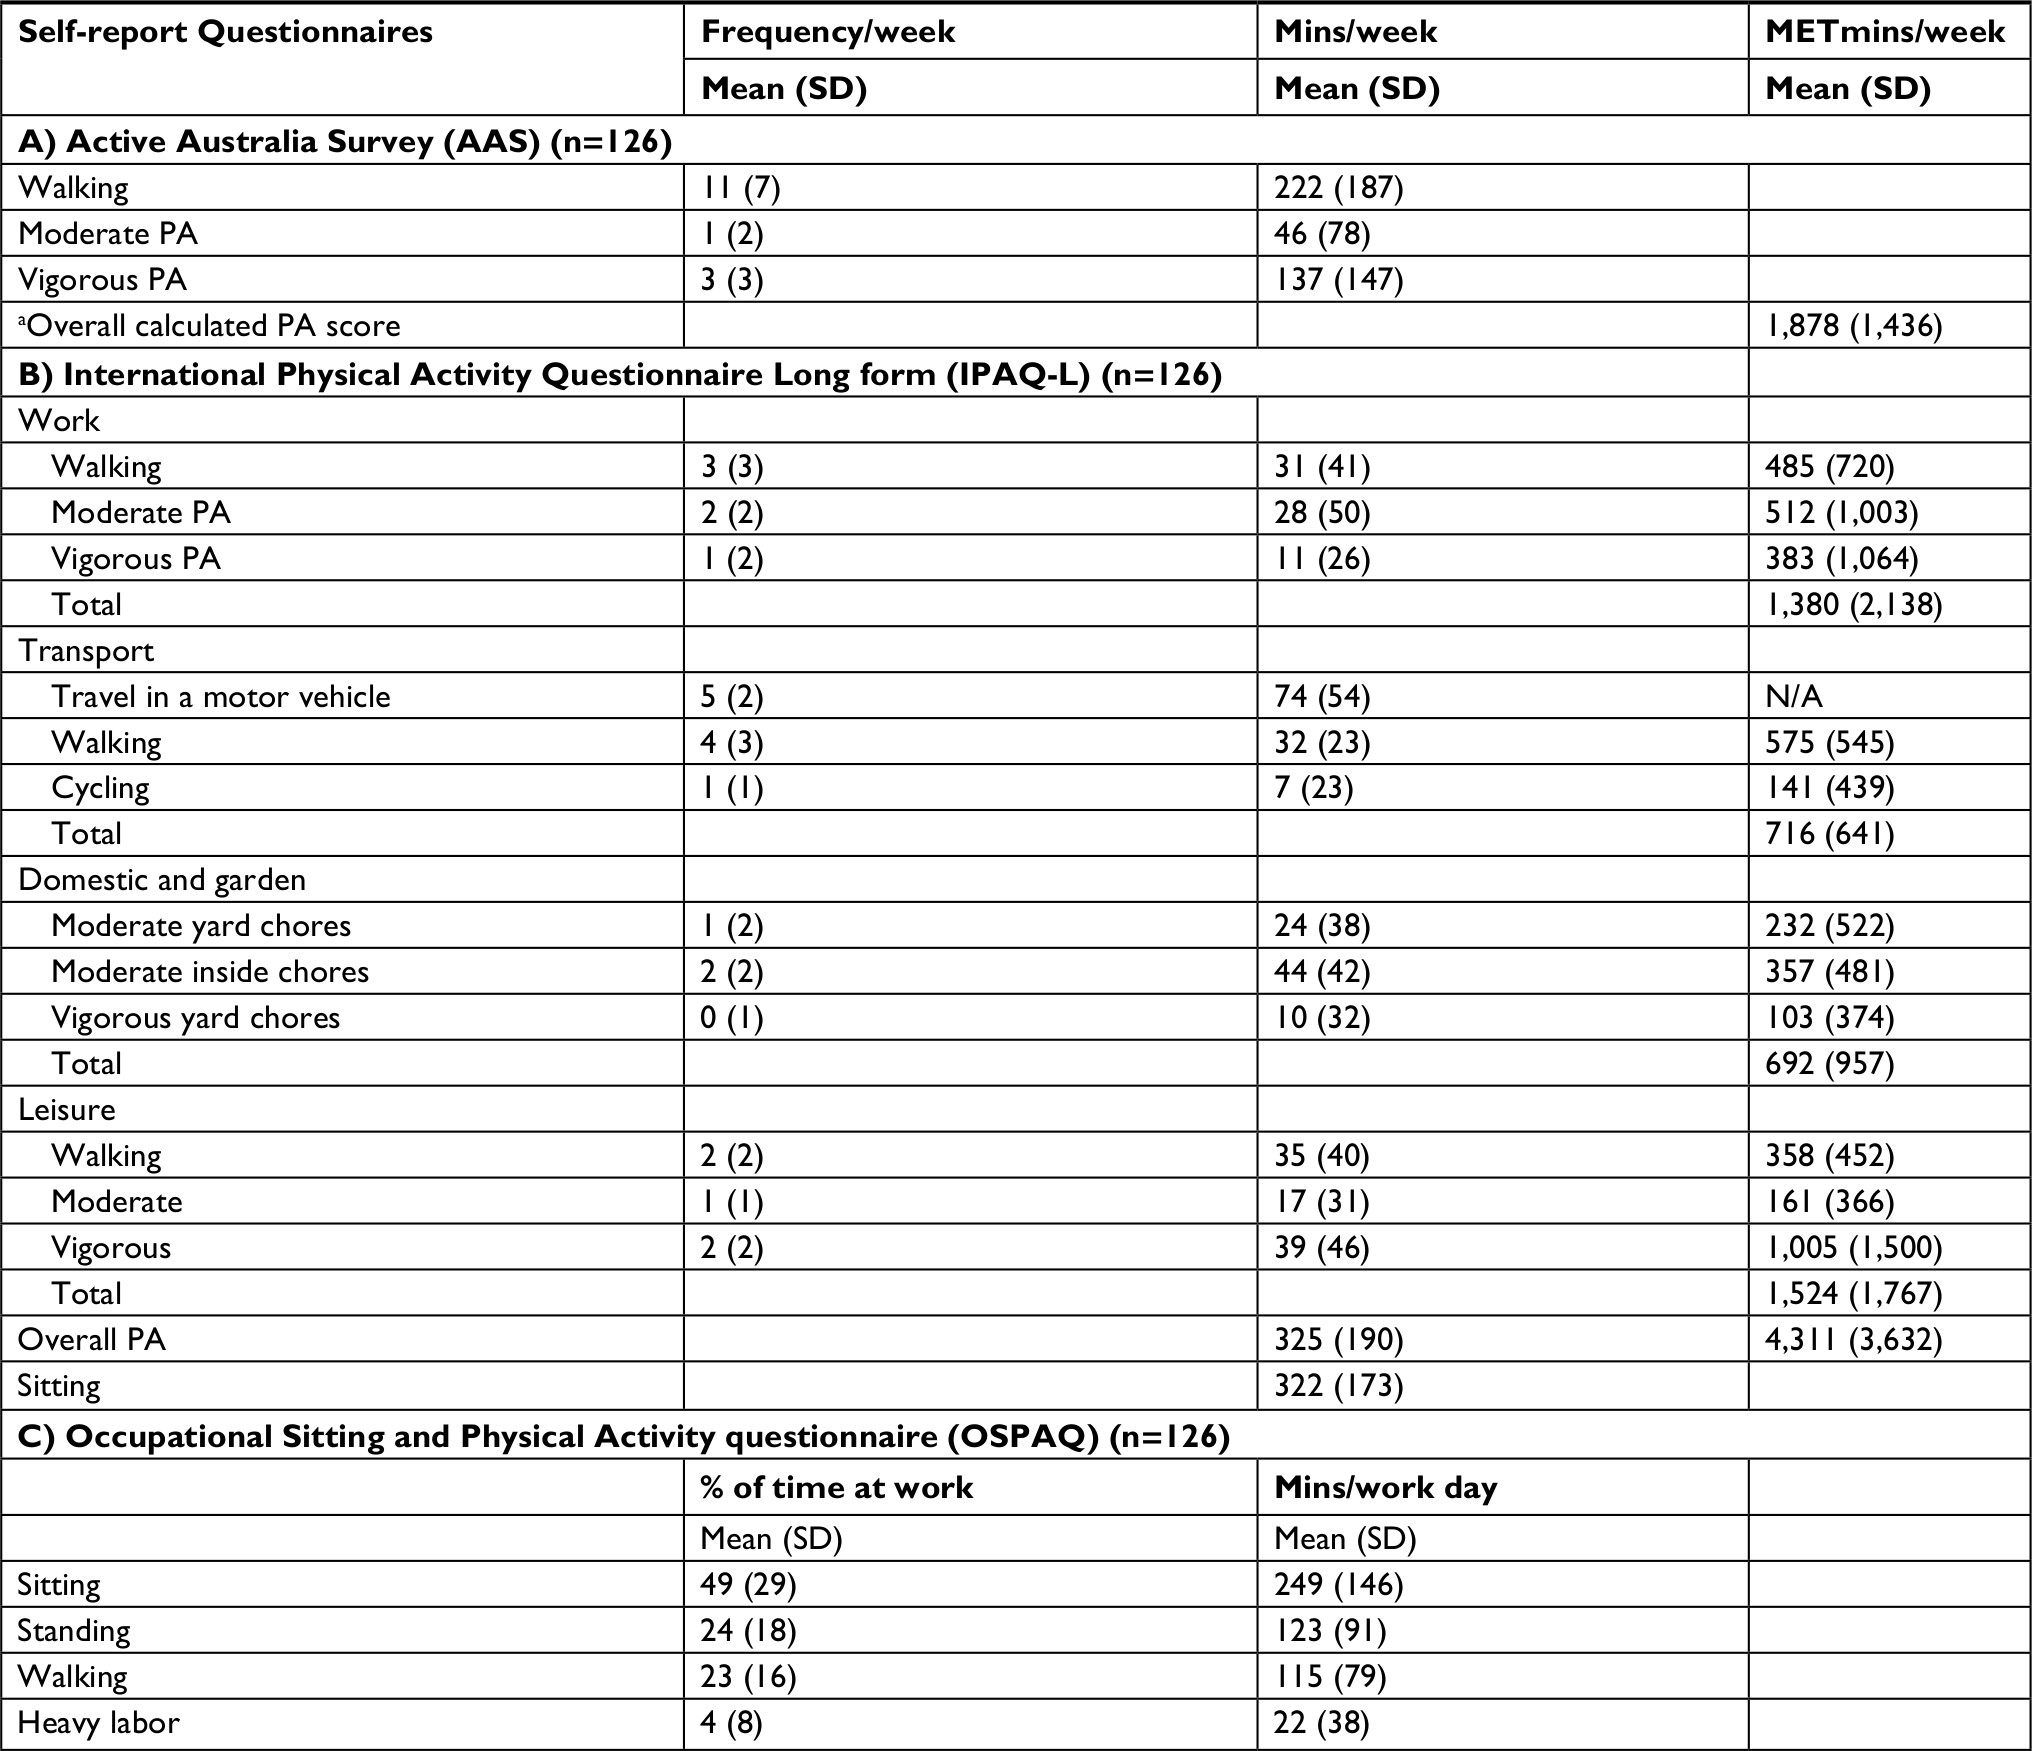 | Table 3 Allied health participants’ summary of self-report PA questionnaires (N=126) Note: aCalculated PA score = (walking mins × 3.0 METs) + (moderate intensity activity mins × 4.0 METS) + (vigorous intensity mins × 7.5 METS).56 Abbreviations: MET, metabolic equivalent task; PA, physical activity; N/A, not applicable. |
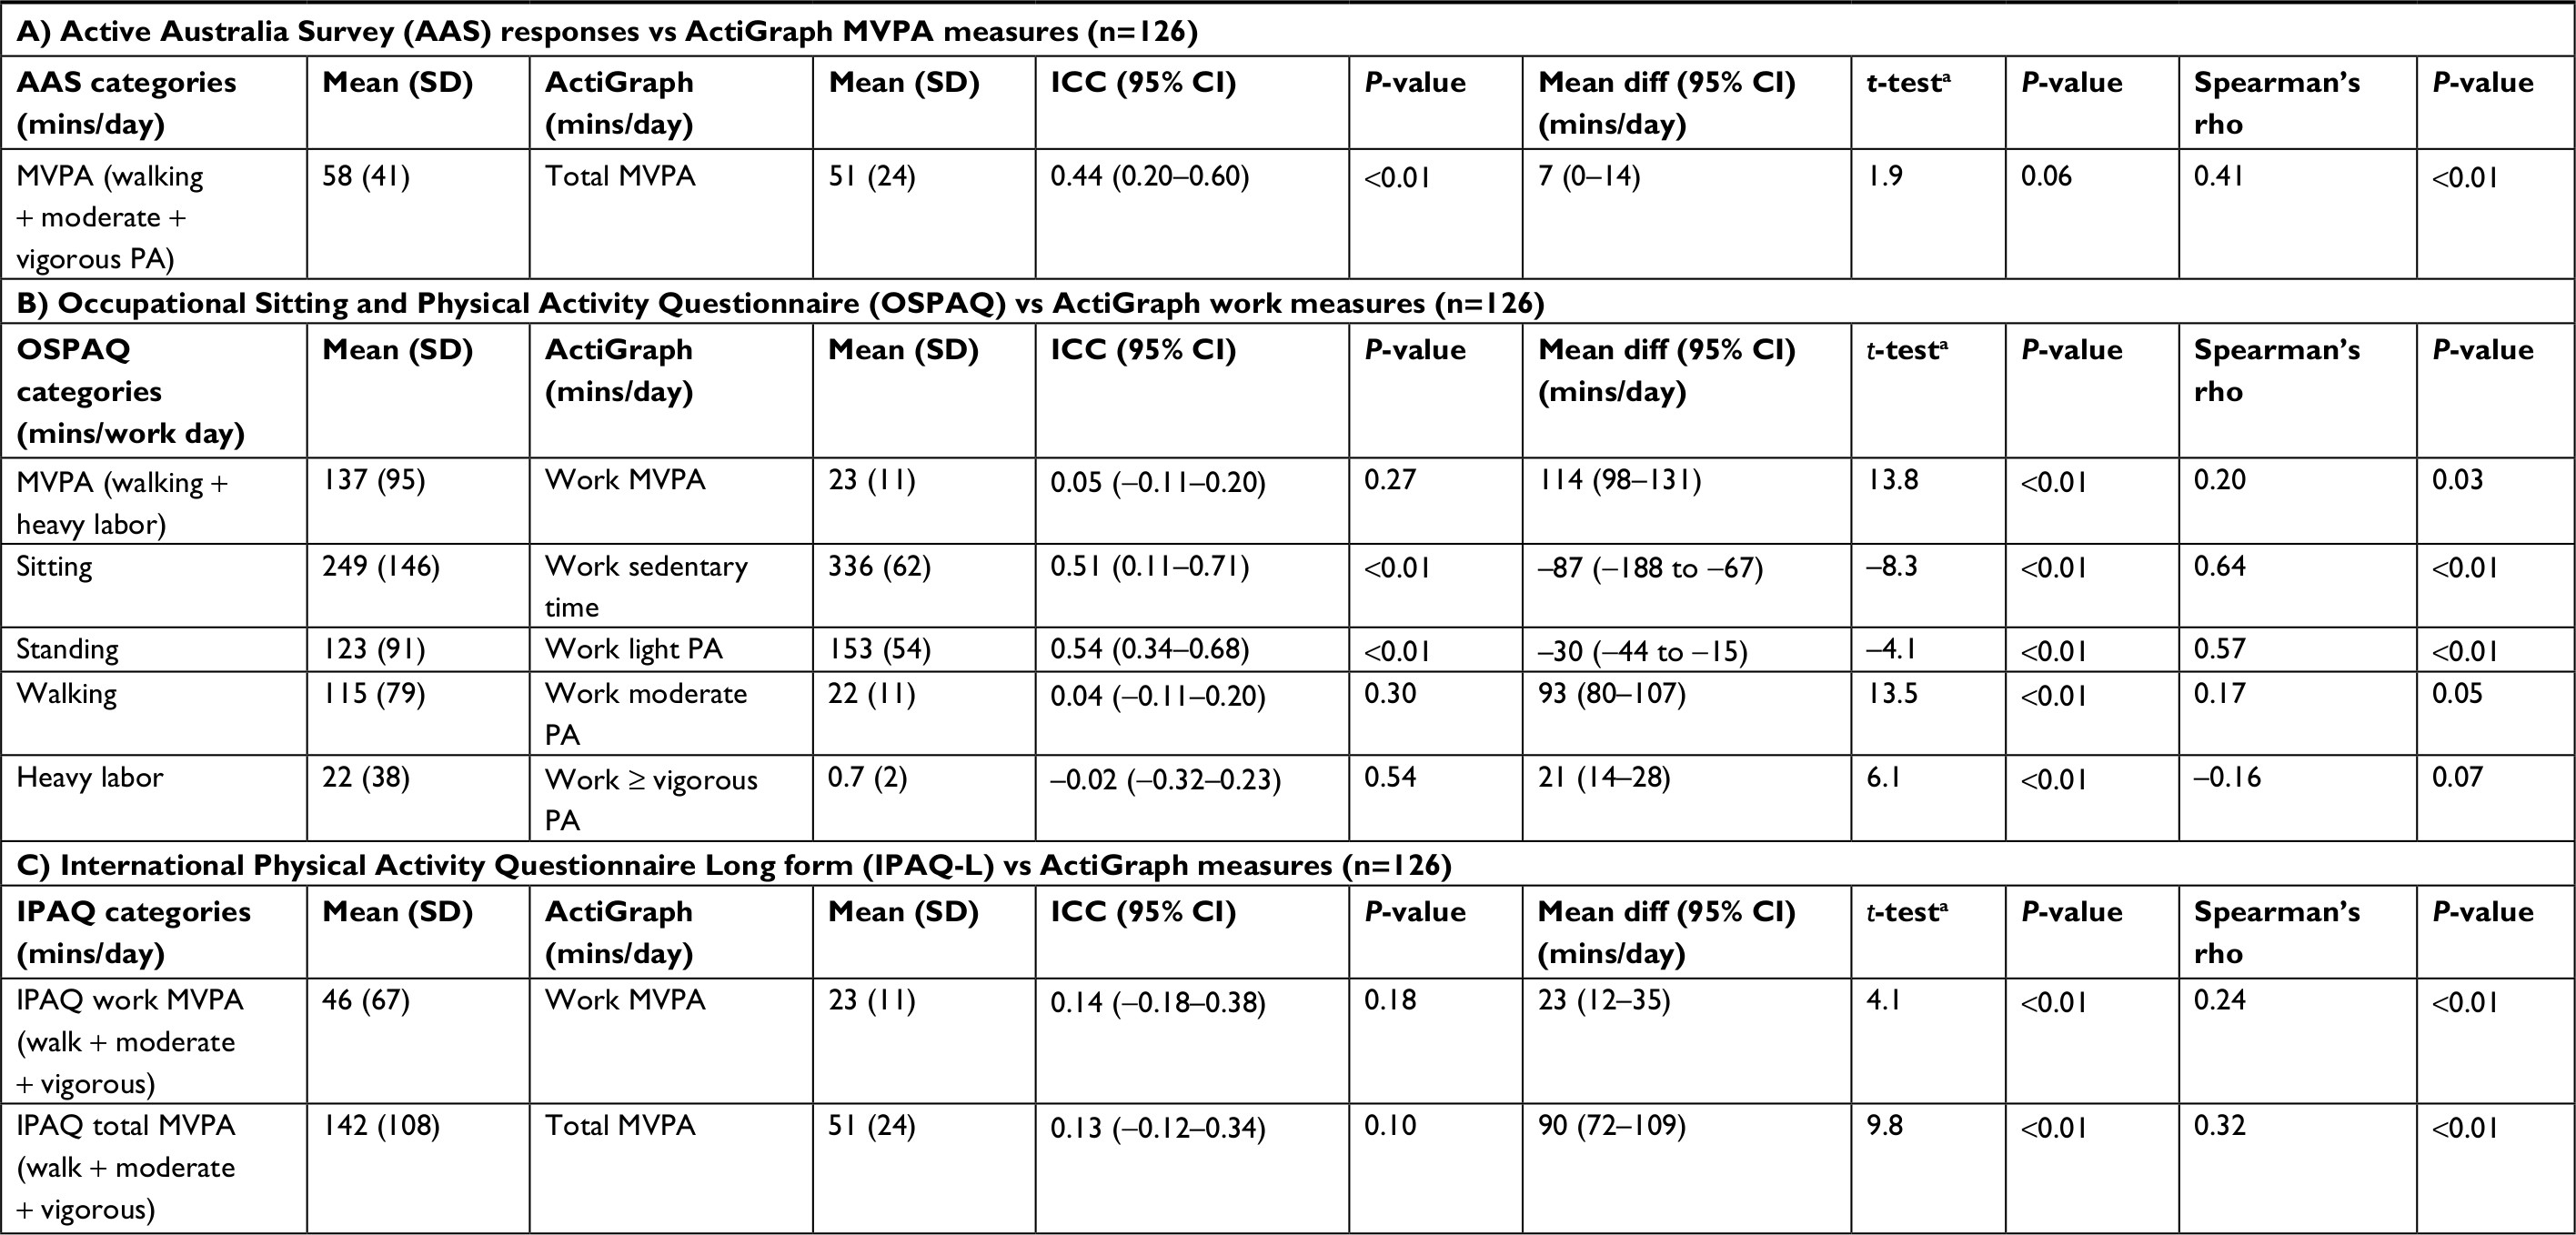 | Table 4 Level of agreement between self-report PA questionnaires and ActiGraph PA measures (N=126) Note: aDependent samples t-test statistics with degrees of freedom = 125. Abbreviations: ICC, intraclass correlation coefficient; MVPA, moderate-to-vigorous physical activity; PA, physical activity; diff, difference. |
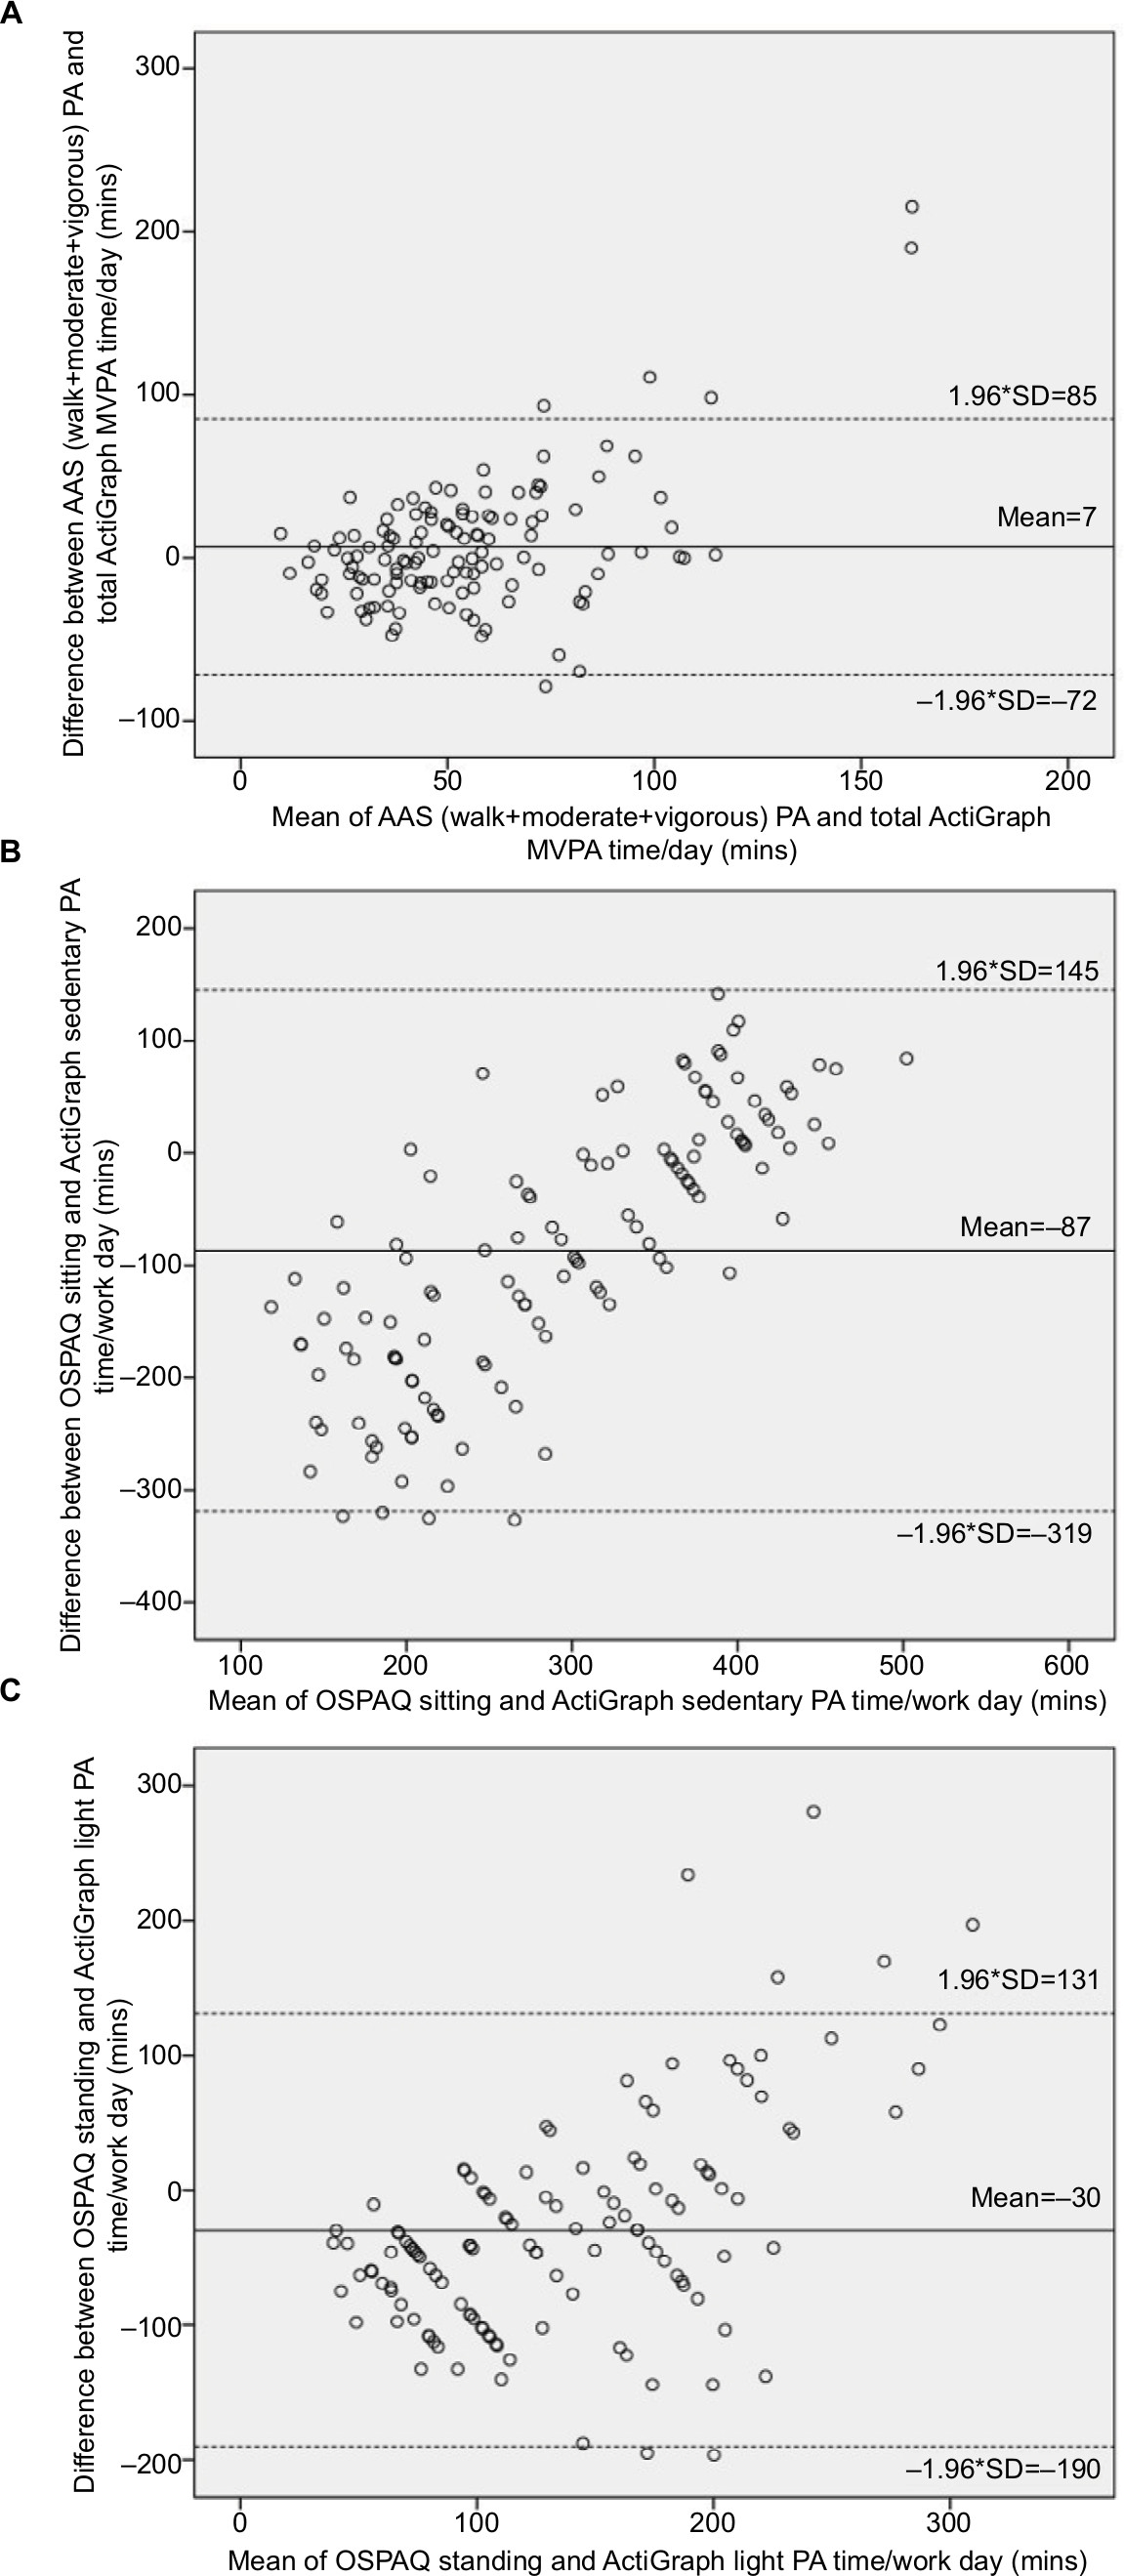 | Figure 1 Bland–Altman plots examining the agreement of statistically significant intraclass correlation coefficient data assessed with the ActiGraph and self-report questionnaires (N=126). Notes: unbroken line = mean difference; dashed line = coefficient of variability (±1.96×SD); x-axis = mean of respective variables; y-axis = mean difference between respective variables. Abbreviations: AAS, Active Australia Survey; PA, physical activity; MVPA, moderate-to-vigorous physical activity; OSPAQ, Occupational Sitting and Physical Activity Questionnaire. |
Self-report AAS MVPA time and OSPAQ sitting and standing work time showed a fair level of agreement with the corresponding objective ActiGraph accelerometry measurements (Table 4a, b). The calculated self-report AAS MVPA (walking + moderate + vigorous PA) when compared with the ActiGraph total MVPA [with mean (SD) values of 58 (41) and 51 (24) minutes/day, respectively] demonstrated a fair level of agreement (ICC=0.44, P<0.01) (Table 4a). The self-report AAS MVPA time compared with the ActiGraph total MVPA time was overestimated by a mean (SD) of 7 (40) minutes/day (Table 4a, Figure 1A). The difference between these variables was not significant [t(125)=1.9, P=0.06] (Table 4a) but showed a medium level of correlation with Spearman’s rho (rs)=0.41, P<0.01 (Table 4a).
The self-report OSPAQ work sitting time when compared with the ActiGraph work sedentary time [with mean (SD) values of 249 (146) and 336 (62) minutes/day, respectively] demonstrated a fair level of agreement (ICC=0.51, P<0.01) (Table 4b). The self-reported OSPAQ work sitting time compared with the ActiGraph work sedentary time was underestimated by a mean (SD) of –87 (118) minutes/day (Table 4b, Figure 1B). OSPAQ self-reported work sitting time was significantly less than the objectively measured ActiGraph work sedentary time [t(125)=−8.3, P<0.01] (Table 4b). Furthermore, OSPAQ work sitting time and ActiGraph work sedentary time demonstrated a high level of correlation with rs=0.64, P<0.01 (Table 4b).
Similarly, self-report OSPAQ work standing time when compared with the ActiGraph work light PA time [with mean (SD) values of 123 (91) and 153 (54) minutes/day, respectively] also demonstrated a fair level of agreement (ICC=0.54, P<0.01) (Table 4b). The self-reported OSPAQ work standing time compared with the ActiGraph work light PA time was underestimated by a mean (SD) of –30 (82) minutes/day (Table 4b, Figure 1C). OSPAQ self-reported work standing time was significantly less than the objectively measured ActiGraph work light PA time [t(125)=−4.1, P<0.01] (Table 4b). Furthermore, OSPAQ work standing time and ActiGraph work light PA time demonstrated a high level of correlation with rs=0.57, P<0.01 (Table 4b). The Bland–Altman plots demonstrated that as the amount of time spent in sitting and standing increased, the overall difference between subjective self-report on the OSPAQ and objective ActiGraph time spent in sitting and standing also increased (Figure 1B, C).
Discussion
The main findings of the study were that allied health professionals spent a mean (SD) of 51 (23) minutes in MVPA/day and walked a mean (SD) of 10,077 (2,766) steps/day (Table 2). PA during work hours contributed 76% of the overall recommended total PA requirement for MVPA of 30 minutes/day1,14 and 54% of the daily recommended 10,000 steps/day18 (Table 2). Self-report PA questionnaires for time spent in MVPA when compared with ActiGraph measures of time spent in MVPA revealed only poor to fair levels of agreement between corresponding measurement tools, with higher MVPA on self-report questionnaires compared with ActiGraph measures (Table 4).
Are allied health professionals meeting the recommended guidelines for PA?
The main findings of the study were that allied health professionals spent the majority of their day in sedentary behaviors but were meeting the overall total PA recommendations for MVPA and number of steps/day. Participants spent a mean (SD) of 51 (23) minutes in MVPA/day, which represented 171% of the recommended total PA requirements for MVPA/day1,14 (Table 2). For the group, MVPA/day during work hours contributed a mean of 23 (11) minutes to the overall daily PA, which was 76% of the overall recommended total PA requirements for MVPA/day1,14 (Table 2). Furthermore, 82% (n=103) of allied health participants met the minimum PA MVPA guidelines of ≥30 minutes/day.1,14 A previous study of physiotherapists found that 91% of participants exceeded the minimum recommended PA guidelines reporting greater amounts of time spent in vigorous and walking PA/week.50 Participants in our study walked a mean (SD) of 10,077 (2766) steps/day, which was 100% of the recommended 10,000 steps/day18 (Table 2). The recommended 10,000 steps/day18 was achieved by 46% (n=57) of our sample, with 30% (n=38) walking between 8,000 and 10,000 steps and 25% (n=31) walking <8,000 steps/day. A recent study examining activity levels of healthcare professionals in New Zealand found that 65% of staff were achieving 10,000 steps/day, which was greater than the overall percentage reported in the general population.52
Our study also demonstrated that participants generally exceeded the recommended PA guidelines based on self-report questionnaires (AAS and IPAQ-L) with overall PA levels reported as a mean (SD) of 1,878 (1,436) and 4,311 (3,632) MET minutes/week (METmins/week), respectively (Table 3a and b). Self-reported data from both these questionnaires exceeded the recommended weekly PA levels of ≥600 METmins/week and indicated that the PA levels in our sample were high (ie, ≥1,200 METmins/week).56 This agrees with previous studies using self-report PA questionnaires, which showed that health professionals overall are a physically active group,48,51 with one study reporting that 60% of health professionals reported their PA levels at ≥600 METmins/week.51 Our study demonstrated that 86% and 94% of allied health participants met the minimum PA of ≥600 METmins/week56 on the AAS and IPAQ-L, respectively. Various studies have reported a wide range in the percentage of the general population meeting the recommended PA guidelines with values ranging from 5% to 75%,28,70,75–77 which may reflect differences between the self-report and objective measurement tools. When objective measures using accelerometry were used to evaluate PA, some studies reported that only 5%–10% met the recommended PA guidelines.70,78 Respondents often overestimated their PA levels on self-report questionnaires when compared with objective accelerometry, and this self-reporting bias may be due to social desirability bias where respondents want to appear as if they are adopting healthy lifestyle behaviors.70 Self-report questionnaires are also prone to misreport due to issues with respondent recall and comprehension of questionnaire items.21,79
Contribution of work PA to overall PA levels in allied health professionals
Our results demonstrated that MVPA during work hours contributed to 76% of the overall recommended daily total PA requirement for MVPA and that steps/day during work accounted for 54% of the daily recommended 10,000 steps/day (Table 2). Our results demonstrated that work contributed to a greater amount of the total recommended MVPA and total steps/day in allied health professionals compared with studies examining different occupational sectors.41,53,54 A study conducted in Dutch workers utilizing a cross-sectional survey across various occupational sectors found that the work occupational activity in the health care sector accounted for ~30% of the contribution of work to total PA.53 Studies have demonstrated marked differences in occupational PA across differing occupations and sectors41,53,54,80,81 and the contribution of PA at work to total levels of PA.41,53,54 Occupations that appear to be relatively active may contribute to a greater degree to the overall total PA levels of individuals.54
Sedentary behavior in allied health professionals
Our study found that allied health professionals engaged on average in a mean (SD) 1,117 (61) minutes (18.6 hours) of sedentary time/day (Table 2), which equates to ~10.6 hours of sedentary behavior during waking hours (assuming an average of 8 hours of sleep/night). These results are similar to those of previous studies, which have reported that on average adults spend between 55% and 70% of their day (~9–11 hours/day) in sedentary behaviors.33,34 Furthermore, sedentary time during work hours in our study participants accounted for 336 (61) minutes (5.6 hours)/work day (Table 2). A study examining sedentary time in office workers demonstrated that ~77% of working hours (ie, 6.6 hours) were spent in sedentary behaviors,26 which is similar to the sedentary time at work observed in our study participants. These findings suggest that allied health professionals working in a large health district spend the majority of their time at work in sedentary behaviors despite achieving PA recommendations. This is an important consideration as the detrimental effects of sedentary workplace behaviors have been demonstrated even in adults engaging in MVPA throughout the week.32–34
Use of self-report questionnaires in assessing PA levels in allied health professionals
The self-reported MVPA time in the AAS showed only a fair level of agreement with the total ActiGraph measured MVPA time (Table 4a). The AAS as a tool investigating PA levels has been shown to be subject to less overreport compared with other PA questionnaires such as the IPAQ-L.82 Furthermore, the AAS has been found to have moderate correlation with MVPA levels as measured by accelerometry.82 This is similar to our results (Table 4) and may reflect that fewer items in this questionnaire may lead to less self-reporting error compared with longer questionnaires such as the IPAQ-L.
The self-report IPAQ-L total MVPA time showed no agreement with the total ActiGraph measure of MVPA time (ICC=0.13, P=0.10) (Table 4c). The IPAQ-L has been found to be subject to overreport as assessed against reference accelerometry,83–85 with only a low to moderate level of correlation with corresponding MVPA levels as measured by accelerometry.61,82,86 This is similar to the results observed in our study (Table 4c) and may be the result of the large number of questions that rely on recall of a diverse range of activities over a 1-week period.62 Activities in the IPAQ-L such as walking and other moderate activities tend to occur in small bouts throughout the day making these activities difficult to recall,61,62 with individuals finding it easier to recall more structured forms of activity such as planned, high-intensity activities (eg, organized sports, fitness classes).20,61
Our study demonstrated that allied health professionals underestimated their work sitting and standing when assessed against work sedentary behavior and light PA ActiGraph measurements, respectively (Table 4b), and overestimated the time they spent in occupational walking and heavy labor as assessed against ActiGraph work moderate PA and work ≥ vigorous PA ActiGraph measures, respectively (Table 4b). This has been described in other studies57,59 and highlights respondents’ inability to correctly classify their work activities on self-report questionnaires in relation to the intensity of PA. Workers often perceived they were performing higher levels of PA at work when compared with objective accelerometry measurements.57 The OSPAQ items sitting and standing demonstrated fair levels of agreement with ActiGraph measurements of work sedentary behavior and work light PA time, respectively (ICC=0.51, P<0.01; ICC=0.54, P<0.01, respectively) (Table 4b). There was a very good correlation between self-reported OSPAQ sitting and standing time with corresponding ActiGraph measurements of work sedentary behavior and work light PA time (Table 4b). These results have also been demonstrated in previous studies involving desk-based workers and government/nongovernment organizations and have found moderate validity for estimating time spent sitting and standing at work with lower validity for measuring occupational walking and heavy labor.58,59 This may be because sitting and standing time account for a greater proportion of an individual’s time at work, which may mean less error in recall.57,59 Our study also demonstrated poor levels of agreement between OSPAQ self-reported MVPA and ActiGraph measurements of MVPA at work, and these results may reflect the difficulties of respondents recalling occupational walking and heavy labor tasks, which contribute to MVPA as described in previous studies.58,59
The practical implications of these findings suggest that PA measurements in allied health professionals need to be assessed by accelerometry as self-report PA questionnaires only provide a poor to fair level of agreement when compared with objective measurements. Although allied health professionals are meeting PA recommendations, initiatives to reduce sedentary behavior at work may be of value in facilitating higher levels of PA.
Limitations
There were a number of limitations associated with this study. First, our study may have attracted participation by allied health professionals who were physically active. However, all allied health professionals were encouraged to participate in this study. Furthermore, the use of the ActiGraph may have stimulated participants to be more physically active than usual. Second, the ActiGraph GT1M was a uniaxial accelerometer, which may not have been able to detect movement in all planes and may not have detected some types of activities, eg, upper limb activities, weight training activities, cycling, or swimming activities. Therefore, in some instances, the ActiGraph GT1M may have underrepresented some participant’s PA levels,61,86 which were reported in the IPAQ-L introducing a possible source of measurement error.61
Conclusion
This study demonstrated that allied health professionals working in a large metropolitan health district met the overall total PA recommendations for MVPA and number of steps/day. When measured objectively, PA during work contributed more than half of the recommended steps/day and greater than three-quarters of the recommended daily MVPA. PA questionnaires demonstrated that allied health professionals surpassed the recommended PA levels; however, they should be interpreted with caution due to poor to fair levels of agreement with accelerometry.
Data sharing statement
Due to ethics requirements participant data from this study cannot be shared unless individual ethics approval is obtained from the relevant human research ethics committees.
Acknowledgments
This study used the REDCap data management system, which is supported by NIH/NCRR Colorado CTSI grant number UL1 RR025780. The contents of the study are the authors’ sole responsibility and do not necessarily represent official National Institutes of Health views. We would also like to acknowledge the following people who assisted with this research project: Associate Professor Emmanuel Stamatakis (The University of Sydney), Emalynne So (Psychology CRGH), Anne Tunks (Dementia Advisory Service, SLHD), Amanda Piggott (Physiotherapy RPAH), Avindu Vithanage, Caitlin Mackenzie (Physiotherapy RPAH), Catherine Wickson, Melissa Cain, Lara Fernandez (Occupational Therapy, Home Based Therapy SLHD), Clare Ferguson, Kiah Witney-Cochrane (Nutrition and Dietetics RPAH), Samantha Tkac (Occupational Therapy, Canterbury Hospital), Garry Jones, Sze Chun Ng (Balmain Hospital), Kylie Draper, Sarah Coventry (Speech Pathology, RPAH), June Hee Choi, Ying Lian (Honors students, The University of Sydney).
Disclosure
The authors report no conflicts of interest in this work.
References
World Health Organization. Global recommendations on physical activity for health; 2010. Available from: http://apps.who.int/iris/bitstream/10665/44399/1/9789241599979_eng.pdf:1-58. Accessed January 28, 2018. | ||
Bauman AE, Reis RS, Sallis JF, et al. Correlates of physical activity: why are some people physically active and others not? Lancet. 2012;380(9838):258–271. | ||
Heath GW, Parra DC, Sarmiento OL, et al. Evidence-based intervention in physical activity: lessons from around the world. Lancet. 2012;380(9838):272–281. | ||
Haskell WL, Blair SN, Hill JO. Physical activity: health outcomes and importance for public health policy. Prev Med. 2009;49(4):280–282. | ||
Lee IM, Shiroma EJ, Lobelo F, et al. Effect of physical inactivity on major non-communicable diseases worldwide: an analysis of burden of disease and life expectancy. Lancet. 2012;380(9838):219–229. | ||
Ding D, Lawson KD, Kolbe-Alexander TL, et al. The economic burden of physical inactivity: a global analysis of major non-communicable diseases. Lancet. 2016;388(10051):1311–1324. | ||
Jonsdottir IH, Rödjer L, Hadzibajramovic E, Börjesson M, Ahlborg G. A prospective study of leisure-time physical activity and mental health in Swedish health care workers and social insurance officers. Prev Med. 2010;51(5):373–377. | ||
Wen CP, Wai JP, Tsai MK, et al. Minimum amount of physical activity for reduced mortality and extended life expectancy: a prospective cohort study. Lancet. 2011;378(9798):1244–1253. | ||
Sattelmair J, Pertman J, Ding EL, Kohl HW, Haskell W, Lee IM. Dose response between physical activity and risk of coronary heart disease: a meta-analysis. Circulation. 2011;124(7):789–795. | ||
Schoenborn CA, Stommel M. Adherence to the 2008 adult physical activity guidelines and mortality risk. Am J Prev Med. 2011;40(5):514–521. | ||
Coombes JS, Law J, Lancashire B, Fassett RG. “Exercise is Medicine”: curbing the burden of chronic disease and physical inactivity. Asia Pac J Public Health. 2015;27(2):NP600–NP605. | ||
Medibank Private. The Cost of Physical Inactivity. October 2008. Available from: https://www.medibank.com.au/client/documents/pdfs/the_cost_of_physical_inactivity_08.pdf. Accessed January 24, 2018. | ||
Owen N, Sugiyama T, Eakin EE, Gardiner PA, Tremblay MS, Sallis JF. Adults’ sedentary behavior determinants and interventions. Am J Prev Med. 2011;41(2):189–196. | ||
Haskell WL, Lee IM, Pate RR, et al. Physical activity and public health: updated recommendation for adults from the American College of Sports Medicine and the American Heart Association. Med Sci Sports Exerc. 2007;39(8):1423–1434. | ||
Moore SC, Patel AV, Matthews CE, et al. Leisure time physical activity of moderate to vigorous intensity and mortality: a large pooled cohort analysis. PLoS Med. 2012;9(11):e1001335. | ||
Arem H, Moore SC, Patel A, et al. Leisure time physical activity and mortality: a detailed pooled analysis of the dose-response relationship. JAMA Intern Med. 2015;175(6):959–967. | ||
Marshall SJ, Levy SS, Tudor-Locke CE, et al. Translating physical activity recommendations into a pedometer-based step goal: 3000 steps in 30 minutes. Am J Prev Med. 2009;36(5):410–415. | ||
Tudor-Locke C, Craig CL, Brown WJ, et al. How many steps/day are enough? For adults. Int J Behav Nutr Phys Act. 2011;8(1):79–79. | ||
Tudor-Locke C, Johnson WD, Katzmarzyk PT. Relationship between accelerometer-determined steps/day and other accelerometer outputs in US adults. J Phys Act Health. 2011;8(3):410–419. | ||
Brown WJ, Trost SG, Bauman A, Mummery K, Owen N. Test-retest reliability of four physical activity measures used in population surveys. J Sci Med Sport. 2004;7(2):205–215. | ||
Helmerhorst HJ, Brage S, Warren J, Besson H, Ekelund U. A systematic review of reliability and objective criterion-related validity of physical activity questionnaires. Int J Behav Nutr Phys Act. 2012;9(1):103–103. | ||
Matthews CE, Chen KY, Freedson PS, et al. Amount of time spent in sedentary behaviors in the United States, 2003-2004. Am J Epidemiol. 2008;167(7):875–881. | ||
Brown WJ, Bauman AE, Owen N. Stand up, sit down, keep moving: turning circles in physical activity research? Br J Sports Med. 2009;43(2):86–88. | ||
Chau JY, van der Ploeg HP, Merom D, Chey T, Bauman AE. Cross-sectional associations between occupational and leisure-time sitting, physical activity and obesity in working adults. Prev Med. 2012;54(3–4):195–200. | ||
Thorp AA, Owen N, Neuhaus M, Dunstan DW. Sedentary behaviors and subsequent health outcomes in adults a systematic review of longitudinal studies, 1996-2011. Am J Prev Med. 2011;41(2):207–215. | ||
Thorp AA, Healy GN, Winkler E, et al. Prolonged sedentary time and physical activity in workplace and non-work contexts: a cross-sectional study of office, customer service and call centre employees. Int J Behav Nutr Phys Act. 2012;9:128. | ||
Menai M, Charreire H, Kesse-Guyot E, et al. Determining the association between types of sedentary behaviours and cardiometabolic risk factors: a 6-year longitudinal study of French adults. Diabetes Metab. 2016;42(2):112–121. | ||
Loyen A, Clarke-Cornwell AM, Anderssen SA, et al. Sedentary time and physical activity surveillance through accelerometer pooling in four European countries. Sports Med. 2017;47(7):1421–1435. | ||
Hallal PC, Andersen LB, Bull FC, et al. Global physical activity levels: surveillance progress, pitfalls, and prospects. Lancet. 2012;380(9838):247–257. | ||
Mummery WK, Schofield GM, Steele R, Eakin EG, Brown WJ. Occupational sitting time and overweight and obesity in Australian workers. Am J Prev Med. 2005;29(2):91–97. | ||
van Uffelen JG, Wong J, Chau JY, et al. Occupational sitting and health risks: a systematic review. Am J Prev Med. 2010;39(4):379–388. | ||
van der Ploeg HP, Chey T, Korda RJ, Banks E, Bauman A. Sitting time and all-cause mortality risk in 222 497 Australian adults. Arch Intern Med. 2012;172(6):494–500. | ||
Matthews CE, George SM, Moore SC, et al. Amount of time spent in sedentary behaviors and cause-specific mortality in US adults. Am J Clin Nutr. 2012;95(2):437–445. | ||
Chau JY, Grunseit AC, Chey T, et al. Daily sitting time and all-cause mortality: a meta-analysis. PLoS One. 2013;8(11):e80000. | ||
Chomistek AK, Manson JE, Stefanick ML, et al. Relationship of sedentary behavior and physical activity to incident cardiovascular disease: results from the Women’s Health Initiative. J Am Coll Cardiol. 2013;61(23):2346–2354. | ||
Stamatakis E, Chau JY, Pedisic Z, et al. Are sitting occupations associated with increased all-cause, cancer, and cardiovascular disease mortality risk? A pooled analysis of seven British population cohorts. PLoS One. 2013;8(9):e73753. | ||
Garcia LM, da Silva KS, del Duca GF, da Costa FF, Nahas MV. Sedentary behaviors, leisure-time physical inactivity, and chronic diseases in Brazilian workers: a cross sectional study. J Phys Act Health. 2014;11(8):1622–1634. | ||
Bjørk Petersen C, Bauman A, Grønbæk M, Wulff Helge J, Thygesen LC, Tolstrup JS. Total sitting time and risk of myocardial infarction, coronary heart disease and all-cause mortality in a prospective cohort of Danish adults. Int J Behav Nutr Phys Act. 2014;11(1):13. | ||
Biddle SJ. Sedentary behavior. Am J Prev Med. 2007;33(6):502–504. | ||
Proper KI, Singh AS, van Mechelen W, Chinapaw MJ. Sedentary behaviors and health outcomes among adults: a systematic review of prospective studies. Am J Prev Med. 2011;40(2):174–182. | ||
Jans MP, Proper KI, Hildebrandt VH. Sedentary behavior in Dutch workers: differences between occupations and business sectors. Am J Prev Med. 2007;33(6):450–454. | ||
Owen N, Healy GN, Matthews CE, Dunstan DW. Too much sitting: the population health science of sedentary behavior. Exerc Sport Sci Rev. 2010;38(3):105–113. | ||
Loyen A, van der Ploeg HP, Bauman A, Brug J, Lakerveld J. European sitting championship: prevalence and correlates of self-reported sitting time in the 28 European Union member states. PLoS One. 2016;11(3):e0149320. | ||
Kirk MA, Rhodes RE. Occupation correlates of adults’ participation in leisure-time physical activity: a systematic review. Am J Prev Med. 2011;40(4):476–485. | ||
Jaka MM, Haapala JL, Wolfson J, French SA. Describing the relationship between occupational and non-occupational physical activity using objective measurement. Prev Med Rep. 2015;2:213–217. | ||
Dayoub E, Jena AB. Chronic disease prevalence and healthy lifestyle behaviors among US health care professionals. Mayo Clin Proc. 2015;90(12):1659–1662. | ||
Florindo AA, Brownson RC, Mielke GI, et al. Association of knowledge, preventive counseling and personal health behaviors on physical activity and consumption of fruits or vegetables in community health workers. BMC Public Health. 2015;15:344. | ||
Atan T, Tural E, Imamoglu O, Cicek G, Tural S. Physical activity levels of teachers and health professionals in Turkey. HealthMED. 2012;6(6):1935–1942. | ||
Arvidson E, Börjesson M, Ahlborg G, Lindegård A, Jonsdottir IH. The level of leisure time physical activity is associated with work ability-a cross sectional and prospective study of health care workers. BMC Public Health. 2013;13:855. | ||
Mcphail SM, Waite MC. Physical activity and health-related quality of life among physiotherapists: a cross sectional survey in an Australian hospital and health service. J Occup Med Toxicol. 2014;9(1):1. | ||
Kunene SH, Taukobong NP. Level of physical activity of health professionals in a district hospital in KwaZulu-Natal, South Africa. S Afr J Physiother. 2015;71(1):6. | ||
Chan L, Mcnaughton H, Weatherall M. Are physical activity levels of health care professionals consistent with activity guidelines? A prospective cohort study in New Zealand. JRSM Cardiovasc Dis. 2018;7:204800401774901. | ||
Proper KI, Hildebrandt VH. Physical activity among Dutch workers--differences between occupations. Prev Med. 2006;43(1):42–45. | ||
Steeves JA, Tudor-Locke C, Murphy RA, King GA, Fitzhugh EC, Harris TB. Classification of occupational activity categories using accelerometry: NHANES 2003-2004. Int J Behav Nutr Phys Act. 2015;12:89. | ||
Sealed Envelope Ltd. Power calculator for continuous outcome non-inferiority trial. [Online]; 2012. Available from: https://www.sealedenvelope.com/power/continuous-noninferior/. Accessed April 20, 2016. | ||
Brown WJ, Burton NW, Marshall AL, Miller YD. Reliability and validity of a modified self-administered version of the Active Australia physical activity survey in a sample of mid-age women. Aust N Z J Public Health. 2008;32(6):535–541. | ||
Reis JP, Dubose KD, Ainsworth BE, Macera CA, Yore MM. Reliability and validity of the occupational physical activity questionnaire. Med Sci Sports Exerc. 2005;37(12):2075–2083. | ||
Chau JY, van der Ploeg HP, Dunn S, Kurko J, Bauman AE. Validity of the occupational sitting and physical activity questionnaire. Med Sci Sports Exerc. 2012;44(1):118–125. | ||
Pedersen SJ, Kitic CM, Bird ML, Mainsbridge CP, Cooley PD. Is self-reporting workplace activity worthwhile? Validity and reliability of occupational sitting and physical activity questionnaire in desk-based workers. BMC Public Health. 2016;16(1):836. | ||
Craig CL, Marshall AL, Sjöström M, et al. International physical activity questionnaire: 12-country reliability and validity. Med Sci Sports Exerc. 2003;35(8):1381–1395. | ||
Hagströmer M, Oja P, Sjöström M. The International Physical Activity Questionnaire (IPAQ): a study of concurrent and construct validity. Public Health Nutr. 2006;9(6):755–762. | ||
Kim Y, Park I, Kang M. Convergent validity of the International Physical Activity Questionnaire (IPAQ): meta-analysis. Public Health Nutr. 2013;16(3):440–452. | ||
John D, Freedson P. ActiGraph and Actical physical activity monitors: a peek under the hood. Med Sci Sports Exerc. 2012;44(1 Suppl 1):S86–89. | ||
Kozey SL, Staudenmayer JW, Troiano RP, Freedson PS. Comparison of the ActiGraph 7164 and the ActiGraph GT1M during self-paced locomotion. Med Sci Sports Exerc. 2010;42(5):971–976. | ||
Silva P, Mota J, Esliger D, Welk G. Technical reliability assessment of the actigraph GT1M accelerometer. Meas Phys Educ Exerc Sci. 2010;14(2):79–91. | ||
Lee KY, Macfarlane DJ, Cerin E. Comparison of three models of actigraph accelerometers during free living and controlled laboratory conditions. Eur J Sport Sci. 2013;13(3):332–339. | ||
Freedson PS, Melanson E, Sirard J. Calibration of the computer science and applications, inc. accelerometer. Med Sci Sports Exerc. 1998;30(5):777–781. | ||
Norton K, Norton L, Sadgrove D. Position statement on physical activity and exercise intensity terminology. J Sci Med Sport. 2010;13(5):496–502. | ||
Mâsse LC, Fuemmeler BF, Anderson CB, et al. Accelerometer data reduction: a comparison of four reduction algorithms on select outcome variables. Med Sci Sports Exerc. 2005;37(11 Suppl):S544–S554. | ||
Troiano RP, Berrigan D, Dodd KW, Mâsse LC, Tilert T, Mcdowell M. Physical activity in the United States measured by accelerometer. Med Sci Sports Exerc. 2008;40(1):181–188. | ||
Hart TL, Swartz AM, Cashin SE, Strath SJ. How many days of monitoring predict physical activity and sedentary behaviour in older adults? Int J Behav Nutr Phys Act. 2011;8:62. | ||
Harris PA, Taylor R, Thielke R, Payne J, Gonzalez N, Conde JG. Research electronic data capture (REDCap) – a metadata-driven methodology and workflow process for providing translational research informatics support. J Biomed Inform. 2009;42(2):377–381. | ||
Streiner DL, Norman GR, Cairney J. Health Measurement Scales: A Practical Guide to Their Development and Use. 5th ed. Oxford: Oxford University Press; 2014. | ||
Cohen J. A power primer. Psychol Bull. 1992;112(1):155–159. | ||
Gerovasili V, Agaku IT, Vardavas CI, Filippidis FT. Levels of physical activity among adults 18-64 years old in 28 European countries. Prev Med. 2015;81:87–91. | ||
Marques A, Sarmento H, Martins J, Saboga Nunes L. Prevalence of physical activity in European adults - compliance with the World Health Organization’s physical activity guidelines. Prev Med. 2015;81:333–338. | ||
Katzmarzyk PT, Lee IM, Martin CK, Blair SN. Epidemiology of physical activity and exercise training in the United States. Prog Cardiovasc Dis. 2017;60(1):3–10. | ||
Tucker JM, Welk GJ, Beyler NK. Physical activity in U.S.: adults compliance with the physical activity guidelines for Americans. Am J Prev Med. 2011;40(4):454–461. | ||
Skender S, Ose J, Chang-Claude J, et al. Accelerometry and physical activity questionnaires - a systematic review. BMC Public Health. 2016;16(1):515. | ||
Brighenti-Zogg S, Mundwiler J, Schüpbach U, et al. Physical workload and work capacity across occupational groups. PLoS One. 2016;11(5):e0154073. | ||
Deyaert J, Harms T, Weenas D, Gershuny J, Glorieux I. Attaching metabolic expenditures to standard occupational classification systems: perspectives from time-use research. BMC Public Health. 2017;17(1):620. | ||
Timperio A, Salmon J, Rosenberg M, Bull FC. Do logbooks influence recall of physical activity in validation studies? Med Sci Sports Exerc. 2004;36(7):1181–1186. | ||
Macfarlane DJ, Lee CC, Ho EY, Chan KL, Chan D. Convergent validity of six methods to assess physical activity in daily life. J Appl Physiol. 2006;101(5):1328–1334. | ||
Cerin E, Cain KL, Oyeyemi AL, et al. Correlates of agreement between accelerometry and self-reported physical activity. Med Sci Sports Exerc. 2016;48(6):1075–1084. | ||
Wanner M, Probst-Hensch N, Kriemler S, Meier F, Autenrieth C, Martin BW. Validation of the long international physical activity questionnaire: influence of age and language region. Prev Med Rep. 2016;3:250–256. | ||
Hagstromer M, Ainsworth BE, Oja P, Sjostrom M. Comparison of a subjective and an objective measure of physical activity in a population sample. J Phys Act Health. 2010;7(4):541–550. |
 © 2019 The Author(s). This work is published and licensed by Dove Medical Press Limited. The full terms of this license are available at https://www.dovepress.com/terms.php and incorporate the Creative Commons Attribution - Non Commercial (unported, v3.0) License.
By accessing the work you hereby accept the Terms. Non-commercial uses of the work are permitted without any further permission from Dove Medical Press Limited, provided the work is properly attributed. For permission for commercial use of this work, please see paragraphs 4.2 and 5 of our Terms.
© 2019 The Author(s). This work is published and licensed by Dove Medical Press Limited. The full terms of this license are available at https://www.dovepress.com/terms.php and incorporate the Creative Commons Attribution - Non Commercial (unported, v3.0) License.
By accessing the work you hereby accept the Terms. Non-commercial uses of the work are permitted without any further permission from Dove Medical Press Limited, provided the work is properly attributed. For permission for commercial use of this work, please see paragraphs 4.2 and 5 of our Terms.