Back to Journals » Infection and Drug Resistance » Volume 11
Performance of computed tomography versus chest radiography in patients with pulmonary tuberculosis with and without diabetes at a tertiary hospital in Riyadh, Saudi Arabia
Authors Alkabab YM ![]() , Enani MA
, Enani MA ![]() , Indarkiri NY, Heysell SK
, Indarkiri NY, Heysell SK
Received 16 September 2017
Accepted for publication 21 November 2017
Published 3 January 2018 Volume 2018:11 Pages 37—43
DOI https://doi.org/10.2147/IDR.S151844
Checked for plagiarism Yes
Review by Single anonymous peer review
Peer reviewer comments 2
Editor who approved publication: Dr Eric Nulens
Yosra M Alkabab,1 Mushira A Enani,2 Nouf Y Indarkiri,3 Scott K Heysell1
1Department of Medicine, Division of Infectious Diseases and International Health, University of Virginia, Charlottesville, VA, USA; 2Department of Infectious Diseases, King Fahad Medical City, 3Department of Family Medicine, Prince Sultan Military Medical City, Riyadh, Saudi Arabia
Background: Prior research suggests that diabetes mellitus (DM) is associated with increasing risk for developing cavitary lung disease in patients with pulmonary tuberculosis (TB). Additionally, chest computed tomography (CT) scan may be more sensitive than chest X-ray in detecting cavitary disease in such patients. The aim of this study was to compare the performance of chest CT to chest X-ray in detecting cavitary lung disease and to compare the frequency of cavities between TB patients with DM and without DM.
Patients and methods: We conducted a retrospective cohort study at King Fahad Medical City, Riyadh, Saudi Arabia, from January 2004 to December 2015. We included patients aged 18 years and older with a positive sputum culture for Mycobacterium tuberculosis, and their medical charts were reviewed from admission to discharge.
Results: Of the 133 patients who met the inclusion criteria, 38 (28.6%) patients were known to have DM and were compared with 95 (71.4%) patients without DM. DM patients with glycated hemoglobin (HbA1c) >6.5% had significantly more cavitary lesions when compared to all patients (with or without DM) with HbA1c <6.4% and/or random blood sugar <200 mg/dL. Furthermore, CT was able to detect lung cavities in 58.8% of the patients who had negative chest X-ray findings for cavities.
Conclusion: The presence of lung cavities was significantly associated with the presence of DM and levels of HbA1c in patients with pulmonary TB. CT scan in those with normal radiography increased the detection of cavities.
Keywords: diabetes, pulmonary tuberculosis, lung cavities, computed tomography
Introduction
The association between tuberculosis (TB) and diabetes mellitus (DM) has been described as co-epidemic. With the increasing rates of diabetes prevalence worldwide especially in countries with high burdens of TB, it is estimated that the number of individuals with both TB and DM will increase dramatically in the upcoming years.1 Patients with DM are at greater risk for developing active TB,2,3 with the largest meta-analysis to date demonstrating that diabetic patients are 3.1 times more likely to develop TB than patients without diabetes.3 DM not only increases the risk of TB infection but also contributes to increased severity and poor treatment outcomes.4 When adjusting for comorbid conditions, DM patients are more likely to have higher rates of complications of TB treatment, such as prolonged sputum culture conversion, risk of relapse after treatment completion, and death.5,6
Saudi Arabia is one of the top 10 countries worldwide for the highest age-adjusted prevalence of DM with 24% of the population estimated as living with DM.7 In 2015, the total number of new cases of pulmonary TB in Saudi Arabia was 2,505. Of the country’s 20 regions, Riyadh region is the most populous and has a TB incidence rate of 7.41 cases/100,000.8 Despite the co-prevalence of DM and TB in Saudi Arabia, comparative studies of TB individuals with and without DM are limited. For instance, one study from Sahary Hospital in Riyadh examined a cohort of TB patients admitted between 1998 and 1999; DM was significantly associated with persistent sputum positivity after 2 months of treatment, and regression analysis found that age and disease burden (number of bacilli in pretreatment sputum and cavitary lung disease by chest X-ray) were the overall dominant predictors of delayed microbiological response to treatment.9 Since the time of that study, and in important contrast to other TB endemic settings, diagnosis and management of TB in Riyadh have increasingly involved the use of chest computed tomography (CT) scan. Relatedly, guidelines suggest extended treatment duration to 9 months for drug-susceptible TB in patients who fail to convert their sputum to negative at 2 months, particularly in those with cavitary lung disease or comorbid conditions such as DM.10 In some studies, DM has been associated with higher rates of cavitary disease as compared with patients without diabetes.11,12 Additionally, chest CT scan may be more sensitive for detecting cavitary lung disease in TB patients than conventional chest X-ray.
We therefore sought to study the performance of chest CT compared to X-ray for detecting cavitary lung disease and whether cavities were more common in patients with DM–TB than in patients without DM–TB. A single-center retrospective cohort study was undertaken at a large referral hospital in the central region of Saudi Arabia, given the routine screening for DM among all TB patients and the access to chest CT findings.
Patients and methods
Subjects
A retrospective cohort analysis was performed among patients who were diagnosed with culture-positive pulmonary TB during January 1, 2004 (the operational date of the hospital) to December 31, 2015, in King Fahad Medical City, Riyadh, Saudi Arabia. Data were collected from all patients aged ≥18 years with a positive sputum culture for Mycobacterium tuberculosis.
Data collection and statistics
In patients meeting the above criteria, a detailed and systematic chart review was performed in the medical records for demographics (age and gender), prior TB history including prior TB treatment regimens, site of TB disease (pulmonary, central nervous system, lymph node, bone/joint, genitourinary, or others), medical comorbidities (DM, HIV, chronic kidney disease, liver disease, smoking, alcohol, or injection drug use), current chest X-ray or CT abnormalities, and baseline laboratory values including complete blood counts, chemistries, random blood sugar (RBS), liver function tests, erythrocyte sedimentation rate (ESR), glycated hemoglobin (HbA1c) on pre- and post-TB therapy, and CD4+ cell count if HIV infected. All medications were documented including anti-DM medications.
Patients were categorized into the following two groups: patients with DM and patients without DM. DM status was documented based on chart diagnosis and corroborated with laboratory values. Clinical outcomes were defined as the presence of cavities detected by CT scan. We examined the distribution of our data for skewness. We used univariate analysis to describe the sample characteristics by presenting mean and standard deviation (SD) for normally distributed continuous measures, median and interquartile ranges (IQR) for continuous measures that were not normally distributed, and frequencies and percentages for categorical measures. We also used Student’s t-test or Kruskal–Wallis test to compare mean or median, respectively, and chi-square tests to compare proportions between DM patients and non-DM patients, as well as patients with cavities and without cavities. All tests of significance were two sided, and we set the a level to 0.05. All statistical analyses were performed using SPSS 24.0 (IBM Corporation, Armonk, NY, USA).
Ethical approval
The protocol was approved by the Ethical Review Committee at King Fahad Medical City and the University of Virginia, and written consent was waived by the Ethical Review Committee, as the majority of subjects were previously discharged and unavailable to be contacted. Moreover, as data were deidentified, patient confidentiality was maintained.
Results
During the study period, a total of 133 patients with positive sputum culture for M. tuberculosis were detected from the medical charts available for review. Of the 133 patients, 38 (28.6%) patients were known to have DM and 95 (71.4%) patients did not have DM. Gender distribution, extrapulmonary infection, and the proportion of individuals with positive sputum smear results prior to treatment initiation were similar in both DM and non-DM groups (Table 1). DM patients were older than non-DM patients with the mean age of 58±18 vs 41±22 years, respectively (P<0.01). Twenty of the 29 (68.9%) patients with diabetes were older than 60 years. In addition, patients with DM had more pulmonary cavities than patients without DM (17 [44.7%] vs 23 [24.2%], respectively, P=0.02). As expected, DM patients had a higher median RBS level than non-DM patients (198.0 mg/dL [144.0–288.0] vs 95.4 mg/dL [86.4–109.8], P<0.01). Thirty-one (81%) DM patients had HbA1c levels >6.5% with a median level of 7.9% (7.2–11.0). Six patients with undocumented DM had HbA1c levels tested; five patients were found to be prediabetic (HbA1c 5.7–6.4%), but chart review did not reveal the indication for requesting HbA1c, and none were started on anti-DM treatment. Ultimately, 18 (50.0%) DM patients were started on insulin, 10 (23.0%) on metformin, and three (8.3%) on other oral hypoglycemic agents.
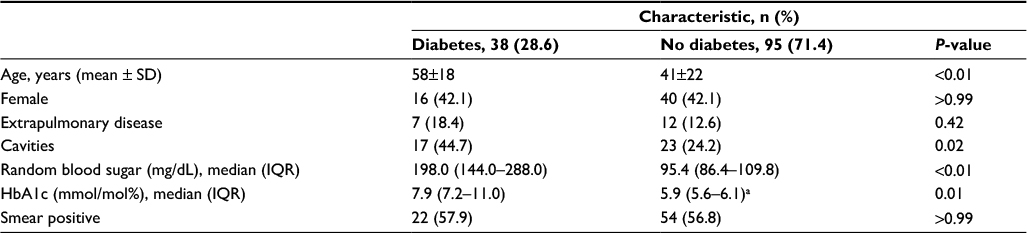 | Table 1 Patients’ demographics Note: aSix patients had HbA1c levels tested once during admission, and no documentation was noted for the indication. Abbreviations: HbA1c, glycated hemoglobin; IQR, interquartile range; SD, standard deviation. |
We compared patients with cavities (40 [30.1% of total population]) detected by any radiography method with patients with no cavities (93 [69.9%]) and found no significant difference between the two groups with regard to gender or presence of extrapulmonary disease. However, patients with cavitary disease (31 [42.5%]) were more likely to have baseline sputum smear positivity than patients without cavitary disease (45 [48.4%], P<0.01, Table 2). Additionally, the prevalence of DM was significantly greater in patients with cavities (17 [42.5%]) than in patients without cavities (21 [22.6%], P=0.02, Table 2). When patients with HbA1c testing were examined alone, in 40 patients who had cavities, the median HbA1c level was 8.2% (7.1–12.0) pretreatment (Figure 1). We did not have enough data to find a significant difference in median HbA1c between patients with cavities and patients without cavities. However, the proportion of cavities was significantly greater in patients with HbA1c >6.5% (16 [52.0%]) than in those with both HbA1c <6.4% and/or RBS <200 mg/dL (24 [27.0%], P=0.03).
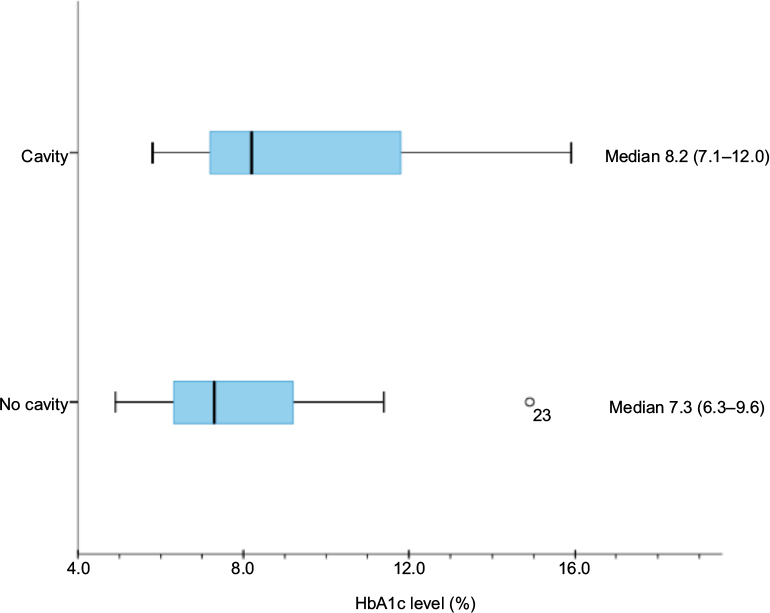 | Figure 1 Median HbA1c level (%) for patients with and without cavities. Abbreviation: HbA1c, glycated hemoglobin. |
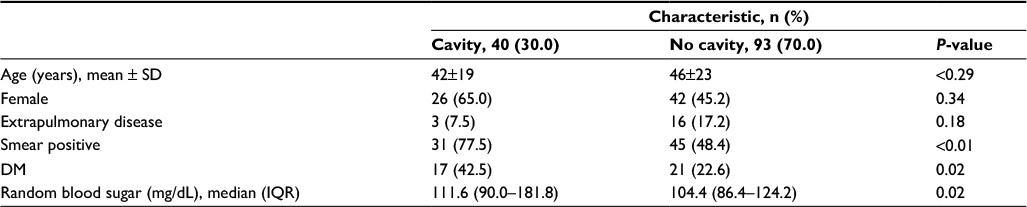 | Table 2 Characteristics of patients with and without cavities Abbreviations: DM, diabetes mellitus; IQR, interquartile range; SD, standard deviation. |
We then performed a sub-analysis in 38 patients with DM to observe the prevalence of cavities in this group. Somewhat surprisingly, those with cavitary disease were significantly younger (mean age =50 years, SD =15) compared to those without cavitary disease (mean age =64, SD =17, P=0.01, Table 3). The median HbA1c was also greater in patients with cavitary disease than in those without cavitary disease (P=0.20, Table 3).
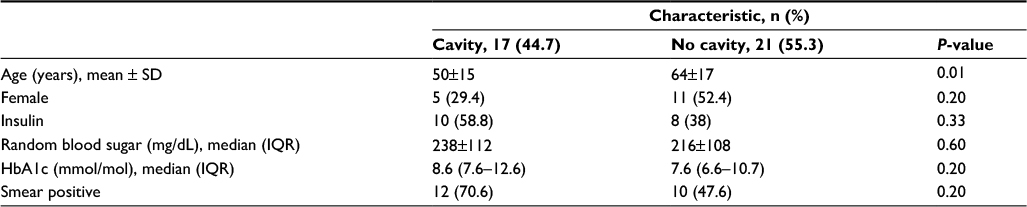 | Table 3 DM patients’ characteristics among those with and without cavities Abbreviations: DM, diabetes mellitus; HbA1c, glycated hemoglobin; IQR, interquartile range; SD, standard deviation. |
We analyzed 36 patients who had radiological evidence of cavitary lesions and who underwent both chest CT and X-ray. Of these patients, 21 (58.3%) patients had negative X-ray but positive CT for cavities (Table 4). Figures 2 and 3 are the examples of a patient with a negative X-ray and positive CT scan for a cavitary lesion.
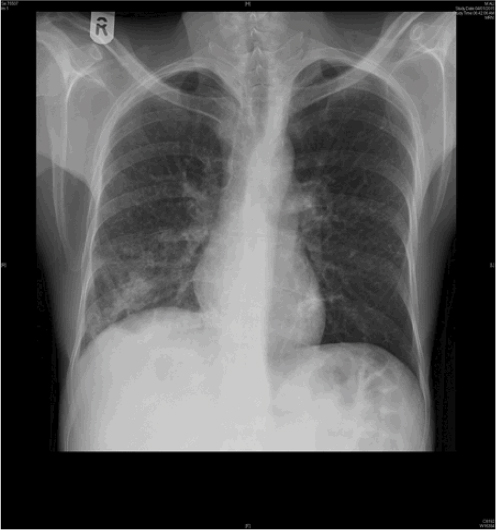 | Figure 2 Chest X-ray originally read as no clear evidence of cavity. |
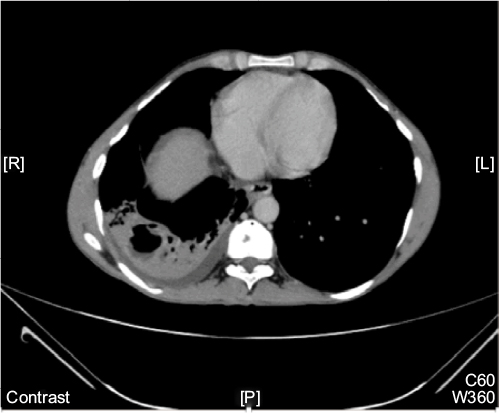 | Figure 3 CT chest of the same patient in Figure 2 with evidence of cavity. Abbreviation: CT, computed tomography |
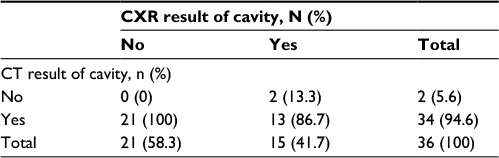 | Table 4 All patients who received both CT and CXR with radiological evidence of cavity Abbreviations: CT, computed tomography; CXR, chest X-ray. |
Of the 38 patients with DM, only 12 patients had HbA1c levels measured before and after treatment, but in these patients, there was a statistically significant improvement in HbA1c following anti-TB treatment (P<0.01) (Figure 4). Regarding the time for smear conversion in days, there was a wide range of reporting yet no significant differences were found between the DM and non-DM patients (31±27 vs 27±34 days; P=0.69). In addition, there were no follow-up data on 67 patients. Of those with traceable outcome, 36 (94.7% of all DM) patients were with DM. Of the 36 patients with DM, only one patient died, four patients were lost to follow-up after completing some duration of treatment, and 31 patients were cured. Importantly, however, all patients received a total duration of 9-months’ therapy when cavities were detected via imaging.
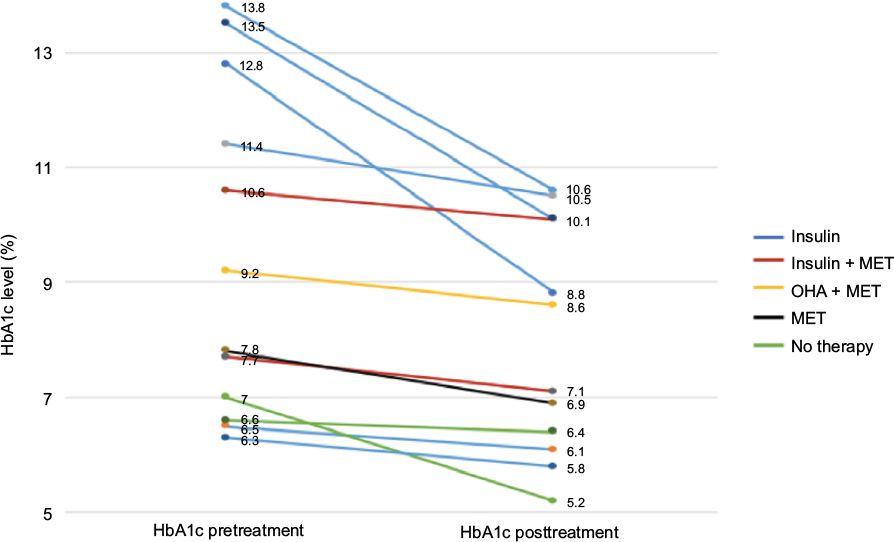 | Figure 4 Patients with diabetes’ HbA1c levels pre- and post-TB treatment. Abbreviations: HbA1c, glycated hemoglobin; MET, metformin; OHA, oral hypoglycemic agents; TB, tuberculosis. |
Discussion
In the present study, patients with pulmonary TB infection who had DM had more pulmonary cavities than patients without DM. In addition, diabetes patients with HbA1c >6.5% were significantly more likely to have cavitary lesions than all patients (with or without DM) with HbA1c <6.4% and/or RBS <200 mg/dL. Importantly, our results also demonstrated that CT was able to detect lung cavities in more than half (58.3%) of the patients who were not reported to have a cavity by chest X-ray.
Several studies have suggested that patients with pulmonary TB and DM are more likely to have cavitary lung disease than patients without DM.12–15 However, other studies could not demonstrate this association.16–18 In our study, the prevalence of lung cavities was significantly greater in DM, but we believe that the enhanced detection by CT led to this stronger association. Similar to past research, the degree of hyperglycemia was also associated with the presence of lung cavities.11 Our findings align with those by Chiang et al,19 who found the relative risk of cavitary disease increased with the higher HbA1c, reporting that when compared with patients without DM, the risk for cavitary disease is 0.87 (relative risk [RR] =0.87, 95% CI =0.46–1.62) for patients with DM with HbA1c <7%, 1.84 (95% CI 1.20–2.84) for patients with DM with HbA1c 7–9%, and 3.71 (95% CI 2.64–5.22) for patients with DM with HbA1c >9%.
Similarly, chest X-ray has been read as normal in 10–15% of symptomatic patients with later biopsy-proven infiltrative lung disease.20 Other studies show that CT scan of the chest is a reliable diagnostic tool to detect and assess lung parenchymal diseases in pulmonary TB with a sensitivity of 97% and a specificity of 86.7%, yielding a positive predictive value of 94.2% and a negative predictive value of 97%.21,22 In our study of patients from Riyadh, more than half of those with cavities proven by CT scan had normal chest X-ray, with direct clinical implications on the duration of TB treatment. Common practice in Riyadh advises clinicians to treat TB patients with cavities visible by CT scan for 9 months. While our analyses were not designed to examine the effect of treatment duration on outcome, patients with cavitary disease had favorable outcomes. While CT scan may be of less importance relative to improving other resources and infrastructure in TB endemic areas, our findings suggest that in settings with access to CT scan, routine utilization may alter management. Such individualization of treatment duration may be particularly important in DM/TB patients for whom relapse and treatment failure are of greater concern.14,23
Several limitations for our study should be noted. First, because data were collected from hospital charts, there was limited information about historical features that were relevant to this study and may be related to the inadequacy of chart documentation (eg, immunosuppressing conditions, smoking history, alcohol use, and illicit drug use). We were unable to follow-up patients through their visits to primary health clinics within the city or their later treatment outcomes. The temporal association between the development of DM and the development of TB was also not assessed. Second, during TB treatment, not all patients had documentation of changes in DM therapy, or if they had received HbA1c testing during or after completing TB therapy. Third, because routine sputum cultures were not taken during treatment, we were not able to make associations about the effect of DM treatment on TB disease outcome, as has been suggested with emerging reports of independent tuberculocidal effects of the anti-DM medication metformin.24 Finally, it did not become routine practice for all the patients to receive CT scans until the later years of the study, limiting the comparison of all chest X-rays to CT imaging.
Given that the treatment of TB in patients with DM likely requires special considerations, our findings suggest that chest CT scan should be prospectively evaluated among other mechanisms to individualize therapy. For instance, in some settings, slow response to TB therapy has been attributed to suboptimal pharmacokinetics, which may be more important in the DM host with an already higher microbiological burden or uncoordinated immune response.25–27 The use of therapeutic drug monitoring early in the TB treatment course for patients with DM to dose adjust the first-line anti-TB drugs has in at least one programmatic setting been found to hasten the microbiological clearance of cultured M. tuberculosis from the sputum.28,29 Therefore, undertaking a prospective study of pharmacokinetics and dose adjustment of anti-TB medication in DM/TB compared to non-DM/TB may be particularly important for those patients with cavitary disease
Conclusion
The presence of lung cavities was significantly associated with the presence of DM and the level of HbA1c in pulmonary TB patients. CT scanning especially in those with normal radiography increases the frequency of detecting cavities. These findings may be important to determine the optimal diagnostic approach in DM/TB endemic areas, such as Saudi Arabia, with access to CT scanners and whether such enhanced cavitary detection should signal an intensification or prolongation of TB or DM treatment.
Acknowledgment
Dr Alkabab was supported by a Clinical Research Seed Grant from the Division of Infectious Diseases, University of Virginia. The work was not supported or funded by any drug company.
Disclosure
The authors report no conflicts of interest in this work.
References
Dooley KE, Chaisson RE. Tuberculosis and diabetes mellitus: convergence of two epidemics. Lancet Infect Dis. 2009;9(12):737–746. | ||
Stevenson CR, Forouhi NG, Roglic G, et al. Diabetes and tuberculosis: the impact of the diabetes epidemic on tuberculosis incidence. BMC Public Health. 2007;7:234. | ||
Jeon CY, Murray MB. Diabetes mellitus increases the risk of active tuberculosis: a systematic review of 13 observational studies. PLoS Med. 2008;5(8):1298. | ||
Alisjahbana B, Sahiratmadja E, Nelwan EJ, et al. The effect of type 2 diabetes mellitus on the presentation and treatment response of pulmonary tuberculosis. Clin Infect Dis. 2007;45(4):428–435. | ||
Dooley KE, Tang T, Golub JE, Dorman SE, Cronin W. Impact of diabetes mellitus on treatment outcomes of patients with active tuberculosis. Am J Trop Med Hyg. 2009;80(4):634–639. | ||
Baker MA, Harries AD, Jeon CY, et al. The impact of diabetes on tuberculosis treatment outcomes: a systematic review. BMC Med. 2011;9:81. | ||
International Diabetes Federation [webpage on the Internet]. IDF Diabetes Atlas: Eighth Edition. Brussels, Belgium; 2013. Available from: http://www.idf.org/diabetesatlas. Accessed November 23, 2017. | ||
Ministry of Health Saudi Arabia. Statistical Book for the Year 1436. Riyadh; 2015. Available from: http://www.moh.gov.sa/en/Ministry/Statistics/book/Documents/StatisticalBook-1436.pdf. Accessed November 23, 2017. | ||
Singla R, Khan N, Al-Sharif N, Ai-Sayegh MO, Shaikh MA, Osman MM. Influence of diabetes on manifestations and treatment outcome of pulmonary TB patients. Int J Tuberc Lung Dis. 2006;10(1):74–79. | ||
Nahid P, Dorman SE, Alipanah N, et al. Official American Thoracic Society/Centers for Disease Control and Prevention/Infectious Diseases Society of America Clinical Practice Guidelines: treatment of drug-susceptible tuberculosis. Clin Infect Dis. 2016;63(7):e147–e195. | ||
Park SW, Shin JW, Kim JY, et al. The effect of diabetic control status on the clinical features of pulmonary tuberculosis. Eur J Clin Microbiol Infect Dis. 2012;31(7):1305–1310. | ||
Pérez-Guzmán C, Torres-Cruz A, Villarreal-Velarde H, Salazar-Lezama MA, Vargas MH. Atypical radiological images of pulmonary tuberculosis in 192 diabetic patients: a comparative study. Int J Tuberc Lung Dis. 2001;5(5):455–461. | ||
Nakamura A, Hagiwara E, Hamai J, Taguri M, Terauchi Y. Impact of underlying diabetes and presence of lung cavities on treatment outcomes in patients with pulmonary tuberculosis. Diabet Med. 2014;31(6):707–713. | ||
Jiménez-Corona ME, Cruz-Hervert LP, García-García L, et al. Association of diabetes and tuberculosis: impact on treatment and post-treatment outcomes. Thorax. 2013;68(3):214–220. | ||
Zhang L, Pang Y, Yu X, et al. Risk factors for pulmonary cavitation in tuberculosis patients from China. Emerg Microbes Infect. 2016;5(10):e110. | ||
Morris JT, Seaworth BJ, McAllister CK. Pulmonary tuberculosis in diabetics. Chest. 1992;102(2):539–541. | ||
Bacakoğlu F, Başoğlu ÖK, Çok G, Sayıner A, Ateş M. Pulmonary tuberculosis in patients with diabetes mellitus. Respiration. 2001;68(6):595–600. | ||
Kim J, Lee IJ, Kim JH. CT findings of pulmonary tuberculosis and tuberculous pleurisy in diabetes mellitus patients. Diagnostic Interv Radiol. 2017;23(2):112–117. | ||
Chiang CY, Lee JJ, Chien ST, et al. Glycemic control and radiographic manifestations of tuberculosis in diabetic patients. PLoS One. 2014;9(4):e93397. | ||
Epler GR, McLoud TC, Gaensler EA, Mikus JP, Carrington CB. Normal chest roentgenograms in chronic diffuse infiltrative lung disease. N Engl J Med. 1978;298(17):934–939. | ||
Balkan A, Balci E, Yüksekol I, et al. [The role of high resolution computerized tomography (HRCT) in the diagnosis and treatment of pulmonary tuberculosis]. Tuberk Toraks. 2004;52(1):38–46. Turkish. | ||
Franquet T. Imaging of pneumonia: trends and algorithms. Eur Respir J. 2001;18(1):196–208. | ||
Chiang CY, Bai KJ, Lin HH, et al. The influence of diabetes, glycemic control, and diabetes-related comorbidities on pulmonary tuberculosis. PLoS One. 2015;10(3):e0121698. | ||
Singhal A, Jie L, Kumar P, et al. Metformin as adjunct antituberculosis therapy. Sci Transl Med. 2014;6(263):263ra159. | ||
Nijland HM, Ruslami R, Stalenhoef JE, et al. Exposure to rifampicin is strongly reduced in patients with tuberculosis and type 2 diabetes. Clin Infect Dis. 2006;43(7):848–854. | ||
Chang MJ, Chae J, Yun H, et al. Effects of type 2 diabetes mellitus on the population pharmacokinetics of rifampin in tuberculosis patients. Tuberculosis. 2015;95(1):54–59. | ||
Babalik A, Ulus IH, Bakirci N, et al. Plasma concentrations of isoniazid and rifampin are decreased in adult pulmonary tuberculosis patients with diabetes mellitus. Antimicrob Agents Chemother. 2013;57(11):5740–5742. | ||
Alkabab Y, Keller S, Dodge D, Houpt E, Staley D, Heysell S. Early interventions for diabetes related tuberculosis associate with hastened sputum microbiological clearance in Virginia, USA. BMC Infect Dis. 2017;17(1):125. | ||
Heysell SK, Moore JL, Staley D, Dodge D, Houpt ER. Early therapeutic drug monitoring for isoniazid and rifampin among diabetics with newly diagnosed tuberculosis in Virginia, USA. Tuberc Res Treat. 2013;2013:129723. |
 © 2018 The Author(s). This work is published and licensed by Dove Medical Press Limited. The
full terms of this license are available at https://www.dovepress.com/terms
and incorporate the Creative Commons Attribution
- Non Commercial (unported, 3.0) License.
By accessing the work you hereby accept the Terms. Non-commercial uses of the work are permitted
without any further permission from Dove Medical Press Limited, provided the work is properly
attributed. For permission for commercial use of this work, please see paragraphs 4.2 and 5 of our Terms.
© 2018 The Author(s). This work is published and licensed by Dove Medical Press Limited. The
full terms of this license are available at https://www.dovepress.com/terms
and incorporate the Creative Commons Attribution
- Non Commercial (unported, 3.0) License.
By accessing the work you hereby accept the Terms. Non-commercial uses of the work are permitted
without any further permission from Dove Medical Press Limited, provided the work is properly
attributed. For permission for commercial use of this work, please see paragraphs 4.2 and 5 of our Terms.