Back to Journals » Nature and Science of Sleep » Volume 6
Performance evaluation of an automated single-channel sleep–wake detection algorithm
Authors Kaplan R, Wang Y, Loparo K, Kelly M, Bootzin R
Received 15 July 2014
Accepted for publication 20 August 2014
Published 15 October 2014 Volume 2014:6 Pages 113—122
DOI https://doi.org/10.2147/NSS.S71159
Checked for plagiarism Yes
Review by Single anonymous peer review
Peer reviewer comments 4
Editor who approved publication: Dr Steven Shea
Richard F Kaplan,1 Ying Wang,1 Kenneth A Loparo,1,2 Monica R Kelly,3 Richard R Bootzin3
1General Sleep Corporation, Euclid, OH, USA; 2Department of Electrical Engineering and Computer Science, Case Western Reserve University, Cleveland, OH, USA; 3Department of Psychology, University of Arizona, Tucson, AZ, USA
Background: A need exists, from both a clinical and a research standpoint, for objective sleep measurement systems that are both easy to use and can accurately assess sleep and wake. This study evaluates the output of an automated sleep–wake detection algorithm (Z-ALG) used in the Zmachine (a portable, single-channel, electroencephalographic [EEG] acquisition and analysis system) against laboratory polysomnography (PSG) using a consensus of expert visual scorers.
Methods: Overnight laboratory PSG studies from 99 subjects (52 females/47 males, 18–60 years, median age 32.7 years), including both normal sleepers and those with a variety of sleep disorders, were assessed. PSG data obtained from the differential mastoids (A1–A2) were assessed by Z-ALG, which determines sleep versus wake every 30 seconds using low-frequency, intermediate-frequency, and high-frequency and time domain EEG features. PSG data were independently scored by two to four certified PSG technologists, using standard Rechtschaffen and Kales guidelines, and these score files were combined on an epoch-by-epoch basis, using a majority voting rule, to generate a single score file per subject to compare against the Z-ALG output. Both epoch-by-epoch and standard sleep indices (eg, total sleep time, sleep efficiency, latency to persistent sleep, and wake after sleep onset) were compared between the Z-ALG output and the technologist consensus score files.
Results: Overall, the sensitivity and specificity for detecting sleep using the Z-ALG as compared to the technologist consensus are 95.5% and 92.5%, respectively, across all subjects, and the positive predictive value and the negative predictive value for detecting sleep are 98.0% and 84.2%, respectively. Overall κ agreement is 0.85 (approaching the level of agreement observed among sleep technologists). These results persist when the sleep disorder subgroups are analyzed separately.
Conclusion: This study demonstrates that the Z-ALG automated sleep–wake detection algorithm, using the single A1–A2 EEG channel, has a level of accuracy that is similar to PSG technologists in the scoring of sleep and wake, thereby making it suitable for a variety of in-home monitoring applications, such as in conjunction with the Zmachine system.
Keywords: EEG, sleep–wake detection, algorithm, Zmachine, automatic sleep scoring, single channel
Introduction
The objective measurement of sleep–wake cycles is relevant and useful to various research protocols, such as the assessment of differences in sleep patterns between populations or confirmation of wake in sleep deprivation studies, as well as clinical applications including sleep disorder diagnosis or as a behavioral treatment adjunctive tool.1 Minimally invasive and cost-effective automated methods of objective sleep monitoring are highly desirable, although, aside from actigraphy-based systems, there are few commercially available options. In this paper, we present the performance of an automated sleep–wake detection algorithm (Z-ALG) that may have the potential to address this need.
Historically, the gold standard of sleep measurement has been laboratory polysomnography (PSG), which utilizes a combination of electroencephalography (EEG), electrooculography, and electromyography (EMG) to determine sleep stages and sleep-related phenomena such as arousals. Laboratory PSG recordings require a physical space to conduct the sleep assessment and an on-site overnight staff to both apply and remove the physiological sensors and to ensure the integrity of acquired data. Data are often scored visually, in 30-second epochs, by registered PSG technicians. PSG boasts the advantage of excellence in terms of individualized sleep staging accuracy; however, the financial costs and time associated with conducting the data acquisition and subsequent scoring of the sleep records, as well as the burden to participants or patients, can outweigh this benefit.
In those research studies and clinical screening applications in which in-home sleep monitoring over many days or weeks is required, the use of portable multichannel PSG is often financially and logistically impractical; therefore, indirect inference of sleep and wake from actigraphy-based systems are often used in its place. Actigraphy systems are accelerometer-based devices that infer sleep and wake from the presence or absence of movement. Acquired accelerometer data are archived and postprocessed to compute conventional sleep–wake statistics such as total sleep time (TST), percent of time spent asleep, total wake time, percent of time spent awake, and number of awakenings.2 Actigraphy is well suited to certain applications because it does not restrict patient movement (making it more acceptable for participants), is more cost effective, and is less time consuming with regard to both data collection and scoring than PSG.3 However, actigraphy is limited in terms of accuracy with regard to sleep–wake detection due to the potentially inconsistent relation between sleep and patient motion. In a recent 77-patient study, it was observed that the sensitivity of actigraphy (ie, agreement between actigraphy and PSG in detecting sleep) was 96.5%, but the specificity (ie, agreement between actigraphy and PSG in detecting wake) was only 32.9%.3 Thus, while actigraphy may be able to identify most instances of sleep, it is poor in terms of detecting periods of wakefulness. As with every classifier, there is a natural tension between specificity and sensitivity, and this difficulty is evident in sleep–wake classification using actigraphy. For those applications that require both high sensitivity and high specificity, a more precise method of sleep–wake determination may be needed.
To reduce the burden associated with the manual scoring of PSG records, automatic sleep scoring systems have been developed. Automated scoring systems use digitally acquired PSG data, which are then postprocessed using various computational methods ranging from time and frequency domain analysis, artificial neural networks, support vector machines, to other data-driven and learning-based classification techniques including rule-based systems such as expert and fuzzy systems.4–7 Automated scoring is a promising method to both improve reliability as well as to reduce cost and facilitate exploration of better disease detection and outcomes.8 Despite these benefits, automated scoring software typically requires the full complement of PSG data channels (requiring trained sleep technologists to apply and remove the sensors), thereby making it impractical for those in-home applications where a minimal number of data channels are used to make patient self-application of sensors possible and for improved comfort during sleep.
More recently, automated scoring software has been developed for use with a single channel of EEG data. Berthomier et al9 conducted a validation study in which their automated sleep scoring software was compared against technologist visual scoring of data from the CZ–PZ EEG channel, collected by a commercially available PSG system, in 15 healthy adults. Postprocessing of the EEG data involved frequency band analysis, autoregressive modeling, Fourier transform, instantaneous frequency measurement, and a fuzzy logic–based, dynamic iterative staging process. Their results indicated sensitivity and specificity for detecting sleep of 98.1% and 82.5%, respectively, and an overall Cohen’s κ agreement of 0.82.
In Koley and Dey,10 automatic identification of sleep stages 1, 2, 3, 4, rapid eye movement (REM), and wakefulness were classified from a single channel (C4–A1) of EEG data using a pattern recognition technique that involves extracting 39 time and frequency domain features and application of support vector machines for recursive feature elimination and classification. This algorithm, which used 16 subject recordings for training, and another 12 subject recordings for testing, produced an average Cohen’s κ of 0.86 for the test subjects and 0.88 for the training subjects. Subjects with and without symptoms of sleep apnea were included in both the training and testing data sets.
These results are promising in that they demonstrate the ability of automated scoring software to potentially substitute for the visual scoring of sleep–wake from as little as one channel of EEG data in both healthy individuals and those with sleep disorders.
The objective of this paper is to evaluate the performance of the automated sleep–wake detection algorithm, Z-ALG, in terms of accuracy and reliability as compared to visual scoring by certified PSG technologists and as compared to other sleep–wake scoring systems that have been reported in the literature.
Z-ALG computes individualized scale parameters unique to each patient, rather than relying on the broad assumptions inherent in population-based training approaches to algorithm development. Furthermore, Z-ALG can process data derived from the differential mastoid (A1–A2) EEG location. Although the mastoids are traditionally used as references for various standard EEG derivations (such as O1–A2, C4–A1, etc), like all positions on the scalp, it does contain a mixture of EEG and EMG activities. Although the mastoids may contain a different proportion of EMG activity as compared to some other locations on the scalp, the A1–A2 channel can be effectively used for sleep–wake detection as shown in this paper.
The performances of two sleep detection algorithms using signals from frontally derived EEG locations have been evaluated,11,12 but to the best of our knowledge, Z-ALG is the first to use signals from A1–A2 for this purpose. The A1–A2 location has the advantage of being located completely outside the hairline, making it suitable for patient self-application and removal of pre-gelled, self-stick EEG sensors. Furthermore, this location orients the lead wires down and away from the user’s face, making it comfortable to wear when sleeping. Z-ALG, used in conjunction with a portable EEG acquisition system, has many of the combined benefits of actigraphy (convenience) and laboratory PSG (accuracy). In addition, this combination has the potential to be useful in clinical settings, such as an augment to cognitive behavioral therapy for insomnia.13 The remainder of this paper describes the approach to evaluating Z-ALG.
Methods
Participants
One hundred and six paid volunteers participated in an overnight laboratory PSG study in the Consolidated Research, Inc. Research Sleep Laboratory in Cleveland, OH, USA as approved by the Mercy Medical Center Institutional Review Board in Canton, OH. Data were collected and scored in 2003, prior to the publication of the American Academy of Sleep Medicine Manual for the Scoring of Sleep and Associated Events.14 In keeping with the convention of most automatic sleep staging systems and the historical gold standard used by sleep technologists for over 40 years, PSG data were scored visually according to rules published in 1968 by Rechtschaffen and Kales.15 Of the 106 participants, data from the first four were excluded from the study due to technical issues with the PSG recording system (incorrect patient head-box connections). Two additional participants were excluded because the sleep technicians failed to follow the prescribed protocol, and one participant voluntarily withdrew from the study. Therefore, physiological data and manually scored sleep records for 99 volunteer participants were used for this analysis.
The study group was composed of 52 females and 47 males, aged 18–60 years, with a median age of 32.7 years. The study employed liberal inclusion criteria in order to capture a variety of subjects, including both those reporting normal sleep and those reporting various sleep complaints. All participants were considered either “a normal healthy patient” or “a patient with mild systemic disease” in accordance with the American Society of Anesthesiologists physical status classification system (ASA Physical Status 1 and 2, respectively).16 This protocol allowed for inclusion of “a patient with severe systemic disease,” American Society of Anesthesiologists Physical Status 3, but none were included in this study. Although atypical in sleep research, the classification system of the American Society of Anesthesiologists was used to screen patients for this study due to the research team’s established familiarity and experience with this classification system from developing clinical studies for monitoring patients undergoing surgical anesthesia. The exclusion criteria for this study included pregnancy, less than 18 years of age, and psychotropic medication use due to the potential influence on the EEG signal morphology (users of selective serotonin reuptake inhibitors [SSRIs] and serotonin–norepinephrine reuptake inhibitors [SNRIs] were not excluded in order to evaluate their potential impact on algorithm performance), and those self-reporting excessive skin sensitivity due to possible discomfort from skin preparation and sensor application.
Z-ALG was developed for the Zmachine® DT-100, a commercially available, US Food and Drug Administration-cleared, single-channel, EEG-based system intended for in-home use. The Z-ALG and Zmachine combination is ultimately intended for use with insomnia treatment, so preference was given to those participants reporting normal sleep and those expressing one or more symptoms of chronic insomnia. Initially, participants who self-reported symptoms indicative of sleep apnea or restless leg syndrome were not selected for the study; however, this restriction was relaxed as recruitment progressed in order to gain additional knowledge as to the strengths and limitations of Z-ALG with a diverse population.
Participant diagnoses were based on prestudy structured telephone interviews conducted by a staff member at the General Sleep Corporation (a division of Consolidated Research, Inc.) and questionnaires. Of the 99 study participants, 50 participants (50.5%) reported symptoms consistent with at least one of the following sleep disorders:
- Thirty-five participants (35.4%) reported symptoms consistent with at least one variety of chronic insomnia (sleep onset, sleep maintenance, waking too early) defined as greater than 30-minute sleep-onset latency (n=25, 25.3%), greater than 30-minute wake after sleep onset (WASO; n=13, 13.1%), or waking earlier than desired (n=12, 12.1%) with an inability to return to sleep occurring at least three times per week and persisting for at least four weeks. Of those 35 participants, 15 reported symptoms consistent with multiple types of chronic insomnia (ie, onset and maintenance, onset and early waking, or maintenance and early waking).
- Twenty-two participants (22.2%) reported strange leg sensations keeping them from falling asleep or staying asleep, indicative of possible restless leg syndrome or periodic limb movements.
- Five participants (5.1%) responded positively to both snoring and nocturnal cessation of breathing/choking, indicative of possible sleep apnea.
Laboratory PSG system and recordings
Participant data were acquired using a PSG system developed by Consolidated Research, Inc., to acquire high-resolution and high-bandwidth physiological signals for both traditional visual sleep scoring and processing by Z-ALG. To support the data requirements of Z-ALG, specialized signal acquisition hardware (2.5 kHz/channel sampling frequency and 16-bit analog-to-digital conversion) with a very low input-referenced noise floor (~4 μVpp, full bandwidth time domain signal) was designed, built, and used for laboratory data acquisition. The nondistorted input range of the physiologic amplifiers is ±500 μV. A sixth-order, low-pass Bessel filter with 380 Hz cutoff frequency was used for antialiasing, and a first-order RC high-pass filter with 0.5 Hz cutoff frequency was used to block DC. In addition to the eight physiologic channels, the PSG system also recorded pulse-oximetry data for each subject. The data acquisition characteristics of the PSG machines (ie, amplifier frequency response, noise floor, linearity, levels of harmonic distortion, sample frequency, etc) and the sleep–wake detection algorithm (Z-ALG) used in this paper are identical to those implemented in the Zmachine.
The following data were acquired during each night in the sleep laboratory: EMG, left outer canthus (LOC), right outer canthus (ROC), C3–A2, C4–A1, O1–A2, Fp1–Fp2, A1–A2, finger-probe pulse-oximetry, and time-stamped video/audio recording. EEG channels A1–A2 and Fp1–Fp2 were acquired and archived, but were not used for visual scoring. The EEG channel A1–A2 was the only data source used for Z-ALG in this study.
Visual sleep scoring and epoch-by-epoch consensus
Independent scoring was performed visually using standard 30-second epochs. In addition to assigning traditional Rechtschaffen and Kales sleep stages (Wake; 1, 2, 3, 4; and REM) and arousals to each epoch, the scorers were also given the opportunity to score any epoch as “unknown” when the subject was either disconnected from the system (bathroom break, etc) or when the waveforms were unclear or ambiguous to the scorer.
To account for interscorer variability, each PSG record was scored independently by at least two certified PSG technologists as follows: 3 records were scored by two technologists, 16 records were scored by three technologists, and 80 records were scored by four technologists. The number of records scored by each technologist (T1–T5) is as follows: T1 scored 97 records, T2 scored 38 records, T3 scored 98 records, T4 scored 42 records, and T5 scored 99 records.
The final consensus for stage-by-stage analysis was determined using an epoch-by-epoch majority agreement rule. If more than half of the scorers agreed on a particular stage of sleep (ie, Wake; 1, 2, 3, 4; or REM), then that stage was assigned as the final score for that epoch. Otherwise, that epoch was not considered for further analysis. The consensus epochs, based on the universally accepted methodology of laboratory PSG sleep analysis, are used as the objective standard by which the performance of Z-ALG is evaluated.
The example shown in Figure 1 was taken from a study participant with sleep scores from four PSG technologists shown superimposed. For sleep stages, dark blue denotes epochs that have majority agreement among the four PSG technologists and light blue represents epochs that do not have majority agreement.
 | Figure 1 Sample study participant showing epoch-by-epoch scoring by four polysomnographic technologists. |
Epochs scored as stages 1–4 and REM were converted to a single designation of SLEEP, and wake epochs were maintained as WAKE. The example shown in Figure 2 depicts the study participant shown in Figure 1, but converted from individual sleep stages to sleep–wake only.
 | Figure 2 Sample study participant scored by four polysomnographic technologists and converted from sleep stages to sleep–wake using a majority agreement rule. |
Sleep–wake algorithm
A schematic representation of Z-ALG is depicted in Figure 3. Z-ALG operates on a single epoch at a time, so the input to the algorithm consists of 30-second blocks of EEG data. The first step of signal processing for sleep–wake determination occurs during the signal acquisition phase in which six time and frequency domain features are computed on the incoming EEG data stream and written to nonvolatile storage.
 | Figure 3 Block diagram of sleep–wake detection algorithm. |
The incoming EEG data for time domain features TF1, TF2, and TF3 were preprocessed with a 3 Hz, second-order, high-pass filter and a 60 Hz (plus odd harmonics) multinotch filter to remove any coupled power line noise. TF1–3 are amplitude-dependent features related to the time domain morphology of the EEG signal and are used for differentiating noncortical artifacts (ECG contamination, muscle and motion artifact, etc) from those of cortical origin (large-amplitude slow waves, spindles, K complexes, etc).
The frequency domain features FF1, FF2, and FF3 were processed using the (Hanning) windowed fast Fourier transform in which high-frequency, intermediate-frequency, and low-frequency band energy features are computed. The high-frequency feature (FF1) uses signal information within the 40–500 Hz range, and the interested reader is referred to the literature17 for more details about this frequency range. The intermediate-frequency (FF2) feature falls within the conventionally defined beta (β) band, and the low-frequency feature (FF3) falls within the conventionally defined delta (δ) band.
Frequency features (FF1 to FF3) will occupy separable zones of a multidimensional hyperspace related to sleep and wake. The exact positioning of these wake and sleep zones is determined by the magnitude of the frequency features, which differ from patient to patient, based on such factors as skull thickness, age, etc. To distinguish between sleep and wake, Z-ALG computes a series of scale values that are used to define a separating hyperplane in the multidimensional feature space. This separating hyperplane is computed for each individual, based on their data alone, and therefore accounts for EEG signal differences among individuals. This unsupervised algorithmic approach avoids the need for training data required by other supervised approaches found in the literature.10
A single-level parallel detection scheme (detectors D1 and D2) is used to determine sleep and wake. If either D1 or D2 detects sleep, then the epoch is scored as SLEEP. If neither detector indicates sleep, then the epoch is scored as WAKE. Detector D1 uses only frequency features, and detector D2 uses both frequency and time domain features.
After this sleep–wake detection scheme, a postprocessing filter is used to further “clean up” the sleep–wake determination by adjusting the stage assignment of single- or double-isolated sleep epochs surrounded by wake from SLEEP to WAKE. The only operating assumption made by Z-ALG is that the recording contains both sleep and wake epochs in the data set.
Statistical analysis
Cohen’s Kappa (κ) was used to estimate interrater reliability of the visual scoring by pairs of technologists for each participant and Z-ALG versus the technologist consensus. Cohen’s κ statistic quantifies the agreement between two raters beyond what would be expected from chance alone for categorical data. Although there is no formally agreed upon standard, κ values are often segmented into ranges of values indicative of a low association (κ <0.4), medium association (0.4≤ κ <0.75), and high association (κ ≥0.75).
Sensitivity, specificity, positive predictive value (PPV), and negative predictive value (NPV) were calculated on the Z-ALG sleep–wake determination versus the consensus sleep–wake assignments. Sensitivity describes the probability of Z-ALG categorizing an epoch as sleep when the technologist consensus scored that epoch as sleep. Specificity describes the probability of Z-ALG categorizing an epoch as wake when the technologist consensus scored that epoch as wake. PPV and NPV describe the probability that an epoch is actually sleep (PPV) or wake (NPV) when it is identified as such by Z-ALG.
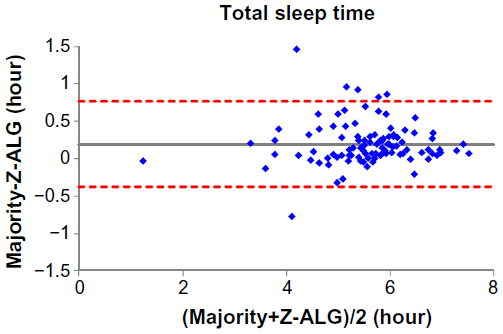
To further demonstrate the agreement between Z-ALG and the consensus of sleep technologists, Bland–Altman plots were used to compare four standard sleep statistics; they are: TST, sleep efficiency (SE), latency to persistent sleep (LPS), and WASO. Bland–Altman plots are useful for revealing any systematic biases and highlighting any outliers present between two data sets. Pearson correlation coefficients (r) were calculated to evaluate the agreement between Z-ALG and technologist consensus for each plot.
Results
Technologist-to-technologist comparison
Interrater agreement among the sleep technologists (Table 1) was determined based on the common records that they scored. Cohen’s κ ranged from 0.82 to 0.92 for each pair of technologists, except between T2 and T4, who did not score any common records.
 | Table 1 κ agreement among technologists (number of common subjects scored) |
Technologist-to-Z-ALG comparison
Of 91,824 epochs (>765 hours) of recorded data for the 99 subjects, 82,781 (>90%) have consensus among the technologists and were compared with Z-ALG (9,043 epochs lacked consensus, so were not included for analysis). For those 82,781 epochs, epoch-by-epoch agreement between Z-ALG and the technologists is shown in Table 2. For example, in the REM column of Table 2, among 15,139 epochs that the consensus of PSG technologists classified as REM, Z-ALG correctly classified 15,012 (99.2%) as sleep and incorrectly classified 127 epochs (0.8%) as wake.
 | Table 2 Contingency table showing the number of sleep–wake epochs from Z-ALG against the consensus of sleep technologists for each sleep stage (Wake; 1, 2, 3, 4; and REM) |
The two-state (wake and sleep) epoch-by-epoch agreement is summarized in the contingency table shown in Table 3. The consensus of PSG technologists classified 65,873 (62,933 + 2,940) epochs as sleep. Of those, Z-ALG correctly classified 62,933 epochs as sleep and incorrectly classified 2,940 epochs as wake. Similarly, the technologists indicated 16,908 (1,276 + 15,632) epochs as wake, with Z-ALG correctly classifying 15,632 of those epochs as wake, and misclassifying 1,276 as sleep. Based on these data, the overall sensitivity of Z-ALG on the entire 99-subject sample is 95.5% for detecting sleep, with a specificity of 92.5%, and PPV and NPV of 98.0% and 84.2%, respectively (Table 4, Row 1). Cohen’s κ agreement of 0.85 falls within the range of high association (>0.75).
 | Table 3 Contingency table showing the number of sleep-wake epochs in each classification |
 | Table 4 Contingency table of validation statistics for both the entire sample and subgroups |
Although consensus agreement among technologists was the chosen performance metric, it may be interesting to note that the performance of Z-ALG improved when compared only to those epochs in which there was unanimous agreement among technologists. When only considering unanimous agreement, 69.2% of epochs remained in the pool for analysis (as compared to 90.2% for consensus agreement) and resulted in a sensitivity of 97.1%, specificity of 94.1%, and PPV and NPV of 98.1% and 90.9%, respectively. Cohen’s κ increased to 0.90.
Participant subgroup analyses
Specificity, sensitivity, and Cohen’s κ were also calculated in Table 4 for subjects reporting symptoms of sleep disorders (insomnia, apnea, RLS/PLM subgroups) and for those taking antidepressant medications (SSRI/SNRI subgroup). From this table, we observe that Z-ALG maintains a high level of accuracy across various subgroups, including subjects reporting any of the symptoms of chronic insomnia, with the worst performance attributed to the SSRI/SNRI subgroup.
Comparison of sleep statistics
Figures 4–7 demonstrate the sleep statistics of TST, SE, LPS, and WASO using scores from both Z-ALG and the consensus of sleep technologists. As can be observed in the figures below, these four statistics show strong correlations between Z-ALG and the technologists. The Pearson correlation coefficients (r) range from a minimum of 0.89 for WASO to a maximum of 0.96 for LPS. The Pearson correlation coefficient, mean error, and standard deviation are shown at the bottom of each figure.
 | Figure 4 Bland–Altman plot of total sleep time between sleep–wake detection algorithm (Z-ALG) and the consensus of sleep technologists. r=0.954 and bias =0.193±0.290. |
 | Figure 5 Bland–Altman plot of sleep efficiency between sleep–wake detection algorithm (Z-ALG) and the consensus of sleep technologists. r=0.928 and bias =0.029±0.044. |
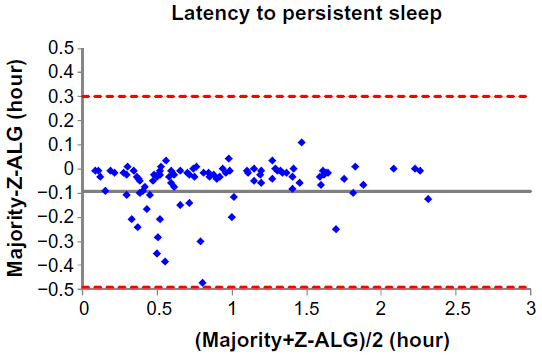 | Figure 6 Bland–Altman plot of latency to persistent sleep between sleep–wake detection algorithm (Z-ALG) and the consensus of sleep technologists. r=0.962 and bias =−0.094±0.202. |
 | Figure 7 Bland–Altman plot of wake after sleep onset between sleep–wake detection algorithm (Z-ALG) and the consensus of sleep technologists. r=0.887 and bias =−0.099±0.197. |
Discussion
In the present study, the automated sleep–wake detection algorithm, Z-ALG, was compared on an epoch-by-epoch basis to visually scored and consensus agreed upon full PSG recordings. Z-ALG provides sleep–wake information on a 30-second epoch-by-epoch basis, as well as summary statistics such as TST, SE, WASO, and LPS. Although no information is provided about sleep architecture other than sleep–wake determination, Z-ALG demonstrated high reliability and validity in the detection of sleep versus wake not only for good sleepers but also for those with a variety of sleep complaints as well as those taking antidepressants. Although we believe that Z-ALG shows a considerable accuracy advantage over the results obtained from actigraphy, additional research in which Z-ALG and actigraphy are directly compared should be performed.
Z-ALG is the sleep–wake detection algorithm developed for use in conjunction with the Zmachine, a single-channel EEG acquisition and analysis system using data from differential mastoids (A1–A2). The Zmachine includes automatic impedance checking18 to verify good impedances at the start of recording and at intervals throughout the recording, as good data quality is critical to algorithm performance. The Zmachine was originally developed for use with cognitive behavioral therapy for insomnia.13 In addition to measuring objective TST to facilitate sleep restriction therapy, the Zmachine can also alert patients to leave bed in accordance with stimulus control instructions if the device detects that the individual has been awake for more than a clinician-determined amount of time (eg, 20 minutes). The Zmachine can also provide immediate patient feedback in terms of various sleep statistics, such as TST, SE, LPS, and WASO. For this intended purpose, Z-ALG must exhibit both high sensitivity and specificity in detecting sleep versus wake. A lack of Z-ALG sensitivity would, for example, result in an overestimation of wake time, leading to false alerts to leave bed. Similarly, a lack of specificity would result in the overestimation of sleep that could result in failing to appropriately alert patients to leave bed. In either situation, the effectiveness of the Zmachine would be degraded. To meet these requirements, Z-ALG provides individualized tuning of sleep detection parameters for each patient, thus enabling more accurate sleep–wake classification over a diverse population as compared to algorithms relying on population-based (supervised) training.
For 99 healthy and sleep disorder adults, Z-ALG achieved an overall sensitivity for detecting sleep of 95.5%, with a specificity of 92.5%, PPV of 98.0%, and NPV of 84.2%. A study involving 15 healthy adults9 reported a sensitivity of 98.1% for detecting sleep with a specificity of 82.5%, PPV of 97.2%, and NPV of 87.6%. Another study involving 29 healthy adults11 reported a PPV of 94.8% for detecting sleep with an NPV of 83.5%, but did not report sensitivity and specificity for detecting sleep. Using the contingency table provided in this publication,11 we calculated a sensitivity of 98.0% for detecting sleep, with a specificity of 63.9%. Finally, a study involving 44 healthy and sleep disorder adults12 divided into two groups reported detection statistics for each stage of sleep, but not sleep–wake. Using the contingency table provided in this publication,12 we calculated the sensitivity for detecting sleep in each group (1 and 2) as 95.4%, with specificities of 79.0% and 78.3%, PPVs of 94.3% and 93.7%, and NPVs of 82.5% and 83.3%, respectively. Because different EEG channels, different subject populations, and different methods of analysis were used to evaluate each algorithm, there is no sufficient uniformity to draw any concrete conclusions about the superiority of one technology over the other. To properly compare different algorithms, a clinical study in which all algorithms are challenged with the same data and analyzed using a standardized methodology is required. Z-ALG uses the A1–A2 EEG channel, which, although posing unique challenges from a signal processing perspective, enables comfortable use during sleep and is less intrusive than other forehead or scalp EEG electrode locations. Although this manuscript only details the sleep–wake detection results from Z-ALG, future versions of the algorithm will further separate sleep into light sleep, deep sleep, and REM. These results will be reported in future publications.
From Table 2, it can be seen that Z-ALG misclassified 31.1% stage 1 sleep as wake. It would be highly desirable if stage 1 detection accuracy could be improved in the future. However, this result is not surprising, given that other algorithms performed similarly.9,12 The accurate detection of stage 1 sleep appears to remain an open problem in this field. Furthermore, from the Bland–Altman plots of Figures 4–7, the errors in the four sleep statistics are not insignificant for some subjects. For example, the maximal error of the LPS is about 0.5 hour (30 minutes), which almost meets the diagnostic criteria for insomnia and could potentially lead to misinterpretation. Therefore, continued improvement in the accuracy of Z-ALG is of high importance.
A limitation of the present study is that the sleep disorders subgroups, listed in Table 4, are classified according to self-reports and were not clinically verified prior to inclusion in the study. Another limitation is that there are too few subjects in the sleep disorder subgroups to base any conclusions about Z-ALG performance (they were only included in Table 4 for completeness). However, the SSRI/SNRI subgroup does hint at degraded Z-ALG performance. The study of larger sleep disorder populations, using a variety of patient demographic types, should be performed in the future to further understand Z-ALG strengths and limitations and to improve the performance of future versions of the algorithm.
Future research regarding Z-ALG will also include validation studies using the data collected by the Zmachine device to evaluate the system’s performance as a whole. Additionally, studies should assess this system in insomniacs in a trial of cognitive behavioral therapy for insomnia in order to evaluate the Zmachine as an adjunct to traditional therapy. Although additional research is desirable to further verify the clinical utility of the Zmachine, this study has shown that Z-ALG is a reliable and valid tool for detecting sleep and wake and for computing accurate sleep-related statistics.
Disclosure
The work was performed at, and supported by, General Sleep Corporation (a division of Consolidated Research, Inc., Euclid, OH, USA). Drs Kaplan and Wang are employees of General Sleep Corporation. Dr Loparo is affiliated with General Sleep Corporation and Nord Professor of Engineering in the Department of Electrical Engineering and Computer Science at Case Western Reserve University. Ms Kelly is a graduate student in the Department of Psychology at University of Arizona. Dr Bootzin is a Professor in the Department of Psychology at University of Arizona and a consultant to General Sleep Corporation. The authors report no other conflicts of interest in this work.
References
Sadeh A. The role and validity of actigraphy in sleep medicine: an update. Sleep Med Rev. 2011;15:259–267. | |
Ancoli-Israel S, Cole R, Alessi C, Chambers M, Moorcroft W, Pollak CP. The role of actigraphy in the study of sleep and circadian rhythms. Sleep. 2003;26:342–392. | |
Marino M, Li Y, Rueschman MN, et al. Measuring sleep: accuracy, sensitivity, and specificity of wrist actigraphy compared to polysomnography. Sleep. 2013;36:1747–1755. | |
Penzel T, Conradt R. Computer based sleep recording and analysis. Sleep Med Rev. 2000;4:131–148. | |
Anderer P, Moreau A, Woertz M, et al. Computer-assisted sleep classification according to the standard of the American Academy of Sleep Medicine: validation study of the AASM version of the Somnolyzer 24×7. Neuropsychobiology. 2010;62:250–264. | |
Hasan J. Automatic analysis of sleep recordings: a critical review. Ann Clin Res. 1985;17:280–287. | |
Malhotra A, Younes M, Kuna ST, et al. Performance of an automated polysomnography scoring system versus computer-assisted manual scoring. Sleep. 2013;36:573–582. | |
Redline S, Dean D, Sanders MH. Enter the era of “Big Data”: getting our metrics right. Sleep. 2013;36:465–469. | |
Berthomier C, Drouot X, Herman-Stoïca M, et al. Automatic analysis of single-channel sleep EEG: validation in healthy individuals. Sleep. 2007;30:1587–1595. | |
Koley B, Dey D. An ensemble system for automatic sleep stage classification using single channel EEG signal. Comput Biol Med. 2012;42:1186–1195. | |
Shambroom J, Fabregas S, Johnstone J. Validation of an automated wireless system to monitor sleep in healthy adults. J Sleep Res. 2012;21:221–230. | |
Stepnowsky C, Levendowski D, Popovic D, Ayappa I, Rapoport D. Scoring accuracy of automated sleep staging from a bipolar electroocular recording compared to manual scoring by multiple raters. Sleep Med. 2013;14:1199–1207. | |
Kaplan R, Loparo K, inventors; Consolidated Research of Richmond, Inc., assignee. Automated insomnia treatment system. United States patent 7,654,948. February 2, 2010. | |
Iber C. American Academy of Sleep Medicine. The AASM Manual for the Scoring of Sleep and Associated Events: Rules, Terminology and Technical Specifications. Westchester, IL: American Academy of Sleep Medicine; 2007. | |
Rechtschaffen A, Kales A. Manual of Standardized Terminology, Techniques and Scoring System for Sleep Stages of Human Subjects. Washington, DC: National Healthcare Institute; 1968. | |
American Society of Anesthesiologists. 2010. ASA Physical Status Classification System. Available from: http://www.asahq.org/Home/For-Members/Clinical-Information/ASA-Physical-Status-Classification-System. Accessed September 9, 2014. | |
Kaplan R, Loparo K, inventors; Consolidated Research of Richmond Inc., assignee. Alertness and drowsiness detection and tracking system. United States patent 5,813,993. September 29, 1998. | |
Kaplan R, Wang Y, Loparo K, inventors; Consolidated Research, Inc., assignee. Apparatus and method for high-speed determination of bioelectric electrode impedances. United States patent 8,089,283. January 3, 2012. |
 © 2014 The Author(s). This work is published and licensed by Dove Medical Press Limited. The
full terms of this license are available at https://www.dovepress.com/terms
and incorporate the Creative Commons Attribution
- Non Commercial (unported, 3.0) License.
By accessing the work you hereby accept the Terms. Non-commercial uses of the work are permitted
without any further permission from Dove Medical Press Limited, provided the work is properly
attributed. For permission for commercial use of this work, please see paragraphs 4.2 and 5 of our Terms.
© 2014 The Author(s). This work is published and licensed by Dove Medical Press Limited. The
full terms of this license are available at https://www.dovepress.com/terms
and incorporate the Creative Commons Attribution
- Non Commercial (unported, 3.0) License.
By accessing the work you hereby accept the Terms. Non-commercial uses of the work are permitted
without any further permission from Dove Medical Press Limited, provided the work is properly
attributed. For permission for commercial use of this work, please see paragraphs 4.2 and 5 of our Terms.