Back to Journals » Cancer Management and Research » Volume 12
PD-L1 Expression is Highly Associated with Tumor-Associated Macrophage Infiltration in Nasopharyngeal Carcinoma
Authors Deng R ![]() , Lu J, Liu X, Peng XH, Wang J, Li XP
, Lu J, Liu X, Peng XH, Wang J, Li XP
Received 11 August 2020
Accepted for publication 12 October 2020
Published 12 November 2020 Volume 2020:12 Pages 11585—11596
DOI https://doi.org/10.2147/CMAR.S274913
Checked for plagiarism Yes
Review by Single anonymous peer review
Peer reviewer comments 2
Editor who approved publication: Professor Harikrishna Nakshatri
Rui Deng,* Juan Lu,* Xiong Liu, Xiao-Hong Peng, Jie Wang, Xiang-Ping Li
Department of Otolaryngology-Head and Neck Surgery, Nanfang Hospital, Southern Medical University, Guangzhou, People’s Republic of China
*These authors contributed equally to this work
Correspondence: Xiang-Ping Li
Department of Otolaryngology-Head and Neck Surgery, Nanfang Hospital, 1838 North of Guangzhou Avenue, Guangzhou, People’s Republic of China
Tel +86-20-61642001
Fax +86-20-87703645
Email [email protected]
Purpose: Tumour-associated macrophages (TAMs) are the most abundant immune cells in the tumor microenvironment and provide a barrier against the cytotoxic effector functions of T cells and natural killer (NK) cells. Recently, TAMs have become increasingly recognised as an attractive target in combination therapy with PD-1/PD-L1 immuno-checkpoint blockades (ICBs). However, the relationship between PD-L1 expression and TAMs remains unknown in nasopharyngeal carcinoma (NPC).
Patients and Methods: A total of 212 NPC patients from Nanfang hospital were collected in this study. We evaluated the expression of PD-L1 in tumor cells, CD68 (pan-macrophages), and CD163 (M2-like macrophage) in NPC tissues using immunohistochemical (IHC) staining.
Results: The positivity of PD-L1 on tumor cells was 61.3% (130/212). The infiltration densities of CD68+ cells and CD163+ cells in PD-L1-positive NPC tissues were significantly higher than those in PD-L1-negative NPC tissues (P=0.0012 for CD68; P< 0.0001 for CD163). Logistic regression analysis showed that high densities of CD68+ macrophages and CD163+ TAMs were significantly associated with increased PD-L1 expression. Subgroup analyses demonstrated that a positive PD-L1 expression on tumor cells in combination with lower CD163+ TAMs density was significantly associated with favorable prognosis, whereas negative PD-L1 expression on tumor cells with higher CD163+ TAMs density was associated with worse prognosis.
Conclusion: The PD-L1 expression in tumor cells was positively correlated with TAMs density in tumor microenvironment of NPC, suggesting TAMs as a new target for combination therapy to improve the response rate of ICBs in NPC treatment.
Keywords: nasopharyngeal carcinoma, PD-L1, tumor-associated macrophage, prognosis, tumor microenvironment
Introduction
Nasopharyngeal carcinoma (NPC) differs from other head and neck cancers in its distinct etiology and epidemiology. Up to 75% of patients are diagnosed with loco-regionally advanced NPC with cervical nodal metastases.1,2 With the development of intensity-modulated radiotherapy and the optimization of chemotherapy regimens, the overall survival of NPC patients has significantly improved. However, 20–30% of NPC patients still develop local recurrence or distant metastasis after chemoradiotherapy, and they are refractory to multiple treatment regimens.3 Therefore, high-efficient and novel treatments are urgently needed to improve survival. Immuno-checkpoint blockades (ICBs) treatment has recently gained great attention for good efficacy and relatively low adverse reactions in NPC.
PD-1/PD-L1 immune checkpoint inhibitors have shown rapid onset, long-lasting response, and good tolerability in many solid tumors,4 and have appeared inspiring efficacy in recurrent or metastatic NPC patients. Many ongoing clinical trials are evaluating the treatment value of PD-1/PD-L1 inhibitors in NPC, and early results are promising.5–7 However, overall response rate of NPC patients is less than 30%, and not all patients gain survival benefit from anti-PD-1 therapy.8 Then, how to select the dominant population has become the most important issue for anti-PD-1/PD-L1 treatment. Nowadays, PD-L1 status remains to be the most widely studied biomarker in predicting the efficacy of anti-PD-1/PD-L1 therapy. Multiple studies in a variety of tumor types have showed a positive correlation between PD-L1 expression and ICBs response,9 while there are many patients with low or no detectable PD-L1 expression who experience durable clinical benefit.10 Therefore, elucidating the mechanisms and predictive markers of PD-L1 expression can further refine the selection of NPC patients most likely to benefit from anti-PD-1/PD-L1 therapy.
Recently, many studies have found that the complexity and diversity of the tumor immune microenvironment (TIME) can affect the efficacy of ICBs.11 Tumor-associated macrophages (TAMs) are the key cells that create an immunosuppressive tumor microenvironment in many types of cancers.12 Notably, TAMs have been found to directly and indirectly modulate PD-1/PD-L1 expression in TIME.13 In fact, TAMs could secrete several cytokines, including IFN-γ, TNF-α, TGF-β, which can induce PD-L1 expression.14,15 In addition, TAMs can reduce the effector activity of tumor-infiltrating lymphocytes (TILs).16 Nonetheless, the relationship between PD-L1 expression and TAMs density in NPC has not been elucidated.
In the current study, we performed immunohistochemical staining of PD-L1, CD68 (pan-macrophage), and CD163 (M2-like macrophage) in 212 NPC tissues, and further examined the relationship between PD-L1 expression in tumor cells and TAMs infiltration as well as the clinicopathologic features and prognosis.
Patients and Methods
Patients
This study retrospectively evaluated 212 NPC samples from patients who received image-guided intensity-modulated radiotherapy or/and cisplatin-based concurrent chemotherapy in Nanfang Hospital (Guangzhou, China) from 2007 to 2013. Tumors were staged according to Union for International Cancer Control (UICC)/American Joint Committee on Cancer staging system (8th edition). Overall survival (OS) was calculated from the date of diagnosis to the date of death or the last follow-up. Progression-free survival (PFS) was defined as the time between the date of diagnosis and the date of tumor progression or death. All procedures were followed in accordance with the ethical standards of institutional and national committees on human experimentation and with the Helsinki Declaration of 1964 and later versions. Informed consents were obtained from all enrolled patients, and this study was approved by the Ethics Committee of Nanfang Hospital, Southern Medical University.
Immunohistochemistry
The NPC tissue samples were dewaxed in xylene and ethanol and steamed in a steamer autoclave with pH 8.0 antigen retrieval solution to retrieve antigen epitopes. Endogenous peroxidase was eliminated by 3% hydrogen peroxide, followed by blocking with 10% goat serum for 1 h. The slides were incubated at 4°C overnight with a primary antibody: an anti-human PD-L1 rabbit monoclonal antibody (dilution 1:200; clone E1L3N; Cell Signaling Technology, Danvers, MA, USA), an anti-human CD68 mouse monoclonal antibody (dilution 1:200; KP-1; Agilent, Santa Clara, CA, USA), and an anti-human CD163 mouse monoclonal antibody (dilution 1:200; NCL-L-CD163; Leica, Nussloch, Germany). The secondary antibody was a ready-to-use VECTASTAIN ABC HRP Kit (Vector Laboratories, Burlingame, CA, USA).
Immunohistochemical Scores
The slides were examined by two experienced pathologists who were unaware of the clinical data. Tumor cells and stromal cells were distinguished by cell morphology, structure, and nucleus. PD-L1 expression was evaluated on tumor cells. PD-L1-positive cells were estimated as the percentage of total tumor cells. Samples were defined as PD-L1 positive if >5% of tumor cells expressed PD-L1.17 Then, integrated optical density (IOD) of CD68/CD163 expression was performed using light microscopy examination and image analysis techniques. For each slide, five representative non-overlapping fields were captured as photomicrographs with a magnification of ×200 under identical settings of the computerized image system, which included voltage of light source, diaphragm, exposure time, gain, saturation. The captured images were transferred to a computer for image analysis. CD163 and CD68 positive areas were calculated with Image-Pro Plus v6.0 software (Media Cybernetics, Inc., Bethesda, MD) under a uniform setting. IOD of all the positive staining areas in a high magnification field (200×) was measured to give a quantitative assessment.18
Statistical Analysis
IBM SPSS Statistics 23.0 (Chicago, IL, USA) was used for all statistical analyses. All tests were two-sided, and a P-value less than 0.05 was considered statistically significant. Means were compared using the independent-sample Kruskal–Wallis test. The relations between TAMs, tumor PD-L1 expression, and clinicopathological characteristics were examined with chi-square test. Logistic regression and receiver operating characteristic (ROC) curve analyses were used to assess the predictors associated with tumor PD-L1 expression. Kaplan-Meier survival analysis was performed for survival curves and statistical significance was assessed using the Log rank test. Univariate and multivariate COX regression models were used to evaluate prognostic factors.
Results
Clinicopathological Features of the Patients
The clinical characteristics of 212 NPC patients in this study are summarized in Table 1. The median age was 46.2 years (range=17.5–75.8 years). The majority of NPC patients were men (150, 70.8%). Eighty-five (40.1%) patients were current or former smokers. Patients in stages I–II accounted for 53 (25.0%) cases, while stage III–IV included 159 (75.0%) patients. The median follow-up time was 75 months. During the follow-up, 52 patients developed tumor progression, and 62 patients died.
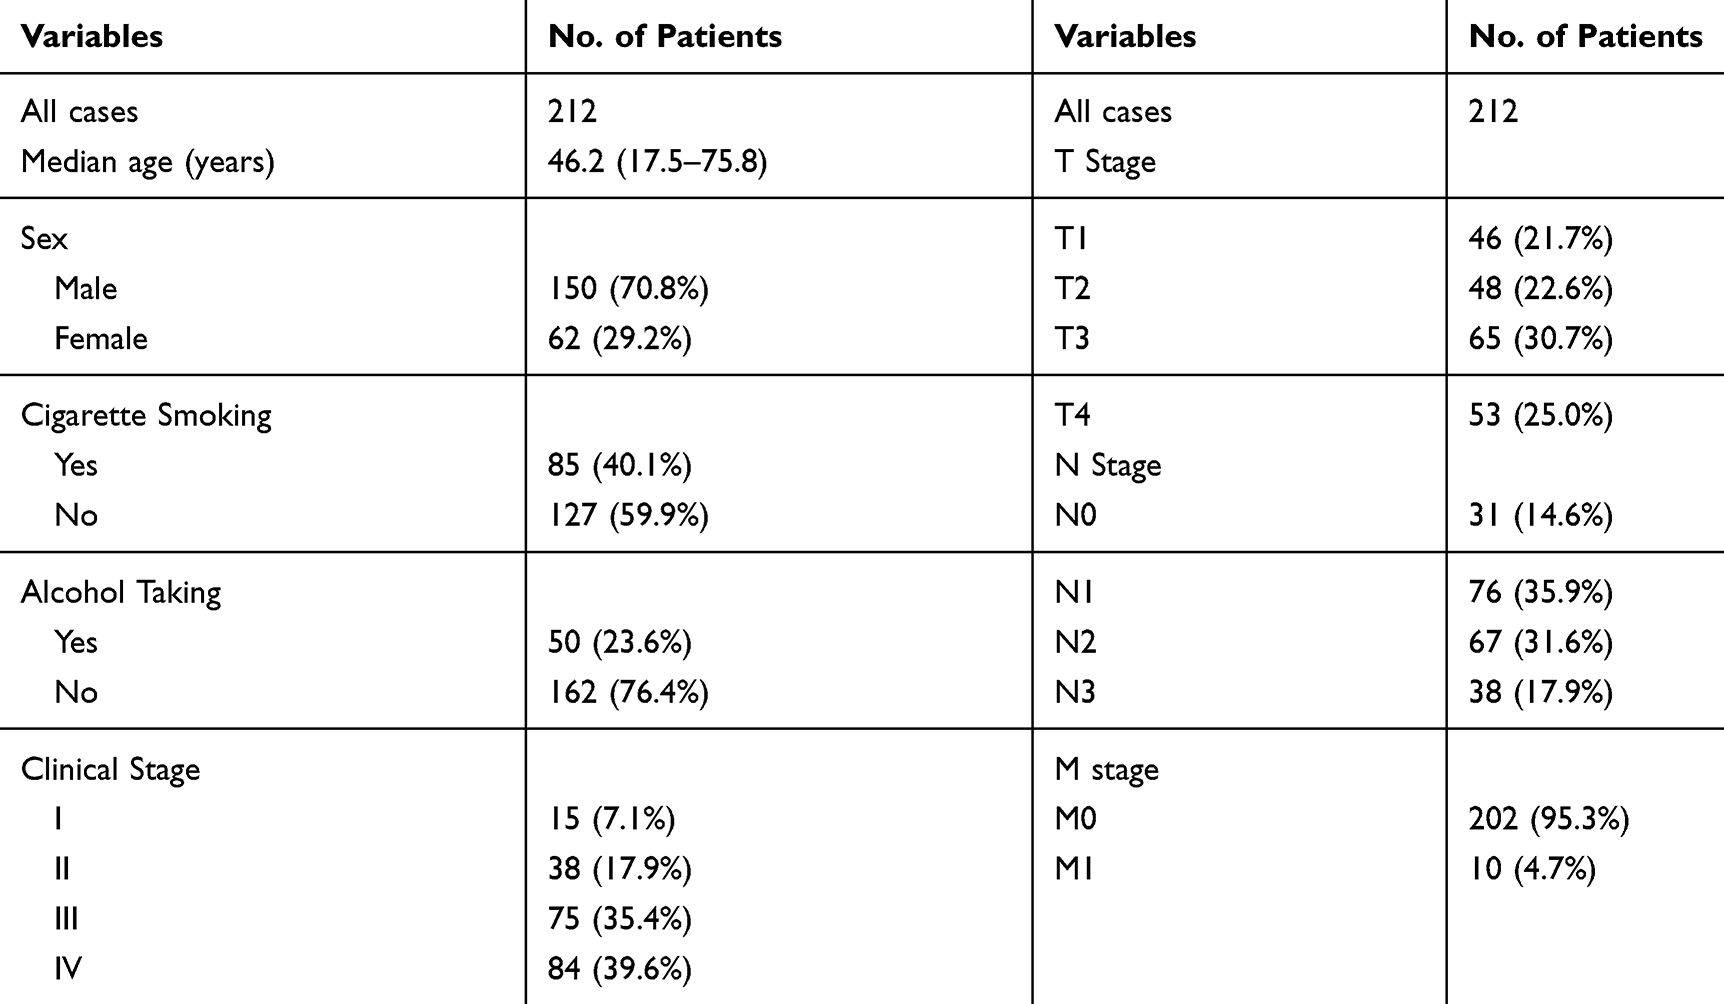 |
Table 1 The Clinicopathological Characteristics of NPC Patients Included in This Study |
Assessment of PD‑L1 Expression, CD68+ Macrophage Density and CD163+ Macrophage Density in NPC
We performed immunohistochemical staining for PD-L1, CD68, and CD163 in 212 NPC tissue samples (Figure 1). A total of 130 NPC patients (61.3%) were stained positive for PD-L1 expression in tumor cells (Table 2). Tumor PD-L1 expression was associated with clinical stage and N classification (both P<0.01), but there was no statistically significant correlation between tumor PD-L1 expression and T classification or M classification (both P>0.05, Table 2).
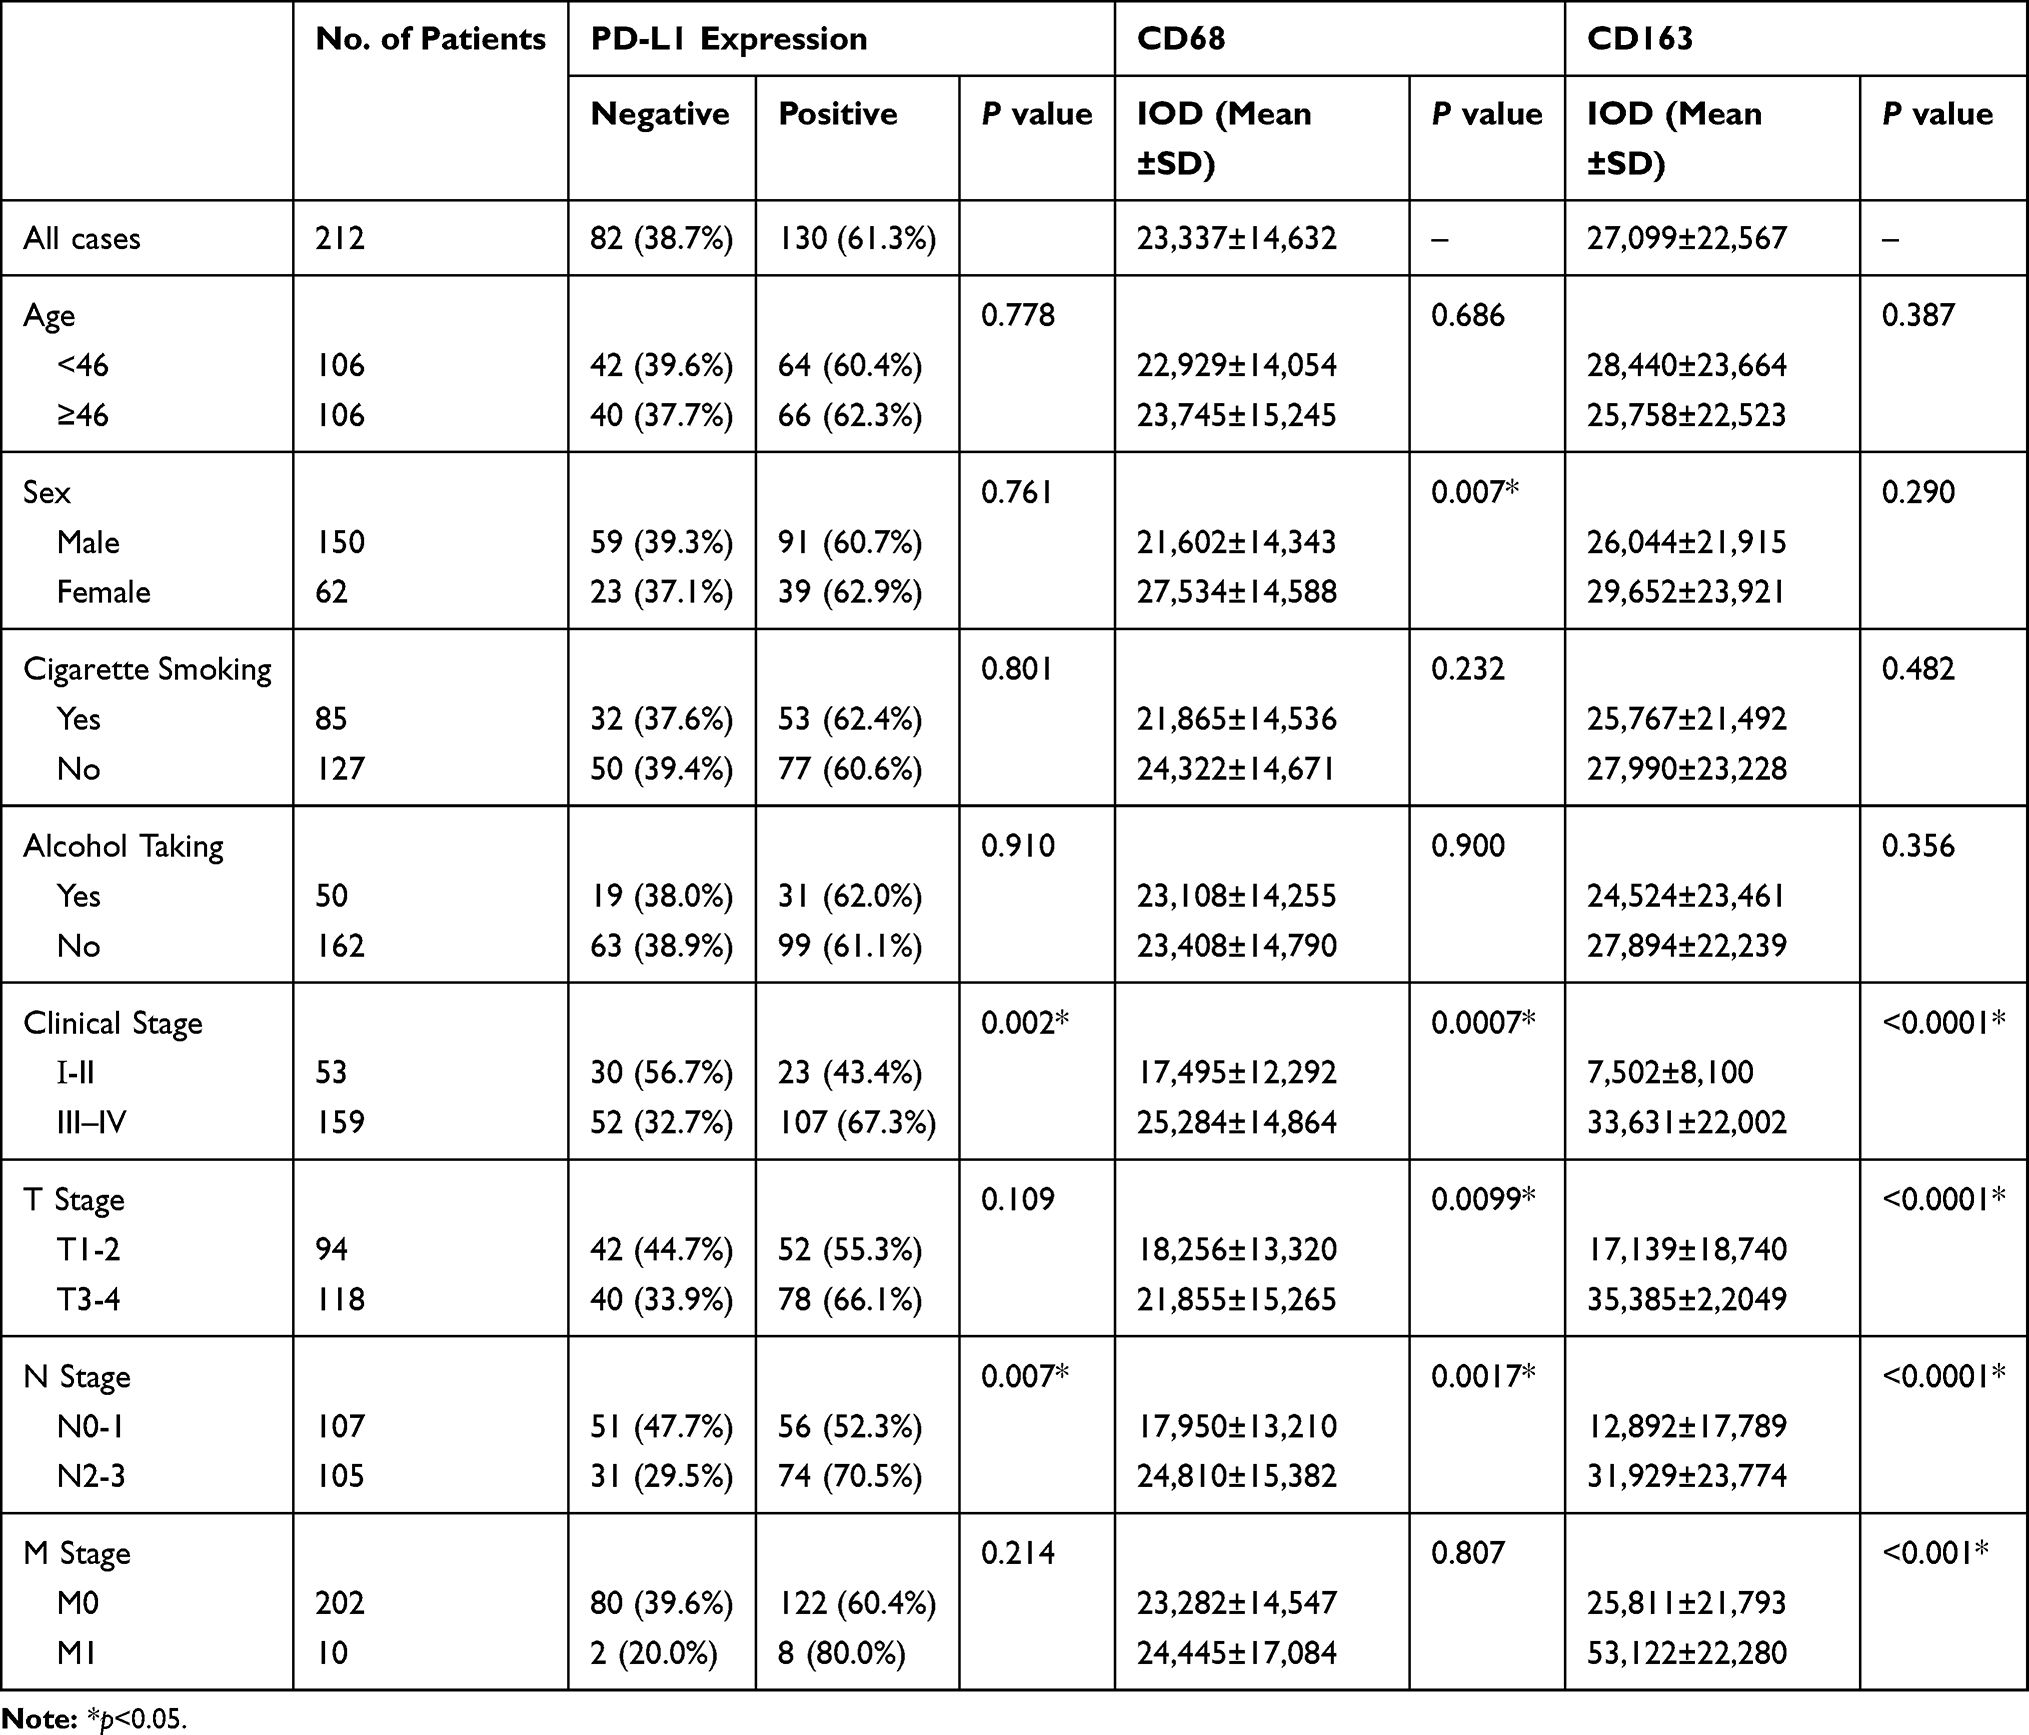 |
Table 2 PD-L1 Expression in Tumor Cells and Distribution of CD68+, CD163+ Macrophages in NPC Tumor Samples and Clinical Features |
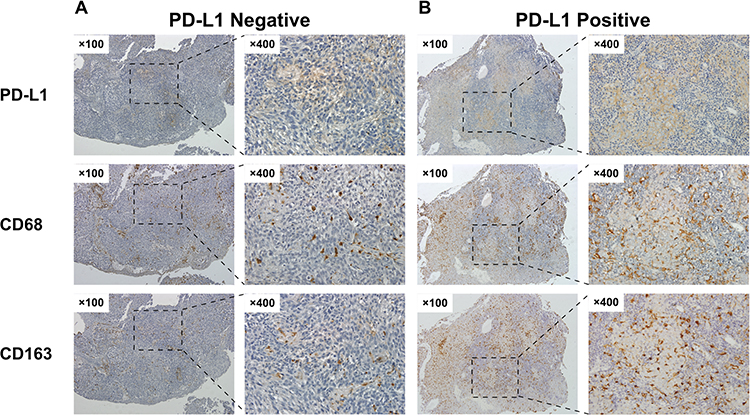 |
Figure 1 Immunohistochemistry staining of PD-L1, CD68 and CD163 expression in NPC tissues. The left panel (A) showed PD-L1 negative staining and low macrophage density. The right panel (B) showed positive PD-L1 staining and high macrophage density. |
The mean infiltration density of CD68+ macrophages was 23,337±14,632 (median, 20,133; range, 1036 to 69,580). The infiltration density of CD68+ cells was significantly correlated to clinical stage, T classification and N classification (all P<0.05; Table 2). The mean infiltration density of CD163+ TAMs was 27,099±22,567 (median, 21,178; range, 554 to 103,666). The infiltration density of CD163+ cells was significantly associated with clinical stage, T classification, N classification, and M classification (all P< 0.05; Table 2).
A Positive Correlation Between PD‑L1 Expression and CD68+ or CD163+ Macrophage Density in NPC
We next examined the associations between PD-L1 expression in tumor cells and the intratumoral densities of CD68+ and CD163+ macrophages in NPC tissue samples (Figure 2). The densities of CD68+ and CD163+ macrophages in PD-L1-positive NPC samples were significantly higher than in PD-L1-negative NPC samples (P=0.0012 for CD68; P<0.0001 for CD163). These results indicated that the infiltration density of CD163+ macrophages was more strongly related with PD-L1 expression in NPC cells than that of CD68+ cells.
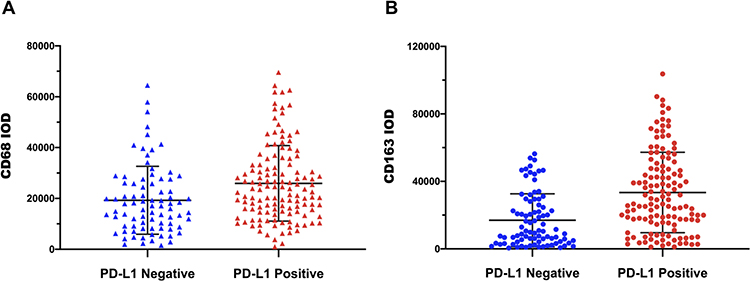 |
Figure 2 The relationships between PD-L1 expression in tumor cells and infiltration of CD68+ and CD163+ macrophages. (A) The distribution of PD-L1 expression in NPC cells and CD68+ macrophages. (B) The distribution of PD-L1 expression in NPC cells and CD163+ TAM. |
Identification of the Predictors for PD‑L1 Expression in NPC
To identify predictors for positive PD-L1 expression in NPC cells, we performed univariate and multivariate logistic regression analyses. In the univariate analysis, tumor PD-L1 expression was closely related to clinical stage (P=0.002), N classification (P=0.007), CD68+ macrophages (P=0.002), and CD163+ TAMs (P<0.001) (Table 3). The statistically significant factors in univariate analysis were included in the multivariate analysis. The results showed that tumor PD-L1 expression was independently related to CD68+ macrophages (P=0.023) and CD163+ TAMs (P=0.004) (Table 3). Factors with a P value less than 0.05 in the multivariate logistic regression analysis were then subjected to ROC analysis to calculate the area under the ROC curve (AUC). The AUC of CD163+ TAMs was 0.711 (P<0.001), and the AUC of CD68+ macrophage was 0.643 (P<0.001; Figure 3). These results suggested that the infiltration density of CD163+ TAMs had a higher accuracy for predicting tumor PD-L1 expression than CD68+ cells in NPC.
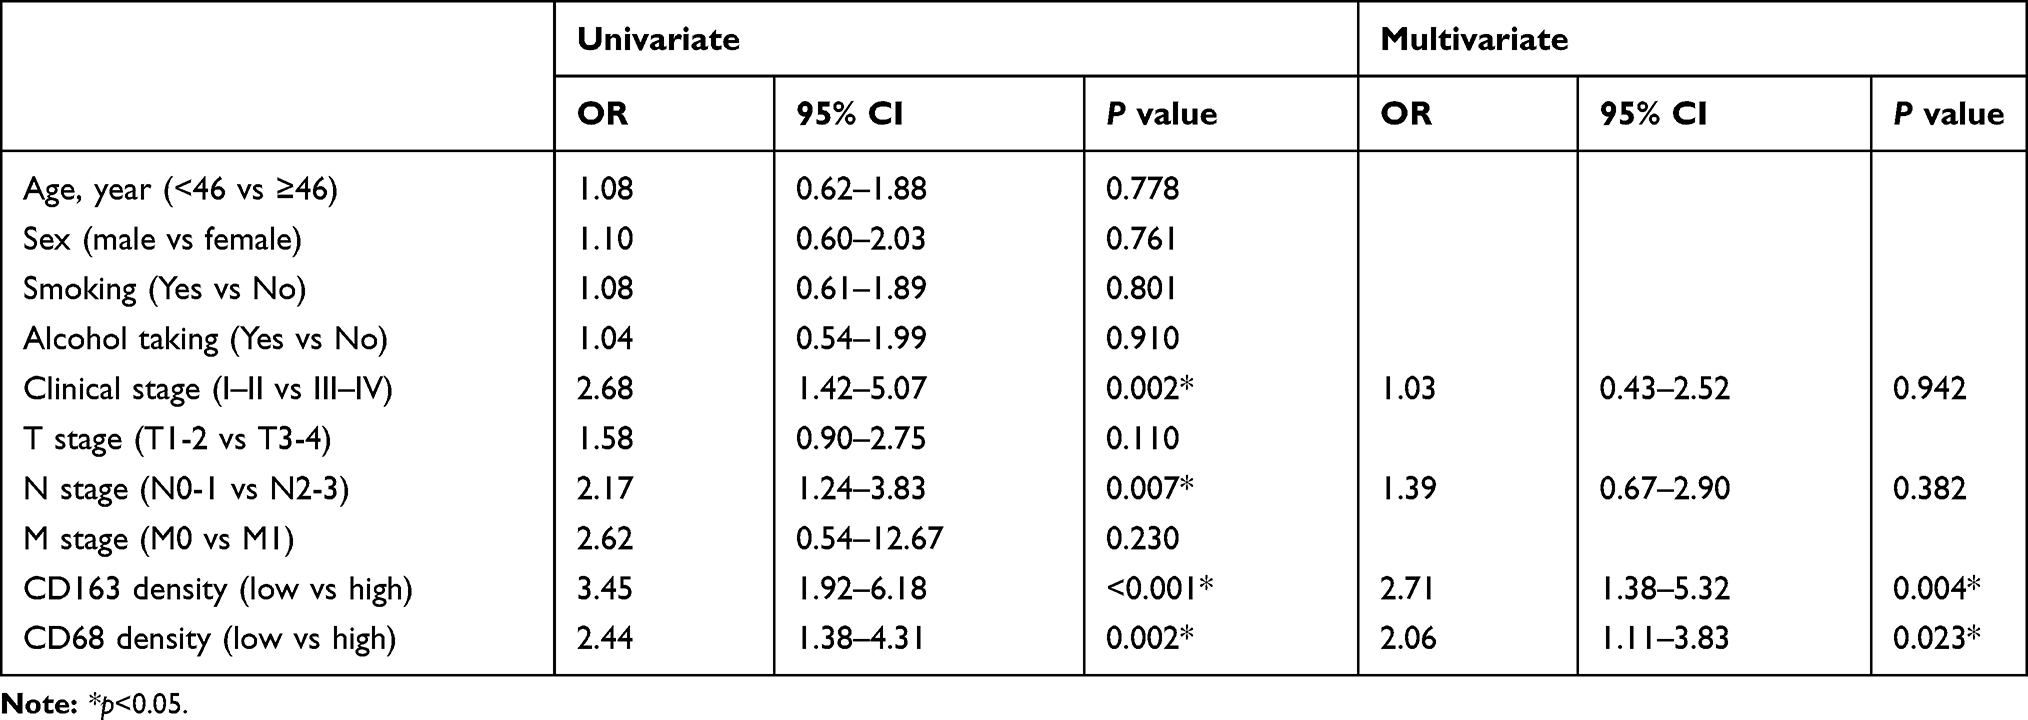 |
Table 3 Univariate and Multivariate Analysis of Predictive Factors Associated with PD-L1 Expression in NPC Cells |
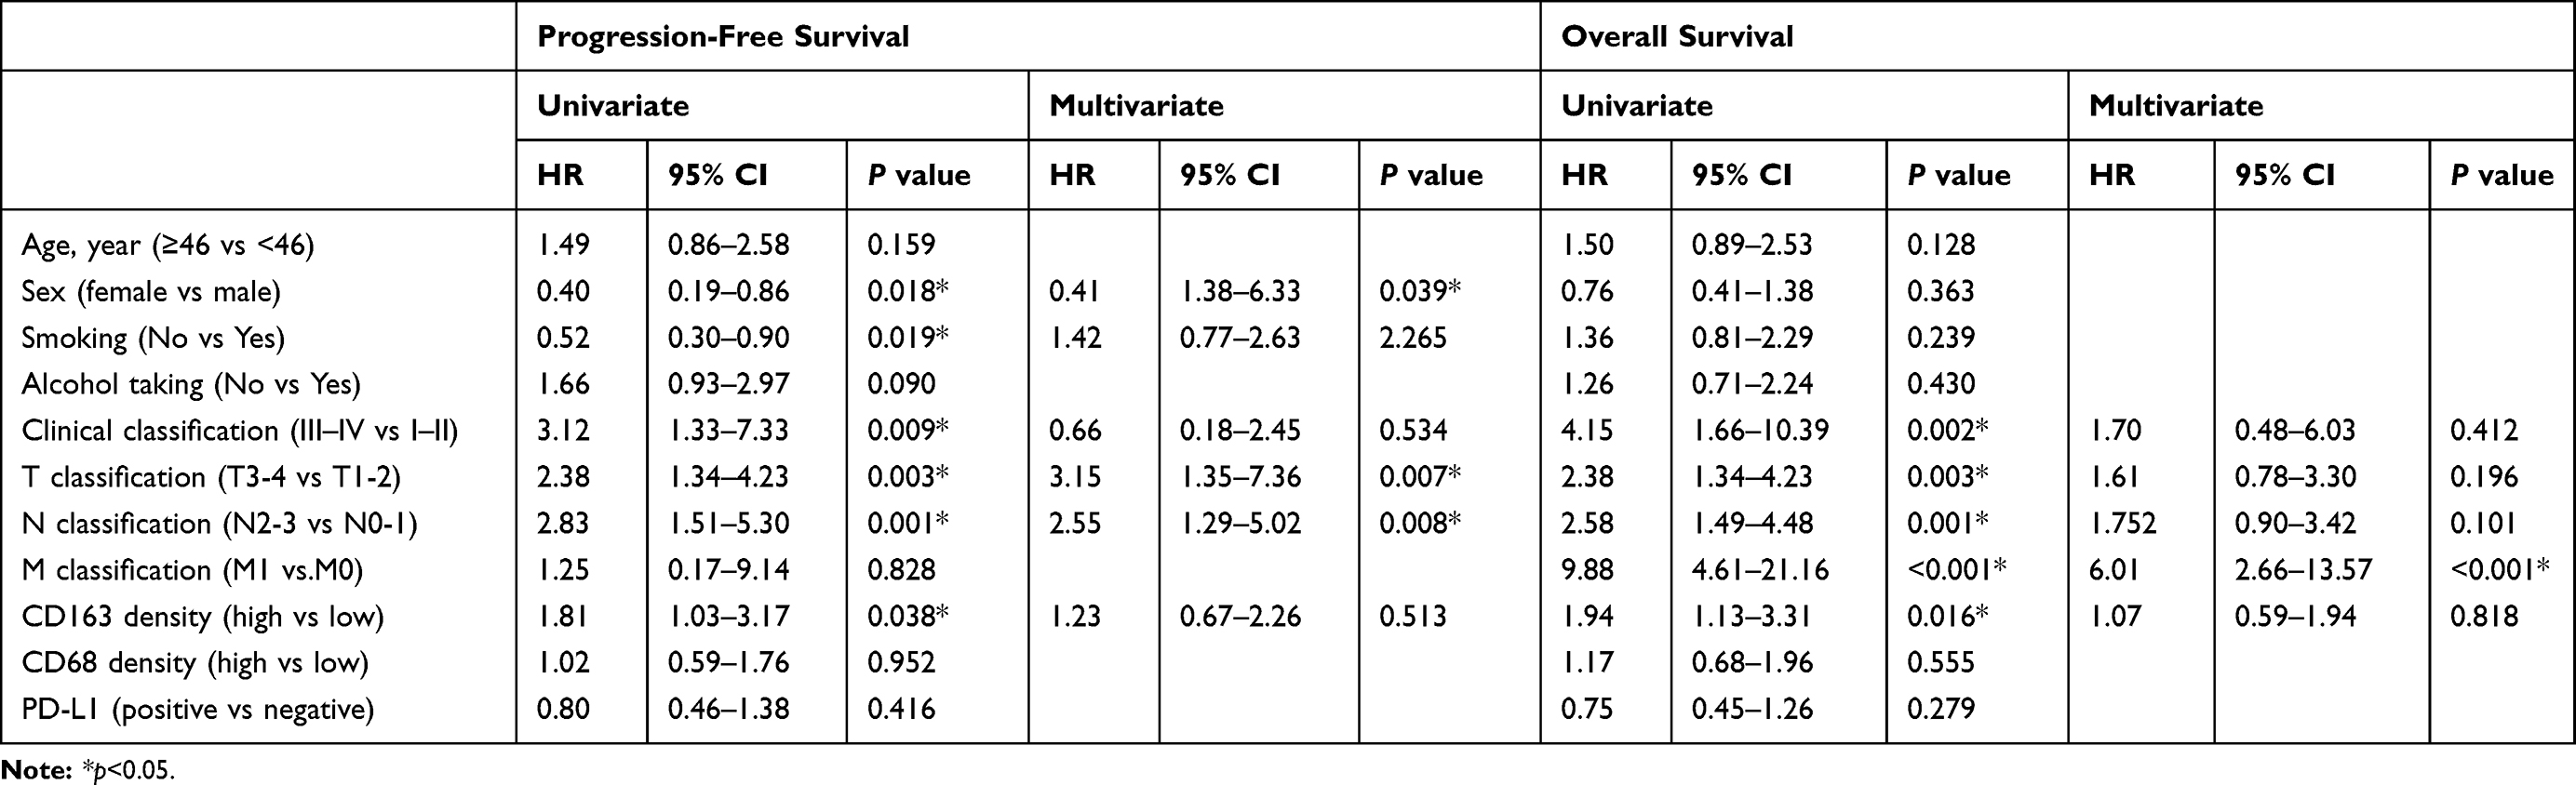 |
Table 4 Cox Proportional Hazard Models on PFS and OS of NPC Patients |
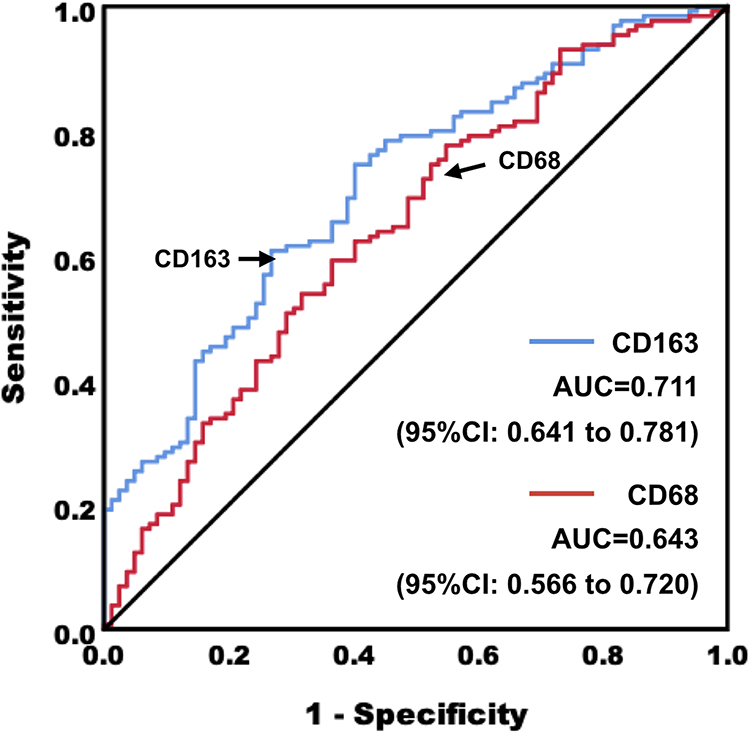 |
Figure 3 The predictive accuracy of CD163+ TAMs and CD68+ macrophages on PD-L1 expression in NPC tissue samples. |
Combination of PD-L1 Expression and TAMs Infiltration Density for Survival Analysis
The median follow-up time was 75 months. Among the 212 enrolled patients, 62 patients died, 185 patients had complete follow-up, and 27 patients were lost to follow-up. Our results showed that PD-L1 expression level in NPC tumor cells was not associated with patients’ outcome (Figure 4A and B). In addition, there was no significant difference in OS or PFS between the low CD68 expression group and high CD68 expression group (Figure 4C and D). However, the patients with high CD163 expression level had a worse prognosis than those with low CD163 expression (Figure 4E and F).
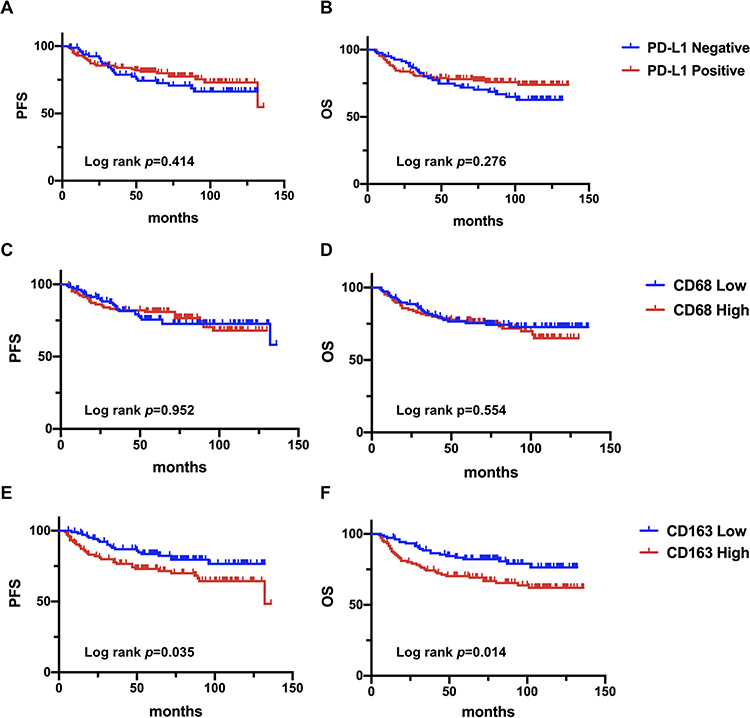 |
Figure 4 Kaplan–Meier curves of OS and PFS in NPC patients based on PD-L1 expression in tumor cells (A, B), CD68 expression (C, D) and CD163 expression (E, F). |
We also performed subgroup analyses to determine whether the combination of PD-L1 expression on tumor cells and CD163+ TAMs density could be used for prognosis. Based on the combination of PD-L1 expression and CD163+ TAMs density, all the patients were divided into 4 subgroups as follows: PD-L1 positive/CD163 high, PD-L1 positive/CD163 low, PD-L1 negative/CD163 high and PD-L1 negative/CD163 low. Kaplan–Meier curves of PFS and OS for each of the 4 subgroups are shown in Figure 5. A positive PD-L1 expression on tumor cells in combination with lower CD163+ TAMs density was significantly associated with favorable prognosis (P<0.05), whereas negative PD-L1 expression on tumor cells with higher CD163+ TAMs density was associated with worse prognosis (P<0.05). In addition, the subgroup of PD-L1 positive/CD163 low showed a more favorable OS or PFS compared to the subgroup of PD-L1 positive/CD163 high (P<0.05).
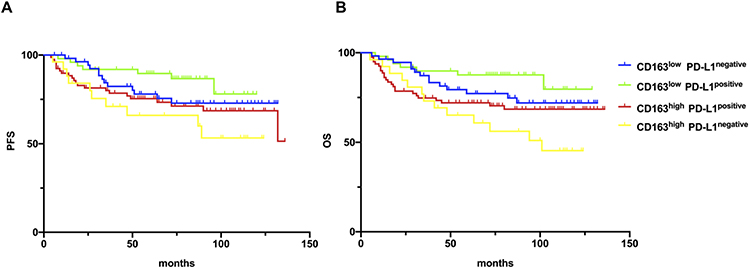 |
Figure 5 Kaplan–Meier analysis of PFA (A) and OS (B) in the 4 subgroups classified by PD-L1 expression on tumor cells and CD163+ TAMs density. |
We next performed univariate and multivariate analysis of Cox proportional hazard model to analyze the prognostic value of PD-L1, CD68, and CD163 expression and other clinicopathological variables. In the univariate analysis, sex, smoking, clinical stage, T classification, N classification, and CD163+ TAMs density showed significant correlation to PFS of NPC patients (P=0.018, 0.019, 0.009, 0.003, 0.001, and 0.038, respectively; Table 5). Moreover, clinical stage, T classification, N classification, M classification, and CD163+ TAMs density showed significant correlation to OS of NPC patients (P=0.002, 0.003, 0.001, <0.001 and 0.016, respectively; Table 6). The independent prognostic value was examined by multivariate analysis. The results found that M classification was an independent prognosis factor for OS of NPC patients (P<0.001, Table 6). Sex, T classification, and N classification were independent prognosis factors for PFS of NPC patients (P=0.039, 0.007, and 0.008, respectively; Table 5).
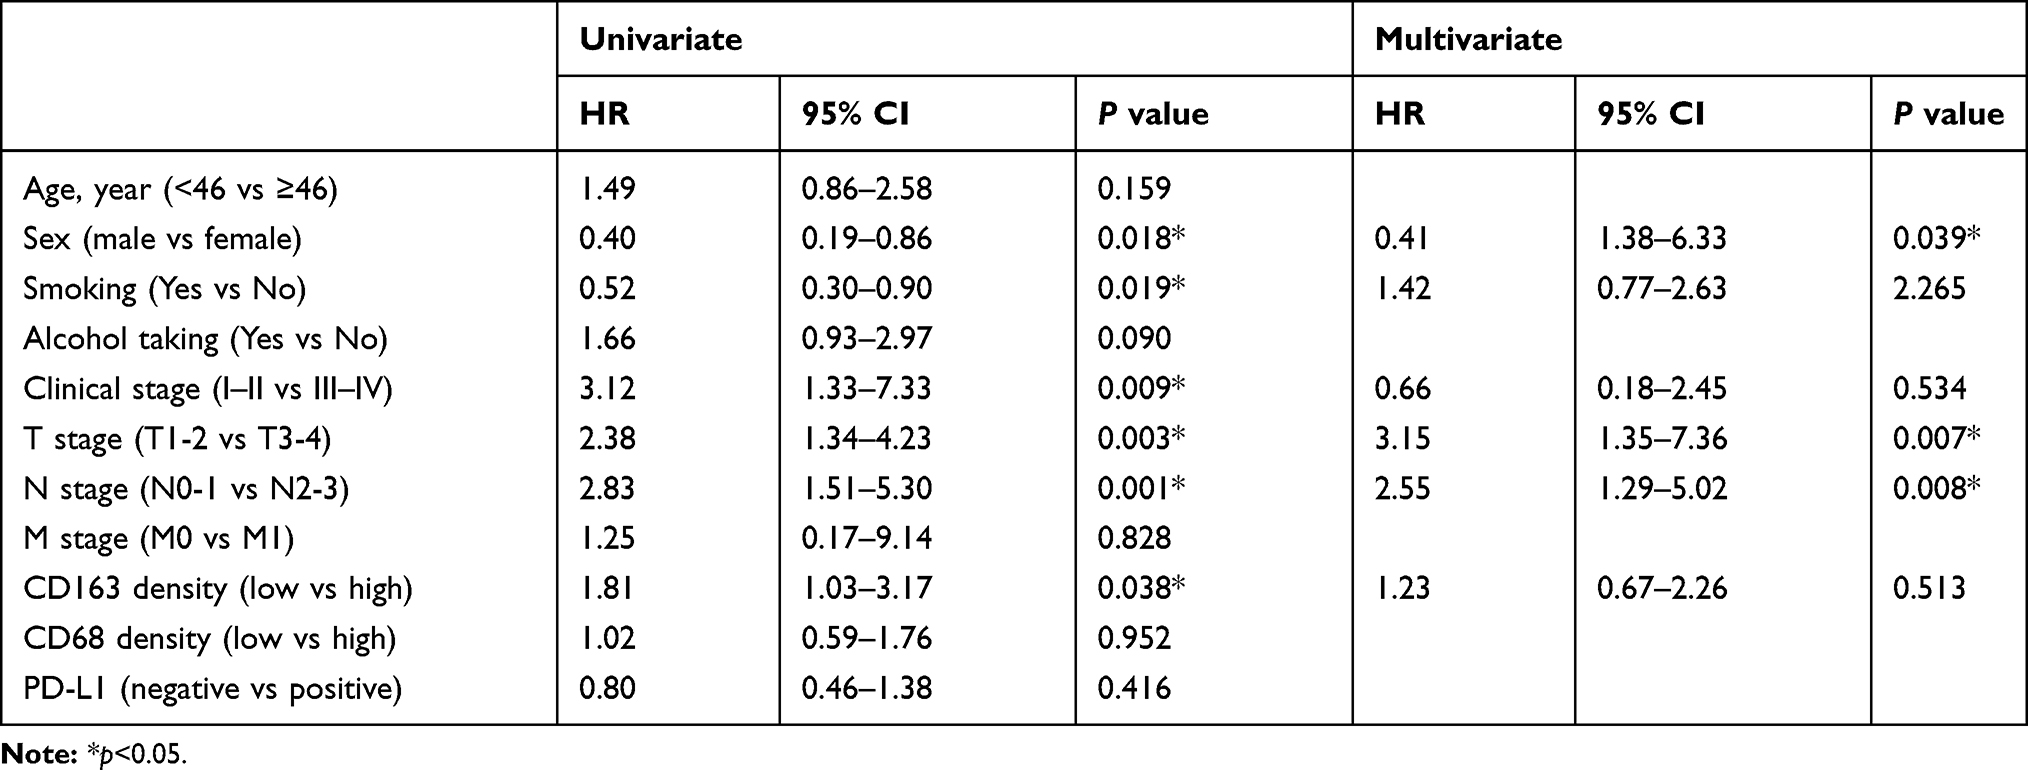 |
Table 5 Cox Proportional Hazard Models on PFS of NPC Patients |
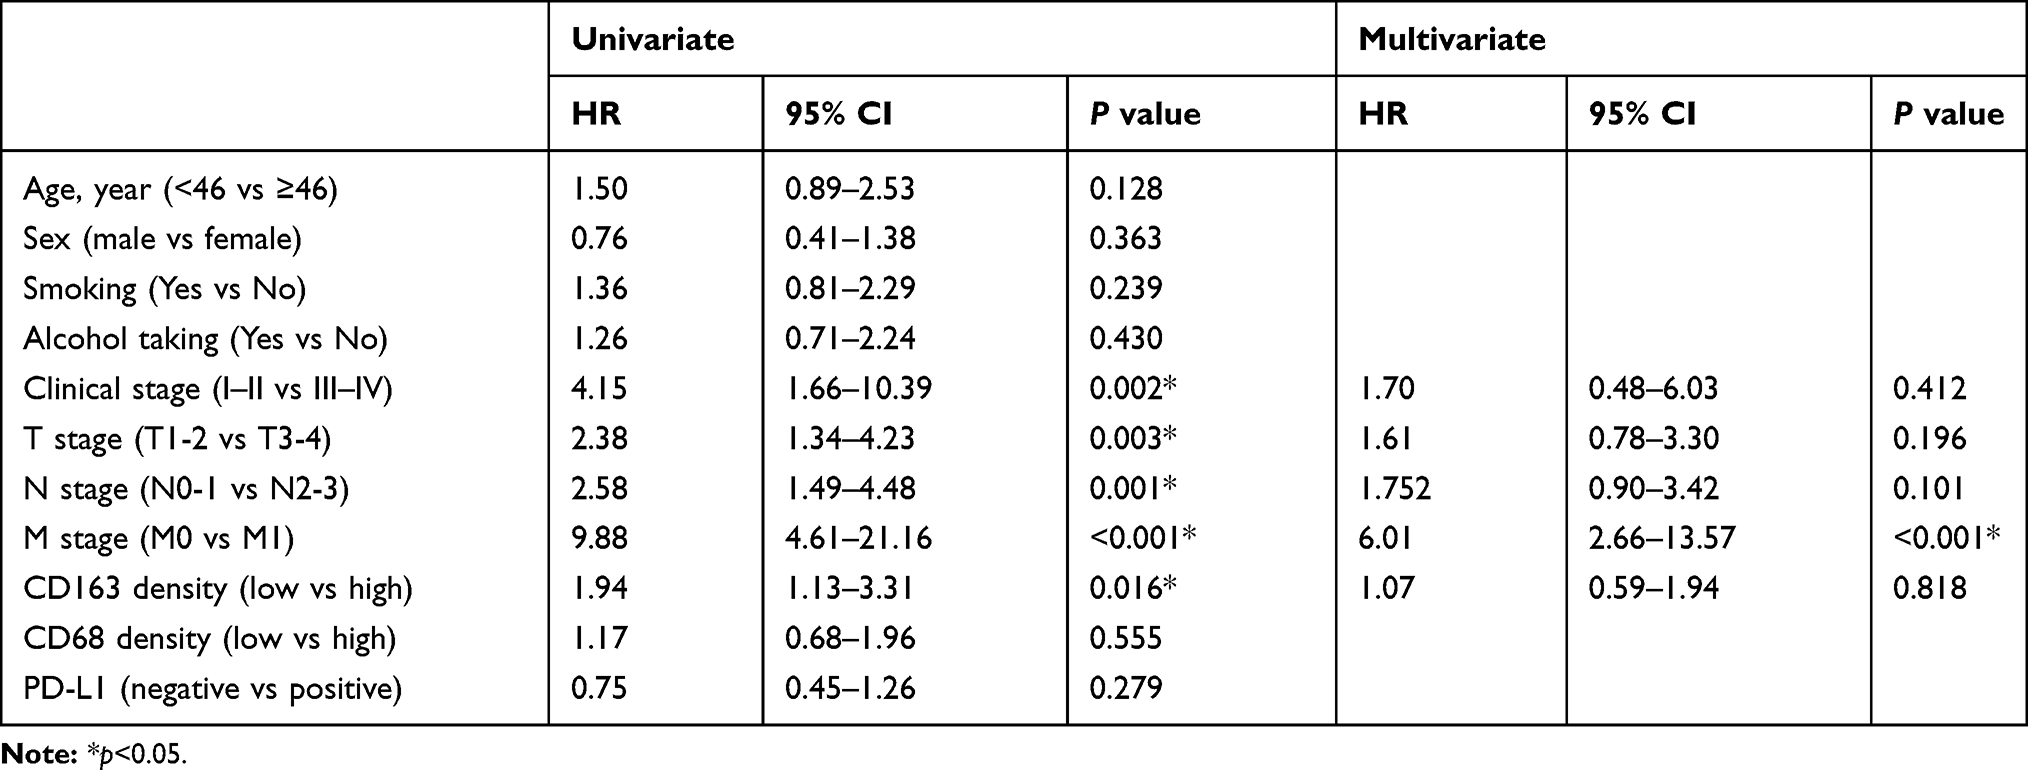 |
Table 6 Cox Proportional Hazard Models on OS of NPC Patients |
Discussion
Recently, IGBs treatment such as anti-PD-1/PD-L1 therapy, has been highlighted as a prominent strategy for NPC patients. PD-L1 expression level can potentially predict immunotherapy efficacy. However, not every patient will respond to PD-1/PD-L1 inhibitors, which poses an urgent need to identify the regulatory mechanisms of PD-L1 expression. As a critical player in TIME, TAMs can stimulate tumor PD-L1 expression at the cellular level. In this study, we first identified a positive correlation between PD-L1 expression in tumor cells and TAMs infiltration density in NPC tissues, suggesting that TAMs infiltration could be used as a predictive marker for PD-L1 expression.
Multiple studies have reported that NPC tumor cells highly express PD-L1, with a positive expression rate from 89% to 100%.19 In our study, it was only about 61%. The positive rate of PD-L1 expression may vary among studies for many reasons, including tumor heterogeneity, sample size, baseline, treatment options, antibodies, test methods, scoring standards, and positive cutoff values.20 Ono Tet al analyzed PD-L1 expression in 66 NPC patients using a cutoff value of PD-L1≥5%, and the positive rate was 80%.21 Larbcharoensubet al detected PD-L1 expression in 114 NPC patients using a cutoff point of PD-L1≥1%, and the positive rate was 69%.22 Zhou et al analyzed PD-L1 expression in 132 patients with locally recurrent NPC and found that 128 (97%) patients had a high tumor PD-L1 expression.23 Considering these variations in previous studies, we considered that the positive rate of PD-L1 expression in our study was valid.
No correlation between PD-L1 expression and prognosis was found in this study. Some reports showed that the patients with high PD-L1 expression possessed a worse prognosis than those with low PD-L1 expression.24 In contrast, Lee et al found that only 25% of NPC tumor cells expressed PD-L1 and high expression of PD-L1 meant better local recurrence-free survival and disease-free survival.25 A recent meta-analysis indicated that higher/positive expression of PD-L1/PD-1 might not serve as suitable biomarkers for the prognosis of NPC.26 Further studies are needed to confirm the prognostic value of PD-L1 expression in NPC tissues.
It is well-known that TAMs release cytokines and chemokines that can promote tumor growth and metastasis, induce angiogenesis, enhance resistance to chemotherapy or radiotherapy, and activate immunosuppression.27 Moreover, TAMs infiltration is strongly associated with poor survival in solid tumor patients.28 In our study, our results showed that the infiltration density of CD163+ TAMs was significantly associated with clinical stage, T classification, N classification, and M classification. Additionally, the patients with high CD163 expression level had a worse prognosis than those with low CD163 expression. Our data were consistent with other published studies in NPC.29,30
The association between TAMs and PD-L1 expression in tumor cells is not yet well understood. In breast cancer, TAMs secreted TNF-α, activated downstream p65 pathways, and promoted the deubiquitination of PD-L1, which enabled the continuous and stable expression of tumor PD-L1 and thus mediated tumor immune escape.31 In pancreatic cancer, TAMs released TNF-α to upregulate PD-L1 expression in tumor cells through NF-κB pathway.32 In lung cancer, TAMs could induce PD-L1 expression by secretion of IFN-γ through JAK/STAT3 and PI3K/AKT signaling pathways.33 Interestingly, TAMs infiltration was highly associated with PD‑L1 expression in gastric cancer, lung cancer, and esophageal cancer.34–36 However, no previous reports have addressed TAMs stimulation of PD-L1 expression in NPC. In this study, we demonstrated a novel relationship between TAMs infiltration and PD-L1 expression in NPC cells. The mechanisms by which TAMs activated PD-L1 expression in NPC cells required further research in future. In addition, our present study also found that the PD-L1 positive/CD163 low subgroup exhibited better prognosis, and PD-L1 negative/CD163 high subgroup showed worse prognosis. These findings support a significant role of TAMs and PD-L1 crosstalk in NPC pathogenesis and bring new insights to immunotherapy of NPC.
TAMs are recruited in large numbers to tumors, where they undergo adaptions to promote immunosuppression. Preclinical studies have identified critical pathways to regulate the recruitment, polarization, and metabolism of TAMs during tumor growth and progression. Moreover, novel strategies targeting these pathways, such as CSF1R, CCR2, CD47/SIRP1a, PI3Kγ, BTK, and HDAC, can indirectly stimulate TILs activation and recruitment, and synergize with ICBs, chemotherapy, and/or radiation therapy in preclinical studies.12 An ongoing clinical trial is currently evaluating the combination of CSF-1R antagonists and a PD-1/PD-L1 inhibitor (NCT02323191). Therefore, clarifying the association between TAMs and PD-L1 expression is imperative. In our study, TAMs infiltration was associated with the upregulation of PD-L1 expression in NPC cells. These findings suggest that novel therapy targeting TAMs may reduce tumor cell PD-L1 expression and enhance the therapeutic efficiency of PD-1/PD-L1 blockade.
Conclusion
Our findings firstly identified a positive correlation between tumor cell PD-L1 expression and TAMs infiltration density, suggesting the possibility of inhibiting aberrant PD-L1 induction by blocking TAMs activation.
Acknowledgments
The work was supported by the National Natural Science Foundation of China (No. 81472535) and the Natural Science Foundation of Guangdong Province (No. 2020A1515010176, 2019A1515010968, and 2018A030313572).
Disclosure
The authors report no conflicts of interest in this work.
References
1. Zou X, You R, Liu H, et al. Establishment and validation of M1 stage subdivisions for de novo metastatic nasopharyngeal carcinoma to better predict prognosis and guide treatment. Eur J Cancer. 2017;77:117–126. doi:10.1016/j.ejca.2017.02.029
2. Chen YP, Chan ATC, Le QT, Blanchard P, Sun Y, Ma J. Nasopharyngeal carcinoma. Lancet. 2019;394(10192):64–80. doi:10.1016/S0140-6736(19)30956-0
3. Tan T, Lim WT, Fong KW, et al. Concurrent chemo-radiation with or without induction gemcitabine, carboplatin, and paclitaxel: a randomized, Phase 2/3 trial in locally advanced nasopharyngeal carcinoma. Int J Radiat Oncol Biol Phys. 2015;91(5):952–960. doi:10.1016/j.ijrobp.2015.01.002
4. Hsu JM, Li CW, Lai YJ, Hung MC. Posttranslational modifications of PD-L1 and their applications in cancer therapy. Cancer Res. 2018;78(22):6349–6353. doi:10.1158/0008-5472.CAN-18-1892
5. Fang W, Yang Y, Ma Y, et al. Camrelizumab (SHR-1210) alone or in combination with gemcitabine plus cisplatin for nasopharyngeal carcinoma: results from two single-arm, Phase 1 trials. Lancet Oncol. 2018;19(10):1338–1350. doi:10.1016/S1470-2045(18)30495-9
6. Ma BBY, Lim WT, Goh BC, et al. Antitumor activity of nivolumab in recurrent and metastatic nasopharyngeal carcinoma: an international, multicenter study of the mayo clinic phase 2 consortium (NCI-9742). J Clin Oncol. 2018;36(14):1412–1418. doi:10.1200/JCO.2017.77.0388
7. Hsu C, Lee SH, Ejadi S, et al. Safety and antitumor activity of pembrolizumab in patients with programmed death-ligand 1-positive nasopharyngeal carcinoma: results of the KEYNOTE-028 study. J Clin Oncol. 2017;35(36):4050–4056. doi:10.1200/JCO.2017.73.3675
8. Liu X, Shan C, Song Y, Du J. Prognostic value of programmed cell death ligand-1 expression in nasopharyngeal carcinoma: a meta-analysis of 1315 patients. Front Oncol. 2019;9:1111. doi:10.3389/fonc.2019.01111
9. Wu Y, Chen W, Xu ZP, Gu W. PD-L1 distribution and perspective for cancer immunotherapy-blockade, knockdown, or inhibition. Front Immunol. 2019;10:2022.
10. Hanna GJ, Lizotte P, Cavanaugh M, et al. Frameshift events predict anti-PD-1/L1 response in head and neck cancer. JCI Insight. 2018;3(4):e98811. doi:10.1172/jci.insight.98811
11. Jiang X, Wang J, Deng X, et al. Role of the tumor microenvironment in PD-L1/PD-1-mediated tumor immune escape. Mol Cancer. 2019;18(1):10. doi:10.1186/s12943-018-0928-4
12. Cassetta L, Pollard JW. Targeting macrophages: therapeutic approaches in cancer. Nat Rev Drug Discov. 2018;17(12):887–904.
13. Havel JJ, Chowell D, Chan TA. The evolving landscape of biomarkers for checkpoint inhibitor immunotherapy. Nat Rev Cancer. 2019;19(3):133–150.
14. Weiskopf K, Weissman IL. Macrophages are critical effectors of antibody therapies for cancer. MAbs. 2015;7(2):303–310. doi:10.1080/19420862.2015.1011450
15. Arlauckas SP, Garris CS, Kohler RH, et al. In vivo imaging reveals a tumor-associated macrophage-mediated resistance pathway in anti-PD-1 therapy. Sci Transl Med. 2017;9(389):eaal3604. doi:10.1126/scitranslmed.aal3604
16. Ruffell B, Coussens LM. Macrophages and therapeutic resistance in cancer. Cancer Cell. 2015;27(4):462–472. doi:10.1016/j.ccell.2015.02.015
17. Herbst RS, Soria JC, Kowanetz M, et al. Predictive correlates of response to the anti-PD-L1 antibody MPDL3280A in cancer patients. Nature. 2014;515(7528):563–567. doi:10.1038/nature14011
18. Du P, Ma Q, Zhu ZD, et al. Mechanism of Corilagin interference with IL-13/STAT6 signaling pathways in hepatic alternative activation macrophages in schistosomiasis-induced liver fibrosis in mouse model. Eur J Pharmacol. 2016;793:119–126. doi:10.1016/j.ejphar.2016.11.018
19. Wotman M, Herman SW, Costantino P, Tham T. The prognostic role of programmed death-ligand 1 in nasopharyngeal carcinoma. Laryngoscope. 2020. doi:10.1002/lary.28523.
20. Lu S, Stein JE, Rimm DL, et al. Comparison of biomarker modalities for predicting response to PD-1/PD-L1 checkpoint blockade: a systematic review and meta-analysis. JAMA Oncol. 2019;5(8):1195–1204. doi:10.1001/jamaoncol.2019.1549
21. Ono T, Azuma K, Kawahara A, et al. Prognostic stratification of patients with nasopharyngeal carcinoma based on tumor immune microenvironment. Head Neck. 2018;40(9):2007–2019. doi:10.1002/hed.25189
22. Larbcharoensub N, Mahaprom K, Jiarpinitnun C, et al. Characterization of PD-L1 and PD-1 expression and CD8+ tumor-infiltrating lymphocyte in epstein-barr virus-associated nasopharyngeal carcinoma. Am J Clin Oncol. 2018;41(12):1204–1210. doi:10.1097/COC.0000000000000449
23. Zhou Y, Miao J, Wu H, et al. PD-1 and PD-L1 expression in 132 recurrent nasopharyngeal carcinoma: the correlation with anemia and outcomes. Oncotarget. 2017;8(31):51210–51223. doi:10.18632/oncotarget.17214
24. Zhou Y, Shi D, Miao J, et al. PD-L1 predicts poor prognosis for nasopharyngeal carcinoma irrespective of PD-1 and EBV-DNA load. Sci Rep. 2017;7:43627. doi:10.1038/srep43627
25. Lee VH, Lo AW, Leung CY, et al. Correlation of PD-L1 expression of tumor cells with survival outcomes after radical intensity-modulated radiation therapy for non-metastatic nasopharyngeal carcinoma. PLoS One. 2016;11(6):e0157969. doi:10.1371/journal.pone.0157969
26. Huang ZL, Liu S, Wang GN, et al. The prognostic significance of PD-L1 and PD-1 expression in patients with nasopharyngeal carcinoma: a systematic review and meta-analysis. Cancer Cell Int. 2019;19:141. doi:10.1186/s12935-019-0863-5
27. Chen Y, Song Y, Du W, Gong L, Chang H, Zou Z. Tumor-associated macrophages: an accomplice in solid tumor progression. J Biomed Sci. 2019;26(1):78. doi:10.1186/s12929-019-0568-z
28. Lin Y, Xu J, Lan H. Tumor-associated macrophages in tumor metastasis: biological roles and clinical therapeutic applications. J Hematol Oncol. 2019;12(1):76. doi:10.1186/s13045-019-0760-3
29. Yu Y, Ke L, Lv X, et al. The prognostic significance of carcinoma-associated fibroblasts and tumor-associated macrophages in nasopharyngeal carcinoma. Cancer Manag Res. 2018;10:1935–1946. doi:10.2147/CMAR.S167071
30. Huang H, Liu X, Zhao F, et al. M2-polarized tumour-associated macrophages in stroma correlate with poor prognosis and Epstein-Barr viral infection in nasopharyngeal carcinoma. Acta Otolaryngol. 2017;137(8):888–894. doi:10.1080/00016489.2017.1296585
31. Lim SO, Li CW, Xia W, et al. Deubiquitination and Stabilization of PD-L1 by CSN5. Cancer Cell. 2016;30(6):925–939. doi:10.1016/j.ccell.2016.10.010
32. Tsukamoto M, Imai K, Ishimoto T, et al. PD-L1 expression enhancement by infiltrating macrophage-derived tumor necrosis factor-α leads to poor pancreatic cancer prognosis. Cancer Sci. 2019;110(1):310–320.
33. Zhang X, Zeng Y, Qu Q, et al. PD-L1 induced by IFN-γ from tumor-associated macrophages via the JAK/STAT3 and PI3K/AKT signaling pathways promoted progression of lung cancer. Int J Clin Oncol. 2017;22(6):1026–1033.
34. Yagi T, Baba Y, Okadome K, et al. Tumour-associated macrophages are associated with poor prognosis and programmed death ligand 1 expression in oesophageal cancer. Eur J Cancer. 2019;111:38–49. doi:10.1016/j.ejca.2019.01.018
35. Harada K, Dong X, Estrella JS, et al. Tumor-associated macrophage infiltration is highly associated with PD-L1 expression in gastric adenocarcinoma. Gastric Cancer. 2018;21(1):31–40. doi:10.1007/s10120-017-0760-3
36. Sumitomo R, Hirai T, Fujita M, Murakami H, Otake Y, Huang CL. PD-L1 expression on tumor-infiltrating immune cells is highly associated with M2 TAM and aggressive malignant potential in patients with resected non-small cell lung cancer. Lung Cancer. 2019;136:136–144. doi:10.1016/j.lungcan.2019.08.023
 © 2020 The Author(s). This work is published and licensed by Dove Medical Press Limited. The
full terms of this license are available at https://www.dovepress.com/terms
and incorporate the Creative Commons Attribution
- Non Commercial (unported, 3.0) License.
By accessing the work you hereby accept the Terms. Non-commercial uses of the work are permitted
without any further permission from Dove Medical Press Limited, provided the work is properly
attributed. For permission for commercial use of this work, please see paragraphs 4.2 and 5 of our Terms.
© 2020 The Author(s). This work is published and licensed by Dove Medical Press Limited. The
full terms of this license are available at https://www.dovepress.com/terms
and incorporate the Creative Commons Attribution
- Non Commercial (unported, 3.0) License.
By accessing the work you hereby accept the Terms. Non-commercial uses of the work are permitted
without any further permission from Dove Medical Press Limited, provided the work is properly
attributed. For permission for commercial use of this work, please see paragraphs 4.2 and 5 of our Terms.