Back to Journals » Infection and Drug Resistance » Volume 16
Parameters and Morphological Changes of Erythrocytes and Platelets of COVID-19 Subjects: A Longitudinal Cohort Study
Authors Shen L, Chen L, Chi H, Luo L, Ruan J, Zhao X, Jiang Y, Tung TH, Zhu H, Zhou K, Shen B ![]() , Xu J
, Xu J
Received 21 December 2022
Accepted for publication 25 February 2023
Published 23 March 2023 Volume 2023:16 Pages 1657—1668
DOI https://doi.org/10.2147/IDR.S400735
Checked for plagiarism Yes
Review by Single anonymous peer review
Peer reviewer comments 2
Editor who approved publication: Prof. Dr. Héctor Mora-Montes
Liping Shen,1,* Linping Chen,1,* Hongbo Chi,1 Lifei Luo,1 Jinsu Ruan,1 Xinzhuan Zhao,1 Yi Jiang,1 Tao-Hsin Tung,2 Hongguo Zhu,1 Kai Zhou,1 Bo Shen,1 Jiaqin Xu1
1Department of Clinical Laboratory, Taizhou Hospital of Zhejiang Province Affiliated to Wenzhou Medical University, Taizhou, People’s Republic of China; 2Evidence-Based Medicine Center, Taizhou Hospital of Zhejiang Province Affiliated to Wenzhou Medical University, Taizhou, People’s Republic of China
*These authors contributed equally to this work
Correspondence: Jiaqin Xu; Bo Shen, Department of Clinical Laboratory, Taizhou Hospital of Zhejiang Province Affiliated to Wenzhou Medical University, Taizhou, People’s Republic of China, Tel +86-13968607148 ; +86 13586121278, Email [email protected]; [email protected]
Purpose: Information about dynamic changes occurring in the parameters and morphology of erythrocytes and platelets during the coronavirus disease 2019 (COVID-19) infection and convalescence is scarce. To explore potential associations between dynamic erythrocyte and platelet parameters, morphological changes, and the course or severity of the disease is essential.
Patients and Methods: From January 17th, 2020, to February 20th, 2022, we followed up on 35 patients with non-severe and 11 patients with severe COVID-19 following their discharge. We collected clinical features, dynamic complete blood count (CBC), and peripheral blood smears (PBS) and analyzed parameter and morphological changes of erythrocytes and platelets depending on the course or severity of the disease. The course of the disease included four periods, namely onset (T1), discharge (T2), 1-year follow-up (T3), and 2-year follow-up (T4).
Results: Red blood cell (RBC) counts and hemoglobin were the lowest in T2, followed by T1, and lower in T1 and T2 than in T3 and T4. Inversely, the red blood cell distribution width (RDW) was the highest in T2, followed by T1, and higher than in T3 and T4. Compared to non-severe patients, the platelet of severe patients was lower in T1 and T2. In contrast, the mean platelet volume (MPV) and platelet distribution width (PDW) tended to be higher in severe patients. Similarly, anisocytosis was more common in peripheral blood smears at early stages and in severe patients. Finally, large platelets were more common in severe patients.
Conclusion: Anisocytosis of erythrocytes and large platelets are found in patients with severe COVID-19, these changes may help primary hospitals to identify patients with a high risk of severe COVID-19 at an early stage.
Keywords: erythrocytes, blood platelets, COVID-19
Introduction
The coronavirus disease 2019 (COVID-19) pandemic has led to unprecedented research. Studies showed that hematological parameters mediate disease progressions, such as leukocytosis, thrombocytopenia, lymphopenia, neutrophilia, and eosinopenia, and have been considered markers for evaluating disease severity.1–3 The white blood cell (WBC) change is seen as a vital pathogenic driver of disease progression,4 while information on erythrocyte and platelet abnormalities in COVID-19 patients is limited.
Red blood cell distribution width (RDW) and mean corpuscular volume (MCV) are used clinically to evaluate anemia types. The RDW value indicates the presence of anisocytosis for an extended period, reflects erythropoietic stress and is associated with poor prognosis. It is also important in nonhematological diseases, such as social pneumonia, hypoxemia, pulmonary embolism, autoimmune diseases, and cardiovascular diseases.5–8 And MCV was also associated with nonhematological disease mortality and prognosis, such as chronic kidney disease and sepsis.9,10 In COVID-19, RDW was an independent predictor of mortality.11,12 MCV is highly altered in COVID-19,13 inversely related to acute kidney injury patients, and persists at hospital discharge.14
Platelets, one of the hematologic parameters, are essential effectors of hemostasis,15 and study shows that platelet hyperactivity is necessary for lung inflammation and other organs.16,17 Recent researches have shown that platelet parameters are helpful for the diagnosis of diseases and represent a value as a prognosis for pathology.4,18 Mean platelet volume (MPV) may indicate systemic inflammation19,20 and help diagnose inflammatory diseases such as pneumonia, tumors, diabetes, and coronary heart disease.21,22 Microthrombi were found in COVID-19 patients’ lungs, hearts, and bones, and platelets were destroyed in the spleen, which may lead to platelet consumption.2 Platelet aggregation and macroplatelets in COVID-19 patients were also observed in peripheral blood smears, which indicated platelet hyperactivity.23–25 However, there are few dynamic studies on whether platelet parameters change during the disease and recovery from COVID-19.
Peripheral blood smear (PBS) is a simple and effective method to study the change in blood cells and can be used to respond to the automated complete blood count (CBC) analysis. Most of the blood cell morphology in COVID-19 patients primarily focuses on WBC morphology changes, including Pelger-Huët anomaly, atypical lymphocytes, and large monocytes with vacuolated cytoplasm,26 especially in severe COVID-19 cases. Several red blood cell (RBC) abnormalities have been described, including polychromasia, basophilic stippling, rouleaux, autoagglutination, spherocytes, schistocytes, stomatocytes, and mushroom-shaped cells.27,28 Besides, macroplatelets and microthrombi have been described sporadically.24 All these studies were case reports29 or looked at a limited number of peripheral blood smears from COVID-19 patients. Overall, such studies are hardly comparable, and there is little or no information about other clinical and laboratory characteristics of patients.
Growing evidence suggests that CBC and morphological changes in these patients are dynamic and related to the disease course. There are still few studies on erythrocyte and platelet parameters and morphological changes in COVID-19 patients. We collected clinical features and dynamic peripheral blood to explore the potential associations between parameters and morphological modifications of erythrocytes and platelets and the course or severity of disease.
Materials and Methods
Study Design
From January 17th, 2020, to February 20th, 2022, we followed up 144 subjects for two years after they were discharged from Taizhou Hospital where they were confirmed with COVID-19 by polymerase chain reaction (PCR) test. Throat swabs were used for the PCR test. The following subjects were excluded during the first-year follow-up: (1) refusal to participate (n = 42); (2) Unable to contact (n = 6); (3) 23 subjects who lived outside Taizhou. Among the remaining 73 subjects, 27 lost the follow-up in the second year: (1) refused to participate (n = 13); (2) Unable to contact (n = 3); (3) 11 subjects who lived outside Taizhou. Eventually, 46 subjects were included, including 24 males and 22 females, with a median age of 48 years, and 23.9% were severe patients. According to the Chinese Government Diagnosis and Treatment Guideline (Trial 5th version), patients with COVID-19 are classified into two groups: (1) non-severe; (2) severe. Non-severe patients are defined as those who have fever or respiratory tract symptoms with pneumonia or mild symptoms without pneumonia. Severe patients are defined as those who meet any of the following three criteria: (1) respiratory distress, respiratory rate 30 times/min; (2) oxygen saturation ≤93% in resting state; and (3) arterial blood oxygen partial pressure/oxygen concentration
  300 mmHg (1 mmHg = 0.133 kPa).30 The participants had no history of hematologic disease. Demographic data of patients, including age, sex, body mass index (BMI), length of stay, symptoms and signs, and comorbidities, were extracted from the patients’ profiles.
We analyzed the dynamic and morphological changes in the parameters of the four-time nodes. The first was T1: defined as within seven days after the admission; the second was T2: within seven days before the discharge and two weeks after the discharge; the third was T3: one-year follow-up; the fourth was T4: two-year follow-up.31
Ethic Statement
The study was conducted according to the guidelines of the Declaration of Helsinki and approved by the ethics committee of Taizhou Hospital of Zhejiang Province, and informed consent was obtained from each enrolled subject.
CBC Analysis
Venous blood samples were collected into EDTA-2K-containing tubes (0.184 mol/L; BD) for CBC tests, and analysis was performed in Sysmex XN‐2000 analyzers (Sysmex Corporation, Kobe, Japan). The MCV was obtained by dividing hematocrit by the RBC count, and MPV by dividing plateletcrit by the platelet count. The reference ranges of CBC parameters were based on the People’s Republic of China Health Industry Standards (WS/T 405–2012). We also collected venous blood samples from 39 healthy individuals as control, they were from the physical examination center were included by matching age, sex, and health status (no underlying diseases or immune diseases, relevant clinical indicators within the normal range) with subjects.
Peripheral Blood Smear Analysis
All the samples were collected within the first 12 hours. SP-10 was for slide creation and staining (Wright-Giemsa stained), and the DI-60 automatic digital cell imaging analyzer (Sysmex Corporation, Kobe, Japan) was used for capturing high-magnification images in the optimal area for erythrocyte and platelet. We stored the peripheral blood smears at room temperature. Both microcytes (erythrocytes <6.5µm) and macrocytes (erythrocytes >8.5µm) were automatically measured by in-built rulers of CellaVision DM Software (DI-60).32 The average diameters of normal erythrocytes and platelets are 6.5–8.5 µm and approximately 1.5–3 µm, respectively, and large platelets measure 3–7 µm.33 Because lack of a 3 µm in-built ruler, and 3 µm is approximately half the diameter of a normal erythrocyte; thus, we used half the diameter of normal erythrocytes as a reference to determine the size of large platelets. Whilst giant platelets are larger than normal sized red cells, so we used the diameter of normal erythrocytes as a reference to determine the size of giant platelets.33
We also collected PBSs from 29 healthy volunteers, and they were from the physical examination center and were included by matching age, sex, and health status (no underlying diseases or immune diseases, relevant clinical indicators within the normal range) with subjects. The morphological change of COVID-19 subjects were compared with those healthy volunteers.
Two independent skilled operators reviewed the blood smear images. Morphological analysis of peripheral blood was performed by the first physician experienced in peripheral blood smear examination. The results were then cross-validated by the second physician independently.
Statistical Analysis
The Kolmogorov–Smirnov test determined distributions of continuous variables. Normally distributed data were described as mean and standard deviation (SD). Continuous variables were presented as median (interquartile range, IQR) if variables were skewed distributed. Categorical variables were presented as frequencies (percentages). The Student’s t-test was used to compare normally distributed measurements for independent samples. The homogeneity of variance test was used to compare normally distributed measurements for multiple groups. Skewed distribution variables were compared with Mann–Whitney rank-sum tests. When appropriate, categorical data were compared with the Chi-square or Fisher’s exact test. P< 0.05 was considered statistically significant. All statistical analyses were performed using IBM SPSS 26.0 software (SPSS Inc., Chicago, IL, United States).
Results
Study Design and Workflow
A total of 144 patients with COVID-19 were discharged from Taizhou Hospital from January 17th, 2020 to February 20th, 2022. Seventy-one patients were excluded from the first-year follow-up because they failed to keep the appointment for several reasons, as outlined in Figure 1. Forty-two patients refused to participate, 6 patients failed to be contacted and 23 patients lived outside Taizhou. In the second-year follow-up, 27 patients did not attend, 13 declined to participate, 3 failed to be contacted and 11 lived outside Taizhou. Eventually, 46 patients were included in the comparative analysis of CBC. With the lack of peripheral smears in 10 patients, we analyzed the peripheral blood cell smear of 36 patients comparatively (see Figure 1).
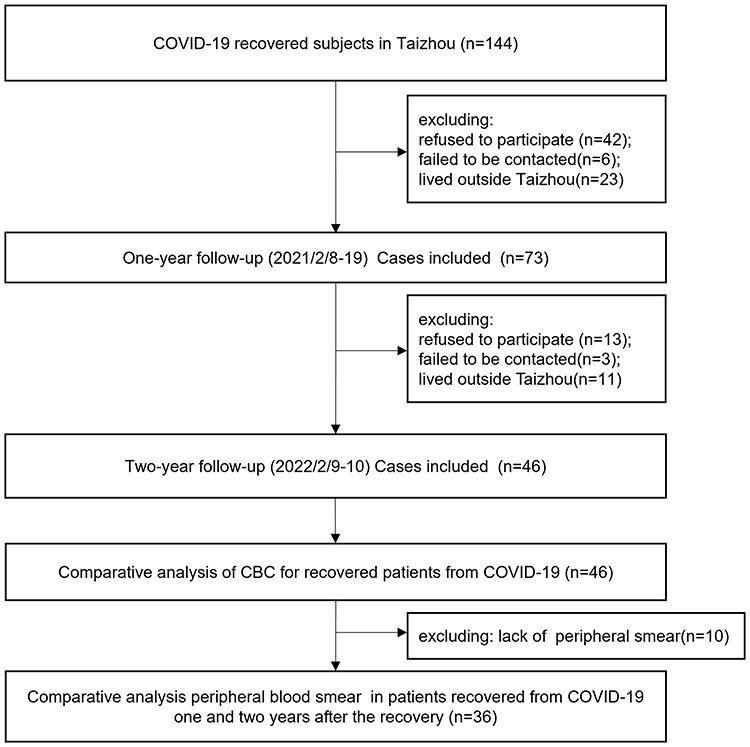 |
Figure 1 Study design and workflow. |
Clinical Characteristics of Patients
The demographic and clinical characteristics of participants are shown in Table 1. The median age of the enrolled participants is 48 (40–54), with 24 (52.17%) men and 22 (47.83%) women, 11 (23.9%) severe and 35 (76.1%) non-severe, they are all the Asian race, and Han ethnicity. We observed a higher median age in severe patients (62 years vs 45 years; P = 0.001). BMI is 23.5 (21.6–25.5), and the median duration of hospital stay is 22 (14.3–27.3). The most common symptoms and signs are fever (39 patients, 84.7%), followed by cough (28 patients, 60.8%). The most common comorbidity is hypertension (9 patients, 19.5%), followed by diabetes (5 patients, 10.8%) (see Table 1).
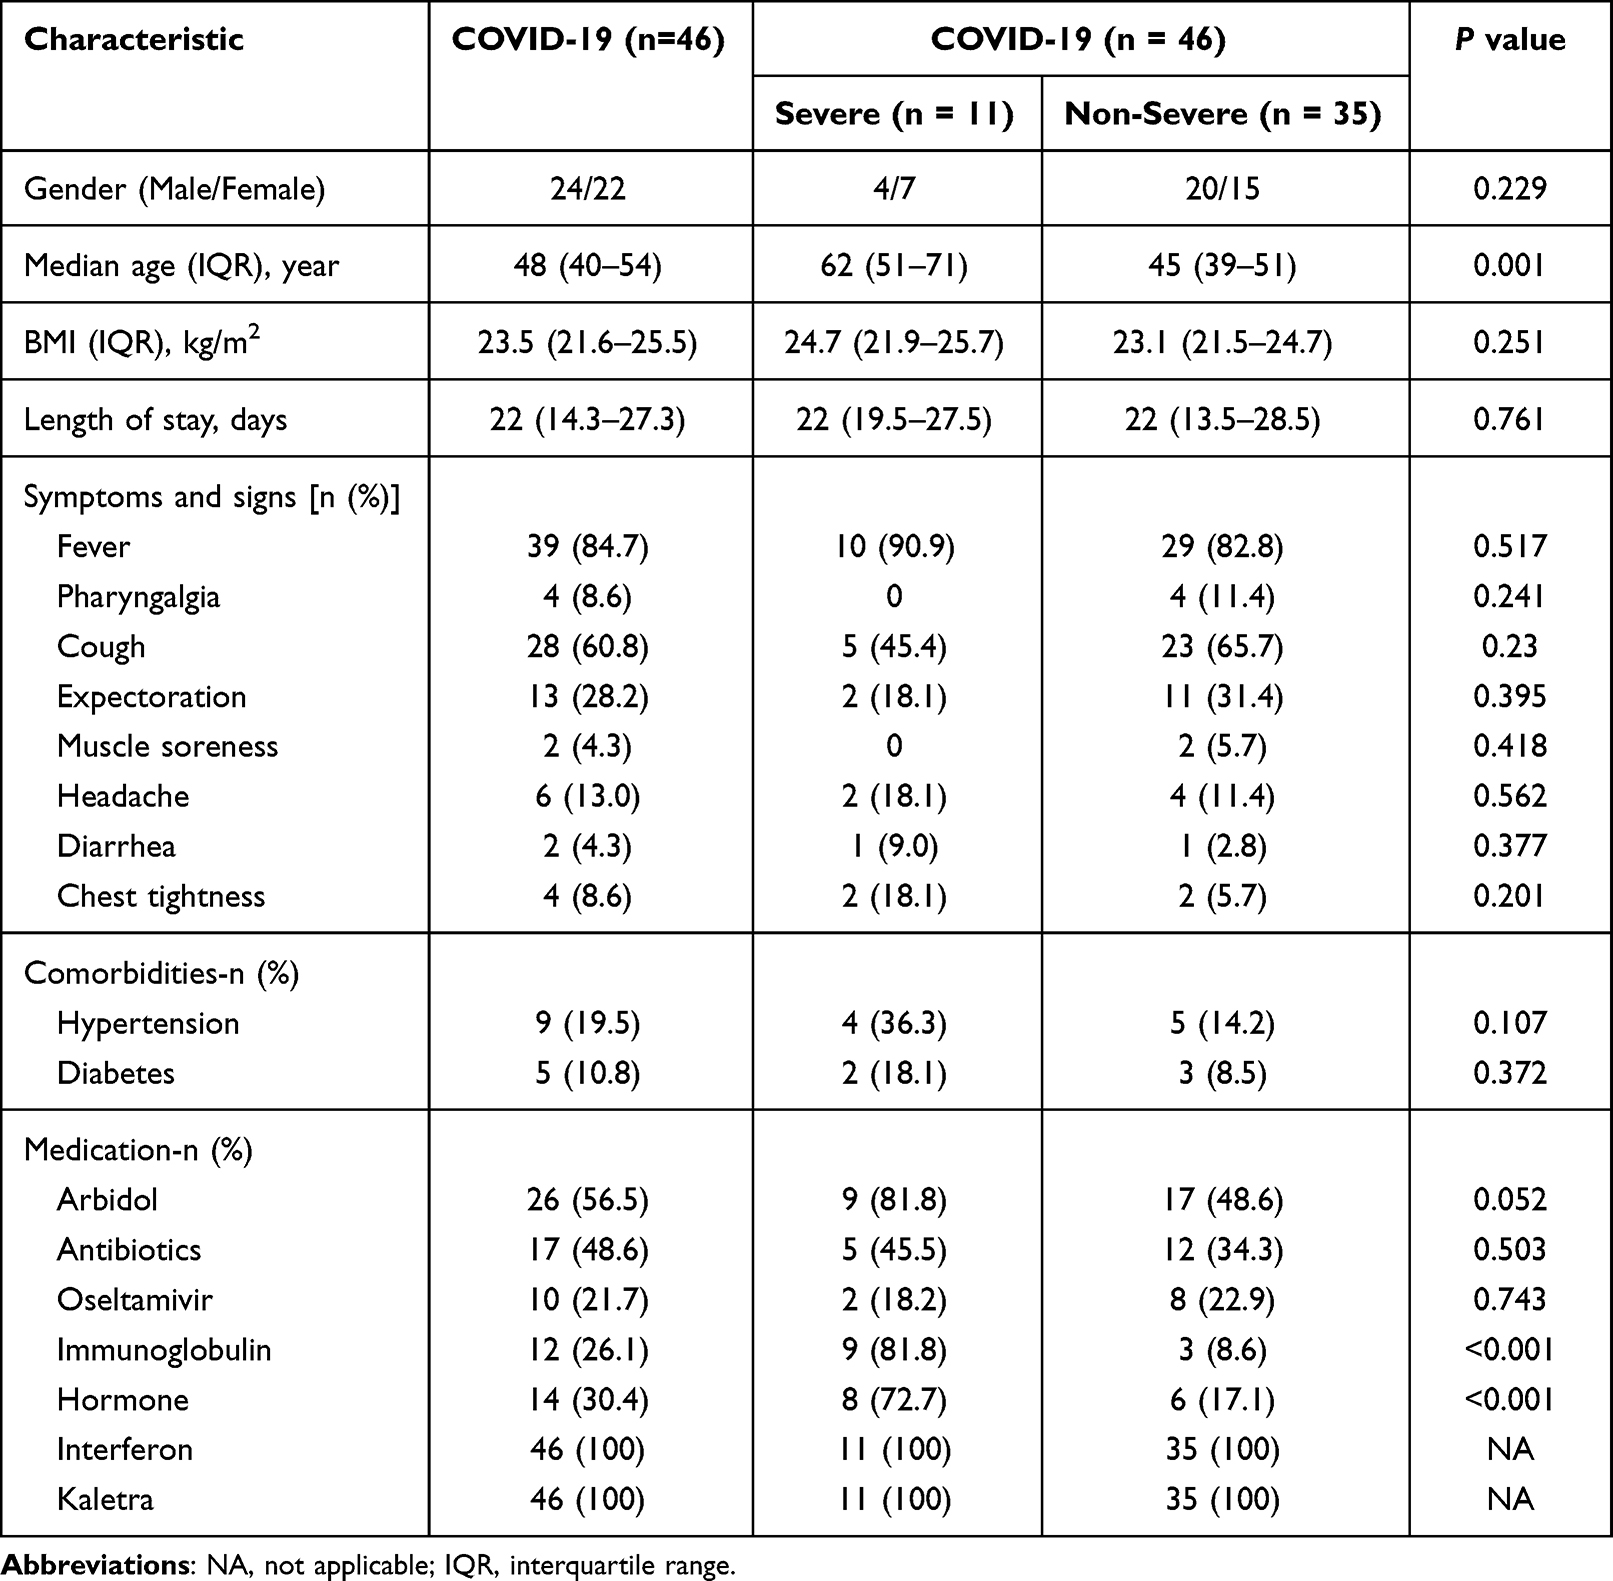 |
Table 1 Characteristics of Enrolled Patients |
CBC of COVID-19 Subjects in Different Courses
Forty-six patients with COVID-19 were included in this analysis. Table 2 shows the CBC of patients during the admission to the two-year follow-up. Lymphocyte, eosinophil, and basophil count varied in different stages. Lymphocytes of patients with COVID-19 were decreased compared to healthy volunteers (see Table S1) in T1, increased in T2 and then gradually stabilized in T3 and T4 (see Table 2). Compared to non-severe patients, lymphocytes were lower in severe patients at T1 and T2, and there were no statistically significant differences between groups for T3 and T4 (see Figure 2C). Similarly, the trend of basophils was similar to that of lymphocytes from T1 to T4. In T1, severe patients were with lower basophil than non-severe patients, and healthy volunteers (see Figure 2F, Table S1). Eosinophils of patients were the lowest in T1, lower than healthy volunteers, and there was no significant difference between T2 to T4 (see Figure 2E, Table S1 and Table 2). As to WBC, neutrophil and monocyte count, there were no significant differences between different stages and severity (see Figure 2A-B, Figure 2D).
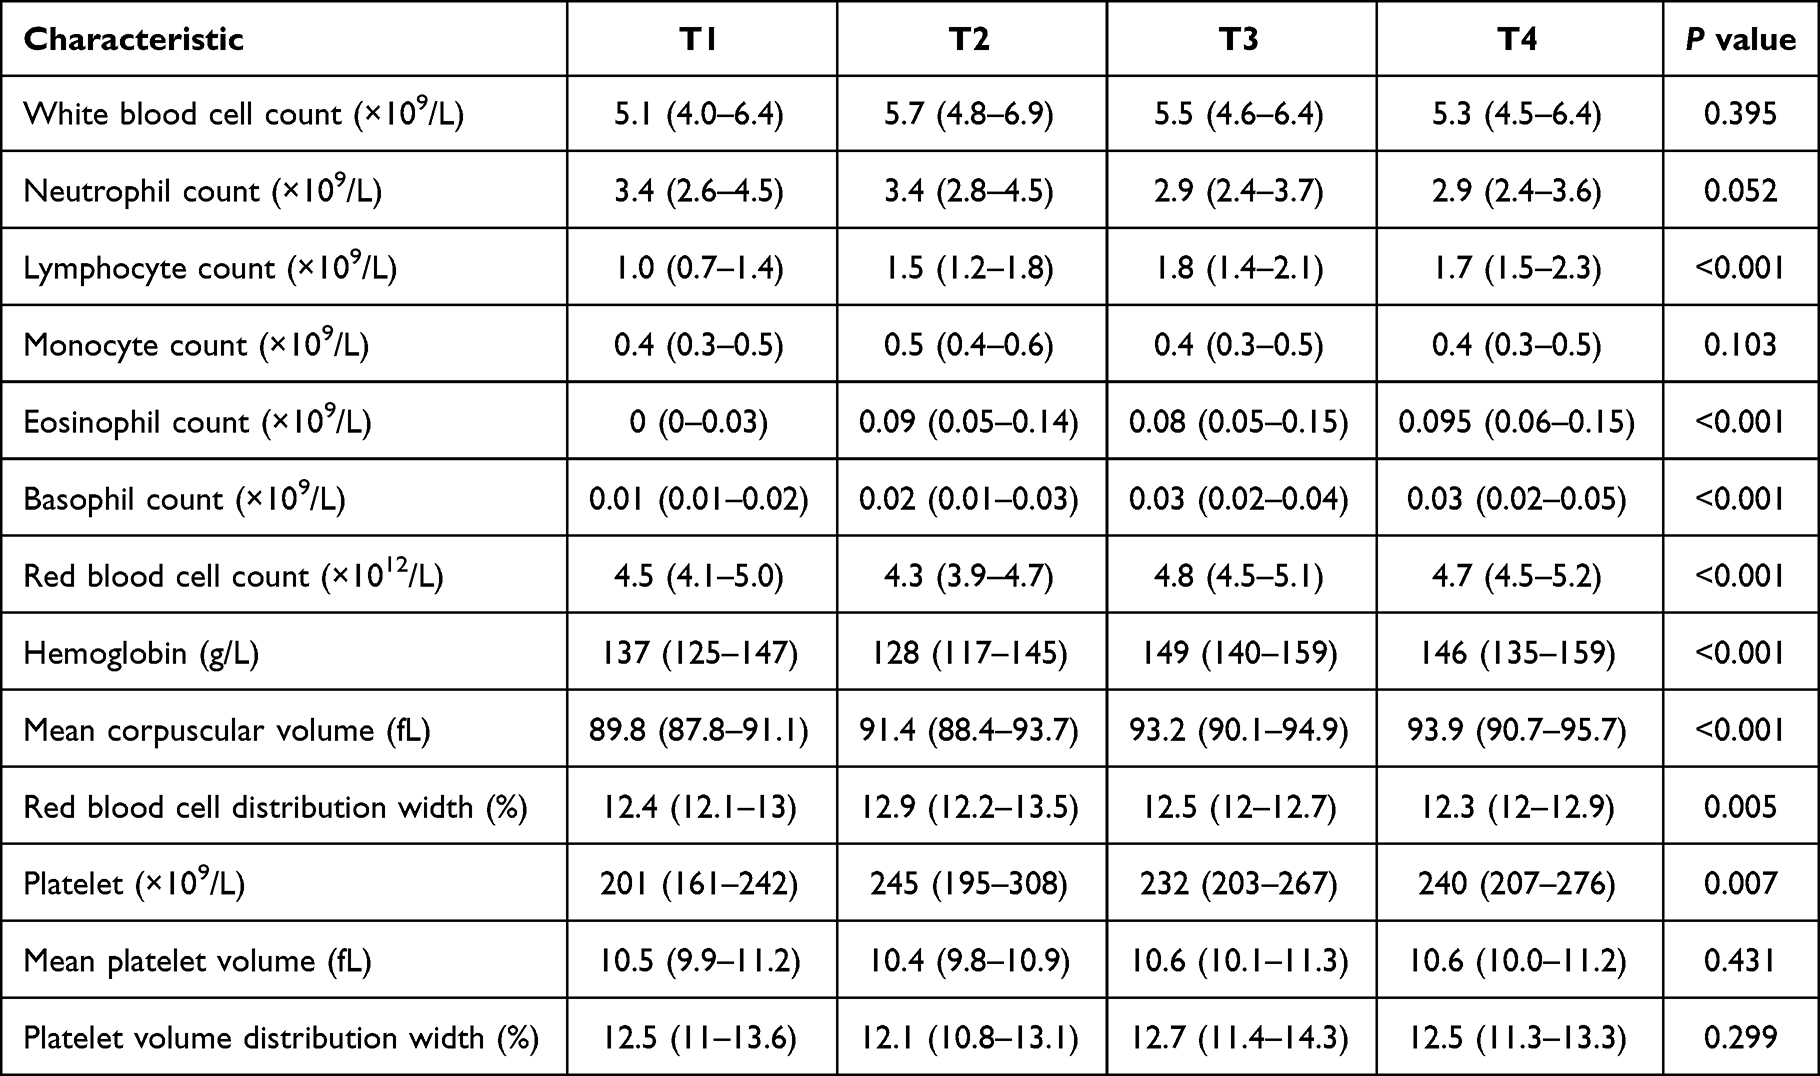 |
Table 2 Complete Blood Count of COVID-19 Subjects in Different Courses (n = 46) |
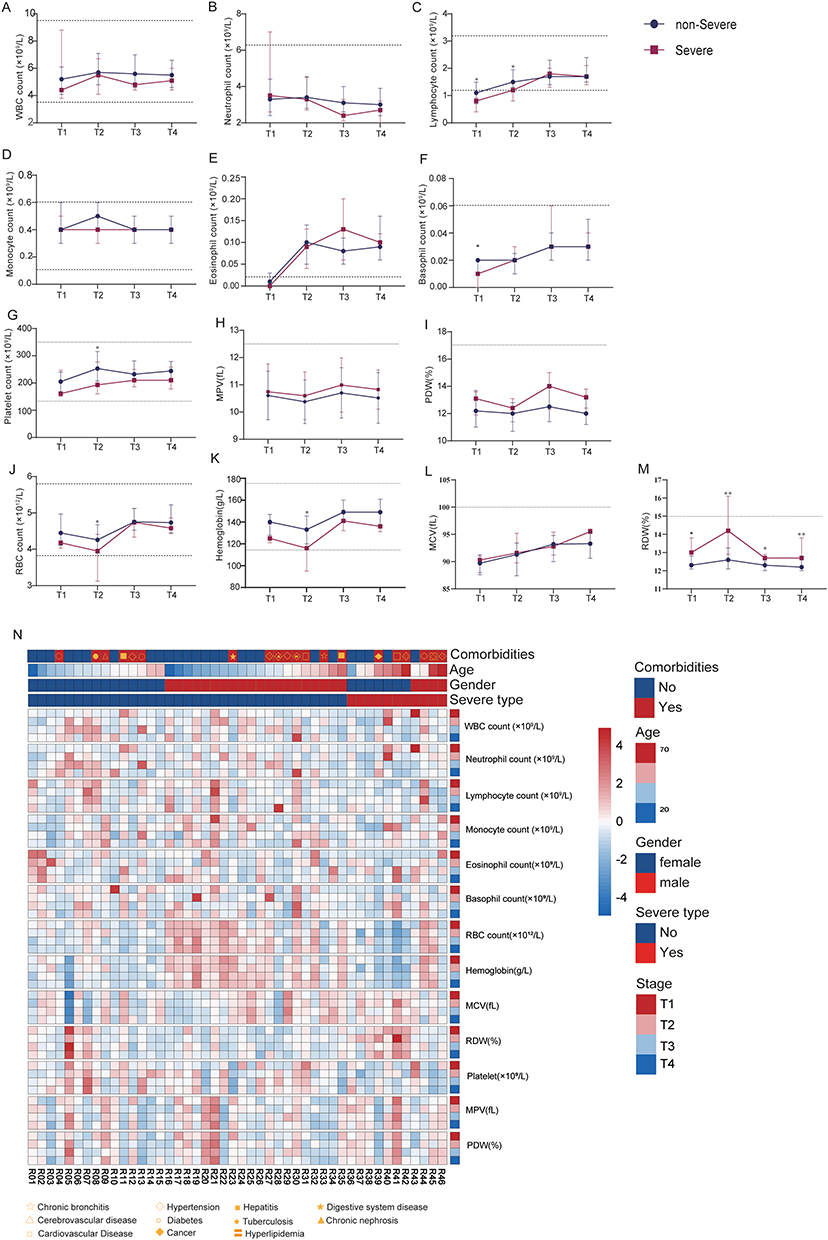 |
Figure 2 Complete blood count (CBC) of COIVD-19 subjects in different courses and severity. (A) White blood cell count (WBC) counts; (B) neutrophil count; (C) lymphocyte count; (D) monocyte count; (E) eosinophil count; (F) basophil count; (G) platelet count; (H) mean platelet volume (MPV); (I) platelet volume distribution width (PDW); (J) red blood cell (RBC) count; (K) hemoglobin; (L) mean corpuscular volume (MCV); (M) red blood cell distribution width (RDW); (N) heatmap of CBC. *P<0.05, **P<0.01. |
The red blood cell count and hemoglobin level were deceased in the T1 compared to healthy volunteers (see Table S1) and were the lowest in the T2, with both in severe patients lower than those in non-severe patients (see Figure 2J and Figure 2K), as shown similarly in Figure 2N. Afterward, the count and the level increased and stabilized in T3 and T4. Compared with the T1 and T2 stages, the MCV in T3 and T4 increased and RDW decreased (see Figure 2L-M, Table 2). In contrast to non-severe patients, severe patients showed a persistently higher RDW from T1 to T4 (see Figure 2M and Figure 2N). The platelet count was the lowest in stage T1, with no statistically significant differences from T2 to T4; besides, it was lower in severe patients compared to non-severe ones at the T2 stage (see Figure 2G and Figure 2N). MPV and platelet volume distribution width (PDW) in severe patients tended to be higher than in non-severe patients (see Figure 2H-I, Figure 2N).
Morphological Change of COVID-19 Subjects in Different Courses
There were mainly microcytes in stages from T1 to T4, and the percentage of microcytes was lower at T1 and T2 compared to T3, T4, and the healthy control group. The ratio of macrocytes was lower than that of the other two in the four stages (see Table 3). Compared to the healthy control group, the proportions of large platelets in the four stages were higher (see Table 3).
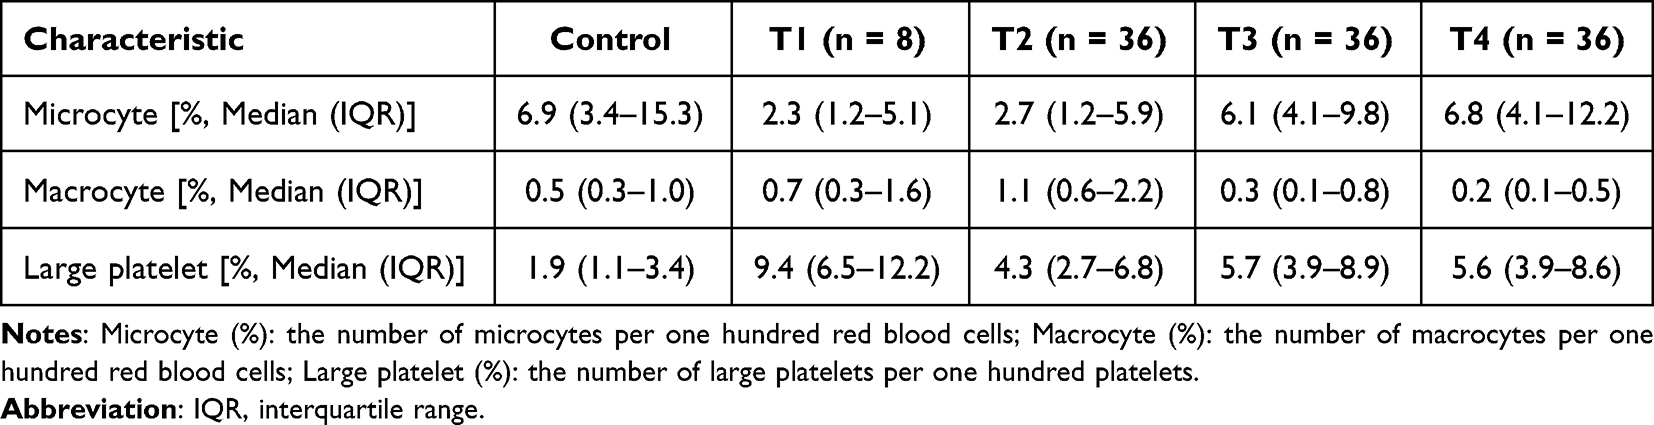 |
Table 3 Morphological Change of COVID-19 Subjects in Different courses |
Typical Abnormal Platelet Morphological Change of COVID-19 Subjects
In COVID-19 patients, peripheral blood smears show platelet aggregation (see Figure 3A) and giant platelets (see Figure 3B–D) with distinct protrusions resembling pseudopodia (see Figure 3C).
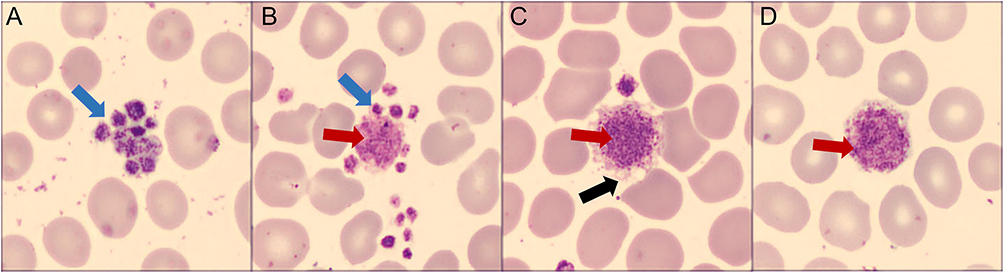 |
Figure 3 Typical abnormal platelet morphological change of COVID-19 subjects. (A) Platelet aggregation (blue arrows); (B) platelet aggregation (blue arrows) and giant platelet (red arrows); (C) giant platelet (red arrows) with distinct protrusions resembling pseudopodia (black arrows). (D) Giant platelet (red arrows). (Wright-Giemsa stain, ×100). |
Dynamic Morphological Change in Peripheral Blood of COVID-19 Subjects
Peripheral blood smears of T1 (see Figure 4A-B) and T2 (see Figure 4C-D) stages showed anisocytosis, polychromatic erythrocyte, nonhomogeneous platelets, and large platelets with the anomaly of α granules distribution; while at T3 (see Figure 4E-F) and T4 stages (see Figure 4G-H), peripheral blood smears showed fewer anisocytosis and large platelets.
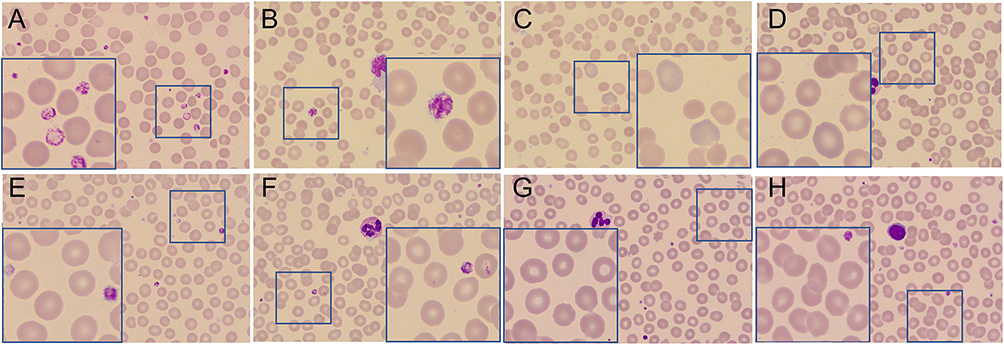 |
Figure 4 Dynamic morphological change in peripheral blood of COIVD-19 subjects. (A–D) Peripheral blood smears of T1 and T2 stage, showing anisocytosis and nonhomogeneous platelets. (A) Large platelets with the anomaly of α granules distribution; (B) large platelet; (C) polychromatic erythrocyte; (D) anisocytosis. (E–H) showing fewer anisocytosis and normal size platelet and large platelet. (E) Large platelet; (F) normal platelet; (G) homogeneous erythrocyte; (H) homogeneous erythrocyte and normal platelet. The large blue squares are the local magnification of the small ones. (Wright-Giemsa stain, Overall magnification×40, local magnification×100). |
Discussion
The COVID-19 pandemic has led to extensive research. However, few literatures have examined the dynamics of CBC in recovered patients during COVID-19, while dynamic morphological changes were rarely reported. Our study shows significant numerical and morphological changes associated with SARS-CoV-2 infection and that the severity of the changes varies during disease courses. On the other hand, those changes are usually not significant during the follow-up. Although there are significant numerical and morphological changes at the early stage, they have remained normal and stable during the follow-up period. It is worth noting that although red blood cell distribution width (RDW) is within the normal range, the RDW of severe patients is higher than that of non-severe patients during the whole stage.
Hematological changes may occur during the acute phase of infection, including shifted distribution width and changes in red blood cells’ shape, structure, and function.34 RDW was considered an independent predictor of mortality in COVID-19.6,11 Patients with or without CVD Covid-19 significantly increased MCV and decreased RDW three months after discharge.35 Similarly, our study showed a rise in MVC and a reduction in RDW after the discharge in both severe and non-severe cases. Notably, RDW was a significant difference between severe and non-severe patients. The study showed that when the coefficient of variation of RDW was greater than 13.6, the likelihood of lung tissue injury increased by 9.3 times, and it was a lung volume marker for COVID-19 severity.35 Studies have proved that increased RDW is common in human disorders, including cardiovascular disease,36 venous thromboembolism,37 cancer,38 diabetes,39 community-acquired pneumonia, chronic obstructive pulmonary disease,37 liver,40 and kidney failure,41 and so on. Increased RDW reflects a severe dysregulation of erythrocyte homeostasis, including impaired erythropoiesis and abnormal erythrocyte survival. Short or very short telomeres (DNA-protein structures located at the ends of chromosomes) cause senescence in erythroid cells, which leads to increased replication stress and impaired erythroid maturation.42 As we know, shorter telomeres of hematopoietic cells of the elderly, people with cardiometabolic disease, and male group were reported in COVID-19 cases,43 which may be the reason for the increased RDW in severe COVID-19 patients.
Oxidative stress is characterized by disrupting the balance between oxidants and antioxidant defenses, profoundly affecting erythrocyte homeostasis and survival.37 Many respiratory viral infections, including COVID-19, cause infected cells to die, activate the innate immune response, and produce inflammatory cytokines; these processes are associated with the development of oxidative stress, which may contribute to the increased RDW.44 Disruption of iron metabolism and reactive erythropoietin results in impaired erythrocyte maturation, the other promoter of anisocytosis. Besides, inflammation and several proinflammatory cytokines can also lower erythrocyte survival and inhibit the synthesis or activity of erythropoietin.45,46 Recent findings have shown that severe COVID-19 cases with higher ferritin47 and decreased serum erythropoietin levels.48 Besides, kidneys are frequently affected by (SARS-CoV-2).49 However, chronic kidney disease leads to the gradual decline of erythropoietin synthesis50 and increased erythrocyte fragmentation, inflammation, poor nutritional status,51 and increased oxidative stress.52 They are all responsible for increasing RDW.
In our research, platelet aggregates and macroplatelets were observed in patients with COVID-19, indicating platelets have enhanced adhesion properties53 and hyperactivity.24,54 Besides, we noticed that large platelets with anomalies of α granule distribution might be related to platelets releasing their alpha and dense granule contents in COVID-19 patients.53 In our study, PDW and MPV tended to be higher in severe patients with COVID-19. PDW reflects the heterogeneity of platelets, and it increases in response to platelet destruction and newly formed immature platelets55 due to the infections of COVID-19, which may be related to platelet internalization of virus to promote platelet death.56 According to the study, increased MPV in COVID-19 means these platelets may be hyperactive,54,57,58 and there was an adverse association between MPV and glomerular filtration rates (GFR) in severe patients with acute kidney injury.59 In summary, platelet parameters and morphological changes are closely related to platelet activation.
SARS-CoV-2 contributes to platelet activation via various pathways, including directly binding to platelet surface, provoking endothelial injury, and sustaining the release of von Willebrand factor.23,24,53,60,61 Firstly, SARS-CoV-2 directly binds to platelet angiotensin-converting enzyme 2 (ACE2), which can stimulate platelets, release coagulation factors and inflammatory cytokines, and promote the formation of platelet aggregates,54 and Eric Boilard et al consider that platelet alpha and dense granule are elevated in blood are the source of inflammatory cytokines.53 At the same time, Milka Koupenova et al consider through ACE2 or attached to microparticle by taking up virions, platelets can internalize the virus, resulting in platelet programmed death and release of platelet content; this response contributes to dysregulated functionality.56 Besides, SARS-CoV-2 also interacts with platelets and megakaryocytes via ACE2-independent mechanisms, alternative receptors, or co-factors.62 In addition, Florian Puhm et al61 consider that tissue factor (TF) produced by SARS-CoV-2 infected cells activates thrombin which signals to protease-activated receptor (PARs) on platelets, then strongly activates platelets. In contrast, neither virus nor purified spike protein activates platelets. Platelet activation may also occur due to thrombin generation after concomitant blood coagulation activation.63 All of the above mechanisms may act in concert with, or contribute to, the production of highly active platelets, identified by their increased size, which would then play a role in triggering microthrombotic and major thrombotic events commonly seen in critically or critically ill patients with COVID-19.64 However, five patients had higher MPV in the four-stage timeline in our research, one of which may be due to valve replacement with atrial fibrillation,65 and another may be related to abnormal liver function.66,67 The other three were without comorbidities and did not use drugs related to platelet activation; the reasons for platelet activation are unknown. Overall, platelet parameters play an important role in differential diagnosis and prognosis prediction of diseases, and they are easily accessible and inexpensive. MPV can be used as an adjunct test to vital capacity and to predict mortality in patients with COVID-19.68 Besides, MPV is used in differential diagnosis to help distinguish COVID-19 from influenza during seasonal influenza outbreaks.69
All in all, our study shows parameters and morphological changes of erythrocyte and platelet associated with SARS-CoV-2 infection and that severity of changes varies between disease courses. However, although we have provided a plausible explanation for this association, further studies of the underlying mechanisms and pathophysiological pathways are needed to clarify whether there is a causal or simple association between the two.
Conclusion
In conclusion, our study revealed changes in the parameters and morphology of erythrocytes and platelets following SARS-CoV-2 infection, and the extent of these changes varied according to the disease course and severity. Anisocytosis of erythrocytes and large platelets are found in patients with severe COVID-19, these changes may help primary hospitals to identify patients with a high risk of severe COVID-19 at an early stage.
Acknowledgments
We thank the patients enrolled in this study, and the physicians, nurses, and secretaries of the Taizhou Hospital of Zhejiang Province.
Author Contributions
All authors made a significant contribution to the work reported, whether that is in the conception, study design, execution, acquisition of data, analysis and interpretation, or in all these areas; took part in drafting, revising or critically reviewing the article; gave final approval of the version to be published; have agreed on the journal to which the article has been submitted; and agree to be accountable for all aspects of the work.
Funding
This work was supported by Zhejiang Provincial Medical and Health Science and Technology Program (2019RC089).
Disclosure
The authors report no conflicts of interest in this work.
References
1. Martonik D, Parfieniuk-Kowerda A, Rogalska M, Flisiak R. The role of Th17 response in COVID-19. Cells Basel. 2021;10(6). doi:10.3390/cells10061550
2. Rahman A, Niloofa R, Jayarajah U, De Mel S, Abeysuriya V, Seneviratne SL. Hematological abnormalities in COVID-19: a narrative review. Am J Trop Med Hyg. 2021;104(4):1188–1201. doi:10.4269/ajtmh.20-1536
3. Slomka A, Martucci G, Raffa GM, et al. Immunological and hematological response in COVID-19. Adv Exp Med Biol. 2021;1352:73–86. doi:10.1007/978-3-030-85109-5_5
4. Slomka A, Kowalewski M, Zekanowska E. Coronavirus disease 2019 (COVID-19): a short review on hematological manifestations. Pathogens. 2020;9(6). doi:10.3390/pathogens9060493
5. Sarkar S, Kannan S, Khanna P, Singh AK. Role of red blood cell distribution width, as a prognostic indicator in COVID-19: a systematic review and meta-analysis. Rev Med Virol. 2022;32(2):e2264. doi:10.1002/rmv.2264
6. Lippi G, Henry BM, Sanchis-Gomar F. Red blood cell distribution is a significant predictor of severe illness in coronavirus disease 2019. Acta Haematol Basel. 2021;144(4):360–364. doi:10.1159/000510914
7. Ycas JW, Horrow JC, Horne BD. Persistent increase in red cell size distribution width after acute diseases: a biomarker of hypoxemia? Clin Chim Acta. 2015;448:107–117. doi:10.1016/j.cca.2015.05.021
8. Braun E, Domany E, Kenig Y, Mazor Y, Makhoul BF, Azzam ZS. Elevated red cell distribution width predicts poor outcome in young patients with community acquired pneumonia. Crit Care. 2011;15(4):R194. doi:10.1186/cc10355
9. Hsieh YP, Chang CC, Kor CT, Yang Y, Wen YK, Chiu PF. Mean corpuscular volume and mortality in patients with CKD. Clin J Am Soc Nephro. 2017;12(2):237–244. doi:10.2215/CJN.00970116
10. Bateman RM, Sharpe MD, Singer M, Ellis CG. The effect of sepsis on the erythrocyte. Int J Mol Sci. 2017;18(9):1932. doi:10.3390/ijms18091932
11. Bergamaschi G, Borrelli DAF, Aronico N, et al. Anemia in patients with COVID-19: pathogenesis and clinical significance. Clin Exp Med. 2021;21(2):239–246. doi:10.1007/s10238-020-00679-4
12. Hornick A, Tashtish N, Osnard M, et al. Anisocytosis is associated with short-term mortality in COVID-19 and may reflect proinflammatory signature in uninfected ambulatory adults. Pathog Immun. 2020;5(1):312–326. doi:10.20411/pai.v5i1.391
13. Grau M, Ibershoff L, Zacher J, et al. Even patients with mild COVID-19 symptoms after SARS-CoV-2 infection show prolonged altered red blood cell morphology and rheological parameters. J Cell Mol Med. 2022;26(10):3022–3030. doi:10.1111/jcmm.17320
14. de Almeida DC, Franco M, Dos DRP, et al. Acute kidney injury: incidence, risk factors, and outcomes in severe COVID-19 patients. PLoS One. 2021;16(5):e0251048. doi:10.1371/journal.pone.0251048
15. Versteeg HH, Heemskerk JWM, Levi M, Reitsma PH. New fundamentals in hemostasis. Physiol Rev. 2013;93(1):327–358. doi:10.1152/physrev.00016.2011
16. Middleton EA, Weyrich AS, Zimmerman GA. Platelets in pulmonary immune responses and inflammatory lung diseases. Physiol Rev. 2016;96(4):1211–1259. doi:10.1152/physrev.00038.2015
17. Morrell CN, Aggrey AA, Chapman LM, Modjeski KL. Emerging roles for platelets as immune and inflammatory cells. Blood. 2014;123(18):2759–2767. doi:10.1182/blood-2013-11-462432
18. Atik D, Kaya HB. Evaluation of the relationship of mpv, rdw and pvi parameters with disease severity in COVID-19 patients. Acta Clin Croat. 2021;60(1):103–114. doi:10.20471/acc.2021.60.01.15
19. Ozder A. A novel indicator predicts 2019 novel coronavirus infection in subjects with diabetes. Diabetes Res Clin Pr. 2020;166:108294. doi:10.1016/j.diabres.2020.108294
20. Akar T. Can mean platelet volume indicate helicobacter positivity and severity of gastric inflammatIon? An orIgInal study and revIew of the lIterature. Acta Clin Croat. 2019;58(4):576–582. doi:10.20471/acc.2019.58.04.02
21. Zaccardi F, Rocca B, Pitocco D, Tanese L, Rizzi A, Ghirlanda G. Platelet mean volume, distribution width, and count in type 2 diabetes, impaired fasting glucose, and metabolic syndrome: a meta-analysis. Diabetes Metab Res. 2015;31(4):402–410. doi:10.1002/dmrr.2625
22. Khan HA, Alhomida AS, Sobki SH, Moghairi AA, Koronki HE. Blood cell counts and their correlation with creatine kinase and C-reactive protein in patients with acute myocardial infarction. Int J Clin Exp Med. 2012;5(1):50–55.
23. Lichtenberger LM, Szabo S. A closer look at endothelial injury-induced platelet hyperactivity and the use of aspirin in the treatment of COVID infection. Inflammopharmacology. 2022;30(4):1475–1476. doi:10.1007/s10787-022-01015-w
24. Rampotas A, Pavord S. Platelet aggregates, a marker of severe COVID-19 disease. J Clin Pathol. 2021;74(11):750–751. doi:10.1136/jclinpath-2020-206933
25. Ahnach M, Ousti F, Nejjari S, Houssaini MS, Dini N. Peripheral blood smear findings in COVID-19. Turk J Hematol. 2020;37(4):310. doi:10.4274/tjh.galenos.2020.2020.0262
26. Pezeshki A, Vaezi A, Nematollahi P. Blood cell morphology and COVID-19 clinical course, severity, and outcome. J Hematop. 2021;14(3):221–228. doi:10.1007/s12308-021-00459-3
27. Berzuini A, Bianco C, Migliorini AC, Maggioni M, Valenti L, Prati D. Red blood cell morphology in patients with COVID-19-related anaemia. Blood Transfus Italy. 2021;19(1):34–36. doi:10.2450/2020.0242-20
28. Gerard D, Ben BS, Lesesve JF, Perrin J. Are mushroom-shaped erythrocytes an indicator of COVID-19? Brit J Haematol. 2021;192(2):230. doi:10.1111/bjh.17127
29. Khakwani M, Horgan C, Ewing J. COVID-19-associated oxidative damage to red blood cells. Brit J Haematol. 2021;193(3):481. doi:10.1111/bjh.17317
30. NHCPRC (National Health Commission of the PRC). Diagnosis and treatment protocol for COVID-19 (trial version 5); 2020. Available from: http://www.nhc.gov.cn/jkj/s3577/202002/a5d6f7b8c48c451c87dba14889b30147.shtml.
31. Chi H, Zhou K, Shen L, et al. The evaluation of the immune status of COVID-19 recovered subjects with persistent abnormal lung CT after one year: a longitudinal cohort study. Int Immunopharmacol. 2022;110:109019. doi:10.1016/j.intimp.2022.109019
32. Barbara HO. A Color Atlas and Instruction Manual of Peripheral Blood Cell Morphology. Lippincott Williams & Wikins; 1984.
33. Thon JN, Italiano JE. Platelets: production, morphology and ultrastructure. Handb Exp Pharmacol. 2012;2012(210):3–22. doi:10.1007/978-3-642-29423-5_1
34. Lu G, Wang J. Dynamic changes in routine blood parameters of a severe COVID-19 case. Clin Chim Acta. 2020;508:98–102. doi:10.1016/j.cca.2020.04.034
35. Petelina TI, Musikhina NA, Avdeeva KS, et al. Estimation of erythrocyte parameters of general blood analysis in patients with SARS-CoV-2 -associated pneumonia. Klin Lab Diagn. 2022;67(1):24–30. doi:10.51620/0869-2084-2022-67-1-24-30
36. Rostoff P, Siniarski A, Haberka M, Konduracka E, Nessler J, Gajos G. Relationship among the leptin-to-adiponectin ratio, systemic inflammation, and anisocytosis in well-controlled type 2 diabetic patients with atherosclerotic cardiovascular disease. Kardiol Pol. 2020;78(5):420–428. doi:10.33963/KP.15257
37. Salvagno GL, Sanchis-Gomar F, Picanza A, Lippi G. Red blood cell distribution width: a simple parameter with multiple clinical applications. Crit Rev Cl Lab Sci. 2015;52(2):86–105. doi:10.3109/10408363.2014.992064
38. Fancellu A, Zinellu A, Mangoni AA, et al. Red blood cell distribution width (RDW) correlates to the anatomical location of colorectal cancer. implications for clinical use. J Gastrointest Canc. 2022;53(2):259–264. doi:10.1007/s12029-021-00582-5
39. Rajab AM, Rahman S, Rajab TM, Haider KH. Morphology and chromic status of red blood cells are significantly influenced by gestational diabetes. J Hematol. 2018;7(4):140–148. doi:10.14740/jh449w
40. Damjanovska S, Davitkov P, Gopal S, et al. High red cell distribution width and low absolute lymphocyte count associate with subsequent mortality in HCV infection. Pathog Immun. 2021;6(2):90–104. doi:10.20411/pai.v6i2.467
41. Kogika MM, Lustoza MD, Hagiwara MK, Caragelasco DS, Martorelli CR, Mori CS. Evaluation of oxidative stress in the anemia of dogs with chronic kidney disease. Vet Clin Path. 2015;44(1):70–78. doi:10.1111/vcp.12225
42. Xi H, Li C, Ren F, Zhang H, Zhang L. Telomere, aging and age-related diseases. Aging Clin Exp Res. 2013;25(2):139–146. doi:10.1007/s40520-013-0021-1
43. Aviv A. Telomeres and COVID-19. FASEB J. 2020;34(6):7247–7252. doi:10.1096/fj.202001025
44. Chernyak BV, Popova EN, Prikhodko AS, Grebenchikov OA, Zinovkina LA, Zinovkin RA. COVID-19 and oxidative stress. Biochem Mosc. 2020;85(12):1543–1553. doi:10.1134/S0006297920120068
45. Kiefer CR, Snyder LM. Oxidation and erythrocyte senescence. Curr Opin Hematol. 2000;7(2):113–116. doi:10.1097/00062752-200003000-00007
46. Jelkmann W. Proinflammatory cytokines lowering erythropoietin production. J Interf Cytok Res. 1998;18(8):555–559. doi:10.1089/jir.1998.18.555
47. Taneri PE, Gomez-Ochoa SA, Llanaj E, et al. Anemia and iron metabolism in COVID-19: a systematic review and meta-analysis. Eur J Epidemiol. 2020;35(8):763–773. doi:10.1007/s10654-020-00678-5
48. Begemann M, Gross O, Wincewicz D, et al. Addressing the ‘hypoxia paradox’ in severe COVID-19: literature review and report of four cases treated with erythropoietin analogues. Mol Med. 2021;27(1):120. doi:10.1186/s10020-021-00381-5
49. Han X, Ye Q. Kidney involvement in COVID-19 and its treatments. J Med Virol. 2021;93(3):1387–1395. doi:10.1002/jmv.26653
50. Kario K, Matsuo T, Nakao K, Yamaguchi N. The correlation between red cell distribution width and serum erythropoietin titres. Clin Lab Haematol. 1991;13(2):222–223. doi:10.1111/j.1365-2257.1991.tb00274.x
51. Tekce H, Kin TB, Aktas G, Tanrisev M, Sit M. The evaluation of red cell distribution width in chronic hemodialysis patients. Int J Nephrol. 2014;2014:754370. doi:10.1155/2014/754370
52. Afonso L, Zalawadiya SK, Veeranna V, Panaich SS, Niraj A, Jacob S. Relationship between red cell distribution width and microalbuminuria: a population-based study of multiethnic representative US adults. Nephron. 2011;119(4):c277–82. doi:10.1159/000328918
53. Zaid Y, Puhm F, Allaeys I, et al. Platelets can associate with SARS-Cov-2 RNA and are hyperactivated in COVID-19. Circ Res. 2020;127(11):1404–1418. doi:10.1161/CIRCRESAHA.120.317703
54. Zhang S, Liu Y, Wang X, et al. SARS-CoV-2 binds platelet ACE2 to enhance thrombosis in COVID-19. J Hematol Oncol. 2020;13(1):120. doi:10.1186/s13045-020-00954-7
55. Gao Y, Li Y, Yu X, et al. The impact of various platelet indices as prognostic markers of septic shock. PLoS One. 2014;9(8):e103761. doi:10.1371/journal.pone.0103761
56. Koupenova M, Corkrey HA, Vitseva O, et al. SARS-CoV-2 initiates programmed cell death in platelets. Circ Res. 2021;129(6):631–646. doi:10.1161/CIRCRESAHA.121.319117
57. Braekkan SK, Mathiesen EB, Njolstad I, Wilsgaard T, Stormer J, Hansen JB. Mean platelet volume is a risk factor for venous thromboembolism: the Tromso study, Tromso, Norway. J Thromb Haemost. 2010;8(1):157–162. doi:10.1111/j.1538-7836.2009.03498.x
58. Chu SG, Becker RC, Berger PB, et al. Mean platelet volume as a predictor of cardiovascular risk: a systematic review and meta-analysis. J Thromb Haemost. 2010;8(1):148–156. doi:10.1111/j.1538-7836.2009.03584.x
59. Taha M, Sano D, Hanoudi S, et al. Platelets and renal failure in the SARS-CoV-2 syndrome. Platelets. 2021;32(1):130–137. doi:10.1080/09537104.2020.1817361
60. Lippi G, Sanchis-Gomar F, Favaloro EJ, Lavie CJ, Henry BM. Coronavirus disease 2019-associated coagulopathy. Mayo Clin Proc. 2021;96(1):203–217. doi:10.1016/j.mayocp.2020.10.031
61. Puhm F, Allaeys I, Lacasse E, et al. Platelet activation by SARS-CoV-2 implicates the release of active tissue factor by infected cells. Blood Adv. 2022;6(12):3593–3605. doi:10.1182/bloodadvances.2022007444
62. Shen S, Zhang J, Fang Y, et al. SARS-CoV-2 interacts with platelets and megakaryocytes via ACE2-independent mechanism. J Hematol Oncol. 2021;14(1):72. doi:10.1186/s13045-021-01082-6
63. Benati M, Salvagno GL, Nitto S, et al. thrombin generation in patients with coronavirus disease 2019. Semin Thromb Hemost. 2021;47(4):447–450. doi:10.1055/s-0041-1722844
64. Malas MB, Naazie IN, Elsayed N, Mathlouthi A, Marmor R, Clary B. Thromboembolism risk of COVID-19 is high and associated with a higher risk of mortality: a systematic review and meta-analysis. Eclinicalmedicine. 2020;29:100639. doi:10.1016/j.eclinm.2020.100639
65. Makowski M, Smorag I, Makowska J, et al. Platelet reactivity and mean platelet volume as risk markers of thrombogenesis in atrial fibrillation. Int J Cardiol. 2017;235:1–5. doi:10.1016/j.ijcard.2017.03.023
66. Michalak A, Cichoz-Lach H, Guz M, Kozicka J, Cybulski M, Jeleniewicz W. Plateletcrit and mean platelet volume in the evaluation of alcoholic liver cirrhosis and nonalcoholic fatty liver disease patients. Biomed Res Int. 2021;2021:8867985. doi:10.1155/2021/8867985
67. Guo F, Zhu X, Qin X. Platelet distribution width in hepatocellular carcinoma. Med Sci Monitor. 2018;24:2518–2523.
68. Guclu E, Kocayigit H, Okan HD, et al. Effect of COVID-19 on platelet count and its indices. Rev Assoc Med Bras. 2020;66(8):1122–1127. doi:10.1590/1806-9282.66.8.1122
69. Ozcelik N, Ozyurt S, Yilmaz KB, Gumus A, Sahin U. The value of the platelet count and platelet indices in differentiation of COVID-19 and influenza pneumonia. J Med Virol. 2021;93(4):2221–2226. doi:10.1002/jmv.26645
 © 2023 The Author(s). This work is published and licensed by Dove Medical Press Limited. The
full terms of this license are available at https://www.dovepress.com/terms
and incorporate the Creative Commons Attribution
- Non Commercial (unported, 3.0) License.
By accessing the work you hereby accept the Terms. Non-commercial uses of the work are permitted
without any further permission from Dove Medical Press Limited, provided the work is properly
attributed. For permission for commercial use of this work, please see paragraphs 4.2 and 5 of our Terms.
© 2023 The Author(s). This work is published and licensed by Dove Medical Press Limited. The
full terms of this license are available at https://www.dovepress.com/terms
and incorporate the Creative Commons Attribution
- Non Commercial (unported, 3.0) License.
By accessing the work you hereby accept the Terms. Non-commercial uses of the work are permitted
without any further permission from Dove Medical Press Limited, provided the work is properly
attributed. For permission for commercial use of this work, please see paragraphs 4.2 and 5 of our Terms.