Back to Journals » Journal of Inflammation Research » Volume 15
Pan-Cancer Transcriptomic Analysis Identifies PLK1 Crucial for the Tumorigenesis of Clear Cell Renal Cell Carcinoma
Authors Qian Y, Li Y, Chen K ![]() , Liu N, Hong X, Wu D
, Liu N, Hong X, Wu D ![]() , Xu Z, Zhou L
, Xu Z, Zhou L ![]() , Xu L, Jia R, Ge YZ
, Xu L, Jia R, Ge YZ ![]()
Received 9 November 2021
Accepted for publication 2 February 2022
Published 16 February 2022 Volume 2022:15 Pages 1099—1116
DOI https://doi.org/10.2147/JIR.S347732
Checked for plagiarism Yes
Review by Single anonymous peer review
Peer reviewer comments 3
Editor who approved publication: Professor Ning Quan
Yiguan Qian,* Yang Li,* Ke Chen,* Ning Liu, Xi Hong, Di Wu, Zheng Xu, Liuhua Zhou, Luwei Xu, Ruipeng Jia, Yu-Zheng Ge
Department of Urology, Nanjing First Hospital, Nanjing Medical University, Nanjing, Jiangsu, People’s Republic of China
*These authors contributed equally to this work
Correspondence: Ruipeng Jia; Yu-Zheng Ge, Department of Urology, Nanjing First Hospital, Nanjing Medical University Nanjing, Jiangsu, People’s Republic of China, Tel +86-15850675660, Email [email protected]; [email protected]
Background: Polo-like kinase 1 (PLK1) belongs to polo-like kinases family and affects cell cycles. However, the role of PLK1 in some malignant tumors remains unclear.
Methods: To obtain a comprehensive view of PLK1 expression patterns, public databases including The Cancer Genome Atlas, Cancer Cell Line Encyclopedia, the Genotype-Tissue Expression, and human cell landscape databases were employed. The correlation of PLK1 expression with prognosis, immune infiltrations, immune checkpoint genes, tumor mutational burden (TMB), microsatellite instability (MSI), mismatch repair (MMR), and DNA methylation was examined. Besides, we validated the results of clear cell renal cell carcinoma (ccRCC) in two cohorts, with quantitative real-time PCR, Western blot, and loss-of-function experiments.
Results: By mining public datasets, we discovered that PLK1 expression in tumor tissues and cancer cell lines displayed heterogeneity compared to normal controls across different cancers. Besides, high expression of PLK1 results in shorter survival time in 15 cancer types, especially in ccRCC. PLK1 expression showed strong association with immune cell infiltration and immune checkpoint genes across cancer types. Moreover, we identified a strong association between PLK1 expression and TMB, MSI MMR, and DNA methylation. PLK1 was validated to be highly expressed in ccRCC tissues and promote ccRCC cell proliferation, migration, invasion, and cell cycle. Mechanistically, PLK1 could regulate forkhead box protein M1 and target cell cycle-associated genes to participate in cell cycle control.
Conclusion: PLK1 has important prognostic value and is associated with tumor immunity across cancer types including ccRCC.
Keywords: PLK1, pan-cancer analysis, ccRCC, biomarker, tumor immunity
Introduction
The incidence of malignant tumors has increased at an alarming rate in the past few decades, which has served as a leading cause of death and major public health burden worldwide.1 To gain deeper insight into the pathogenesis of human malignancies, a summary of comprehensive projects including Cancer Cell Line Encyclopedia (CCLE) and the Cancer Genome Atlas (TCGA) was launched.2,3 Due to the continued accumulation and improvement of multi-omics data across cancer types, pan-cancer analysis has become available.4,5 Unlike previous studies of selected tumor types, pan-cancer analysis can provide a wide-ranging overview of various aspects of cancer biology through revealing similarities, heterogeneity, new topics, and the breadth of analysis for human malignancies.6
Polo-like kinases (PLKs) are a class of serine/threonine protein kinases,7 which included five members: PLK1-5. Among them, PLK1 is studied mostly,8 and plays important functions in regulating cell cycle.9 According to previous studies, we concluded that high expression of PLK1 contributed to a poor prognosis in some human cancers.10–12 Functionally, PLK1 promotes tumor progression through different pathways, for example, inhibition of PLK1 could enhance the radiosensitivity of breast cancer cells.13 Previous investigations of PLK1 focused on a specific cancer type, which provides limited or biased views and calls for a comprehensive molecular portrait of PLK1 at pan-cancer level.
Here, we firstly, to the best of our knowledge, explored the expression patterns and clinical implications of PLK1 across 33 cancer types by integrating multiple databases. Important variables including immune infiltrations, immune checkpoint genes (ICGs), tumor mutational burden (TMB), microsatellite instability (MSI), mismatch repair (MMR), and DNA methylation were comprehensively unraveled to find a correlation with PLK1. Furthermore, PLK1 was verified as a potent oncogene in clear cell renal cell carcinoma (also known as kidney renal clear cell carcinoma in TCGA database, KIRC) within clinical specimens and in vitro experiments. Overall, our findings demonstrated the therapeutic, diagnostic, and prognostic potential of PLK1 across cancer types, especially in KIRC.
Materials and Methods
Data Collection and Clinical Samples
To obtain a comprehensive view of PLK1 expression patterns, four public datasets were included: TCGA,6,14 CCLE,15 the Genotype-Tissue Expression (GTEx),16 and human cell landscape databases (HCL)17 databases. In TCGA dataset, there were cancer tissues and normal tissues, which were harvested from various cancer types including adrenocortical carcinoma (ACC), bladder urothelial carcinoma (BLCA), breast invasive carcinoma (BRCA), cervical squamous cell carcinoma and endocervical adenocarcinoma (CESC), cholangiocarcinoma (CHOL), colon adenocarcinoma (COAD), lymphoid neoplasm diffuse large B-cell lymphoma (DLBC), esophageal carcinoma (ESCA), glioblastoma multiforme (GBM), head and neck squamous cell carcinoma (HNSC), kidney chromophobe (KICH), KIRC, kidney renal papillary cell carcinoma (KIRP), acute myeloid leukemia (LAML), brain lower grade glioma (LGG), liver hepatocellular carcinoma (LIHC), lung adenocarcinoma (LUAD), lung squamous cell carcinoma (LUSC), mesothelioma (MESO), ovarian serous cystadenocarcinoma (OV), pancreatic adenocarcinoma (PAAD), pheochromocytoma and paraganglioma (PCPG), prostate adenocarcinoma (PRAD), rectum adenocarcinoma (READ), sarcoma (SARC), skin cutaneous melanoma (SKCM), stomach adenocarcinoma (STAD), testicular germ cell tumors (TGCT), thyroid carcinoma (THCA), thymoma (THYM), uterine corpus endometrial carcinoma (UCEC), uterine carcinosarcoma (UCS) and uveal melanoma (UVM). The CCLE dataset consists of 21 cancer types, while GTEx has 31 types of normal tissues. Furthermore, one comprehensive single cell transcriptomic dataset: HCL was included, which covered 702,968 single cells from 60 human tissue types. The data collection and procession were performed in accordance with the human subject protection and data access policies of the corresponding datasets.
To validate the results in KIRC, a well-designed cohort: Clinical Proteomic Tumor Analysis Consortium (CPTAC) ccRCC cohort with 103 KIRC patients was included.18 In addition, after approval by the ethics committee of Nanjing First Hospital (Nanjing Medical University, China) on October 18, 2019, 32 pairs of cancer and adjacent normal tissues were obtained from patients pathologically diagnosed with KIRC, at the Department of Urology of Nanjing First Hospital from January 2020 to December 2020. The clinical and pathological characteristics of included patients were summarized in Table S1. All patients were treatment naïve before surgery and given written informed consent. All tissues were stored in liquid nitrogen for further use. This study was conducted in accordance with the Declaration of Helsinki.
Data Acquisition and Procession
Four potent biomarkers: TMB, MSI,19 MMR gene (MLH1, MSH2, MSH6, EPCAM, and PMS2) mutation status, and DNA methylation surrogate (four DNA methyltransferases: DNMT1, DNMT2, DNMT3A, and DNMT3B)20 of each tumor type were collected from the TCGA database. The expression data were log2 transformed for further analysis.
Tumor Immune Infiltration Analysis
To unravel the tumor microenvironment, Tumor Immune Evaluation Resource (TIMER) database was adopted, where six infiltrating immune cell (B cells, CD4+ T cells, CD8+ T cells, macrophages, dendritic cells, and neutrophils) scores were downloaded.21,22 Furthermore, we analyzed the StromalScore, ImmuneScore and ESTIMATEScore of each tumor type with ESTIMATE algorithm, which was embedded in Sangerbox online platform (http://www.sangerbox.com/tool). In addition, we collected 47 common ICGs23 from TIMER database.
Cell Culture
Human KIRC cell lines (Caki-1, 769-P, 786-O and ACHN) and normal epithelial cell-line HK-2 were purchased from Procell Life Science (Wuhan, China). The 786-O and 769-P cells were cultured in RPMI-1640 (Thermo Scientific, Shanghai, China). The ACHN and HK-2 cells were cultured in DMEM (Thermo Scientific, Shanghai, China). The Caki-1 cells were cultured in McCoy’s 5A (Thermo Scientific, Shanghai, China). All medium were mixed with 1% antibiotics (Thermo Scientific, Shanghai, China) and 10% fetal bovine serum (FBS; Thermo Scientific, Shanghai, China). Cell lines were maintained at 37°C and humidified atmosphere of 5% CO2.
Plasmid Construction and Transfection
The small interfering RNAs (siRNAs) against PLK1 or forkhead box protein M1 (FOXM1) gene were constructed with the aid of plasmids and obtained from Gene Pharma (Gene Pharma, Shanghai, China). When the cell density reached 50%, we used Lipofectamine 3000 Transfection Reagent (Thermo Scientific, Shanghai, China) to transfect cells. At 48–72 h, the cells were collected for subsequent analysis.
Quantitative Real-Time PCR (qRT-PCR)
Total RNA was extracted from tissues or cells in line with the instruction of Trizol reagent (Thermo Scientific, Shanghai, China). RNA purity and concentration was measured by Nanodrop 2000 spectrophotometer (Thermo Fisher Scientific). The PrimeScript RT reagent kit (Takara, Dalian, China) was used to perform reverse transcription. Finally, SYBR Green qPCR Kit (Takara, Dalian, China) was used to conduct qRT-PCR in ABI Prism 7500 Detection System (Applied Biosystems, USA). The PLK1 expression was calculated by the 2−ΔΔCt method. GADPH were appropriately used for internal reference.
Western Blotting
Total proteins were extracted using RIPA buffer (Beyotime, Shanghai, China). The same amount of proteins were isolated with 10% sodium dodecyl sulfate-polyacrylamide gel electrophoresis (SDS-PAGE) and transferred into polyvinylidene fluoride (PVDF) membranes (Millipore, Billerica, MA, USA). Afterward, the membranes were blocked in the 5% milk without fat and incubated with the primary antibodies against PLK1 (1:1000, 10305-1-AP, Proteintech, Chicago, USA), FOXM1 (1:1000, bs-21487R, Bioss, China, Beijing), Cyclin B1 (1:5000, 28603-1-AP, Proteintech, Chicago, USA), Aurora B (1:1000, bs-2445R, Bioss, China, Beijing), or GADPH (1:10000, 10494-1-AP, Proteintech, Chicago, USA) at 4°C overnight with gentle shaking. Goat anti-rabbit IgG antibody (1:10000, Proteintech, Chicago, USA) was used as the secondary antibody. The ECL system (Beyotime, Shanghai, China) was used to visualize the protein signals.
Cell Counting Kit-8 (CCK-8) Assay
A total of 2000–3000 cells were seeded in 96-well plates per well. It was detected by CCK8 kit (Dojindo, Kyushu, Japan) at 0h, 24 h, 48 h, 72 h, and 96 h. After adding 10 μL CCK8 reagent into each well for 2 h, an absorbance of 450 nm was detected by a microplate reader (Tecan, Männedorf, Switzerland).
EdU Assay
After seeding in 96-well plates for 24 h (1 × 10⁵ cells per well), the Cell-LightTM EdU Apollo® 567 In Vitro Imaging Kit (Ribobio, Guangzhou, China) was used for EdU staining. Fluorescence microscope (Carl Zeiss, Oberkochen, Germany) was adopted to photograph random fields. The percentage of EdU-positive cells (red fluorescently labeled cells) was calculated.
Cell Scratch Assay
KIRC cells were seeded in 6-well plates. When cell density reached 95%–100%, we used 10 μ L sterile pipette tip to form clear lines in the wells. Migration distance was captured at the time of 0 h and 24 h under an inverted microscope (Nikon, Tokyo, Japan).
Transwell Assay
Firstly, we added 100 μL Matrigel (Becton, Dickinson and Company, New York, USA) into 900μL serum-free medium and then coated to transwell inserts (Millipore, Billerica, MA, USA) at 37°C for 5 h. 2–4 × 10⁵ cells starved for 24 h were mixed in 100 μL serum-free medium and then seeded into the upper chamber. The 24-well plate was added 600 μL complete medium. Transwell inserts were cultured in incubators for 24 to 48 hours. And then we removed the matrigel and noninvasive cells on the upper surface. The cells on the bottom surface were fixed with 4% paraformaldehyde and stained with 0.5% crystal violet. Five fields were randomly selected for counting the invasion and migration cells.
Cell Cycle Analysis
After centrifugation, the transfected KIRC cells were fixed with ethanol (75%) at 4°C overnight. The supernatant was then discarded, followed by incubation with an RNA enzyme containing iodide (PI, 40%, Sigma-Aldrich). After washing three times, the cell cycle was detected using FACS Calibur (BD Biosciences, USA), and data analysis was conducted through Flowjo (version:10.6.2; BD Biosciences, USA). The experiment was repeated three times.
Bioinformatics and Statistical Analysis
The PLK1 expression levels between groups were evaluated with Kruskal–Wallis test and compared with Wilcoxon test. For survival analysis, two follow-up endpoints: overall survival (OS; defined as the time between the date of diagnosis and death from any cause) and disease-specific survival (DSS; defined as the time between the date of diagnosis and death from a specific disease) were adopted for univariate Cox regression and Kaplan–Meier (K-M) plot analyses. Pathway enrichment analysis was performed using gene sets downloaded from Kyoto Encyclopedia of Genes and Genomes (KEGG). The correlation of PLK1 expression with studied variables was evaluated using Spearman correlation. All bioinformatics and statistical analyses were performed using the R program (version:6.2; R Foundation for Statistical Computing, Vienna, Austria) or GraphPad Prism (version:7.0; GraphPad Software, San Diego, CA, USA). Two-sided P value <0.05 was considered statistically significant.
Results
Pan-Cancer Expression Landscape of PLK1
To characterize the baseline expression levels of PLK1 in normal tissues, the GTEx database was applied. As shown in Figure 1A, PLK1 expression varied across tissue types, which was highest in testis tissue and lowest in heart tissue. Furthermore, we unraveled the expression pattern of PLK1 in the single-cell resolution with the aid of HCL dataset. As summarized in Table S2, PLK1 was highly expressed in stem cells and fetal tissues. While focused on adult tissue types, we found that PLK1 expression level in testis ranked the top one, which was in line with the GTEx data (Figure 1B).
 |
Figure 1 PLK1 expression in the human pan-cancer. (A) PLK1 expression in 31 normal human tissues. (B) Expression levels of PLK1 in HCL dataset. (C) PLK1 expression in 27 types of cancer tissues compared to normal control. (D) PLK1 expression in 21 type of tumor cells. (***P<0.001). |
Based on the oncogene-like expression pattern of PLK1, we integrated the transcriptomic data from both TCGA and GTEx databases to explore the pan-cancer expression landscape of PLK1. After batch correction and differential analysis, PLK1 expressed highly in almost all cancer types except LAML and THCA (Figure 1C). Furthermore, we analyzed the PLK1 expression levels within various cancer cell lines based on the CCLE data (Figure 1D). In agreement with cancer tissue expression profiles, PLK1 expression was relatively high and heterogeneous in most cancer cell lines.
Prognostic Analysis of PLK1 Across Cancer Types
To determine whether PLK1 could predict patients’ prognosis, survival analyses including Cox and K-M were applied. As presented in Figure S1A, high PLK1 expression was a risk factor for ACC (P < 0.001), BRCA (P = 0.035), CHOL (P = 0.043), HNSC (P = 0.036), KICH (P < 0.001), KIRC (P < 0.001), KIRP (P < 0.001), LGG (P < 0.001), LIHC (P < 0.001), LUAD (P < 0.001), MESO (P < 0.001), PAAD (P < 0.001), PRAD (P = 0.012), SKCM (P = 0.0076), UCEC (P = 0.016), and UVM (P = 0.0048). In line with the univariate Cox regression analysis, K-M analysis (Figure 2) demonstrates that patients with higher PLK1 levels had a shorter OS in ACC (P < 0.001), BRCA (P = 0.0078), HNSC (P = 0.01), KICH (P < 0.001), KIRC (P < 0.001), KIRP (P < 0.001), LGG (P < 0.001), LIHC (P < 0.001), LUAD (P < 0.001), MESO (P < 0.001), PAAD (P < 0.001), PRAD (P = 0.02), SKCM (P < 0.001), UCEC (P = 0.0049), and UVM (P < 0.001). Furthermore, a similar pipeline was applied to evaluate the association of PLK1 expression with DSS. The Cox regression analysis indicated that high PLK1 expression was a risk factor for ACC (P < 0.001), CHOL (P = 0.037), KICH (P < 0.001), KIRC (P < 0.001), KIRP (P < 0.001), LGG (P < 0.001), LIHC (P < 0.001), LUAD (P < 0.001), MESO (P < 0.001), PAAD (P < 0.001), PRAD (P = 0.0022), SARC (P = 0.047), SKCM (P = 0.0058), THCA (P = 0.035), and UVM (P = 0.0048; Figure S1B). K-M plots showed that patients with higher PLK1 expression exhibited poorer DSS than those with lower PLK1 expression in ACC (P < 0.001), CHOL (P = 0.053), KICH (P < 0.001), KIRC (P < 0.001), KIRP (P < 0.001), LGG (P < 0.001), LIHC (P < 0.001), LUAD (P < 0.001), MESO (P < 0.001), PAAD (P = 0.0026), PRAD (P = 0.0064), SARC (P < 0.001), SKCM (P < 0.001), THCA (P = 0.0064), and UVM (P < 0.001), as seen in Figure 3. To sum up, the results showed that PLK1 expression was significantly associated with patients’ prognosis, especially in those with KIRC, KICH, and KIRP.
 |
Figure 2 Correlation between PLK1 expression in patients with OS. Survival analyses of PLK1 expression using the Kaplan-Meier OS curves in ACC (A), BRCA (B), CHOL (C), HNSC (D), KICH (E), KIRC (F), KIRP (G), LGG (H), LIHC (I), LUAD (J), MESO (K), PAAD (L), PRAD (M), SKCM (N), THYM (O), and UCEC (P). |
 |
Figure 3 Correlation between PLK1 expression in patients with DSS. Survival analyses of PLK1 expression using the Kaplan-Meier DSS curves in ACC (A), CHOL (B), KICH (C), KIRC (D), KIRP (E), LGG (F), LIHC (G), LUAD (H), MESO (I), PAAD (J), PRAD (K), SARC (L), SKCM (M), THCA (N), and UVM (O). |
PLK1 Expression is Associated with Immune Infiltration Levels and ICGs
Tumor-infiltrating lymphocytes are important parts of tumor microenvironment, which can be divided into six categories: B cells, CD4+ T cells, CD8+ T cells, dendritic cells, macrophages, and neutrophils. As summarized in Table S3, the correlation of PLK1 expression with the immune infiltrates differed across cancer types. Among them, KIRC, LIHC, and LUSC displayed the best correlation (Figure 4). In detail, PLK1 expression levels were positively associated with all six infiltrating lymphocyte levels in KIRC and LIHC, while negatively correlated in LUSC.
 |
Figure 4 The association of PLK1 expression with immune cell infiltration in KIRC, LIHC, and LUSC. |
To gain an overview of tumor infiltration levels and their association with PLK1 expression, ESTIMATE method was utilized. As shown Table S4 and Figures S2–S4, PLK1 expression was positively correlated with the StromalScore in KIRC and THCA while negatively correlated with that in BRCA, CESC, COAD, ESCA, GBM, HNSC, LIHC, LUAD, LUSC, PAAD, READ, SARC, SKCM, STAD, TGCT, THYM, and UCEC. In terms of ImmuneScore, the positive association between PLK1 expression was observed in KIRC, LGG, THCA, and THYM while negative association in ACC, CESC, ESCA, GBM, KIRP, LUAD, LUSC, PAAD, SARC, SKCM, STAD, TGCT, UCEC, and UCS. Besides, PLK1 expression positively correlated with the ESTIMATEScore in KIRC and THCA, while PLK1 expression negatively correlated with the ESTIMATEScore in ACC, BRCA, CESC, ESCA, GBM, HNSC, KIRP, LUAD, LUSC, PAAD, SARC, SKCM, STAD, TGCT and UCEC.
Furthermore, we collected 47 common ICGs to analyze the relationship with PLK1 expression and found that PLK1 expression was associated with multiple ICGs across different cancer types (Figure 5). In particular, the expression of PLK1 was positively correlated with the expression of a plethora of ICGs, such as CD276, PDCD1, PDCD1LG2, CD70, and CD86 in KIRC, LIHC and THCA. In contrast, PLK1 expression was negatively correlated with a series of ICGs in THCA, such as CD40LG, CD48, TNFRSF14 and TNFRSF25. Taken together, these data suggested that PLK1 might play a significant role in tumor immunity especially in KIRC.
 |
Figure 5 The association of PLK1 expression with immune checkpoint genes across different cancers (*P<0.05, **P<0.01, and ***P<0.001). |
Association Between PLK1 Expression and TMB or MSI in Human Pan-Cancer
TMB is a new biomarker for predicting the response to immune checkpoint inhibitors (ICIs),24,25 and its relationship with PLK1 expression remains to be explored. The results showed that PLK1 expression was positively related to TMB in BLCA, BRCA, CHOL, HNSC, KICH, KIRC, LGG, LUAD, LUSC, PAAD, PRAD, SARC, SKCM, STAD, and UCEC, while PLK1 expression was negatively related to TMB in THYM (Figure 6A). Furthermore, the relationship between PLK1 expression levels and MSI was investigated, which is another potential prediction biomarker for ICI response.26,27 As indicated in Figure 6B, PLK1 expression was positively correlated with TMB in BLCA, COAD, ESCA, LIHC, LUSC, SARC, STAD, TGCT, and UCEC, while it was negatively associated in DLBC and READ.
 |
Figure 6 Correlations between PLK1 expression and the TMB and MSI in various cancers. (A) Radar map of the correlation between PLK1 expression and the TMB. (B) Radar map of the correlation between PLK1 expression and MSI. |
PLK1 is Associated with Expression Levels of MMR Gene and DNA Methylation Across Cancers
DNA MMR is an intracellular mismatch repair mechanism, which is closely related to tumorigenesis.28 Therefore, the relationships between PLK1 and mutation levels of 5 MMR genes were evaluated. The results showed that PLK1 expression was highly related to mutation levels of 5 MMR genes in almost all cancer types, except CHOL and READ (Figure 7A). DNA methylation regulates epigenetic inheritance, and the deposition of methylation marks relies on the catalytic activity of DNMTs.29 As results, the association between the expression level of PLK1 with four DNMTs was explored. We found that PLK1 expression was remarkably correlated with these four DNMTs in almost all cancers except CHOL (Figure 7B). Taken together, the results suggested that PLK1 was involved in most cancer progression by mediating MMR or DNA methylation.
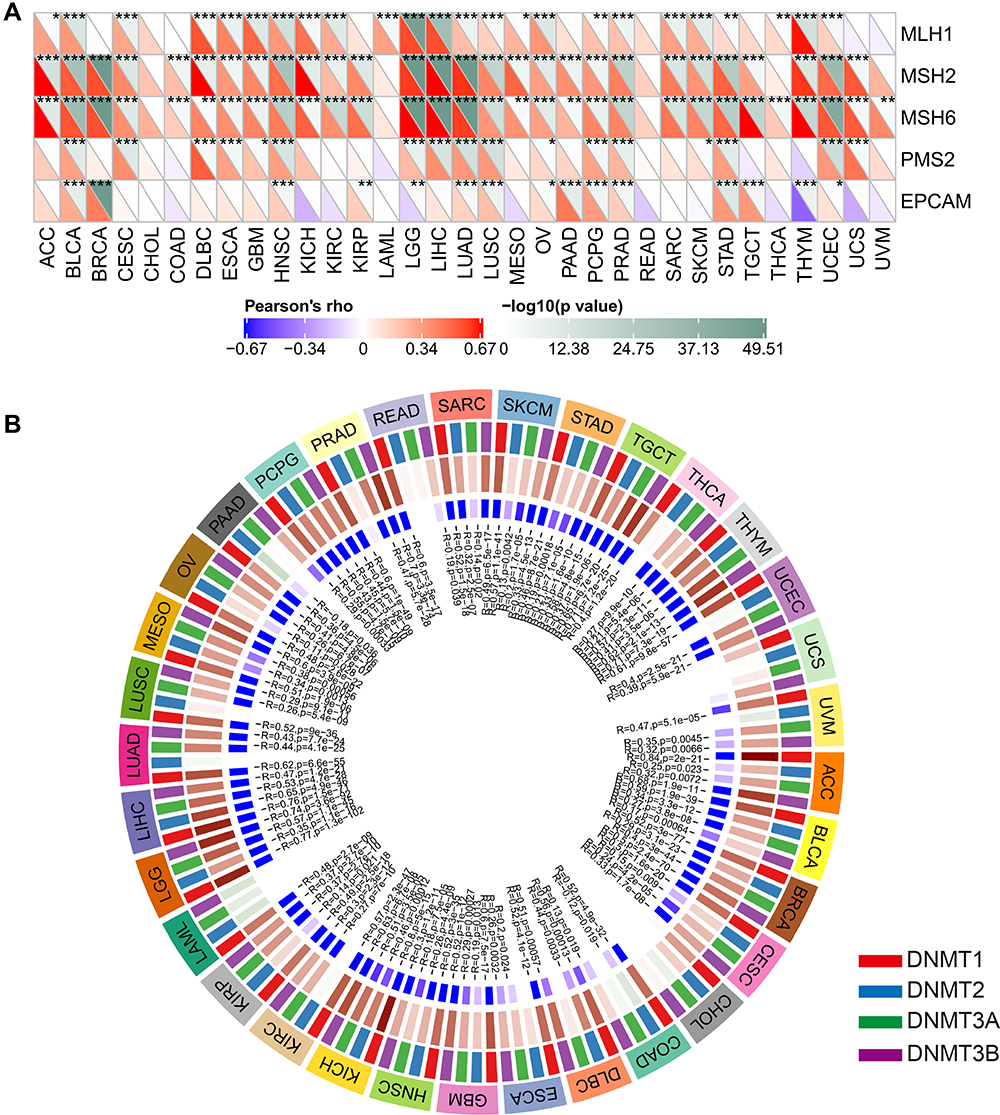 |
Figure 7 The association of PLK1 expression with expression levels of five MMR genes and four DNA methyltransferases. (A) The Spearman correlation analysis of PLK1 expression with expression levels of five MMR genes in cancers. (B) The Spearman correlation analysis of PLK1 expression with four DNA methyltransferases across cancers (*P<0.05, **P<0.01, and ***P<0.001). |
PLK1 is Over-Expressed in KIRC Tissue and Promotes KIRC Cell Proliferation, Migration, And Invasion
The aforementioned results have pinpointed the potent roles of PLK1 across tumor types, especially in KIRC, which accounts for approximate 4% of all human cancers. Hence, we focused on KIRC, with clinical sample verification and in vitro experiments to confirm the expression pattern and biological functions of PLK1 in KIRC. Initially, we validated the expression of PLK1 in CPTAC ccRCC cohort, which was determined with RNA sequencing method in cancer and normal control tissues. As presented in Figure 8A, PLK1 expression was significantly increased in KIRC tissues. We then applied qRT-PCR to detect PLK1 expression level in our center cohort. The results indicated that PLK1 was upregulated in KIRC tissues compared to matched normal peritumoral tissues (Figure 8B). Similar results were confirmed in the protein level with Western blot assays (Figure 8C). As compared to Table S1, PLK1 was highly expressed in KIRC patients with higher grade stage (P = 0.0177). Furthermore, we examined the expression level of PLK1 in KIRC cell lines (Caki-1, ACHN, 786-O, and 769-P) and normal control (HK2). The qRT-PCR results demonstrated the higher expression of PLK1 in KIRC cell lines than HK-2 cell, and 786-O and ACHN cells were chosen in the further functional experiments for the high endogenous expression of PLK1 (Figure 8D).
 |
Figure 8 Over-expressed PLK1 promoted cell proliferation, migration, and invasion in KIRC. (A) Relative expression of PLK1 in KIRC tissues compared to normal tissues in CPTAC ccRCC cohort. (B) Relative expression of PLK1 in KIRC tissues compared to normal tissues in our center. (C) The protein level of PLK1 in KIRC tissues and normal tissues. (D) Relative expression of PLK1 in human KIRC cell lines (Caki-1, 769-P, 786-O and ACHN) and normal epithelial cell line HK-2. (E) The efficiency of PLK1 siRNA (si-PLK1) in 786-O and ACHN cells was confirmed by qRT-PCR. (F–G) CCK-8 and EdU assays showed the cell proliferation ability was inhibited after transfected with si-PLK1. (H–I) Cell scratch and Transwell assays showed the suppressed migration and invasion ability of transfected KIRC cells. (ns>0.05, *P<0.05, **P<0.01, and ***P<0.001). |
To unravel the biological functions of PLK1 in KIRC, siRNA was adopted to knockdown PLK1 gene, which significantly reduced the PLK1 expression levels (Figure 8E). CCK-8 assay and EdU assay were carried out to detect whether PLK1 could affect the proliferative ability of KIRC cells. The results demonstrated that knockdown PLK1 remarkably inhibited cell proliferation in both cell lines (Figure 8F and G). Then, the cell scratch assay and transwell assay were conducted to detect the role of PLK1 in cell migration and invasion. The results revealed that cell migration and invasion were significantly suppressed in cells transfected with si-PLK1 (Figure 8H and I). Overall, the data suggested that PLK1 was over-expressed in KIRC tissue and could promote KIRC cell proliferation, migration, and invasion, which is consistent with previous studies.30–33
PLK1 Regulates FOXM1 and Targets Cell Cycle-associated Genes to Participate in Cell Cycle
To explore the potential mechanisms by which PLK1 participated in KIRC, we performed pathway enrichment analysis. We found that cell cycle pathway was highest enriched (Figure 9A), and PLK1 expression was positively correlated with cell cycle gene set score (Figure 9B). Thus, we examined the effect of PLK1 knockdown on the cell cycle. The results indicated that knockdown of PLK1 increased the percentage of cells in the G2/M phase (Figure 9C).
 |
Figure 9 PLK1 regulates FOXM1 and targets cell cycle-associated genes to participate in cell cycle. (A) Volcano plot of enriched pathways. (B) The correlation between PLK1 expression and cell cycle in KIRC. (C) Cell cycle analysis indicated the percentages of cells in the G2/M phase were increased after transfected with si-PLK1. (D) Volcano plot of correlated genes with PLK1 in KIRC. (E) Gene expression correlation between PLK1 and FOXM1 in KIRC. (F) The protein level of FOXM1, cyclin B1 and Aurora B in KIRC cells when PLK1 was down-regulated. (G) Cell cycle analysis indicated the percentages of cells in the G2/M phase were increased after transfected with si-FOXM1. (H) The protein level of FOXM1, cyclin B1 and Aurora B in KIRC cells when FOXM1 was down-regulated. (ns > 0.05, **P < 0.01, and ***P < 0.001). |
Furthermore, we explored the potential targets of PLK1. By screening the correlated genes with PLK1 in KIRC patients from TCGA database, we found that FOXM1 ranked first (Figure 9D) with a positive linear correlation (Figure 9E). FOXM1 has been reported to over express in KIRC tissue and promote carcinogenesis, partially via cell cycle control.34–37 As shown in Figure 9F, FOXM1 protein level was decreased when knockdown PLK1 in 786-O and ACHN cells, and a similar trend of cyclin B1 and aurora B was observed. Then, we validated the effects of FOXM1 on cell cycle. We found that cell numbers in the G2/M phase was increased in FOXM1 knockdown group compared to normal control (Figure 9G), and protein level of FOXM1, cyclin B1 and aurora B were decreased in si-FOXM1 group (Figure 9H), which was in line with previous reports.38,39 Taken together, the above results demonstrated that PLK1 might regulate FOXM1 and cell cycle-associated genes to participate in cell cycle.
Discussion
PLK1, a member of the polo-like kinases family, was firstly reported to be upregulated in primary tumor tissues in 1994,40 and involved in tumorigenesis and cancer progression in BRCA and SARC et al.10,12,13 However, the potential mechanisms and clinical translational potential of most cancers remain to be revealed. A pan-cancer analysis can compare the similarities and differences among different cancer types, which can help us better understand the mechanisms involved in tumorigenesis and cancer progression. In the present study, we firstly conducted a pan-cancer analysis of PLK1 expression across different cancer types. We found that PLK1 expression was increased and associated with a worse prognosis in most cancers. Besides, the analysis of immune infiltration levels and ICGs showed their association with PLK1 expression in human pan-cancer. Furthermore, PLK1 was related to TMB, MSI, MMR gene and DNA methylation across cancers. In vitro experiments showed that PLK1 was highly expressed in KIRC tissues. PLK1 could promote cell proliferation, migration, and invasion in 786-O and ACHN cells. Finally, PLK1 could regulate FOXM1 and target cell cycle-associated genes to participate in cell cycle, which reflects the biological function of PLK1 in tumor progression.
Mount studies have reported that overexpression of PLK1 in various cancers such as BLCA,41 COAD,42 HNSC,43 KIRC,31 and THCA.44 We integrated the data from TCGA and GTEx databases, and found that PLK1 was highly expressed in most tumor tissues, consistent with previous studies. However, the data indicated that PLK1 is decreased in LMAL and THCA tumor tissues, which is contrary to the results of published papers.45,46 Therefore, it is necessary to further confirm the PLK1 expression in different cancer types. We further verified the high expression of PLK1 in KIRC tissues compared to normal control with qRT-PCR method. In conclusion, these results suggest that PLK1 is abnormally expressed in various cancers and might be a novel biomarker for cancer.
Previous studies have reported contradictory roles of PLK1 in prognosis prediction. Otsu et al found that gastric cancer patients with higher PLK1 expression had a worse prognosis compared to those patients with lower PLK1 expression, but the difference was not statistically significant.47 On the other hand, the decreased PLK1 expression contributed to the shorter disease-free survival in rectal cancer patients receiving neoadjuvant chemoradiotherapy.48 In this study, we comprehensively analyzed the clinical information of 33 types of cancers within the TCGA database and found that higher PLK1 expression predicted poorer prognosis of patients, especially in ACC, BRCA, KICH, KIRC, KIRP, LGG, LIHC, LUAD, MESO, PAAD, and PRAD. Furthermore, we explored the prognosis predictive performance of PLK1 in our cohort. However, the follow-up time is too short (about one year) to draw conclusive results, and we will prolong the follow-up time in future. Hence, we conducted in vitro experiments, and found that PLK1 could promote cell proliferation, migration, and invasion in two KIRC cell lines (786-O and ACHN cells). In terms of mechanism, we found that PLK1 targeted cyclin B1 and aurora B to control cell cycle by regulating FOXM1.
Recent studies have expanded our view of tumor biology into tumor microenvironment (TME) rather than focusing on cancer cells. As important components of TME, immune and stromal cells played a key role in the initiation development of human malignancies.49,50 With the aid of TIMER algorithms to systemically profile the infiltrating levels of CD4+ T cells, CD8+ T cells, B cells, neutrophils, macrophages, and dendritic cells across cancer types, we found a significant association between PLK1 levels and some tumor infiltrates, which was most pronounced in KIRC. Furthermore, ESTIMATE algorithm with three generated variables (StromalScore, ImmuneScore, and ESTIMATEScore) was used to evaluate the prognosis of cancer patient, which can provide an overview of TME. The results indicated PLK1 was negatively correlated with these scores in most cancers. However, PLK1 was positively correlated with StromalScore, ImmuneScore and ESTIMATEScore in KIRC. Xu et al have reported the negative association of KIRC patients’ OS with all three scores.51 To sum up, PLK1 expression serves a key role in TME modulation of different cancer types, especially in KIRC.
With the deeper insights into TME, immunotherapy has attracted people’s attention and even become the first-line therapy in some tumors such as KIRC.52 At present, two types of ICI have achieved promising efficacy: CTLA-4 and PD-1 and its ligands, PD-L1 and PD-L253. The correlation analysis demonstrated a significant association between the expression of PLK1 and ICIs, indicating that PLK1 might serve as a potential ICI in future. One important problem in precision medicine is the optimal selection of particular patients, as the objective response rate to Nivolumab was about 25% in CheckMate 025 trial.54,55 Hence, it is of giant urgency to identify biomarkers with ICI response prediction potential; and TMB and MSI emerged as novel biomarker candidates in addition to tumor PD-L1 expression levels. Samstein et al suggested higher TMB is associated with more tumor neoantigens, which could facilitate immune recognition and promote anti-tumor immune response.56 In gastroesophageal carcinoma, tumors with high MSI showed a favorable response to ICIs.26 In this study, we illustrated the significant association between PLK1 and TMB and MSI in tumor samples. However, the mechanism of PLK1 affecting the expression of each ICI, TMB, and MSI remains to be further studied.
Gene mutations are the primary cause of tumorigenesis.57 MMR gene mutation disrupts the stability and integrity of the whole genome in normal cells.58 DNA methylation is a form of DNA chemical modification that alters gene expression without changing the DNA sequence.59 Both MMR and DNA methylation are associated with tumorigenesis. In conclusion, PLK1 expression was remarkably correlated to mutation levels of 5 MMR genes and four DNMTs in almost all cancers, which indicates that PLK1 serve as a key role in tumorigenesis at both genetic and epigenetic levels.
In this pan-cancer analysis, we comprehensively investigated various aspects of PLK1 and found that PLK1 might serve as a potent biomarker across cancer types, especially in the era of immunotherapy. However, there are still some limitations. First, this pan-cancer analysis is based on data integration from multiple databases with a large number of tumor and normal samples. However, there remains the potential to result in systematic bias due to the inherent methodology limitations. Second, this study characterized various roles of PLK1 at pan-cancer level with bioinformatics analysis, and validated the result with clinical specimens and in vitro experiments in KIRC. It will be more convincing to add in vivo or in vitro experiments in other cancer types except KIRC. Third, even though the significant association of PLK1 expression with tumor immunity is illustrated, the underlying mechanism remains to be explored. Nevertheless, our study provided a comprehensive understanding of PLK1, focusing on the association between PLK1 and prognosis of tumor patients and tumor immunity across cancer types.
Conclusions
In summary, our study has confirmed that the expression of PLK1 is associated with the prognosis of patients and immune infiltration in different cancers, specifically in KIRC. Besides, PLK1 expression was related to TMB, MSI, MMR gene and DNA methylation across cancers. Finally, in vitro experiments showed that PLK1 was highly expressed in KIRC tissues. PLK1 could promote cell proliferation, migration, and invasion in KIRC cells. In terms of mechanism, we found that PLK1 targeted cyclin B1 and aurora B to control cell cycle by regulating FOXM1. Therefore, PLK1 has the potential to be a prognostic marker and a novel target for tumor immunity in different cancers.
Abbreviations
PLK1, polo-like kinase 1; ICGs, immune checkpoint genes; TMB, tumor mutational burden; MSI, microsatellite instability; MMR, mismatch repair; TCGA, the Cancer Genome Atlas; TIMER, Tumor Immune Evaluation Resource; CCLE, Cancer Cell Line Encyclopedia; GTEx, Genotype-Tissue Expression; HCL, human cell landscape; ccRCC, clear cell renal cell carcinoma; PLKs, polo-like kinases; ACC, adrenocortical carcinoma; BLCA, bladder urothelial carcinoma; BRCA, breast invasive carcinoma; CESC, cervical squamous cell carcinoma and endocervical adenocarcinoma; CHOL, cholangiocarcinoma; COAD, colon adenocarcinoma; DLBC, lymphoid neoplasm diffuse large B-cell lymphoma; ESCA, esophageal carcinoma; GBM, glioblastoma multiforme; HNSC, head and neck squamous cell carcinoma; KICH, kidney chromophobe; KIRC, kidney renal clear cell carcinoma; KIRP, kidney renal papillary cell carcinoma; LAML, acute myeloid leukemia; LGG, brain lower grade glioma; LIHC, liver hepatocellular carcinoma; LUAD, lung adenocarcinoma; LUSC, lung squamous cell carcinoma; MESO, mesothelioma; OV, ovarian serous cystadenocarcinoma; PAAD, pancreatic adenocarcinoma; PCPG, pheochromocytoma and paraganglioma; PRAD, prostate adenocarcinoma; READ, rectum adenocarcinoma; SARC, sarcoma; SKCM, skin cutaneous melanoma; STAD, stomach adenocarcinoma; TGCT, testicular germ cell tumors; THCA, thyroid carcinoma; THYM, thymoma; UCEC, uterine corpus endometrial carcinoma; UCS, uterine carcinosarcoma; UVM, uveal melanoma; CPTAC, Clinical Proteomic Tumor Analysis Consortium; FBS, fetal bovine serum; siRNA, small-interfering RNA; FOXM1, forkhead box protein M1; qRT-PCR, quantitative real-time PCR; SDS-PAGE, sodium dodecyl sulfate-polyacrylamide gel electrophoresis; PVDF, polyvinylidene fluoride; CCK-8, cell counting kit-8; OS, overall survival; DSS, disease-specific survival; K-M, Kaplan–Meier; KEGG, Kyoto Encyclopedia of Genes and Genomes; ICIs, immune checkpoint inhibitors; TME, tumor microenvironment.
Data Sharing Statement
The primary results were obtained through mining public datasets, which were described in detail in this paper, and the remaining data are available upon reasonable request by contact with the corresponding authors.
Acknowledgments
Our gratitude goes to the public datasets including TCGA, CCLE, GTEx, HCL, and CPTAC et al for generating, curating, and providing high-quality biological and/or clinical data.
Funding
This work was supported by grants from the National Natural Science Foundation of China (81802531, 81570613, and 81370853), the Natural Science Foundation of Jiangsu Province (BK20170135), Youth Medical Talent Program of Jiangsu Province (QNRC2016073), Nanjing Medical Science and Technology Development Foundation for Distinguished Young Scholars (JQX18003), and “Six Talent Summit” Foundation of Jiangsu Province (2019-WSW-108).
Disclosure
The authors have declared that no competing interest exists.
References
1. Siegel RL, Miller KD, Fuchs HE, Jemal A. Cancer Statistics, 2021. CA Cancer J Clin. 2021;71(1):7–33.
2. Cancer Genome Atlas (TCGA) Research Network. Comprehensive genomic characterization defines human glioblastoma genes and core pathways. Nature. 2008;455(7216):1061–1068. doi:10.1038/nature07385
3. Barretina J, Caponigro G, Stransky N, et al. The cancer cell line encyclopedia enables predictive modelling of anticancer drug sensitivity. Nature. 2012;483(7391):603–607. doi:10.1038/nature11003
4. Blum A, Wang P, Zenklusen JC. SnapShot: TCGA-analyzed tumors. Cell. 2018;173(2):530. doi:10.1016/j.cell.2018.03.059
5. Hutter C, Zenklusen JC. The cancer genome atlas: creating lasting value beyond its data. Cell. 2018;173(2):283–285. doi:10.1016/j.cell.2018.03.042
6. Weinstein JN, Collisson EA, Mills GB, et al. The cancer genome atlas pan-cancer analysis project. Nat Genet. 2013;45(10):1113–1120. doi:10.1038/ng.2764
7. Golsteyn RM, Lane HA, Mundt KE, Arnaud L, Nigg EA. The family of polo-like kinases. Prog Cell Cycle Res. 1996;2:107–114. doi:10.1007/978-1-4615-5873-6_11
8. Lens SM, Voest EE, Medema RH. Shared and separate functions of polo-like kinases and Aurora kinases in cancer. Nat Rev Cancer. 2010;10(12):825–841. doi:10.1038/nrc2964
9. Shakeel I, Basheer N, Hasan GM, Afzal M, Hassan MI. Polo-like Kinase 1 as an emerging drug target: structure, function and therapeutic implications. J Drug Target. 2021;29(2):168–184.
10. Montaudon E, Nikitorowicz-Buniak J, Sourd L, et al. PLK1 inhibition exhibits strong anti-tumoral activity in CCND1-driven breast cancer metastases with acquired palbociclib resistance. Nat Commun. 2020;11(1):4053. doi:10.1038/s41467-020-17697-1
11. Shin CH, Lee H, Kim HR, Choi KH, Joung JG, Kim HH. Regulation of PLK1 through competition between hnRNPK, miR-149-3p and miR-193b-5p. Cell Death Differ. 2017;24(11):1861–1871. doi:10.1038/cdd.2017.106
12. Zhu J, Cui K, Cui Y, Ma C, Zhang Z. PLK1 knockdown inhibits cell proliferation and cell apoptosis, and PLK1 is negatively regulated by miR-4779 in osteosarcoma cells. DNA Cell Biol. 2020;39(5):747–755. doi:10.1089/dna.2019.5002
13. Wang B, Huang X, Liang H, et al. PLK1 inhibition sensitizes breast cancer cells to radiation via suppressing autophagy. Int J Radiat Oncol Biol Phys. 2021;110(4):1234–1247. doi:10.1016/j.ijrobp.2021.02.025
14. Colaprico A, Silva TC, Olsen C, et al. TCGAbiolinks: an R/Bioconductor package for integrative analysis of TCGA data. Nucleic Acids Res. 2016;44(8):e71. doi:10.1093/nar/gkv1507
15. Ghandi M, Huang FW, Jané-Valbuena J, et al. Next-generation characterization of the cancer cell line encyclopedia. Nature. 2019;569(7757):503–508. doi:10.1038/s41586-019-1186-3
16. Lonsdale J, Thomas J, Salvatore M, et al. The Genotype-Tissue Expression (GTEx) project. Nat Genet. 2013;45(6):580–585. doi:10.1038/ng.2653
17. Han X, Zhou Z, Fei L, et al. Construction of a human cell landscape at single-cell level. Nature. 2020;581(7808):303–309. doi:10.1038/s41586-020-2157-4
18. Clark DJ, Dhanasekaran SM, Petralia F, et al. Integrated proteogenomic characterization of clear cell renal cell carcinoma. Cell. 2019;179(4):964–983.e931. doi:10.1016/j.cell.2019.10.007
19. Jiang Z, Yin W, Zhu H, et al. METTL7B is a novel prognostic biomarker of lower-grade glioma based on pan-cancer analysis. Cancer Cell Int. 2021;21(1):383. doi:10.1186/s12935-021-02087-4
20. Zhou B, Gao S. Pan-cancer analysis of FURIN as a potential prognostic and immunological biomarker. Front Mol Biosci. 2021;8:648402. doi:10.3389/fmolb.2021.648402
21. Li T, Fan J, Wang B, et al. TIMER: a web server for comprehensive analysis of tumor-infiltrating immune cells. Cancer Res. 2017;77(21):e108–e110. doi:10.1158/0008-5472.CAN-17-0307
22. Xu WX, Zhang J, Hua YT, Yang SJ, Wang DD, Tang JH. An integrative pan-cancer analysis revealing LCN2 as an oncogenic immune protein in tumor microenvironment. Front Oncol. 2020;10:605097. doi:10.3389/fonc.2020.605097
23. Zhang Y, Zheng J. Functions of immune checkpoint molecules beyond immune evasion. Adv Exp Med Biol. 2020;1248:201–226.
24. Allgäuer M, Budczies J, Christopoulos P, et al. Implementing tumor mutational burden (TMB) analysis in routine diagnostics-a primer for molecular pathologists and clinicians. Trans Lung Cancer Res. 2018;7(6):703–715. doi:10.21037/tlcr.2018.08.14
25. Choucair K, Morand S, Stanbery L, Edelman G, Dworkin L, Nemunaitis J. TMB: a promising immune-response biomarker, and potential spearhead in advancing targeted therapy trials. Cancer Gene Ther. 2020;27(12):841–853. doi:10.1038/s41417-020-0174-y
26. van Velzen MJM, Derks S, van Grieken NCT, Haj Mohammad N, van Laarhoven HWM. MSI as a predictive factor for treatment outcome of gastroesophageal adenocarcinoma. Cancer Treat Rev. 2020;86:102024. doi:10.1016/j.ctrv.2020.102024
27. Oliveira AF, Bretes L, Furtado I. Review of PD-1/PD-L1 inhibitors in metastatic dMMR/MSI-H colorectal cancer. Front Oncol. 2019;9:396. doi:10.3389/fonc.2019.00396
28. Huang Y, Li GM. DNA mismatch repair in the context of chromatin. Cell Biosci. 2020;10(1):10. doi:10.1186/s13578-020-0379-7
29. Parry A, Rulands S, Reik W. Active turnover of DNA methylation during cell fate decisions. Nat Rev Genet. 2021;22(1):59–66. doi:10.1038/s41576-020-00287-8
30. Dufies M, Verbiest A, Cooley LS, et al. Plk1, upregulated by HIF-2, mediates metastasis and drug resistance of clear cell renal cell carcinoma. Commun Biol. 2021;4(1):166. doi:10.1038/s42003-021-01653-w
31. Gao Z, Man X, Li Z, et al. PLK1 promotes proliferation and suppresses apoptosis of renal cell carcinoma cells by phosphorylating MCM3. Cancer Gene Ther. 2020;27(6):412–423. doi:10.1038/s41417-019-0094-x
32. Zhang G, Zhang Z, Liu Z. Polo-like kinase 1 is overexpressed in renal cancer and participates in the proliferation and invasion of renal cancer cells. Tumor Biol. 2013;34(3):1887–1894. doi:10.1007/s13277-013-0732-0
33. Ding Y, Huang D, Zhang Z, et al. Combined gene expression profiling and RNAi screening in clear cell renal cell carcinoma identify PLK1 and other therapeutic kinase targets. Cancer Res. 2011;71(15):5225–5234. doi:10.1158/0008-5472.CAN-11-0076
34. Yang F, Wu Q, Zhang Y, et al. LncRNA LOC653786 promotes growth of RCC cells via upregulating FOXM1. Oncotarget. 2018;9(15):12101–12111. doi:10.18632/oncotarget.24027
35. Jiang Y, Zhang H, Li W, Yan Y, Yao X, Gu W. FOXM1-activated LINC01094 promotes clear cell renal cell carcinoma development via microRNA 224-5p/CHSY1. Mol Cell Biol. 2020;40(3). doi:10.1128/MCB.00357-19
36. Okato A, Arai T, Yamada Y, et al. Dual strands of pre-miR-149 inhibit cancer cell migration and invasion through targeting FOXM1 in renal cell carcinoma. Int J Mol Sci. 2017;18(9):1969. doi:10.3390/ijms18091969
37. Kelleher FC, O’Sullivan H. FOXM1 in sarcoma: role in cell cycle, pluripotency genes and stem cell pathways. Oncotarget. 2016;7(27):42792–42804. doi:10.18632/oncotarget.8669
38. Sakurai Y, Hatakeyama H, Akita H, Harashima H. Improvement of doxorubicin efficacy using liposomal anti-polo-like kinase 1 siRNA in human renal cell carcinomas. Mol Pharm. 2014;11(8):2713–2719. doi:10.1021/mp500245z
39. Fu Z, Malureanu L, Huang J, et al. Plk1-dependent phosphorylation of FoxM1 regulates a transcriptional programme required for mitotic progression. Nat Cell Biol. 2008;10(9):1076–1082. doi:10.1038/ncb1767
40. Holtrich U, Wolf G, Bräuninger A, et al. Induction and down-regulation of PLK, a human serine/threonine kinase expressed in proliferating cells and tumors. Proc Natl Acad Sci U S A. 1994;91(5):1736–1740. doi:10.1073/pnas.91.5.1736
41. Zhang Z, Zhang G, Kong C. High expression of polo-like kinase 1 is associated with the metastasis and recurrence in urothelial carcinoma of bladder. Urol Oncol. 2013;31(7):1222–1230. doi:10.1016/j.urolonc.2011.11.028
42. Takahashi T, Sano B, Nagata T, et al. Polo-like kinase 1 (PLK1) is overexpressed in primary colorectal cancers. Cancer Sci. 2003;94(2):148–152. doi:10.1111/j.1349-7006.2003.tb01411.x
43. Knecht R, Elez R, Oechler M, Solbach C, von Ilberg C, Strebhardt K. Prognostic significance of polo-like kinase (PLK) expression in squamous cell carcinomas of the head and neck. Cancer Res. 1999;59(12):2794–2797.
44. Ito Y, Miyoshi E, Sasaki N, et al. Polo-like kinase 1 overexpression is an early event in the progression of papillary carcinoma. Br J Cancer. 2004;90(2):414–418. doi:10.1038/sj.bjc.6601540
45. Brandwein JM. Targeting polo-like kinase 1 in acute myeloid leukemia. Ther Adv Hematol. 2015;6(2):80–87. doi:10.1177/2040620715571077
46. Zhang XG, Lu XF, Jiao XM, Chen B, Wu JX. PLK1 gene suppresses cell invasion of undifferentiated thyroid carcinoma through the inhibition of CD44v6, MMP-2 and MMP-9. Exp Ther Med. 2012;4(6):1005–1009. doi:10.3892/etm.2012.729
47. Otsu H, Iimori M, Ando K, et al. Gastric cancer patients with high PLK1 expression and DNA aneuploidy correlate with poor prognosis. Oncology. 2016;91(1):31–40. doi:10.1159/000445952
48. Cebrián A, Gómez Del Pulgar T, Fernández-Aceñero MJ, et al. Decreased PLK1 expression denotes therapy resistance and unfavourable disease-free survival in rectal cancer patients receiving neoadjuvant chemoradiotherapy. Pathol Res Pract. 2016;212(12):1133–1137. doi:10.1016/j.prp.2016.09.012
49. Liu W, Ye H, Liu YF, et al. Transcriptome-derived stromal and immune scores infer clinical outcomes of patients with cancer. Oncol Lett. 2018;15(4):4351–4357. doi:10.3892/ol.2018.7855
50. Kaderbhaï C, Tharin Z, Ghiringhelli F. The role of molecular profiling to predict the response to immune checkpoint inhibitors in lung cancer. Cancers. 2019;11(2):201. doi:10.3390/cancers11020201
51. Xu WH, Xu Y, Wang J, et al. Prognostic value and immune infiltration of novel signatures in clear cell renal cell carcinoma microenvironment. Aging. 2019;11(17):6999–7020. doi:10.18632/aging.102233
52. Rini BI, Battle D, Figlin RA, et al. The society for immunotherapy of cancer consensus statement on immunotherapy for the treatment of advanced renal cell carcinoma (RCC). J Immunother Cancer. 2019;7(1):354. doi:10.1186/s40425-019-0813-8
53. Couzin-Frankel J. Breakthrough of the year 2013. Cancer immunotherapy. Science. 2013;342(6165):1432–1433. doi:10.1126/science.342.6165.1432
54. Motzer RJ, Escudier B, McDermott DF, et al. Nivolumab versus everolimus in advanced renal-cell carcinoma. N Engl J Med. 2015;373(19):1803–1813. doi:10.1056/NEJMoa1510665
55. Xu W, Atkins MB, McDermott DF. Checkpoint inhibitor immunotherapy in kidney cancer. Nat Rev Urol. 2020;17(3):137–150. doi:10.1038/s41585-020-0282-3
56. Samstein RM, Lee CH, Shoushtari AN, et al. Tumor mutational load predicts survival after immunotherapy across multiple cancer types. Nat Genet. 2019;51(2):202–206. doi:10.1038/s41588-018-0312-8
57. Martincorena I, Campbell PJ. Somatic mutation in cancer and normal cells. Science. 2015;349(6255):1483–1489. doi:10.1126/science.aab4082
58. Fishel R. Mismatch repair. J Biol Chem. 2015;290(44):26395–26403. doi:10.1074/jbc.R115.660142
59. Klutstein M, Nejman D, Greenfield R, Cedar H. DNA methylation in cancer and aging. Cancer Res. 2016;76(12):3446–3450. doi:10.1158/0008-5472.CAN-15-3278
 © 2022 The Author(s). This work is published and licensed by Dove Medical Press Limited. The
full terms of this license are available at https://www.dovepress.com/terms
and incorporate the Creative Commons Attribution
- Non Commercial (unported, 3.0) License.
By accessing the work you hereby accept the Terms. Non-commercial uses of the work are permitted
without any further permission from Dove Medical Press Limited, provided the work is properly
attributed. For permission for commercial use of this work, please see paragraphs 4.2 and 5 of our Terms.
© 2022 The Author(s). This work is published and licensed by Dove Medical Press Limited. The
full terms of this license are available at https://www.dovepress.com/terms
and incorporate the Creative Commons Attribution
- Non Commercial (unported, 3.0) License.
By accessing the work you hereby accept the Terms. Non-commercial uses of the work are permitted
without any further permission from Dove Medical Press Limited, provided the work is properly
attributed. For permission for commercial use of this work, please see paragraphs 4.2 and 5 of our Terms.