Back to Journals » Journal of Hepatocellular Carcinoma » Volume 10
Pan-Cancer Profiling and Digital Pathology Analysis Reveal Negative Prognostic Biomarker ZPR1 Associated with Immune Infiltration and Treatment Response in Hepatocellular Carcinoma
Authors He L ![]() , Xie Y
, Xie Y ![]() , Qiu Y
, Qiu Y ![]() , Zhang Y
, Zhang Y
Received 1 May 2023
Accepted for publication 20 July 2023
Published 9 August 2023 Volume 2023:10 Pages 1309—1325
DOI https://doi.org/10.2147/JHC.S415224
Checked for plagiarism Yes
Review by Single anonymous peer review
Peer reviewer comments 2
Editor who approved publication: Prof. Dr. Jörg Trojan
Lian He,1 Yusai Xie,2 Yusong Qiu,1 Yong Zhang1
1Department of Pathology, Cancer Hospital of Dalian University of Technology (Liaoning Cancer Hospital & Institute), Shenyang, Liaoning, 110042, People’s Republic of China; 2Laboratory of Basic Medicine, General Hospital of Northern Theatre Command, Shenyang, Liaoning, 110016, People’s Republic of China
Correspondence: Yusai Xie, Laboratory of Basic Medicine, General Hospital of Northern Theatre Command, Shenyang, Liaoning, 110016, People’s Republic of China, Email [email protected] Yong Zhang, Department of Pathology, Cancer Hospital of Dalian University of Technology (Liaoning Cancer Hospital & Institute), Shenyang, Liaoning, 110042, People’s Republic of China, Email [email protected]
Purpose: ZPR1 is a zinc finger-containing protein that plays a crucial role in neurodegenerative diseases, lipid metabolism disorders, and non-alcoholic fatty liver disease. However, the expression pattern, prognostic value, and treatment response of ZPR1 in pan-cancer and hepatocellular carcinoma (HCC) remain unclear.
Patients and Methods: Pan-cancer expression profiles and relevant clinical data were acquired from UCSC Xena platform. Pan-cancer expression, epigenetic profile, and clinical correlation analysis for ZPR1 were performed. We next explored the prognostic significance and potential biological functions of ZPR1 in HCC. Furthermore, the relationship between ZPR1 and immune infiltration and treatment response was investigated. Finally, quantitative immunohistochemistry (IHC) analysis was applied to assess the correlation of ZPR1 expression and immune microenvironment in HCC tissues using Qupath software.
Results: ZPR1 was differentially expressed in most tumor types and significantly up-regulated in HCC. ZPR1 showed hypo-methylated status in most tumors. Pan-cancer correlation analysis indicated that ZPR1 was closely associated with clinicopathological factors and TMB, MSI, and stemness index in HCC. High ZPR1 expression could be an independent risk factor for adverse prognosis in HCC. ZPR1 correlated with immune cell infiltration and therapeutic response. Finally, IHC results suggested that ZPR1 correlated with CD4, CD56, CD68, and PD-L1 expression and is a promising pathological diagnostic marker in HCC.
Conclusion: Immune infiltrate-associated ZPR1 could be considered a novel negative prognostic biomarker for therapeutic response in HCC.
Keywords: hepatocellular carcinoma, ZPR1, prognosis, digital pathology, pan-cancer
Introduction
Malignant tumor is the second leading cause of death in the world and poses a severe threat to the life and health of all humankind. By 2020, hepatocellular carcinoma (HCC) was the sixth most frequent cancer and the third leading cause of cancer death globally.1 The 5-year relative survival rate of HCC in the United States is 20%.2 With the rapid development of precision tumor therapy, it is crucial to develop more sensitive and effective biomarkers to guide the selection of optimal clinical treatment plans effectively. Pan-cancer research combined with multiple omics analysis in specific tumors has been used to identify tumor markers and signaling pathways and help us understand the molecular mechanism of biomarkers in cancer development.
ZPR1 zinc finger (ZPR1), also known as ZNF259, is ubiquitously expressed and evolutionarily conserved in mammalian cells. ZPR1 was first found to bind to the tyrosine kinase domain of cytoplasmic epidermal growth factor receptor (EGFR) through the zinc finger domain.3 ZPR1 has been shown to interbinds with eukaryotic translation elongation factor 1A (eEF1A) to form the ZPR1-eEF1A complex, which is essential for cell replication, cell cycle progression, and survival.4–6 Increasing evidence has demonstrated that ZPR1 is associated with spinal muscular atrophy (SMA),7–15 type 2 diabetes,16 non-alcoholic fatty liver disease (NAFLD),17 metabolic syndrome,18 hypertriglyceridemia,17–23 and growth restriction.24 In tumors, ZPR1 serves a specific role in carcinogenesis and development. Previous research has reported that ZPR1 is upregulated and promotes the malignant progression of breast cancer.25 In contrast, Shan et al found that ZPR1 was downregulated and inhibited the proliferation and invasion of lung cancer.26 To date, the expression level, prognostic value, and potential molecular functions of ZPR1 in pan-cancer and HCC are not clear.
Based on the integrated data analyzed from TCGA, GTEx, GENT2, UALCAN, and Kaplan–Meier databases, as well as the experiment validated by IHC assay, our research applied the comprehensive bioinformatics methods to explore the ZPR1 expression in pan-cancer and its correlation with prognostic significance and immune infiltrate in HCC, aiming to reveal the ZPR1 biological function in malignant progression and its potential as a novel independent prognostic predictor for HCC.
Materials and Methods
Data Source Collection
The pan-cancer gene expression profiles (HT Seq-TPM) and clinical data of 33 tumors based on Genotype-Tissue Expression (GTEx) and The Cancer Genome Atlas (TCGA) databases were acquired from UCSC Xena platform (https://xena.ucsc.edu). Detailed information on 33 cancers was presented in Supplementary Table 1.
Pan-Cancer Expression and Clinical Correlation Analysis of ZPR1
The ZPR1 pan-cancer mRNA expression was then extracted and visualized using R package limma. UALCAN-CPTAC platform (http://ualcan.path.uab.edu/) was utilized to retrieve ZPR1 protein expression difference in pan-cancer. The ZPR1 expression in different tissues/cells and subcellular localization were retrieved from Human Protein Atlas platform (https://www.proteinatlas.org/). We investigated DNA methylation profile of ZPR1 by retrieving the SMART platform (http://www.bioinfo-zs.com/smartapp/).We looked into the association between ZPR1 expression and pan-cancer clinicopathological features (including age, gender, tumor status, and pathological stage). The values of the pan-cancer stemness index,27 TMB (tumor mutation burden),28 and MSI (microsatellite instability)29 were obtained from previous reports. Spearman correlation analysis of ZPR1 expression with pan-cancer stemness index, TMB, and MSI values was performed.
Expression Difference Analysis and Prognostic Analysis of ZPR1 in HCC
The GENT2 database (http://gent2.appex.kr/gent2/) collects the expression profiles of multiple GEO datasets based on the GPL96 and GPL570 platforms. The GENT2 tool was adopted to visualize the ZPR1 mRNA expression difference in the GEO database. The chi-square test was utilized to look into the correlation between ZPR1 and pathological parameters. Kaplan-Meier (K-M) survival analysis for progression-free survival (PFS) and overall survival (OS) were carried out on the TCGA HCC samples and verified by using Kaplan-Meier plotter database. The independent prognostic evaluation of ZPR1 expression and clinicopathological characteristics were performed using cox regression analyses. R package rms was applied to construct a nomogram to predict the 1-year and 3-year OS of HCC patients based on ZPR1 expression.
Interaction Factors and Functional Enrichment Prediction of ZPR1 in HCC
With the criteria of p < 0.001 and Pearson correlation coefficient > 0.3, co-expression analysis was adopted to determine the interaction factors associated with ZPR1. The harmonizome database (https://maayanlab.cloud/Harmonizome/), collecting the transcription factor-target gene prediction information from the CHEA, ENCODE, and JASPAR databases, was adopted to predict the target genes of the potential transcription factor ZPR1. The correlation scatter plots between ZPR1 and potential target genes were undertaken. Kyoto Encyclopedia of Genes and Genomes (KEGG), Gene Ontology (GO), and Gene set enrichment analysis (GSEA) were performed to investigate the potential molecular functions, biological processes, and tumor-related pathways of ZPR1. We screened the ZPR1-associated differentially expressed genes (DEGs) with a threshold of |log Fold Change| > 0.5 and FDR < 0.05. The KEGG and GO analyses of ZPR1-related DEGs were carried out with R package ClusterProfiler. GSEA was conducted with the GSEA tool (https://www.gsea-msigdb.org/gsea).
Assessment of Immune Characteristics in HCC
R package ESTIMATE was adopted to evaluate tumor microenvironment (TME) scores for TCGA-HCC samples. The scores of 22 immune cell infiltration in HCC samples were analyzed by the robust method CIBERSORT. Furthermore, the multiple algorithms quantified immune cell infiltration scores of the TCGA-HCC samples were acquired from TIME database (http://cistrome.shinyapps.io/timer/). Pearson correlation analysis with a significance threshold of p < 0.001 was performed between ZPR1 expression and 79 previously reported immune checkpoint genes (ICG).30 Using the single-sample gene set enrichment analysis (ssGSEA) method with R package GSVA, the degree of immune cell infiltration and the activity level of immune-related functions were evaluated in HCC samples. The TISCH2 database (http://tisch.comp-genomics.org/) was utilized to investigate the correlation between the ZPR1 and TME-associated cells at the single-cell level.
Treatment Response Prediction
The significance of ZPR1 in predicting clinical response to HCC therapy was further evaluated. We then predicted the ZPR1 sensitivity to immune checkpoint blockade therapy using the TIDE tools (http://tide.dfci.harvard.edu/).31 TIDE score, including T cell dysfunction score and exclusion scores, was used to evaluate the ZPR1 resistance to immune checkpoint blockade (ICB) treatment. The dysfunction score predicts T cell exhaustion status and tumor immune evasion signature. T cell exclusion score predicts immune escape by evaluating immunosuppressive cells. Furthermore, we compared the ZPR1 susceptibility to common HCC therapeutic agents using R package pRRophetic (p < 0.01).
Patient Specimen Collection and Immunohistochemistry (IHC)
Two tissue microarrays (TMA) were constructed from the paraffin-embedded tissue blocks with 70 HCC tissues and 30 adjacent liver tissues collected from the Department of Pathology, Liaoning Cancer Hospital & Institute. All cases were HCC specimens confirmed by pathology. The IHC protocol was conducted as previously described.32 IHC experiment was conducted following the manufacturer’s instructions with ZSGB immunohistochemical staining kit (PV-9000, ZSGB-BIO, Beijing, China). The TMAs were incubated overnight with commercial antibodies at 4 °C. Detailed information about antibodies is provided in Table 1. PD-L1 IHC 22C3 pharmDx kit was applied to evaluate the PD-L1 expression on the DAKO Link-48 Autostainer system.
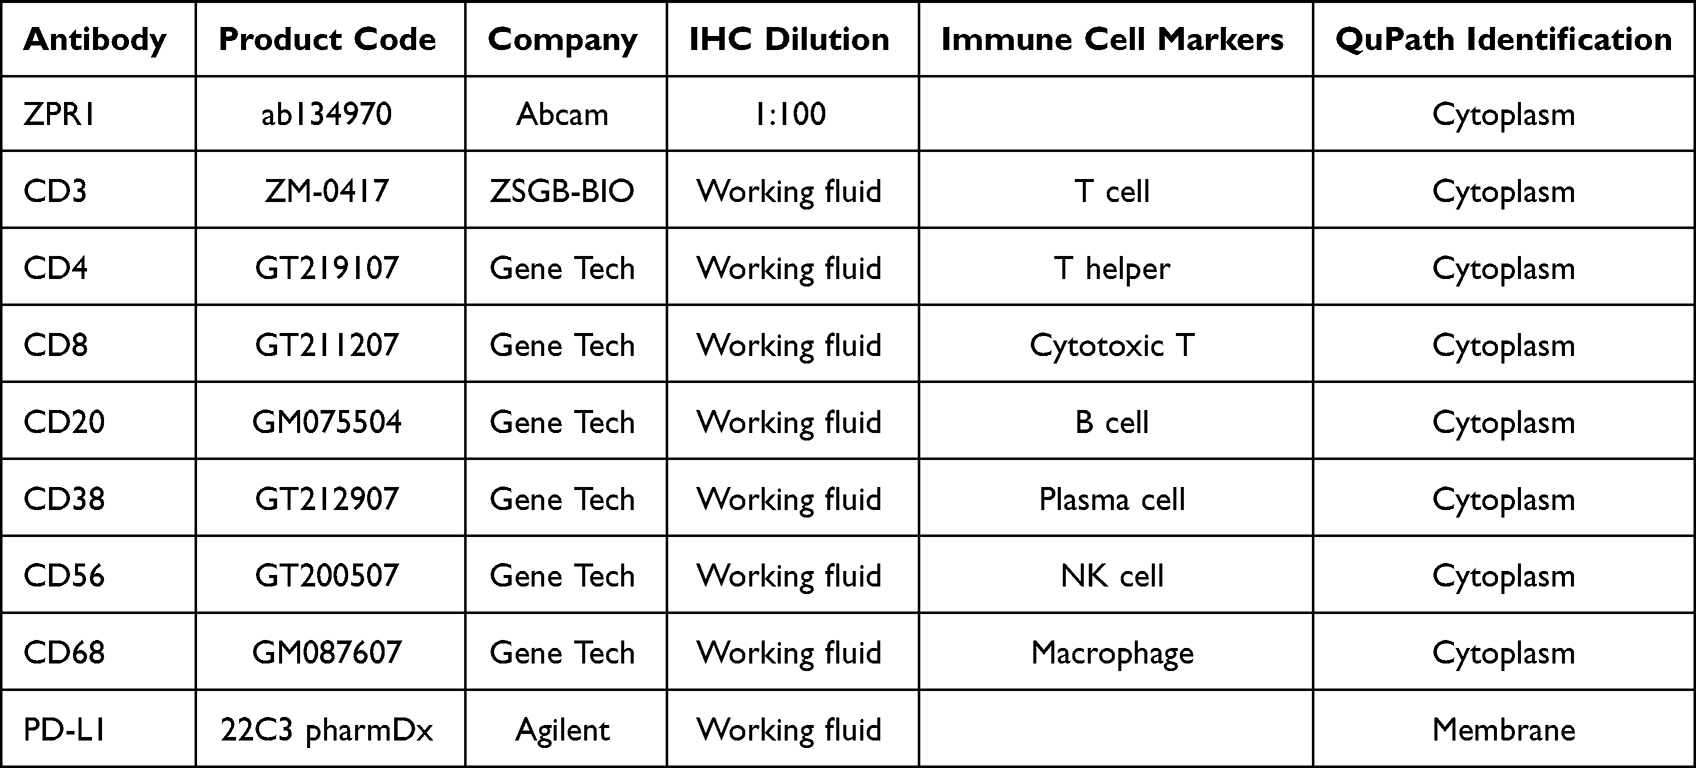 |
Table 1 The Detailed Information About antibodies in This Research |
Digital Quantitative IHC Evaluation by QuPath Software
The TMAs were scanned by the digital whole slide scanner (Hamamatsu NanoZoomer) and quantitatively analyzed using QuPath software (version 0.4.1, https://qupath.github.io/).33 The histochemistry scores (H-score) calculated by QuPath software were adopted for subsequent analyses.34 In short, the plug-in TMA dearrayer was used to identify each tissue point, and then plug-in cell detection was applied to perform cell identification and quantification. An object classifier is trained to classify individual cells as tumor or stromal. Finally, the H-score was obtained by setting the identification intensity feature according to different antibody staining distributions (Table 1). H-score intensity thresholds were set as 0.1, 0.2, and 0.3, respectively. Combined positive score (CPS) and tumor cell proportion score (TPS) are commonly used clinical methods for evaluating CD274 (PD-L1). With 1% as the positive threshold, the correlation between ZPR1 and CPS, TPS in HCC was analyzed.35
Statistical Analysis
R software (version 4.1.0) was utilized to perform all bioinformatics statistical analyses. In IHC, the scatter plot of the ZPR1 expression difference was analyzed using the Wilcox signed-rank test. The association of ZPR1 with immune cell makers was evaluated by Spearman correlation analysis. Unless otherwise indicated, statistical significance was defined as p < 0.05.
Results
The ZPR1 Was Differentially Expressed in Pan-Cancer
As a first step, we investigated the ZPR1 expression difference in pan-cancer. Considering that some cancer types do not have corresponding normal tissues, we integrated the normal tissue expression profile of GTEx database on the basis of TCGA database and systematically explored the ZPR1 mRNA expression differences in 33 cancer types. We found that ZPR1 mRNA expression was up-regulated in most tumors, including BRCA, colorectal cancer (CRC), KIRC, GBM, HNSC, lung cancer (LC), PAAD, STAD, and HCC (Figure 1A and B). Furthermore, the tumor tissues paired analysis of TCGA samples suggested that ZPR1 mRNA expression was also significantly increased in CRC, HNSC, KIRC, LC, STAD, PAAD, and HCC tissues (Figure 1C). In the UCLACN-CPTAC database, a significant up-regulation of ZPR1 protein expression was observed in CRC, KIRC, LC, HNSC, GBM, PAAD, and HCC tissues (Figure 1D). The results retrieved from the HPA website demonstrated that ZPR1 was widely expressed in various human tissues and cell types (Figure 1E and F). ZPR1 was highly expressed in the liver, testis, skeletal muscle and bone marrow tissues, and myeloid and lymphoid cell lines. Immunofluorescence studies showed that ZPR1 was scattered localized in the nucleus and cytoplasm, proposing that ZPR1 may be localized to the vesicles (Figure 1G).
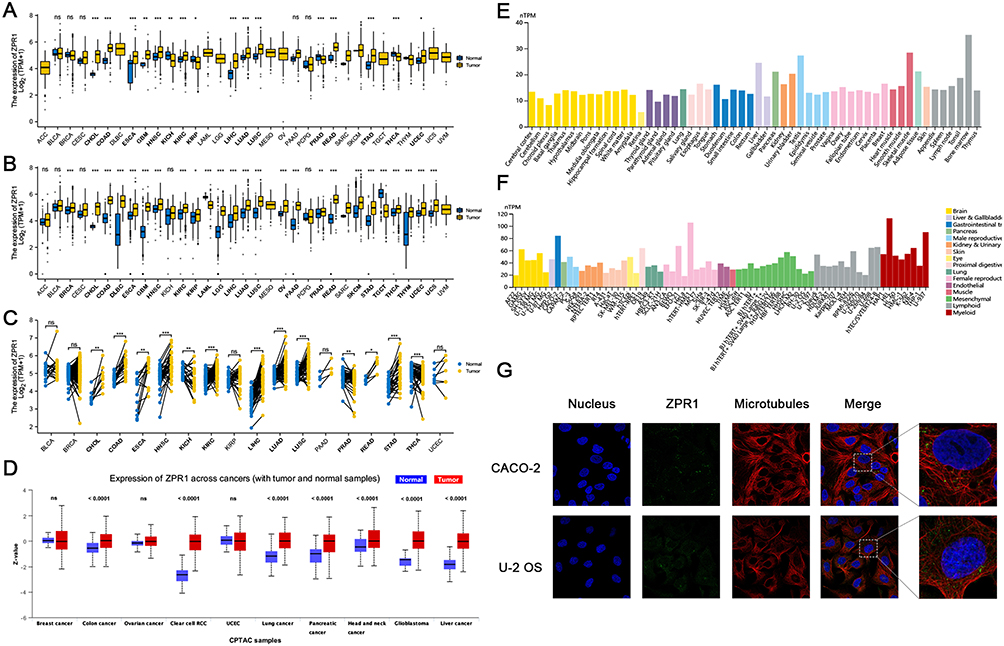 |
Figure 1 The ZPR1 expression in pan-cancer. (A) ZPR1 expression in pan-cancer tissues from TCGA database. (B) ZPR1 expression in pan-cancer tissues based on TCGA and GTEx databases. (C) ZPR1 expression in paired tumor and adjacent normal tissues from TCGA database. (D) ZPR1 protein expression in pan-cancer tissues from the UALCAN-CPTAC database. ZPR1 mRNA expression in various tissues (E) and cancer cell lines (F) from the HPA database. (G) Cellular localization of ZPR1 from the HPA database. *p < 0.05; **p < 0.01; and ***p < 0.001. Abbreviation: Ns, no significance. |
The DNA Methylation Profile of ZPR1 in Pan-Cancer
Further, we investigated the ZPR1 methylation level in attempt to elucidate the reasons for the high ZPR1 expression in most tumors. As shown in Figure 2A and B, 14 methylation probes associated with ZPR1 were identified on chromosome 11, including seven island regions (cg01218534, cg23953395, cg22654495, cg06541888, cg27192902, cg19345149, cg17490921), three S Shore region (cg12395125, cg20570279, cg05447673), one S Shelf region (cg14815609), one N Shore region (cg16408784), one N Shelf region (cg26548001), and an unidentified region (cg06595719). We then explored the ZPR1 methylation level in pan-cancer. In BLCA, BRCA, SARC, LC, PRAD, and HCC, the ZPR1 methylation level was significantly lower than in normal tissues (Figure 2C). The above results indicate the up-regulation of ZPR1 in various tumors may be due to its hypo-methylation status.
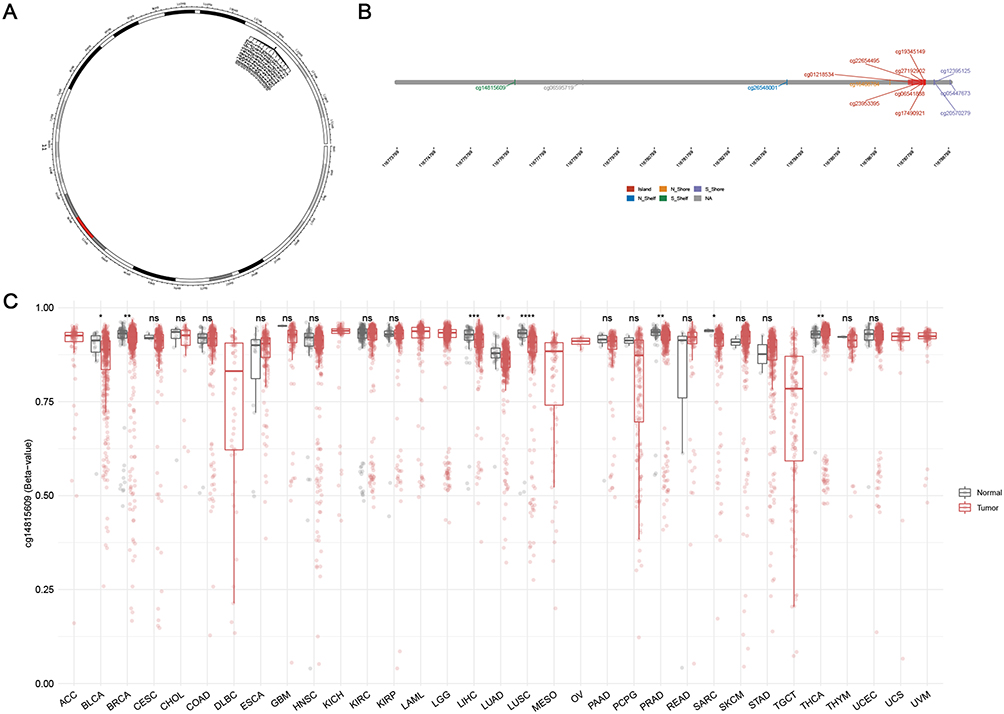 |
Figure 2 DNA methylation analysis of ZPR1. (A) Chromosomal distribution of the 14 methylation probes associated with ZPR1 on chromosome 11. (B)Detailed location of 14 probes in CpG Island. (C) ZPR1 methylation levels in tumor and normal samples cross different types of cancers. p > 0.05; *p <= 0.05; **p <= 0.01; ***p <= 0.001; ****p <= 0.0001. Abbreviation: Ns, no significance. |
ZPR1 Correlated with Pan-Cancer Clinicopathological Characteristics, TMB, MSI, and Stemness Values
We then evaluated the clinical correlation of ZPR1 in patients with different tumor types. We observed that ZPR1 expression was closely related to age in BRCA, LUAD, KIRP, STAD, READ, THCA, TGCT, and UVM (Figure 3A). In ACC, LGG, PRAD, and THYM, ZPR1 expression was closely correlated with tumor status (Figure 3B). Furthermore, we found that the ZPR1 expression in HCC was differentially expressed in gender and pathological stage (p < 0.05, Figure 3C and D). In addition, ZPR1 expression was closely correlated with TMB, MSI, and stemness values in HCC (Figure 3E–G). The pan-cancer clinical correlation results indicated that ZPR1 might serve a critical role in HCC development. Thus, the relationship between ZPR1 expression and prognosis of HCC was further investigated.
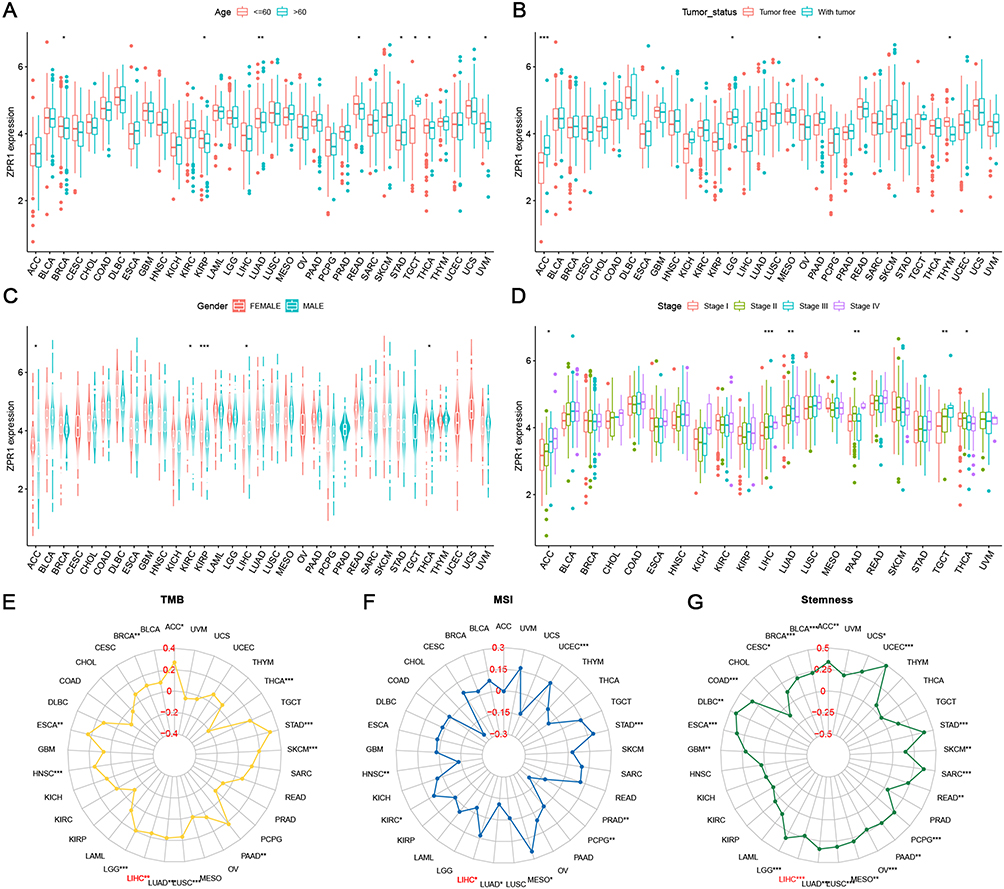 |
Figure 3 Clinical correlation analysis between the ZPR1 expression and patient’s age (A), gender (B), tumor status (C), pathological stage (D), TMB (E), MSI (F), and stemness (G) in pan-cancer. *p < 0.05; **p < 0.01; ***p < 0.001. |
High ZPR1 Expression Was Strongly Correlated with the Unfavorable Outcome of HCC
The up-regulation of ZPR1 in HCC retrieved from the GENT2 database (Figure 4A) was in accordance with the above TCGA differential expression analysis (Figure 1A and B). Then, we looked into the correlation between the ZPR1 expression and HCC clinicopathological features using chi-square test. As demonstrated in Figure 4B, ZPR1 expression was remarkably correlated with pathological stage, T stage, and tumor grade of HCC. K-M survival analyses indicated that high ZPR1 expression group had shorter OS (p < 0.001, Figure 4C). The median OS of the ZPR1 high expression group was 2.2932 years, compared to 5.8384 years for the low expression group. Consistent results were observed for PFS (1.3836 vs 2.4438 years, p = 0.019; Supplementary Figures 1A). Additionally, the negative connection between high ZPR1 expression and favorable prognosis in HCC patients was verified using the Kaplan-Meier plotter database (Supplementary Figures 1B and C). Furthermore, subgroup survival analysis stratified by different clinicopathological features indicated that high expression of ZPR1 was closely associated with unfavorable outcomes (Table 2). The above results show that the ZPR1 expression is negatively related to the survival of HCC patients, and therefore inhibiting ZPR1 expression may be a useful intervention strategy.
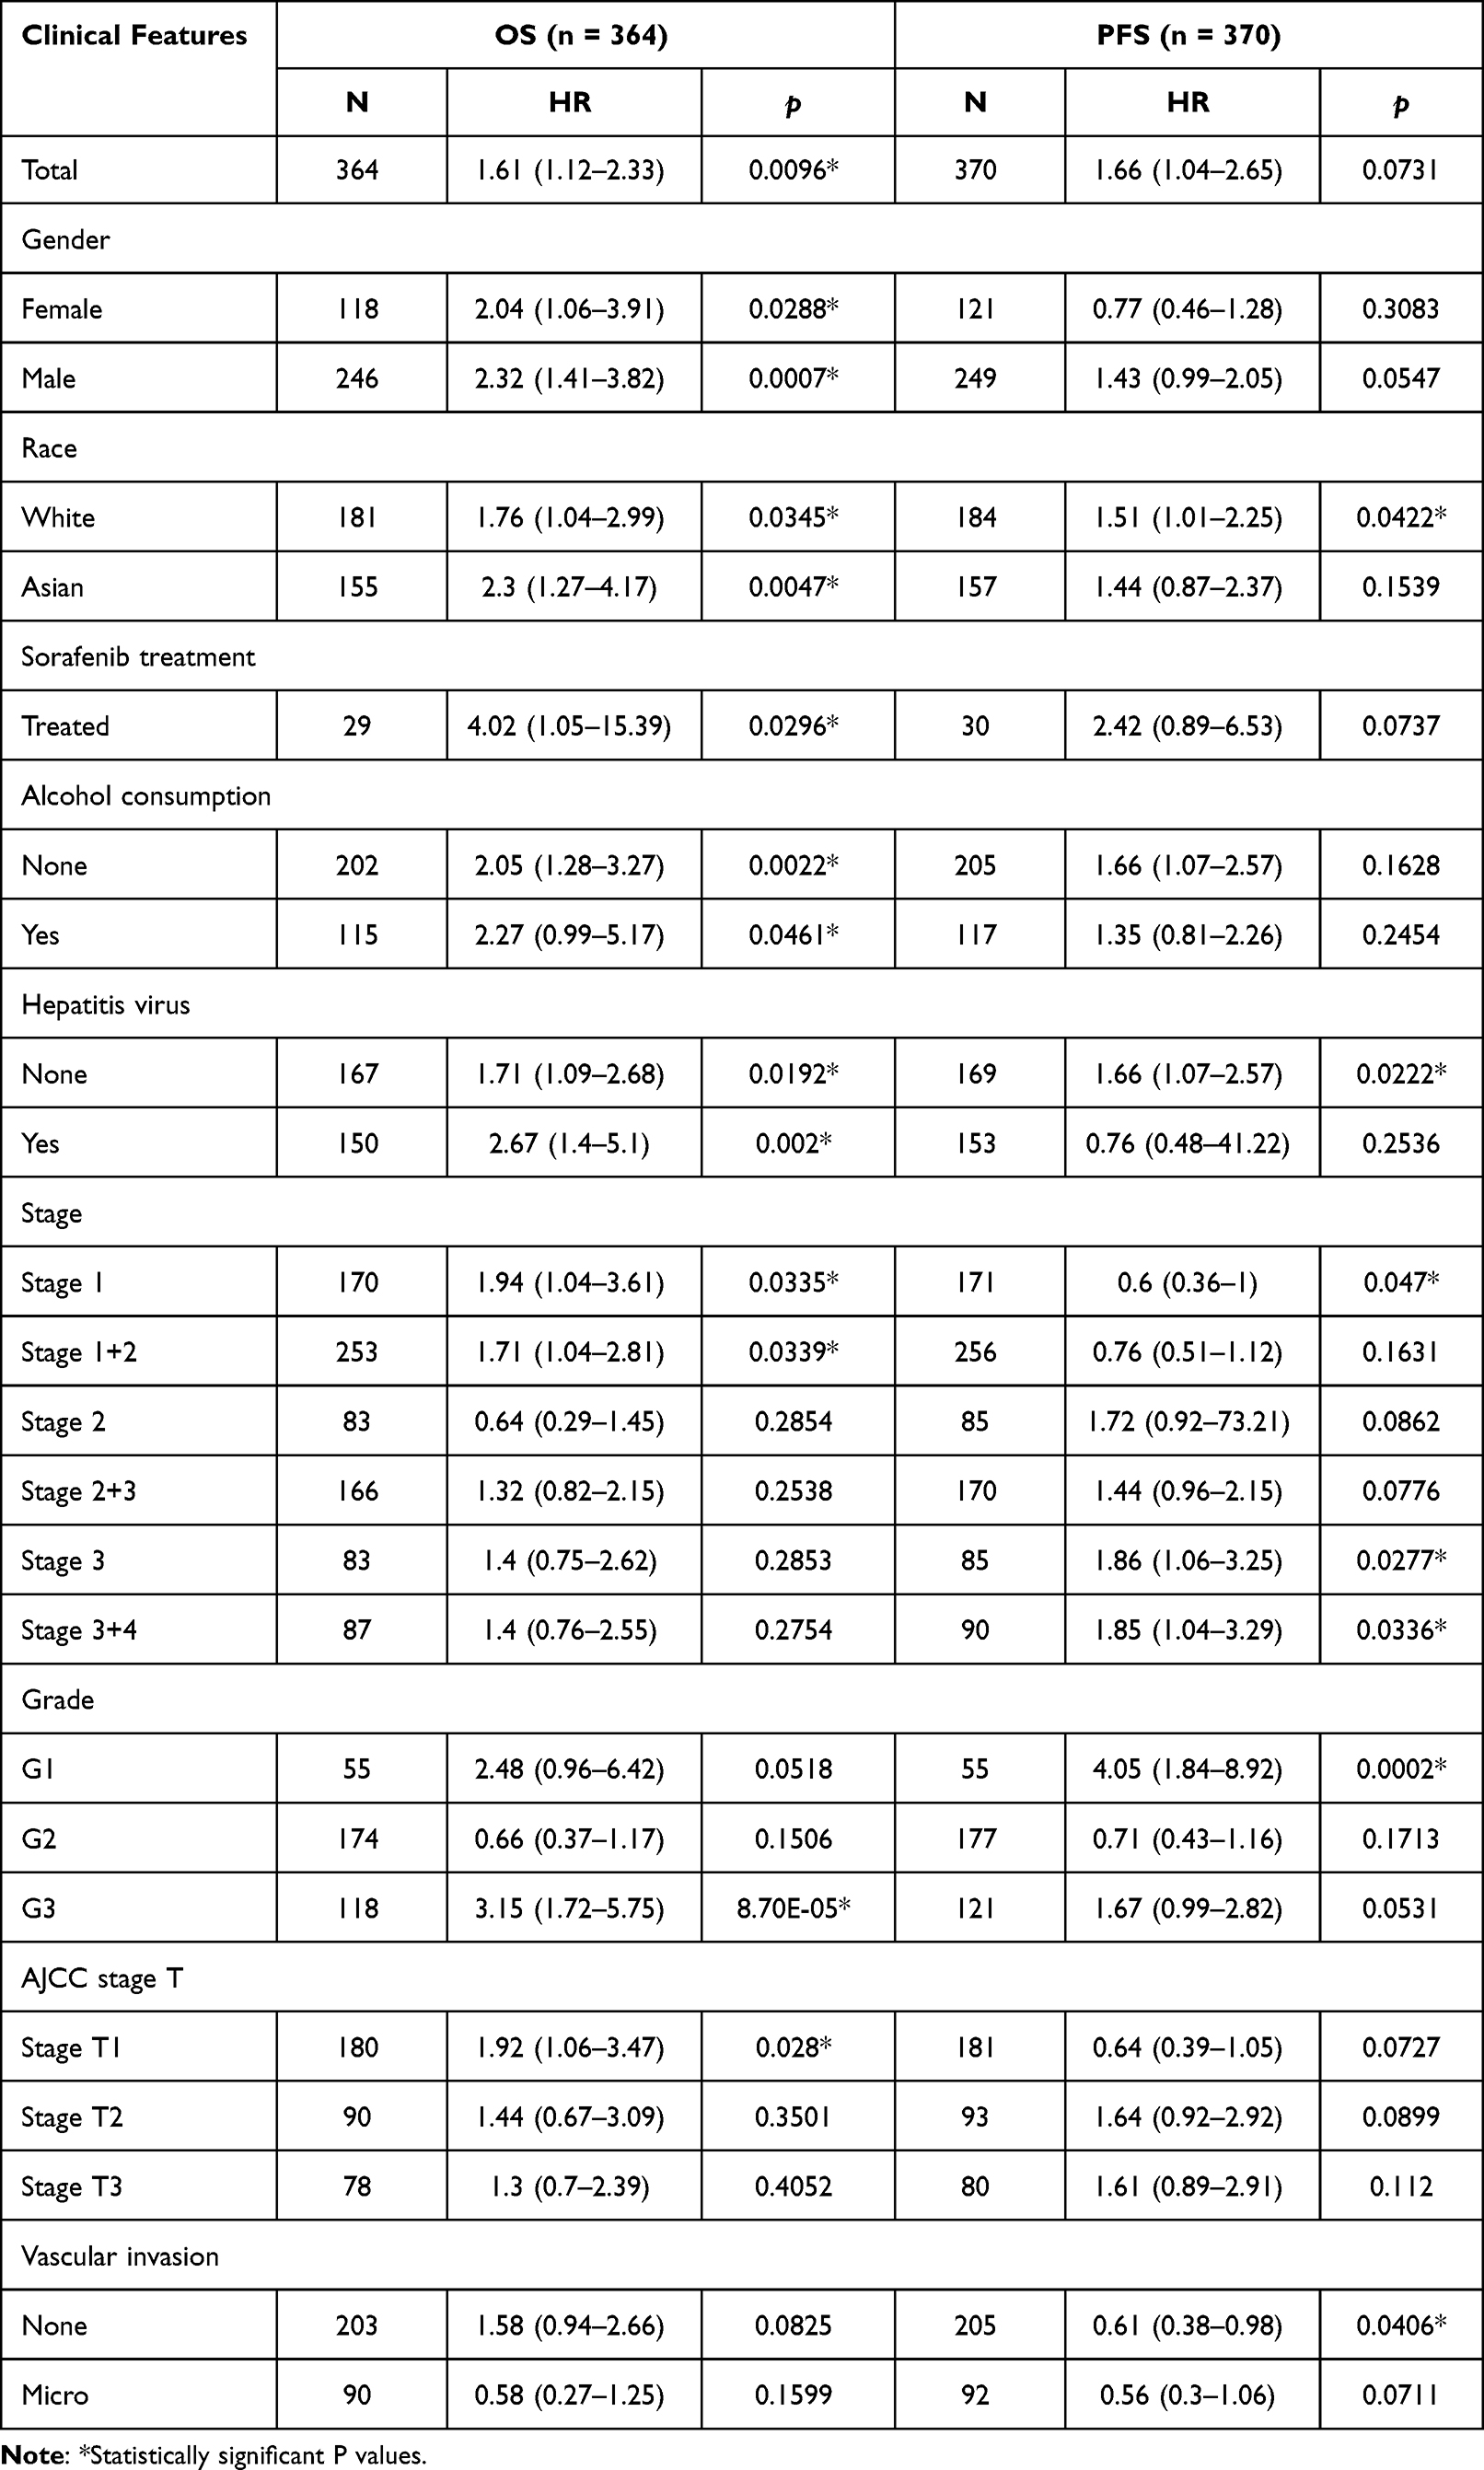 |
Table 2 The Prognostic Values of ZPR1 (RNAseq ID: 8882) Expression Stratified by Different Clinicopathologic Features from Kaplan-Meier Plotter Databases |
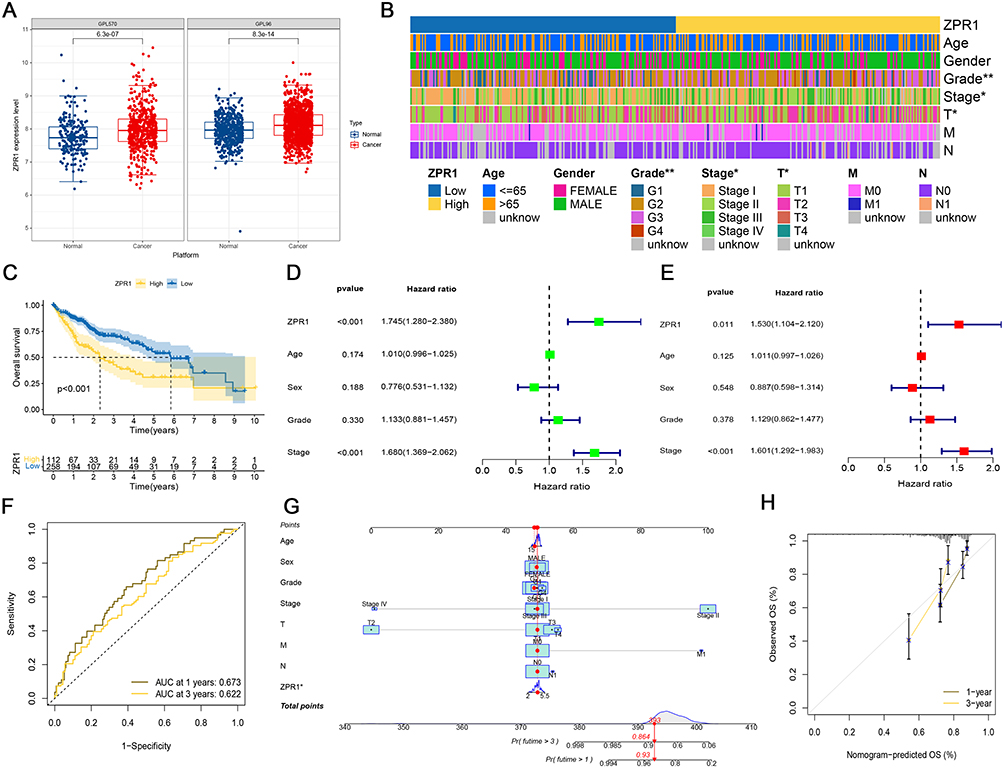 |
Figure 4 ZPR1 could be considered as an independent predictor for HCC patient survival. (A) The difference of ZPR1 expression in HCC retrieved from the GENT2 database. (B) The heatmap showing the clinical correlation analysis of ZPR1 expression in HCC by the Chi-square test. (C) The overall survival analysis of ZPR1 in TCGA HCC samples. Univariate Cox analysis (D) and multivariate Cox analysis (E) of ZPR1 expression and clinicopathological characteristics. (F) The ROC curves of 1-year and 3-year OS of ZPR1. (G) Nomogram of ZPR1 expression and clinicopathological features. (H) The calibration curves of the nomogram for 1-year and 3-year OS. |
ZPR1 Could Be Considered as an Independent Predictor for HCC Patients
We next adopted Cox regression analyses to assess the potential prognostic variables impacting the prognosis of HCC patients. Univariate Cox regression analysis showed that the TNM stage (HR = 1.680) and ZPR1 expression (HR = 1.745) could be candidate predictors of OS for HCC patients’ survival (Figure 4D). Furtherly, multivariate Cox regression analysis indicated that high expression of ZPR1 could be an independent predictor of adverse prognosis in HCC patients (HR = 1.530, Figure 4E). The ROC curve analysis of 1-year (AUC = 0.673) and 3-year (AUC = 0.622) showed the high accuracy of ZPR1 prognostic efficiency (Figure 4F). Furthermore, we establish a nomogram based on ZPR1 expression and multiple clinicopathological characteristics to predict 1-year and 3-year OS incidence of HCC patients, with a higher total score indicating worse survival (Figure 4G). The calibration curves demonstrated that the nomogram-predicted OS outcomes based on the ZPR1 expression were in high agreement with the observed probabilities (Figure 4H).
Potential Target Prediction of ZPR1 in HCC
The co-expression circos plot presented the 11 candidate genes associated with ZPR1 expression (Figure 5A). The top 6 positively correlated genes are DDX10, BUD13, ZW10, DPAGT1, HMBS, and DCUN1D5, and the top 5 negatively correlated genes are LCAT, ANG, MT-RNR1, RNASE4, and PGLYRP2. Among them, the correlation of ZPR1 with DDX10 (R = 0.742) and BUD13 (R = 0.729) was over 0.7. Accumulating studies have demonstrated that ZPR1, containing two zinc-finger domains, may act as a potential transcription factor to regulate downstream target gene transcription.10,14,36 The prediction information of CHEA, ENCODE, and JASPAR databases indicated that the target gene of ZPR1 might be CREB1 (R = 0.44, Figure 5B and C). Additionally, the CHEA and ENCODE databases also suggest that other genes (CTCF, KDM5A, KDM5B, MYC, HNF4A, FLI1) were the candidate target genes of ZPR1.
 |
Figure 5 The functional prediction of the ZPR1 gene in HCC. (A) Co-expression analysis of ZPR1. (B) Target gene prediction through CHEA, ENCODE, and JASPAR databases. (C) Pearson correlation analysis between ZPR1 and predicted target gene. (D) Differential expression genes in high- and low-ZPR1 expression groups. (E and F) GO and KEGG analyses showing biological processes and molecular functions involved in ZPR1-related DEGs. (G) GSEA analysis showing cancer- or metabolism-related pathways enriched in high-ZPR1 groups. |
Functional Enrichment Analysis of ZPR1 in HCC
The top 50 DEGs associated with ZPR1 were then identified (Figure 5D). Among them, the significantly elevated expression level of SEZ6L, IL11, CDH17, and CD177 was observed in the high ZPR1 expression group. The GO and KEGG analysis revealed that ZPR1-associated DEGs were localized in microtubules, spindle, and nuclear chromatin regions and implicated in various biological processes associated with cell cycle and DNA replication segregation, nuclear division, and tubulin binding (Figure 5E and F). Interestingly, these ZPR1-related DEGs were significantly enriched in transcriptional co-regulatory activity molecular function and nucleocytoplasmic transport pathway. GSEA analysis proposed that ZPR1 high-expression group was involved in neurological disorders (like Alzheimer’s disease and Huntington’s disease), lipid metabolism (including glycerophospholipid metabolism, sphingolipid metabolism, and glycerolipid metabolism), DNA damage repair pathways37 (including homologous recombination, nucleotide excision repair, base excision repair, and mismatch repair), and several tumor development-related pathways (ERBB, MAPK, MTOR, NOTCH, and WNT signaling) (Figure 5G).
Immune-Related Analysis of ZPR1 in HCC
We next investigated the correlation between ZPR1 and TME. As illustrated in Figure 6A, high expression of ZPR1 was negatively associated with the TME estimation and immune scores, indicating that ZPR1 high expression group had low tumor purity. The CIBERSORT method suggested that ZPR1 expression was positively correlated with the degree of M0 macrophage infiltration (p = 0.008, Figure 6B). The infiltration fraction of immune cells quantified by CIBERSORT, CIBERSORT-ABS, MCPCOUNTER, and QUANTISEQ algorithms showed that ZPR1 expression was closely related to macrophage infiltration (Figure 6C). Additionally, we screened 15 ICGs significantly associated with ZPR1, including effective immunotherapy targets CD47, CD274 (PD-L1), and CD276 (B7-H3) (Figure 6D). Then, we evaluated the immune-related functions in TCGA-HCC samples using ssGSEA method. As shown in Figure 6E, the immune infiltration scores of CD8 T cell, B cell, neutrophils, T helper cell, NK cell, and tumor infiltrating lymphocytes (TILs) were markedly decreased in the group with high ZPR1 expression. The high ZPR1 expression group had enhanced activity in MHC class I and attenuated activity in several immune functions, including type II IFN response, T cell co-stimulation, T cell co-suppression, inflammation promotion, and cytolytic activity (Figure 6F).
 |
Figure 6 Immune landscape analysis of the ZPR1 gene. (A) TME score comparison in low- and high-ZPR1 groups. (B) The immune cell infiltration correlation analysis of the ZPR1 gene using the CIRBSORT algorithm. (C) The immune cell infiltration correlation analysis of the ZPR1 gene by multiple methods. (D) Correlation analysis between ZPR1 gene and immune checkpoint genes. (E and F) The correlation between the ZPR1 gene and immune cell infiltration scores or immune-related functions. *p < 0.05; **p < 0.01; ***p < 0.001. |
Single-Cell Analysis of ZPR1 in HCC
In the next step, we applied TISCH database to looked into the relationship between ZPR1 and TME-associated cells in HCC. In GSE125449 dataset, ZPR1 was mainly expressed in malignant cells, stromal cells (endothelial, fibroblasts), and immune cells (B, CD8Tex, Mono/Macro, and Plasma). In contrast, ZPR1 expression was lower in the hepatic progenitor (Figure 7A and B). Notably, the ZPR1 expression was significantly up-regulated in the PD-L1/CTLA4 treatment group (Figure 7C). In GSE140228 dataset, ZPR1 was expressed in various immune cells (CD4 Tconv, CD8 T, Mono/Macro, and NK) (Figure 7D–F). In GSE146409 dataset, ZPR1 was highly expressed in endothelial, fibroblasts, Mono/Macro, and malignant cells (Figure 7G–I).
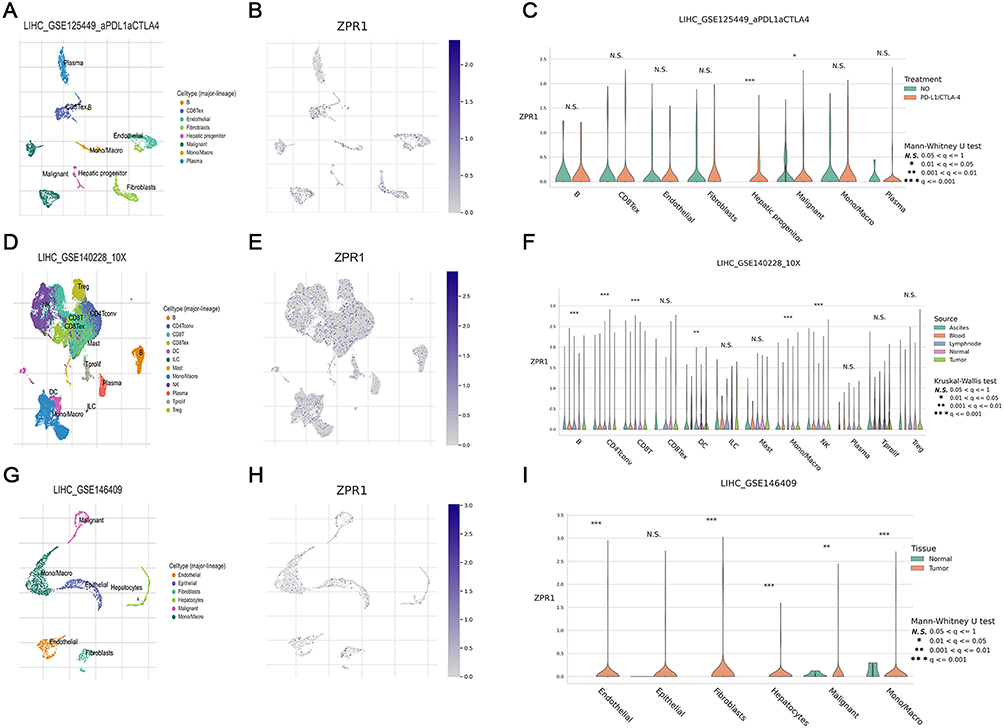 |
Figure 7 ZPR1 expression in TME-associated cells. Annotation of all cell types, ZPR1 expression percentages and differential expression in GSE125449 (A-C), GSE140228 (D-F), and GSE145409 (G-I) datasets. *p < 0.05; **p < 0.01; and ***p < 0.001. Abbreviation: Ns, no significance. |
Validation of ZPR1 Up-Regulation in HCC with IHC
Subsequently, the IHC assay of HCC TMAs was applied to perform experimental validation. Compared to the weak scattered expression in the normal liver hepatocytes, ZPR1 staining showed a strong diffusely positive distribution in the HCC tissues (Figure 8A). In addition, we observed that ZPR1 was aggregated in the nucleus of some HCC cells. Using quantitative IHC analysis, ZPR1 expression was remarkably elevated in HCC tissues compared to adjacent normal hepatocytes (p < 0.001, Figure 8B). Surprisingly, we found that ZPR1 expression was negatively associated with CD4 (R= −0.28) and CD56 (R= −0.25), and positively correlated with CD68 (R= 0.26) and CD274 (R=0.24) (Figure 8C). Furthermore, the ZPR1 expression was considerably increased in PD-L1 TPS-positive (TPS>1%, p=0.0047) and CPS-positive (CPS>1%, p=0.032) groups (Figure 8D). The AUC value of ZPR1 for tumor diagnosis was 0.785, indicating that ZPR1 is robust in pathologically identifying tumors (Figure 8E). As demonstrated in Figure 8F, high expression of ZPR1 positively correlated with advanced T stage, pathological stage, and tumor grade in HCC.
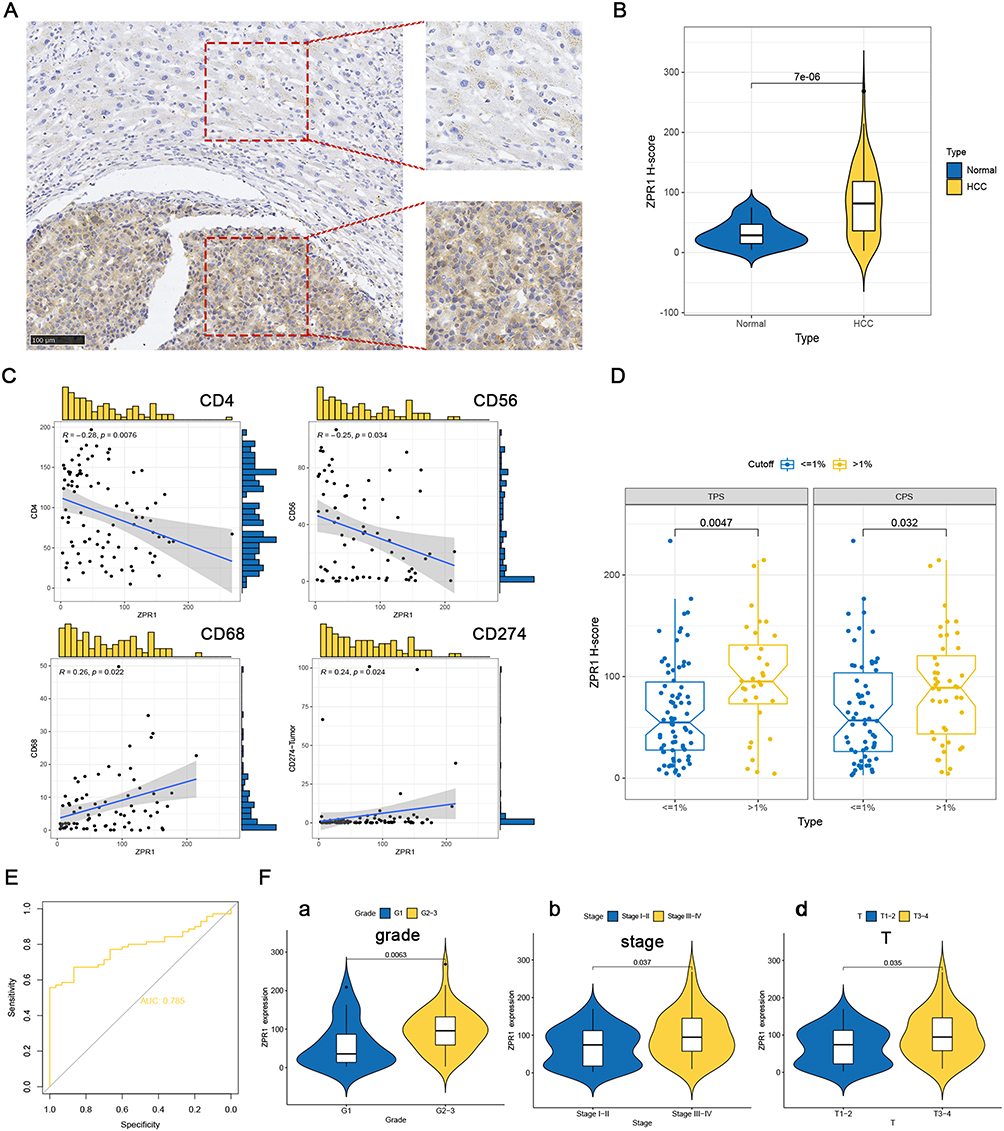 |
Figure 8 ZPR1 immunostaining in HCC tissue samples. ZPR1 immunostaining showing low expression in the cytoplasm of normal hepatocytes, and prominent positive expression in the cytoplasm of HCC cells. (A) The ZPR1 expression between HCC cells and adjacent normal hepatocytes in the same visual field (200 ×). (B) The H-score difference of ZPR1 expression in HCC tissues. (C and D) Correlation between ZPR1 expression and common immune cell markers, as well as PD-L1. (E) The AUC value for tumor diagnosis of ZPR1. (F) Correlation analysis of ZPR1 expression with clinicopathological characteristics. |
Treatment Response Prediction of ZPR1 in HCC
Finally, we applied TIDE algorithm to evaluate the ZPR1 response to ICB immunotherapy. As shown in Figure 9A, no difference in TIDE scores was observed between ZPR1 low and high expression groups. Furtherly, we found that the T cell exclusion score was markedly up-regulated in the ZPR1 high expression group, while the T cell dysfunction score was the opposite. Among the predictors, the immunosuppressive cells MDSC (myeloid-derived suppressor cells) and TAM-M2 (M2 subtype of tumor-associated macrophages) prediction scores were significantly elevated in ZPR1 high expression group. The predicted scores of IFNG and CD8 were negatively related to ZPR1. Furthermore, we investigated the impact of ZPR1 expression on response to chemotherapy and targeted therapy (Figure 9B). The comparative drug susceptibility analysis suggested that the IC50 values of camptothecin (DNA topoisomerase I inhibitor) and elesclomol (cuproptosis inducer) were significantly increased in the ZPR1 high expression group, suggesting that ZPR1 high expression is relatively resistant to elesclomol and camptothecin. In contrast, the IC50 values of paclitaxel (microtubule-associated inhibitor), doxorubicin (DNA topoisomerase inhibitor), rapamycin (mTOR inhibitor), gemcitabine (DNA synthesis inhibitor), sunitinib (multitargeted receptor tyrosine kinase inhibitor), and sorafenib (Raf inhibitor, VEGFR inhibitor, and ferroptosis activator) were decreased in the ZPR1 high expression group.
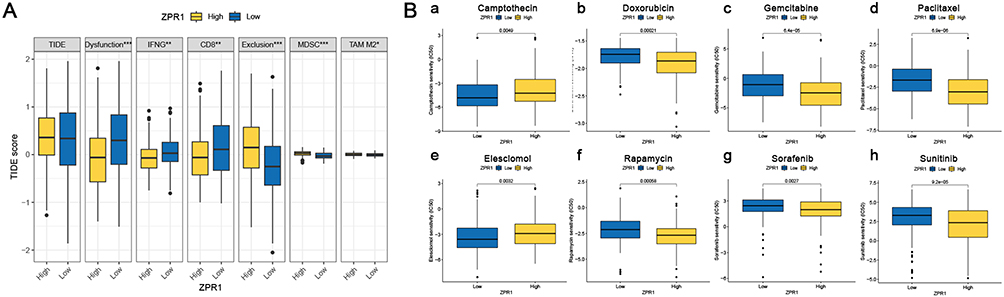 |
Figure 9 Treatment response prediction of ZPR1. (A) TIDE score prediction (B) The IC50 difference of common chemotherapeutic or targeted drugs in low- and high-ZPR1 expression groups. *p < 0.05; **p < 0.01; ***p < 0.001. |
Discussion
ZPR1 has been previously proposed to play an essential function in SMA, hyperlipidemia, type 2 diabetes, and NAFLD. However, there is no systematic bioinformatics method to evaluate the role of ZPR1 in cancer through pan-cancer profiling and quantitative IHC analysis. This study aims to systematically evaluate the ZPR1 expression in different cancer tissue types and reveal the ZPR1 biological function in malignant progression and its potential as a novel independent prognostic predictor for HCC.
Firstly, we demonstrated that ZPR1 was upregulated in most cancer tissues. ZPR1 mRNA and protein expression were highly expressed in CRC, KIRC, LC, HNSC, GBM, PAAD, and HCC tissues. In addition, the hypo-methylation status of ZPR1 may be a potential cause of high expression of ZPR1 in tumors such as BRCA, HCC, and LC. Liu et al demonstrated that ZPR1 was over-expressed in BRCA and promoted breast cancer invasion and migration through ERK signaling.25 Shan et al found that ZPR1 was lowly expressed in the LC cytoplasm and affected LC proliferation and invasion through the FAK-AKT axis.26 Previous tumor studies of ZPR1 have been involved in LC and breast cancer, and our pan-cancer research provides directions for future research on ZPR1 in other malignancies.
In the HPA database and IHC experiment, we observed that ZPR1 was localized to vesicles and present in both the nucleus and cytoplasm of cancer cells. Liu et al found that ZPR1 was mainly strongly positively expressed in the cytoplasm and observed scattered in the nucleus.25 Previous studies also reported that ZPR1 diffusely localized in cytoplasm and nucleus, and cycle-dependently co-localizes with SMN1 in the gems and Cajal bodies of the nucleus.14 After mitogen treatment induced quiescent cells in the proliferating state, ZPR1 was translocated from the cytoplasm to the nucleus.38 Interestingly, emerging studies suggest that ZPR1 may be a putative transcription factor. Previously reported that ZPR1 deficiency caused defects in transcription and S-phase progression.14 In plant cells, ZPR1 was identified as a novel clock-associated nuclear DNA-binding regulator involved in the transcriptional regulation of the circadian rhythm regulatory gene BBX24.36 The latest research demonstrated that over-expression of ZPR1 could promote SMN2 gene transcription in SMA patient cells.10 Here, we proposed that CREB1 may be a potential target gene of ZPR1. CREB1 has been demonstrated to be linked to hepatocarcinogenesis.39,40 Chittilla et al have demonstrated the down-regulation of ZPR1 expression in high-fat diet, and hypothesized that ZPR1 might lead to cognitive decline by reducing PPAR-γ-CREB-BDNF expressions through transcriptional binding.41 These findings provide theoretical clues for our future cell biology experiments of ZPR1.
Furthermore, our research identified that BUD13 was significantly co-expressed with ZPR1. ZNF259-BUD13 is a gene cluster localized at 11q23.3. Increasing epidemiological studies demonstrated that the ZNF259-BUD13 gene cluster polymorphisms were strongly associated with plasma triglyceride levels in many regions, including China, Korea, India, Iran, European, Mexico, and the United States.19,20,42,43 The ZNF259-BUD13 gene cluster is also related to liver metabolic processes.44 The clinical pan-cancer correlation analysis indicated that ZPR1 was strongly correlated with gender, pathological stage, TMB, MSI, and stemness index of HCC. TMB and MSI were predictive indicators to assess tumor response to immunotherapy, therefore we explored the relevance of ZPR1 to immunotherapy in HCC. The stemness index was strongly correlated with tumor proliferation, metastasis, and drug resistance. Kannan et al found that ZPR1 was closely associated with R-loop accumulation and DNA damage.10 Our GSEA analysis also suggests that ZPR1 is closely associated with neurodegenerative diseases, DNA damage repair, lipid metabolism, and tumorigenesis-related pathways. DNA damage repair was reported as correlated with neuronal death45 and tumor response to radiotherapy, chemotherapy, and immunotherapy.46 Lipid metabolism is closely related to tumor development, even TME and immunotherapy.47
TME is crucial for carcinogenesis, immune evasion, and immunotherapy resistance. The TME results demonstrated that ZPR1 was negatively correlated with the immune and estimated scores in HCC. Furthermore, a significant positive correlation of ZPR1 with immune infiltration of macrophages was observed. Single-cell analysis revealed that ZPR1 was closely associated with the immune infiltration of macrophages, T cells, and NK cells. The ZPR1 high expression group had lower CD8+ T cell and NK cell infiltration, as well as attenuated cytolytic activity and type II IFN response, showing the microenvironment characteristics of the cold tumor in HCC. In addition, we found that ZPR1 was positively correlated with CD47 (macrophage-associated ICG) and PD-L1 (T cell-associated ICG), and MHC1 immune function enhancement. The well-known “don’t eat me” signal MHC I-LILRB148 and CD47-SIRPα49 axes play essential roles in inhibiting macrophage phagocytosis from clearing tumor cells and exerting immune escape function. The PD1-PD-L1 axis could also act as a phagocytic checkpoint involved in the inhibition of phagocytosis and tumor immunity.50 These results suggest that the tumor cells with high ZPR1 expression attenuate the infiltration of immune cells, and potentially exert immune escape function by inhibiting macrophage phagocytosis through CD47, PD-L1 signaling. By Qupath quantitative analysis, we found that ZPR1 was highly expressed in HCC samples and closely correlated with the expression of CD4 (helper T cell phenotypic marker), CD56 (NK cell phenotypic marker), CD68 (macrophage phenotypic marker), and PD-L1. ZPR1 was closely correlated with TPS and CPS positive of PD-L1. The TIDE prediction results suggest that ZPR1 is associated with tumor immune escape and can be considered a regulator of ICB resistance. The results of ZPR1 response to immunotherapy, chemotherapy and targeted therapy can provide a novel theoretical foundation for the precise treatment and combination therapy in HCC.
Although pan-cancer and specific tumor bioinformatics analysis provides critical insights into our systematic understanding of the ZPR1 role in malignancy and TME, our research also has some limitations. For example, treatment strategy and response information for HCC patients are not available. The specific molecular mechanism of ZPR1 affecting immune infiltration needs to be elucidated by forthcoming in vitro (including flow cytometry analysis and cell biology experiments) and in vivo experiments. Nevertheless, our study showed that ZPR1 was up-regulated in HCC and closely associated with immune cell infiltration. ZPR1 may be a promising biomarker to predict patient prognosis and efficacy of anticancer therapy. These findings provide a theoretical basis for precise and individualized anticancer treatment strategies.
Conclusion
The pan-cancer profiling suggests that ZPR1 was differentially expressed in various cancers and is closely related to methylation status, clinicopathologic characteristics, TMB, MSI, and stemness index. Digital pathology analysis indicates that ZPR1 was remarkably upregulated in HCC and is closely associated with immune infiltration, which may be a potential biomarker for treatment response and therapeutic target for HCC.
Abbreviations
HCC, hepatocellular carcinoma; IHC, immunohistochemistry; ZPR1, ZPR1 zinc finger; EGFR, epidermal growth factor receptor; eEF1A, eukaryotic translation elongation factor 1A; SMA, spinal muscular atrophy; NAFLD, non-alcoholic fatty liver disease; TCGA, The Cancer Genome Atlas; GTEx, Genotype-Tissue Expression; KEGG, Kyoto Encyclopedia of Genes and Genomes; GO, Gene Ontology; GSEA, Gene set enrichment analysis; DEG, differentially expressed gene; TME, tumor microenvironment; ICB, immune checkpoint blockade; TMA, tissue microarrays; CPS, Combined positive score; TPS, tumor cell proportion score; BLCA, Bladder Urothelial Carcinoma; BRCA, Breast invasive carcinoma; CRC, colorectal cancer; KIRC, Kidney renal clear cell carcinoma; GBM, Glioblastoma multiforme; HNSC, Head and Neck squamous cell carcinoma; LC, lung cancer; PAAD, Pancreatic adenocarcinoma; PRAD, Prostate adenocarcinoma; STAD, Stomach adenocarcinoma; SARC, Sarcoma; TGCT, Testicular Germ Cell Tumors; UVM, Uveal Melanoma; TMB, tumor mutation burden; MSI, microsatellite instability; K-M, Kaplan-Meier; PFS, progression-free survival; OS, overall survival.
Data Sharing Statement
The datasets used and/or analyzed in this study are available from the corresponding authors on reasonable request.
Ethics Approval and Informed Consent
The studies involving human participants were reviewed and approved by the ethics committee of Liaoning Cancer Hospital (Ethics Approval No. 20201001). Written informed consent was obtained from the patients. The study was completed in accordance with the Declaration of Helsinki.
Acknowledgments
We thank the original data provided by the UCSC Xena, Human Protein Atlas, SMART, GTEx, TCGA, GENT2, UALCAN, Kaplan-Meier plotter, and TISCH2 databases.
Funding
This study was supported by the Fundamental Research Funds for the Central Universities (No. LD202215 and Z2217) and the Liaoning Cancer Hospital Talent Introduction Project Fund (No. Z1705).
Disclosure
The authors report no conflicts of interest in this work.
References
1. Sung H, Ferlay J, Siegel RL, et al. Global Cancer Statistics 2020: GLOBOCAN Estimates of Incidence and Mortality Worldwide for 36 Cancers in 185 Countries. CA Cancer J Clin. 2021;71(3):209–249.
2. Siegel RL, Miller KD, Fuchs HE, Jemal A. Cancer Statistics, 2021. CA Cancer J Clin. 2021;71(1):7–33.
3. Galcheva-Gargova Z, Konstantinov KN, Wu IH, Klier FG, Barrett T, Davis RJ. Binding of zinc finger protein ZPR1 to the epidermal growth factor receptor. Science. 1996;272(5269):1797–1802.
4. Gangwani L, Mikrut M, Galcheva-Gargova Z, Davis RJ. Interaction of ZPR1 with translation elongation factor-1alpha in proliferating cells. J Cell Biol. 1998;143(6):1471–1484.
5. Mishra AK, Gangwani L, Davis RJ, Lambright DG. Structural insights into the interaction of the evolutionarily conserved ZPR1 domain tandem with eukaryotic EF1A, receptors, and SMN complexes. Proc Natl Acad Sci U S A. 2007;104(35):13930–13935.
6. Sabbarini IM, Reif D, McQuown AJ, et al. Zinc-finger protein Zpr1 is a bespoke chaperone essential for eEF1A biogenesis. Mol Cell. 2023;83(2):252–265.e213.
7. Gangwani L, Mikrut M, Theroux S, Sharma M, Davis RJ. Spinal muscular atrophy disrupts the interaction of ZPR1 with the SMN protein. Nat Cell Biol. 2001;3(4):376–383.
8. Ahmad S, Wang Y, Shaik GM, Burghes AH, Gangwani L. The zinc finger protein ZPR1 is a potential modifier of spinal muscular atrophy. Hum Mol Genet. 2012;21(12):2745–2758.
9. Ahmad S, Bhatia K, Kannan A, Gangwani L. Molecular Mechanisms of Neurodegeneration in Spinal Muscular Atrophy. J Exp Neurosci. 2016;10:39–49.
10. Kannan A, Jiang X, He L, Ahmad S, Gangwani L. ZPR1 prevents R-loop accumulation, upregulates SMN2 expression and rescues spinal muscular atrophy. Brain. 2020;143(1):69–93.
11. Helmken C, Hofmann Y, Schoenen F, et al. Evidence for a modifying pathway in SMA discordant families: reduced SMN level decreases the amount of its interacting partners and Htra2-beta1. Hum Genet. 2003;114(1):11–21.
12. Doran B, Gherbesi N, Hendricks G, Flavell RA, Davis RJ, Gangwani L. Deficiency of the zinc finger protein ZPR1 causes neurodegeneration. Proc Natl Acad Sci U S A. 2006;103(19):7471–7475.
13. Gangwani L, Flavell RA, Davis RJ. ZPR1 is essential for survival and is required for localization of the survival motor neurons (SMN) protein to Cajal bodies. Mol Cell Biol. 2005;25(7):2744–2756.
14. Gangwani L. Deficiency of the zinc finger protein ZPR1 causes defects in transcription and cell cycle progression. J Biol Chem. 2006;281(52):40330–40340.
15. Jiang X, Kannan A, Gangwani L. ZPR1-Dependent Neurodegeneration Is Mediated by the JNK Signaling Pathway. J Exp Neurosci. 2019;13:1179069519867915.
16. Guan F, Niu Y, Zhang T, et al. Two-stage association study to identify the genetic susceptibility of a novel common variant of rs2075290 in ZPR1 to type 2 diabetes. Sci Rep. 2016;6:29586.
17. Esteve-Luque V, Padró-Miquel A, Fanlo-Maresma M, et al. Implication between Genetic Variants from APOA5 and ZPR1 and NAFLD Severity in Patients with Hypertriglyceridemia. Nutrients. 2021;13(2):552.
18. Mirhafez SR, Avan A, Pasdar A, et al. Zinc Finger 259 Gene Polymorphism rs964184 is Associated with Serum Triglyceride Levels and Metabolic Syndrome. Int J Mol Cell Med. 2016;5(1):8–18.
19. Fu Q, Tang X, Chen J, et al. Effects of Polymorphisms in APOA4-APOA5-ZNF259-BUD13 Gene Cluster on Plasma Levels of Triglycerides and Risk of Coronary Heart Disease in a Chinese Han Population. PLoS One. 2015;10(9):e0138652.
20. Gombojav B, Lee SJ, Kho M, Song YM, Lee K, Sung J. Multiple susceptibility loci at chromosome 11q23.3 are associated with plasma triglyceride in East Asians. J Lipid Res. 2016;57(2):318–324.
21. Paquette M, Fantino M, Bernard S, Baass A. The ZPR1 genotype predicts myocardial infarction in patients with familial hypercholesterolemia. J Clin Lipidol. 2020;14(5):660–666.
22. Esteve-Luque V, Fanlo-Maresma M, Padró-Miquel A, et al. Polygenic Risk of Hypertriglyceridemia Is Modified by BMI. Int J Mol Sci. 2022;23(17):9837.
23. Fanlo-Maresma M, Esteve-Luque V, Pintó X, Padró-Miquel A, Corbella E, Candás-Estébanez B. Study of common hypertriglyceridaemia genetic variants and subclinical atherosclerosis in a group of women with SLE and a control group. Lupus Sci Med. 2022;9(1):e000774.
24. Ito YA, Smith AC, Kernohan KD, et al. A ZPR1 mutation is associated with a novel syndrome of growth restriction, distinct craniofacial features, alopecia, and hypoplastic kidneys. Clin Genet. 2018;94(3–4):303–312.
25. Liu B, Xing X, Li X, Guo Q, Xu T, Xu K. ZNF259 promotes breast cancer cells invasion and migration via ERK/GSK3β/snail signaling. Cancer Manag Res. 2018;10:3159–3168.
26. Shan Y, Cao W, Wang T, Jiang G, Zhang Y, Yang X. ZNF259 inhibits non-small cell lung cancer cells proliferation and invasion by FAK-AKT signaling. Cancer Manag Res. 2017;9:879–889.
27. Malta TM, Sokolov A, Gentles AJ, et al. Machine Learning Identifies Stemness Features Associated with Oncogenic Dedifferentiation. Cell. 2018;173(2):338–354.e315.
28. Thorsson V, Gibbs DL, Brown SD, et al. The Immune Landscape of Cancer. Immunity. 2018;48(4):812–830.e814.
29. Bonneville R, Krook MA, Kautto EA, et al. Landscape of Microsatellite Instability Across 39 Cancer Types. JCO Precis Oncol. 2017;2017.
30. Hu FF, Liu CJ, Liu LL, Zhang Q, Guo AY. Expression profile of immune checkpoint genes and their roles in predicting immunotherapy response. Brief Bioinform. 2021;22(3):56.
31. Jiang P, Gu S, Pan D, et al. Signatures of T cell dysfunction and exclusion predict cancer immunotherapy response. Nat Med. 2018;24(10):1550–1558.
32. Zhao Y, Song K, Zhang Y, et al. TMEM17 promotes malignant progression of breast cancer via AKT/GSK3β signaling. Cancer Manag Res. 2018;10:2419–2428.
33. Bankhead P, Loughrey MB, Fernández JA, et al. QuPath: open source software for digital pathology image analysis. Sci Rep. 2017;7(1):16878.
34. Bankhead P, Fernández JA, McArt DG, et al. Integrated tumor identification and automated scoring minimizes pathologist involvement and provides new insights to key biomarkers in breast cancer. Lab Invest. 2018;98(1):15–26.
35. Shi L, Zhang SJ, Chen J, et al. A comparability study of immunohistochemical assays for PD-L1 expression in hepatocellular carcinoma. Mod Pathol. 2019;32(11):1646–1656.
36. Kiełbowicz-Matuk A, Czarnecka J, Banachowicz E, Rey P, Rorat T. Solanum tuberosum ZPR1 encodes a light-regulated nuclear DNA-binding protein adjusting the circadian expression of StBBX24 to light cycle. Plant Cell Environ. 2017;40(3):424–440.
37. Jeppesen DK, Bohr VA, Stevnsner T. DNA repair deficiency in neurodegeneration. Prog Neurobiol. 2011;94(2):166–200.
38. Galcheva-Gargova Z, Gangwani L, Konstantinov KN, et al. The cytoplasmic zinc finger protein ZPR1 accumulates in the nucleolus of proliferating cells. Mol Biol Cell. 1998;9(10):2963–2971.
39. Wang J, Ma L, Weng W, et al. Mutual interaction between YAP and CREB promotes tumorigenesis in liver cancer. Hepatology. 2013;58(3):1011–1020.
40. Li Y, Fu Y, Hu X, et al. The HBx-CTTN interaction promotes cell proliferation and migration of hepatocellular carcinoma via CREB1. Cell Death Dis. 2019;10(6):405.
41. Chittilla M, Akimbekov NS, Razzaque MS. High-fat diet-associated cognitive decline: is zinc finger protein 1 (ZPR1) the molecular connection? Curr Res Physiol. 2021;4:223–228.
42. Read RW, Schlauch KA, Lombardi VC, et al. Genome-Wide Identification of Rare and Common Variants Driving Triglyceride Levels in a Nevada Population. Front Genet. 2021;12:639418.
43. Pranavchand R, Reddy BM. Quantitative trait loci at the 11q23.3 chromosomal region related to dyslipidemia in the population of Andhra Pradesh, India. Lipids Health Dis. 2017;16(1):116.
44. Hess AL, Carayol J, Blædel T, et al. Analysis of circulating angiopoietin-like protein 3 and genetic variants in lipid metabolism and liver health: the DiOGenes study. Genes Nutr. 2018;13:7.
45. Cuartas J, Gangwani L. R-loop Mediated DNA Damage and Impaired DNA Repair in Spinal Muscular Atrophy. Front Cell Neurosci. 2022;16:826608.
46. Goldstein M, Kastan MB. The DNA damage response: implications for tumor responses to radiation and chemotherapy. Annu Rev Med. 2015;66:129–143.
47. Zhu L, Zhu X, Wu Y. Effects of Glucose Metabolism, Lipid Metabolism, and Glutamine Metabolism on Tumor Microenvironment and Clinical Implications. Biomolecules. 2022;12(4):79.
48. Barkal AA, Weiskopf K, Kao KS, et al. Engagement of MHC class I by the inhibitory receptor LILRB1 suppresses macrophages and is a target of cancer immunotherapy. Nat Immunol. 2018;19(1):76–84.
49. Matlung HL, Szilagyi K, Barclay NA, van den Berg TK. The CD47-SIRPα signaling axis as an innate immune checkpoint in cancer. Immunol Rev. 2017;276(1):145–164.
50. Gordon SR, Maute RL, Dulken BW, et al. PD-1 expression by tumour-associated macrophages inhibits phagocytosis and tumour immunity. Nature. 2017;545(7655):495–499.
 © 2023 The Author(s). This work is published and licensed by Dove Medical Press Limited. The
full terms of this license are available at https://www.dovepress.com/terms
and incorporate the Creative Commons Attribution
- Non Commercial (unported, 3.0) License.
By accessing the work you hereby accept the Terms. Non-commercial uses of the work are permitted
without any further permission from Dove Medical Press Limited, provided the work is properly
attributed. For permission for commercial use of this work, please see paragraphs 4.2 and 5 of our Terms.
© 2023 The Author(s). This work is published and licensed by Dove Medical Press Limited. The
full terms of this license are available at https://www.dovepress.com/terms
and incorporate the Creative Commons Attribution
- Non Commercial (unported, 3.0) License.
By accessing the work you hereby accept the Terms. Non-commercial uses of the work are permitted
without any further permission from Dove Medical Press Limited, provided the work is properly
attributed. For permission for commercial use of this work, please see paragraphs 4.2 and 5 of our Terms.
Recommended articles
Decaprenyl Diphosphate Synthase Subunit 1 (PDSS1): A Potential Prognostic Biomarker and Immunotherapy-Target for Hepatocellular Carcinoma
Yang Y, Li J, Tang M, Nie B, Huang W
Cancer Management and Research 2022, 14:1627-1639
Published Date: 3 May 2022
Identification of KRBA1 as a Potential Prognostic Biomarker Associated with Immune Infiltration and m6A Modification in Hepatocellular Carcinoma
Liu Y, Fu B, Yu Z, Song G, Zeng H, Gong Y, Ding Y, Huang D
Journal of Hepatocellular Carcinoma 2022, 9:497-516
Published Date: 31 May 2022
Low MARCO Expression is Associated with Poor Survival in Patients with Hepatocellular Carcinoma Following Liver Transplantation
Zhang Q, Wei Y, Li Y, Jiao X
Cancer Management and Research 2022, 14:1935-1944
Published Date: 11 June 2022
Histological Severity of Cirrhosis Influences Surgical Outcomes of Hepatocellular Carcinoma After Curative Hepatectomy
Liang BY, Gu J, Xiong M, Zhang EL, Zhang ZY, Lau WY, Wang SF, Guan Y, Chen XP, Huang ZY
Journal of Hepatocellular Carcinoma 2022, 9:633-647
Published Date: 23 July 2022
Nomogram for the Preoperative Prediction of the Macrotrabecular-Massive Subtype of Hepatocellular Carcinoma
Shan Y, Yu X, Yang Y, Sun J, Wu S, Mao S, Lu C
Journal of Hepatocellular Carcinoma 2022, 9:717-728
Published Date: 10 August 2022