")
Back to Journals » Journal of Inflammation Research » Volume 16
Pan-Cancer Analysis Reveals CENPI as a Potential Biomarker and Therapeutic Target in Adrenocortical Carcinoma
Authors Wu F, Li G, Shen H, Huang J, Liu Z, Zhu Y, Zhong Q, Ou R, Zhang Q, Liu S
Received 20 March 2023
Accepted for publication 6 July 2023
Published 12 July 2023 Volume 2023:16 Pages 2907—2928
DOI https://doi.org/10.2147/JIR.S408358
Checked for plagiarism Yes
Review by Single anonymous peer review
Peer reviewer comments 3
Editor who approved publication: Dr Adam D Bachstetter
Feima Wu, Guangchao Li, Huijuan Shen, Jing Huang, Zhi Liu, Yangmin Zhu, Qi Zhong, Ruiming Ou, Qing Zhang, Shuang Liu
Department of Hematology, Guangdong Second Provincial General Hospital, Guangzhou, Guangdong, People’s Republic of China
Correspondence: Shuang Liu, Department of Hematology, Guangdong Second Provincial General Hospital, XinGangZhong Road 466#, Haizhu Distict, Guangzhou, Guangdong Province, 510317, People’s Republic of China, Tel +86-20-89169214, Email [email protected]
Background: Centromere protein I (CENPI) has been shown to affect the tumorigenesis of breast and colorectal cancers. However, its biological role and prognostic value in other kinds of cancer, especially adrenocortical carcinoma (ACC), remained to be further investigated.
Methods: Various bioinformatics tools were adopted for exploring the significance of differential expression of CENPI in several malignant tumors from databases such as Depmap portal, GTEx, and TCGA. ACC was selected for further analyzed, and information such as clinicopathological features, the prognostic outcome of diverse subgroups, differentially expressed genes (DEGs), co-expression genes, as well as levels of tumor-infiltrating immune cells (TIIC), was extracted from multiple databases. To verify the possibility of CENPI as a therapeutic target in ACC, drug sensitivity assay and si-RNA mediate knockdown of CENPI were carried out.
Results: The pan-cancer analyses showed that the CENPI mRNA expression levels differed significantly among most cancer types. Additionally, a high precision in cancer prediction and close relation with cancer survival indicated that CENPI could be a potential candidate biomarker to diagnose and predict cancer prognosis. In ACC, CENPI was closely related to multiple clinical characteristics, such as pathological stage and primary therapy outcome. High CENPI levels predicted poor overall survival (OS), progression-free interval (PFI), and disease-specific survival (DSS) of ACC patients, particularly for different clinical subgroups. Moreover, the expression of CENPI showed positive relationship to Th2 cells but negatively related to most of the TIICs. Furthermore, drug sensitivity assay showed that vorinostat inhibit CENPI expression and ACC cell growth. Additionally, si-RNA mediated knockdown of CENPI inhibited ACC cell growth and invasion and showed synergistic anti-proliferation effect with AURKB inhibitor barasertib.
Conclusion: Pan-cancer analysis demonstrated that CENPI is a potential diagnostic and prognostic biomarker in various cancers as well as an anti-ACC therapeutic target.
Keywords: CENPI, pan-cancer analysis, diagnosis, prognostic biomarker, adrenocortical carcinoma
Introduction
Centromere protein I (CENPI) belongs to the constitutive centromere-associated network (CCAN), which regulates chromosomal segregation and alignment as well as guarantees a suitable mitosis process.1–4 Besides its function at centromeres and kinetochores, CENPI is also associated with autoimmune diseases, including scleroderma, celiac disease, vitiligo, and amyotrophic lateral sclerosis. Nevertheless, the underlying mechanism needs to be explained.5,6
Genetic mutations in CENPI can lead to centromere instability, as evidence-based studies show dynamic centromere break/deletion/isochromosome/translocation formation. Changes in centromere structure are associated with the occurrence of human disorders such as malignant tumors.7,8 CENPI mutations can be detected in some human cancers, such as breast cancer (BC), lymphoid neoplasms, adenocarcinomas of the colon, squamous cell carcinomas (SCC), and melanomas.9 Recently, CENPI is proposed to be the oncogenic gene within estrogen receptor-positive (ER+) BC,10 colorectal cancer (CRC), as well as gastric cancer (GC).11 While promoting chromosome instability and tumorigenesis of ER+ BC, overexpression of CENPI can cause CRC and GC cell invasion, migration, and epithelial–mesenchymal transition (EMT).12 These findings have suggested that CENPI acts through distinct mechanisms in different tumor types.
We further focus on ACC model, as CENPI shows comparable diagnostic accuracy and the highest correlation with OS, DSS, and PFI in ACC patients. ACC is a rare endocrine cancer with incompletely understood pathogenetic mechanisms, heterogeneous clinical behavior, and lack of effective treatment for advanced stages.13 The identification and targeted analysis of molecular markers that associated with a clinical outcome might help to improve patient stratification and improve treatment decisions in ACC.14–16 To analyze CENPI comprehensively and systemically, we investigated CENPI levels and its biological activity in pan-cancer, especially its significance in diagnosis and prognosis prediction. The co-expression genes, differentially expressed genes (DEGs), tumor-infiltrating immune cells (TIICs) associate with CENPI expression were also investigated. Further, drug sensitivity assay and si-RNA mediate knockdown experiments were carried out to test the possibility of CENPI as a therapeutic target. Altogether, CENPI is a prospective biomarker for diagnosis and prognosis of pan-cancer, as well as a potentially effective molecular target for ACC.
Materials and Methods
Cell Lines
ACC cell line SW-13 and NCI-H295R were purchased from American Type Culture Collection (ATCC). Cells were cultured at 37°C and 5% CO2 in humidified incubator. Culture medium for SW-13 consisted of L15 medium with 10% v/v fetal bovine serum and 10,000 units/mL penicillin/streptomycin, while medium for NCI-H295R was DMEM/F12 with 10% v/v fetal bovine serum, 0.1% v/v insulin–transferrin–selenium and 10,000 units/mL penicillin/streptomycin.
Gene Expression Profile
Clinical and RNA-seq data from 15,776 samples of 33 different cancer types, along with corresponding wild-type samples, were obtained using UCSC XENA, based on Genotype-Tissue Expression (GTEx) and The Cancer Genome Atlas (TCGA) databases. Thereafter, the CENPI expression profile within various cancer cells was collected from the Depmap portal (https://depmap.org/portal/). Statistical analyses were performed with R software (version 4.2.1), and results were visualized with the use of the ggplot2 package. TCGA and GTEx datasets were investigated using Wilcoxon’s rank sum test, and p < 0.05 stood for statistical significance (ns, p ≥0.05; *p < 0.05; **p < 0.01; ***p < 0.001).
Protein–Protein Interaction (PPI) Network Construction
In total, top 50 proteins interacting with CENPI were obtained from STRING web (https://string-db.org/) by setting the following parameters: active interaction sources: experiments, text mining, databases, co-expression, neighborhood, gene fusion, co-occurrence, minimum required interaction score =0.4, max number of interactors to show: no more than 50 interactors. The PPI network was visualized using Cytoscape (version 3.9.1). Correlations between CENPI and the top 5 predicted interacting proteins within pan-cancer were further validated using the TIMER tool.17
Gene Ontology (GO) and Kyoto Encyclopedia of Genes and Genomes (KEGG) Analysis
GO and KEGG analyses were conducted on 50 CENPI-interacting proteins, and ggplot2 and cluster profiler packages were applied individually for visual and statistical analyses of all proteins.18,19
Diagnostic Significance Analysis
CENPI’s significance in pan-cancer diagnosis was assessed on the basis of the receiver operating characteristic (ROC) curve, with the area under curve (AUC) value of 0.5–1. An AUC value closer to 1 indicates superior diagnosis performance. Typically, the AUC values of 0.5–0.7, 0.7–0.9, and >0.9 mean low, certain, and high accuracy, separately.
Prognostic Outcome Analysis
The relation of CENPI levels with cancer survival (OS, DSS, PFI), especially ACC survival among diverse clinical subgroups, was assessed using the Kaplan–Meier (KM) plot. Results were visualized with survminer package, whereas statistical analyses were carried out with survival package. Theoretically, the relationship between the patient number of OS, PFI and DSS should be OS≥PFI≥DSS. The hypothesis test adopted Cox regression, with p < 0.05 indicating statistical significance.
Relations of CENPI Levels with Diverse ACC Clinical Features
Clinical and RNA-seq data for CENPI expression in ACC cases with distinct clinical features were presented in level-3 HTSeq-fragments per kilobase per million (FPKM) format that was obtained using the TCGA database. This was later transformed into transcripts per million reads (TPM) format and converted into log2 values for analysis, thereby being presented as tables and violin plots. Data of both groups were analyzed using Wilcoxon’s rank sum test, with p <0.05 indicating statistical significance (ns, p ≥ 0.05; *p < 0.05; **p < 0.01; ***p < 0.001).
CENPI Co-Expression Genes Within ACC
The top 50 most significant co-expression genes with positive and negative dependency on CENPI levels in ACC were identified, and gene co-expression heatmaps were generated with the use of a stats package. Besides, a heatmap showing the relation of CENPI levels with the top 10 genes was plotted based on Pearson’s correlation coefficients.
DEGs of High- versus Low-CENPI Expression Groups Within ACC
DEGs in high- (50–100%) and low-CENPI (0–50%) expression groups were identified with the deseq2 package. Later, ggplot2 package was employed for creating a volcano map based on thresholds of adjusted p-value <0.05 and |log2 fold-change (FC)| >1.0. In addition to that, the GO and KEGG analyses were made on DEGs. The statistical analyses were then completed with the cluster Profiler package. Additionally, the PPI network was constructed on the basis of DEGs identified by the |log2 FC| >2.0 threshold through STRING web, whereas the MCC algorithm of CytoHubba from Cytoscape (version 3.9.1) was adopted for hub gene analysis.
Association of CENPI Levels with TIICs Levels in ACC
Associations of CENPI levels with TIIC levels were analyzed with the ssGESA package.
Drug Sensitivity Analysis of CENPI
The potential relationship between FDA-approved drugs and CENPI expression was investigated with the use of CellMiner Cross Database (CDB) (https://discover.nci.nih.gov/rsconnect/cellminercdb/), an online tool allowing analysis among main tumor cell pharmacogenomic data sources.
Molecular Docking Analysis
The molecular structures of vorinostat was obtained from PubChem Compound (https://pubchem.ncbi.nlm.nih.gov/).20 The 3D structure of CENPI (resolution, 2.5 Å) was predicted by using Protein Data Bank (PDB) (http://www.rcsb.org/pdb/home/home.do). For docking analysis, molecular files of CENPI and vorinostat were converted into PDBQT format with all water molecules excluded and polar hydrogen atoms were added. The binding affinity and mode of interaction between vorinostat and CENPI were analyzed with a silico protein–ligand docking software, AutodockVina 1.2.2 (http://autodock.scripps.edu/).21
Real-Time Reverse Transcription PCR (qRT-PCR)
qRT-PCR was carried out on the basis of SYBR Premix Ex TaqII (Takara) with PrimeScriptTM RT reagent Kit (Takara) in line with the manufacturer’s protocols. Primers used were (5’-3’): CENPI forward (F): ACACGGATATTGAAGTGCATGAT; CENPI reverse (R): TACCTTGGTGCTACCAGAACA; GAPDH (F): GGAGCGAGATCCCTCCAAAAT; GAPDH (R): GGCTGTTGTCATACTTCTCATGG.
Cell Viability Assay and Treatment Combination Analysis
Cell counting kit-8 (CCK-8) assay (Beyotime Technology, China) was adopted for determining cell viability. For siRNA mediated proliferation assay, 8000 cell/well were seeded in a 96-well plate, following 24, 48, 72, 96, and 120 h of culture, CCK-8 (20 µL) solution was supplemented to each well, followed by absorbance measurement (OD value) at 450 nm. Data from six wells were averaged to calculate the cell viability.
The combination effect of siRNA and barasertib at indicated concentration, combination index (CI), fraction affected (FA) levels were calculated by CompuSyn software using Chou–Talalay method with constant-ratio combinations. CI values <1, =1, >1 indicate synergistic, additive, or antagonistic effects, respectively.
Transwell Assay
The 2 × 10⁴ cells were seeded to the top Transwell chamber (Corning, USA) in a 24-well plate and incubated at 37 °C for 24-h. Then, cells migrating to the top chamber were eliminated, while those in the bottom chamber surface were immersed in methanol for a 15-min period, followed by 30-min staining using 0.1% crystal violet. Later, migrating cell number was counted and photographed using a microscope.
Colony Formation Experiment
After 24 hours of siRNA transfection, cells were digested and resuspended in a complete medium, seeded to the six-well plate with 3000/well, and cultured in an incubator. After 14 days, cells were fixed for 15-min using methanol, stained for 30-mins using 0.1% crystal violet, and rinsed with running water.
Statistical Analyses
Three biological replicates were carried out in every assay as technical triplicates. GraphPad Prism was adopted for data analysis, and results were represented as ±standard deviation. Student’s t-test was implemented for analyzing pairwise differences between the two groups. P < 0.05 stood for statistical significance.
Results
CENPI Levels in Normal Tissue, Cancer Cell Lines as Well as Pan-Cancer
This work examined CENPI mRNA levels in non-cancer samples in the GTEx database. The result was that CENPI showed broad expression at relatively low levels in various samples (Figure 1A). In contrast to normal tissues, all cancer cell lines in the Depmap portal dataset showed higher expression (Figure 1B). Compared with the GTEx non-cancer samples, CENPI levels were significantly increased in 28 cancer types, containing ACC, BRCA, bladder urothelial carcinoma (BLCA), endocervical adenocarcinoma (CESC), cervical squamous cell carcinoma and cholangiocarcinoma (CHOL), COAD, esophageal carcinoma (ESCA), lymphoid neoplasm diffuse large B-cell lymphoma (DLBC), kidney chromophobe (KICH), HNSC, glioblastoma multiforme (GBM), kidney renal clear cell carcinoma (KIRC), KIRP, LGG, LIHC, LUAD, LUSC, OV, PAAD, rectum adenocarcinoma (READ), prostate adenocarcinoma (PRAD), SKCM, STAD, thyroid carcinoma (THCA), testicular germ cell tumors (TGCT), Thymoma (THYM), UCS and UCEC (Figure 1C).
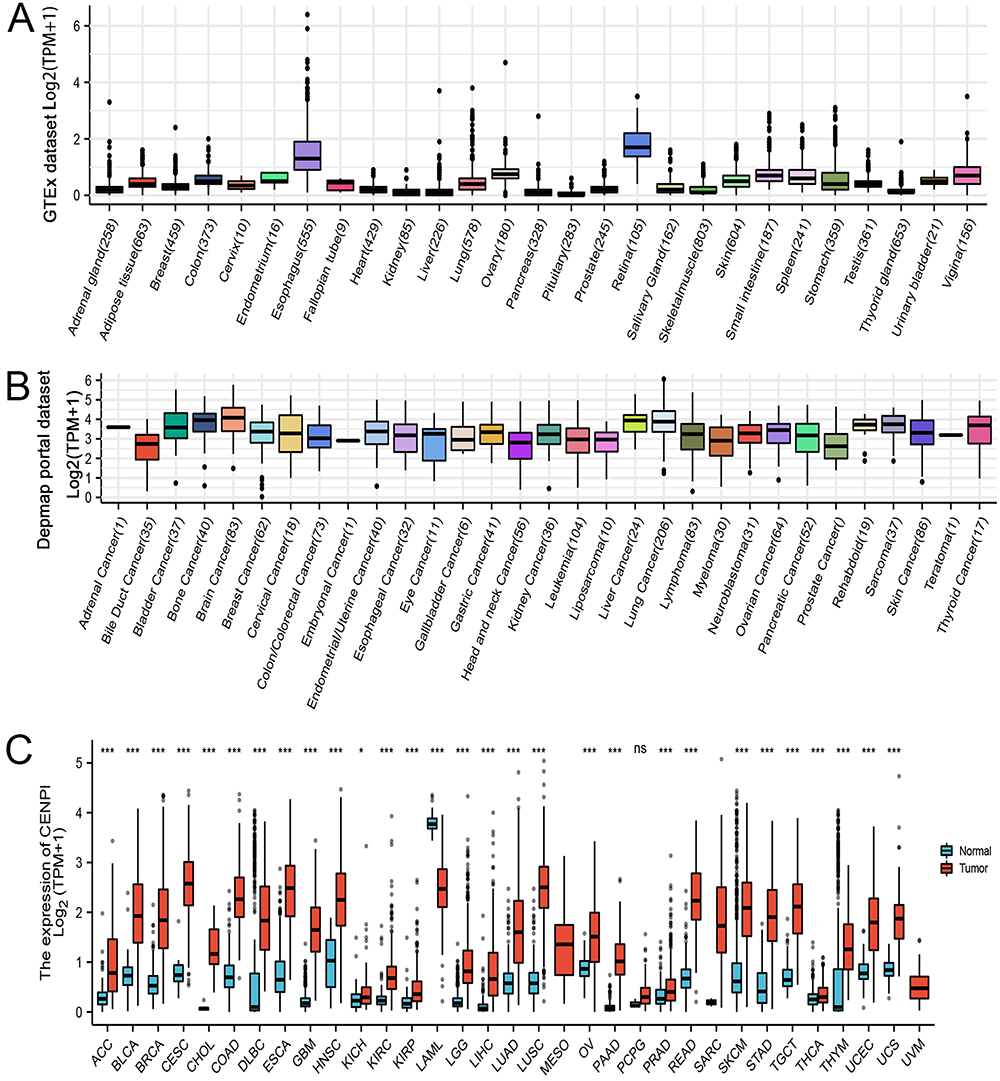 |
Figure 1 Gene expression level of CENPI in tumors and normal tissues. (A) CENPI expression in normal tissues; (B) CENPI expression in tumor cell lines; (C) CENPI expression in TCGA tumors and normal tissues. (ns, p≥0.05, *p<0.05, ***p<0.001). |
PPI Network Construction, GO, and KEGG Analyses
Via the STRING database, the top 50 CENPI interacting proteins were predicted, whereas Cytoscape was employed for network visualization (Figure 2A). CENPI was found to be positively correlated with the top 5 interacting proteins, including APITD1, BUB1, BUB1B, CASC5, and CENPA, using TIMER.2.0 database, which was further validated in pan-cancers (Figure 2B). GO annotation of the top 50 interacting proteins was then conducted (Figure 2C), and the biological process (BP) terms mainly included organelle fission, nuclear division, mitotic sister chromatid segregation, and mitotic nuclear division (Figure 2D). In addition, the terms for cellular component (CC) terms mainly included spindle, condensed chromosome, centromeric region, mitotic spindle, and spindle microtubule (Figure 2D). Molecular functions (MF) were microtubule binding, tubulin binding, chemokine activity, as well as histone kinase activity (Figure 2D). The KEGG analysis demonstrated that these interacting proteins were mostly related to the cell cycle (Figure 2E).
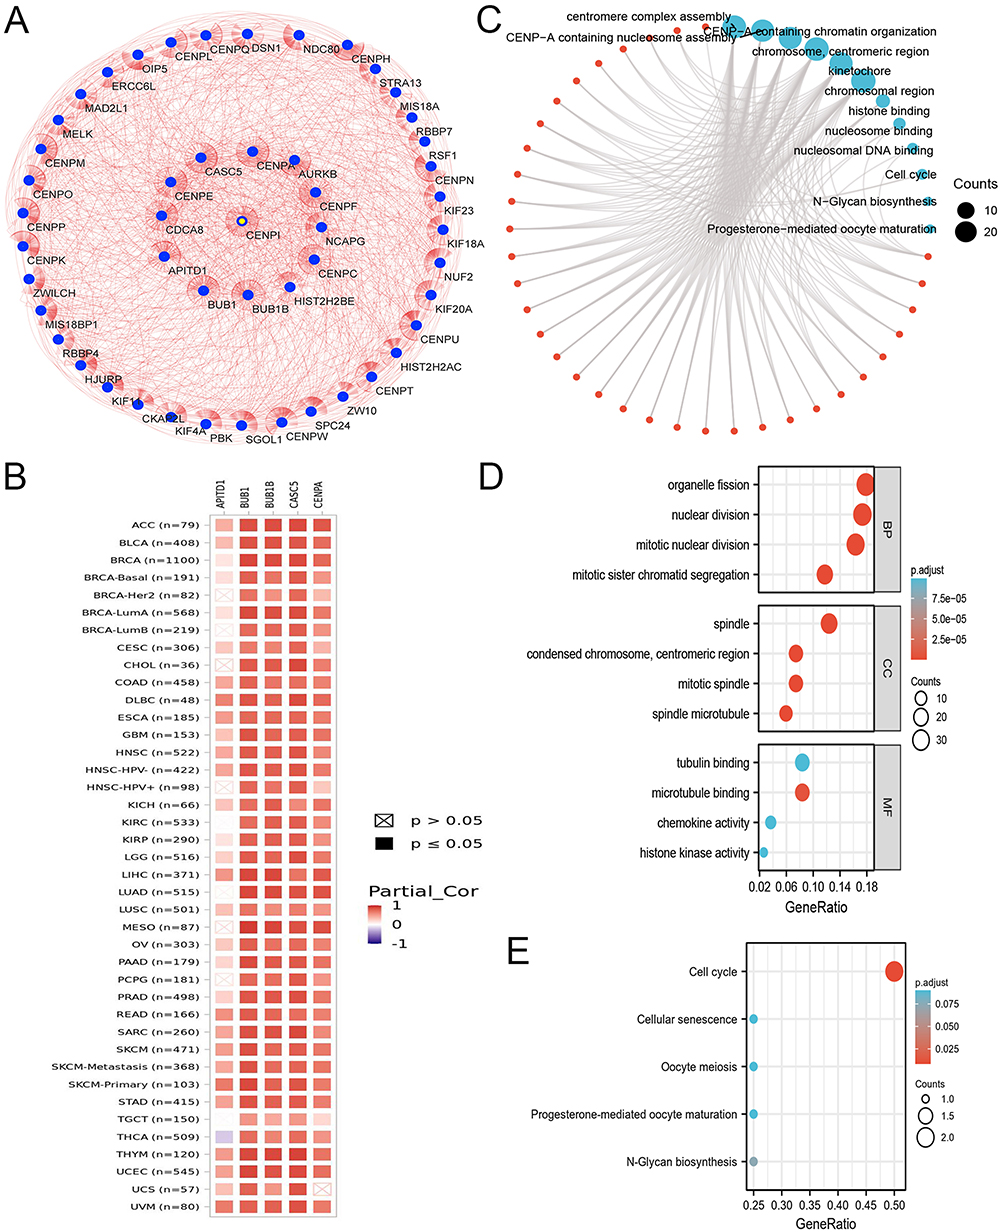 |
Figure 2 Protein–protein interaction network, GO analysis, and KEGG analysis of top 50 target interacting proteins of CENPI. (A) Protein–protein interaction network; (B) Correlation between CENPI and its top 5 predicted interacting protein across TCGA tumors; (C) Visual network of GO and KEGG analyses; (D) GO analysis; (E) KEGG analysis. |
CENPI’s Significance in Pan-Cancer Diagnosis
In order to assess CENPI’s significance in pan-cancer diagnosis, the ROC curve was plotted, and AUC, along with diagnostic parameters, was determined under the optimum threshold. The results showed that CENPI demonstrated a certain accuracy (0.7≤AUC≤0.9) to high accuracy (AUC > 0.9) in predicting 16 cancers, including ACC (AUC = 0.815), BRCA (AUC = 0.935), COAD (AUC = 0.981), HNSC (AUC = 0.937), KIRP (AUC = 0.852), LAML (AUC = 0.986), LGG (AUC = 0.954), LIHC (AUC = 0.910), LUAD (AUC = 0.942), LUSC (AUC = 0.984), OV (AUC = 0.817), PAAD (AUC = 0.975), SKCM (AUC = 0.858), STAD (AUC = 0.960), UCEC (AUC = 0.936) and UCS (AUC = 0.946) (Figure 3A–3P).
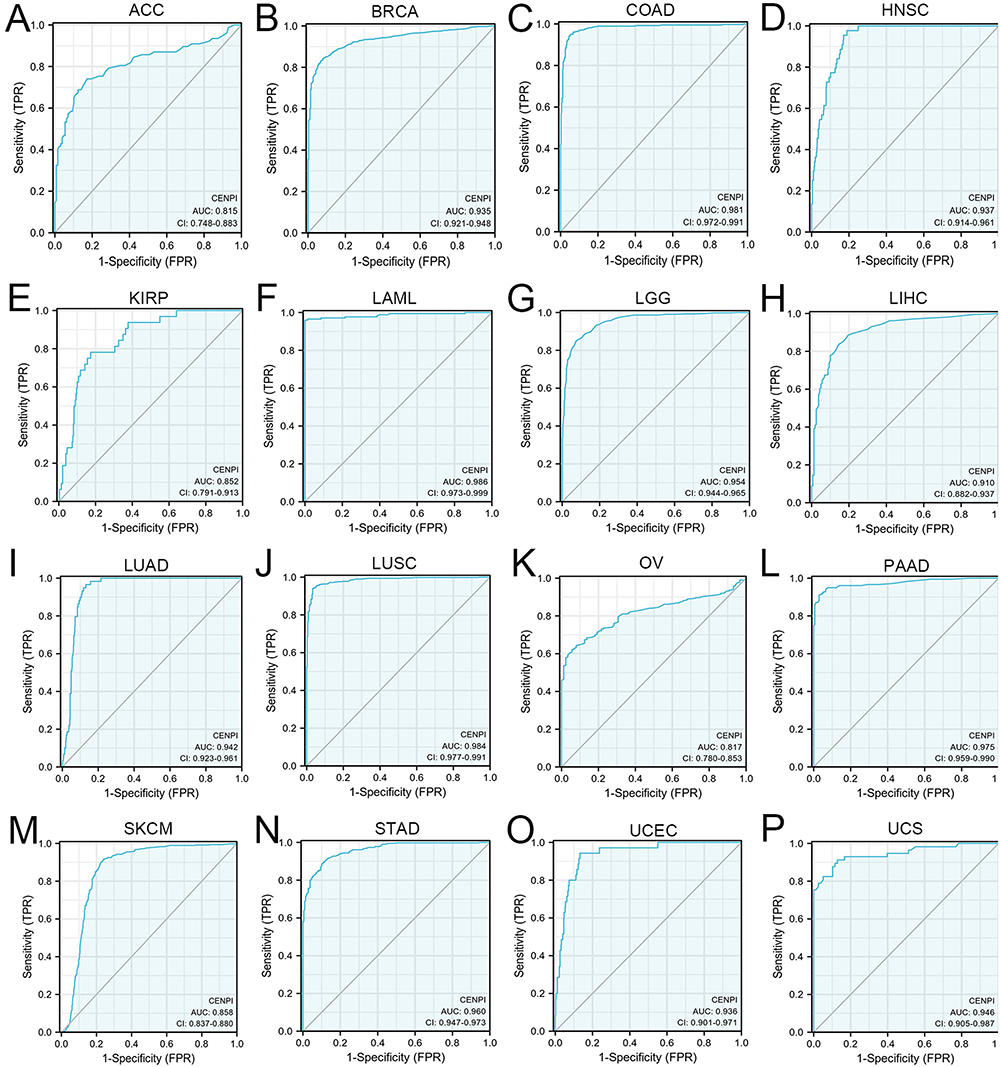 |
Figure 3 Receiver operating characteristic (ROC) curve of CENPI expression in pan-cancer. (A) ACC; (B) BRCA; (C) COAD; (D) HNSC; (E) KIRP; (F) LAML; (G) LGG; (H) LIHC; (I) LUAD; (J) LUSC; (K) OV; (L) PAAD; (M) SKCM; (N) STAD; (O) UCEC; (P) UCS. |
CENPI’s Prognostic Significance Within Pan-Cancer
The levels of CENPI were markedly related to OS, DSS, as well as PFI in ACC, MESO, PAAD, SARC, and UCEC. In ACC, the Cox regression analysis indicated CENPI up-regulation predicted dismal survival, such as OS [hazard ratio (HR) = 4.72, 95% confidence interval (CI): 1.99–11.18, p < 0.001], DSS (HR = 5.12, 95% CI: 2.04–12.83, p = 0.001), and PFI (HR = 3.52, 95% CI: 1.80–6.91, p < 0.001) (Figure 4A–C). In MESO, as seen in the Cox regression analysis, CENPI up-regulation was a predictive factor in the dismal prognostic outcome, such as OS [HR = 3.51, 95% CI: 3.10–5.82, p < 0.001], DSS (HR = 4.08, 95% CI: 2.13–7.82, p < 0.001), and PFI (HR = 2.22, 95% CI: 1.29–3.82, p = 0.004) (Figure 4D–F). In PAAD, Cox regression indicated that CENPI up-regulation predicted poor prognostic outcomes, such as OS [HR = 1.77, 95% CI: 1.16–2.70, p = 0.008], DSS (HR = 1.88, 95% CI: 1.16–3.04, p = 0.01), and PFI (HR = 1.59, 95% CI: 1.07–3.25, p = 0.021) (Figure 4G–I). In SARC, as observed by Cox regression, CENPI up-regulation was related to poor prognostic outcomes, like OS [HR = 2.28, 95% CI: 1.5–3.45, p < 0.001], DSS (HR = 2.33, 95% CI: 1.47–3.68, p < 0.001), and PFI (HR = 1.70, 95% CI: 1.21–2.37, p = 0.002) (Figure 4J–L). In UCEC, based on Cox regression, CENPI up-regulation was seen to predict poor prognostic outcomes, like OS [HR = 1.87, 95% CI: 1.23–2.85, p = 0.003], DSS (HR = 1.83, 95% CI: 1.10–3.04, p = 0.02), and PFI (HR = 1.61, 95% CI: 1.13–2.29, p = 0.008) (Figure 4M–O).
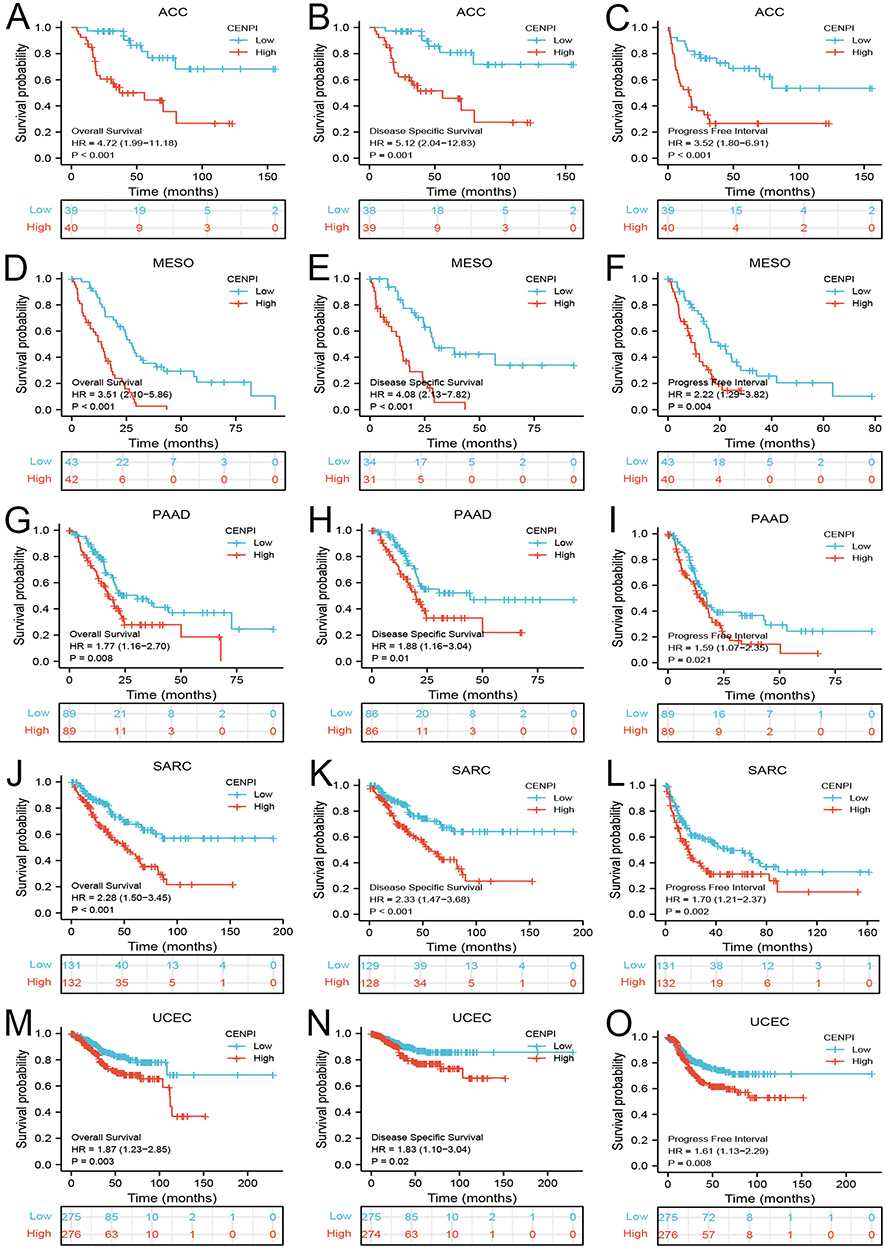 |
Figure 4 Correlation between CENPI expression and the prognosis outcomes (OS, DSS, and PFI) of different cancers. (A–C) ACC; (D–F) MESO; (G–I) PAAD; (J–L) SARC; (M–O) UCEC. |
Different Clinicopathological Features of ACC Were Dependent on CENPI Expression
As shown, the OS, DSS, and PFI in ACC, MESO, PAAD, SARC, and UCEC were highly dependent on CENPI levels. Based on the diagnosis and prognostic significance of CENPI in pan-cancer, ACC was selected for further analysis, and relevant clinical data of TCGA-ACC patients was downloaded to analyze the relation of CENPI with clinical staging data. The analysis showed that CENPI levels were strongly related to the tumor (T) stage (p = 0.031), metastasis (M) stage (p = 0.005), pathologic stage (p = 0.008), tumor status (p < 0.001), new event (p = 0.006), residual (R) tumor (p = 0.002), and primary therapy outcome (p < 0.001) (Table 1).
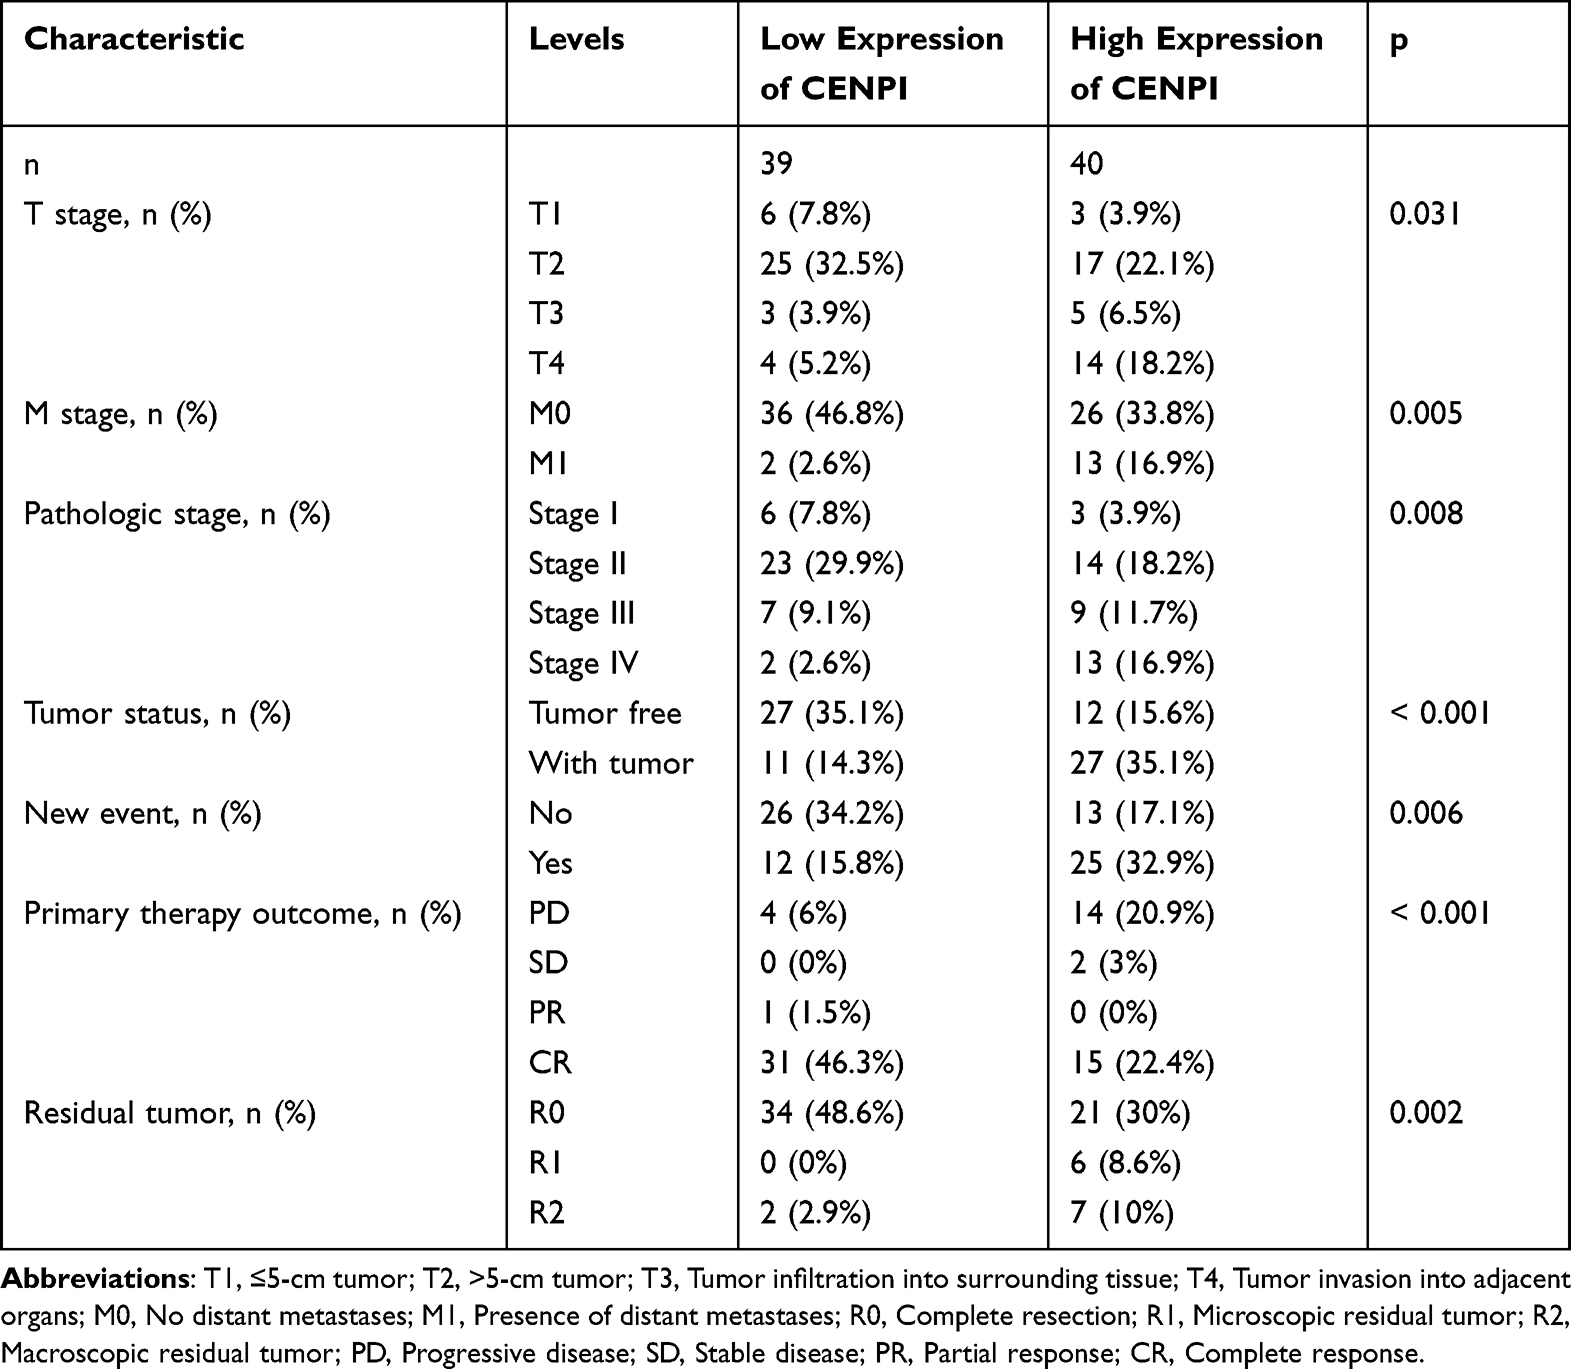 |
Table 1 Correlation Analysis Between Different Expressions of CENPI and Clinical Information of ACC Patients |
Moreover, the expression of CENPI and its association with prognostic outcomes (OS, DSS, and PFI) of different ACC subgroups were surveyed. While the primary therapy outcome (CR) subgroup (Figure 5B) had a lower expression, the pathologic stage (stage IV) (Figure 5A), N stage (N1) (Figure 5C), M stage (M1) (Figure 5D), residual tumor (R1&R2) (Figure 5E), a new event (Yes) (Figure 5F), Weiss–atypical mitotic figures (present) (Figure 5G), Weiss-necrosis (present) (Figure 5H) and Weiss-invasion of tumor capsule (present) (Figure 5I) subgroups had a higher CENPI expression. Additionally, CENPI up-regulation predicted poor OS, DSS, and PFI of M stage (M0) (Figure 6A–C), N stage (N0) (Figure 6D–F), mitotane therapy (yes) (Figure 6G–I), residual tumor (R0) (Figure 7A–C), tumor status (with tumor) (Figure 7D–F) and new event (yes) (Figure 7G–I) subgroups.
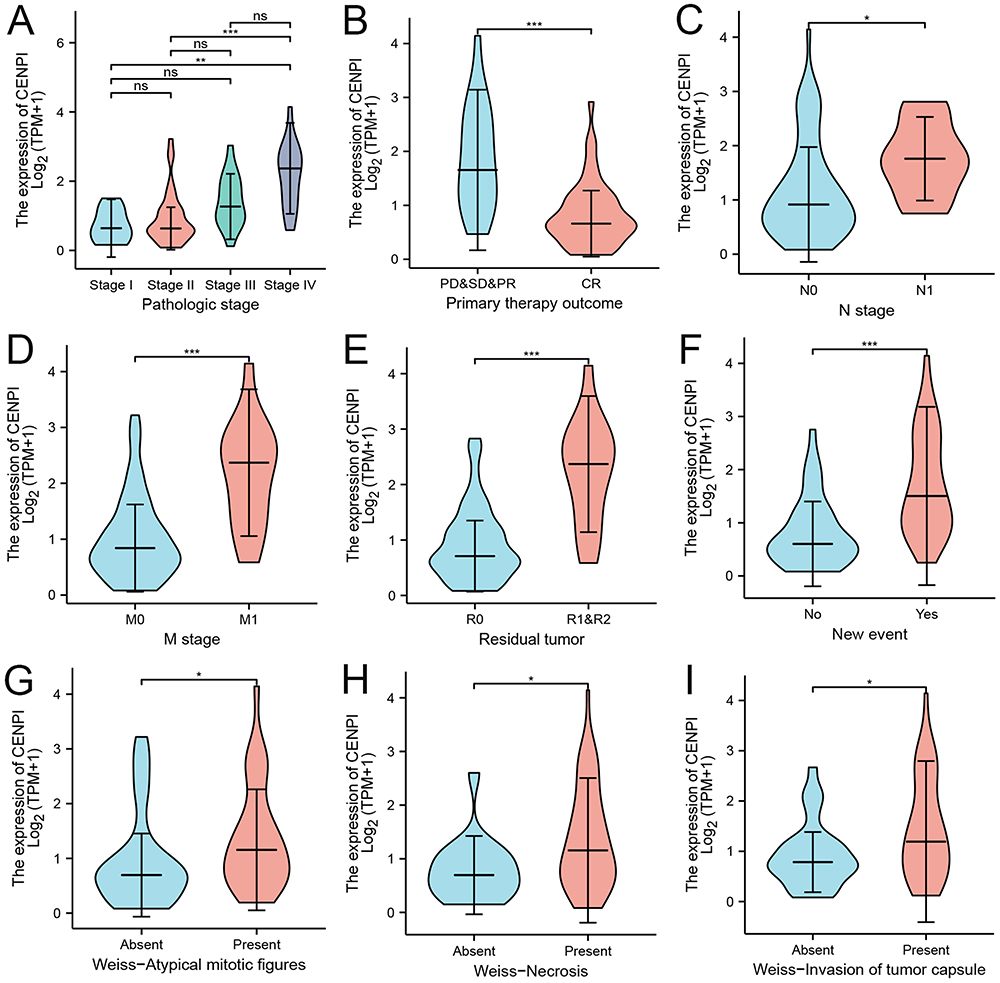 |
Figure 5 Correlation between CENPI expression and different clinical characteristics of ACC. (A) Pathologic stage; (B) Primary therapy outcome; (C) N stage; (D) M stage; (E) Residual tumor; (F) New event; (G) Weiss-Atypical mitotic figures; (H) Weiss-Necrosis; (I) Weiss-Invasion of tumor capsule. Data were shown as mean ±SD. (ns, p≥0.05, *p < 0.05, **p < 0.01, ***p < 0.001). |
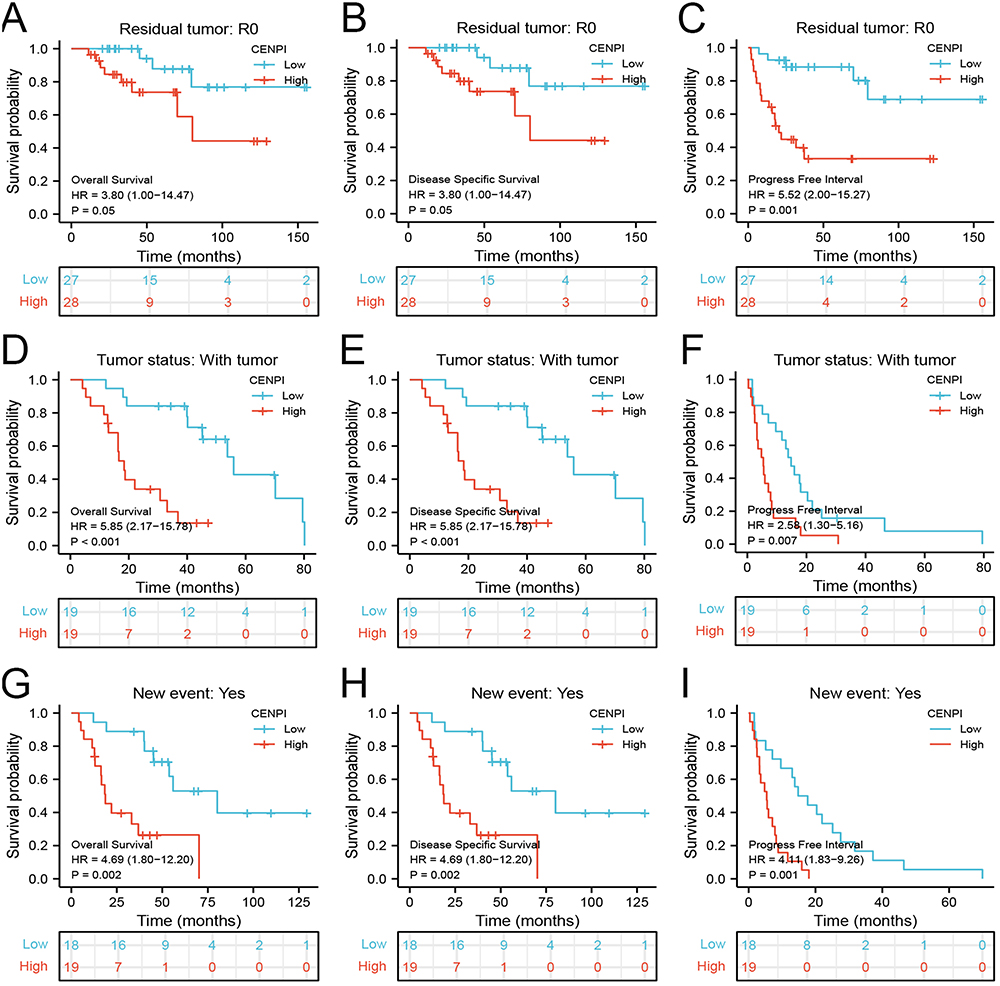 |
Figure 6 Association between CENPI expression and OS, DSS, and PFI in different clinical subgroups of ACC. (A–C) M stage (M0); (D–F) N stage (N0); (G–I) Mitotane therapy (Yes). |
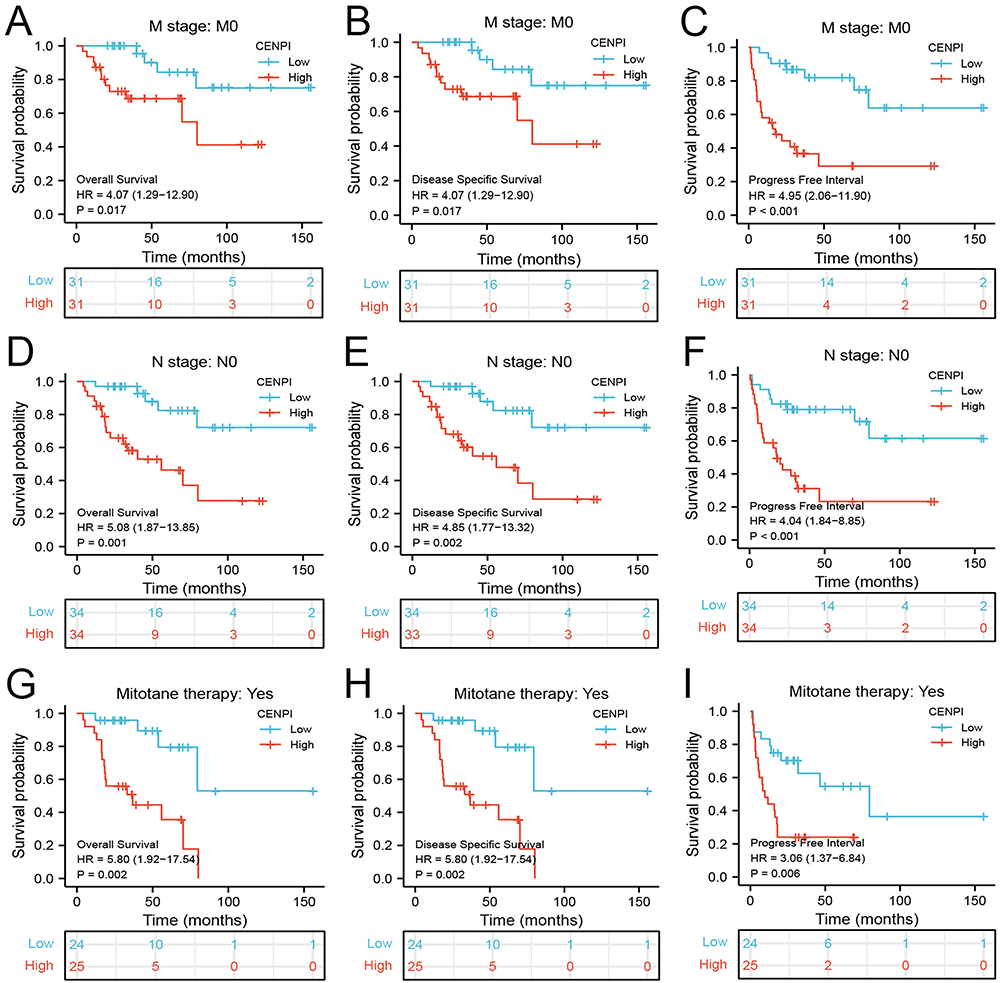 |
Figure 7 Association between CENPI expression and OS, DSS, and PFI in different clinical subgroups of ACC. (A–C) Residual tumor (R0); (D–F) Tumor status: with tumor; (G–I) New event (Yes). |
CENPI’s Co-Expression Genes Within ACC
The association of the top 50 co-expression genes with CENPI levels in ACC was investigated, and it was displayed in a heatmap. Based on the positive association heatmap (Figure 8A), the top 10 co-expression genes were further validated, namely, KIF14 (r = 0.931), CENPF (r = 0.920), EXO1 (r = 0.924), CKAP2L (r = 0.915), ANLN (r = 0.932), DIAPH3 (r = 0.913), KIF23 (r = 0.916), KIF4A (r = 0.941), MCM10 (r = 0.909), and BUB1B (r = 0.918) (Figure 8B–K). The top 10 associated genes based on the negative association heatmap (Figure 9A), were MT-CO1 (r = –0.656), MT-ND3 (r = –0.585), MT-ATP6 (r = –0.64), MT-CO3 (r = –0.574), MT-ND4 (r = –0.596), MT-CYB (r = –0.512), MTRNR2L8 (r = –0.524), MT-CO2 (r = –0.538), MT-ATP8 (r = –0.591), and MT-ND5 (r = –0.544) (Figure 9B–K).
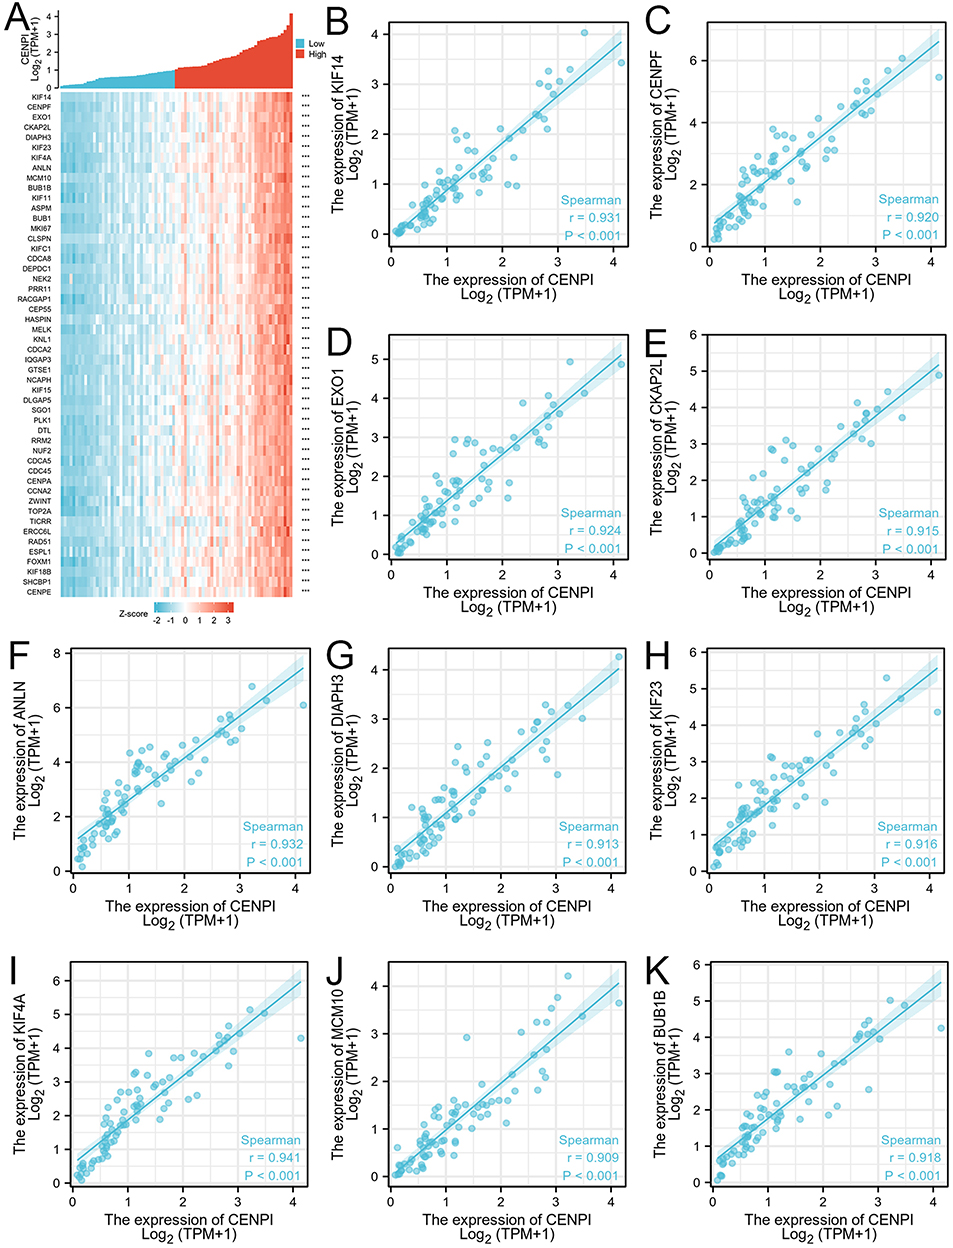 |
Figure 8 Top 50 genes positively correlated with CENPI expression in ACC. (A) Gene co-expression heatmap of top 50 genes positively correlated with CENPI in ACC: (B–K) Heatmap showing correlation analysis of top 10 genes and CENPI. (***p < 0.001). |
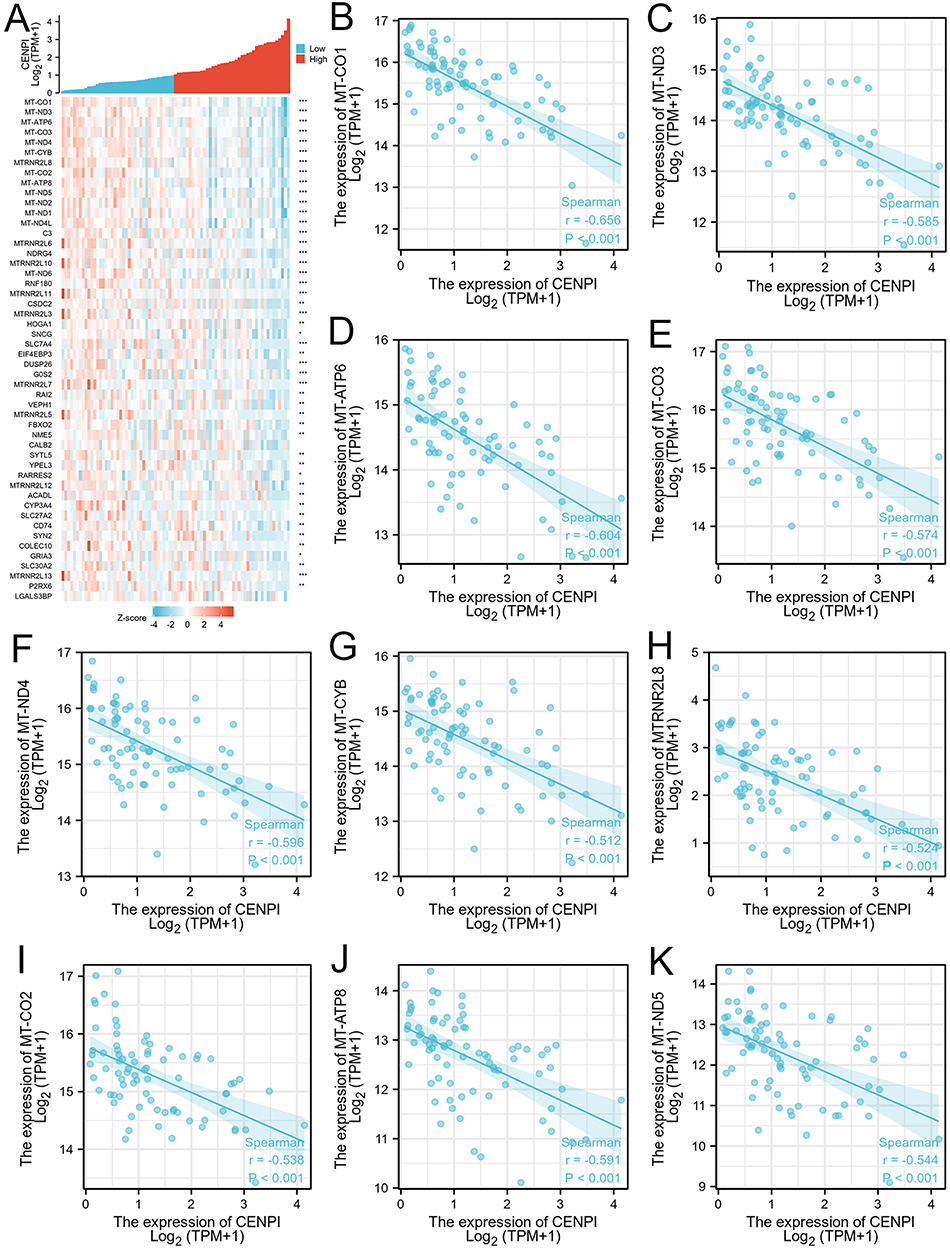 |
Figure 9 Top 50 genes negatively correlated with CENPI expression in ACC. (A) Gene co-expression heatmap of top 50 genes negatively correlated with CENPI in ACC. (B–K) Heatmap showing correlation analysis of top 10 genes and CENPI. (*p < 0.05,**p < 0.01, ***p < 0.001). |
DEGs in High- and Low-CENPI Expression Groups Within ACC
By adjusting p-value <0.05 and |log2 FC| >1.0 thresholds, 1084 DEGS were acquired. These included 647 with up-regulation and 437 with down-regulation (Figure 10A). Based on GO and KEGG analysis (Figure 10B and C), BP terms contained organelle fission, nuclear division, and chromosome segregation. CC terms mainly included chromosomal region, condensed chromosome, and centromeric region. MF terms were primarily engaged in extracellular matrix structural constituents, cytokine activity, and DNA helicase activity. KEGG pathways were mostly associated with the cell cycle, protein digestion and absorption, and chemical carcinogenesis.
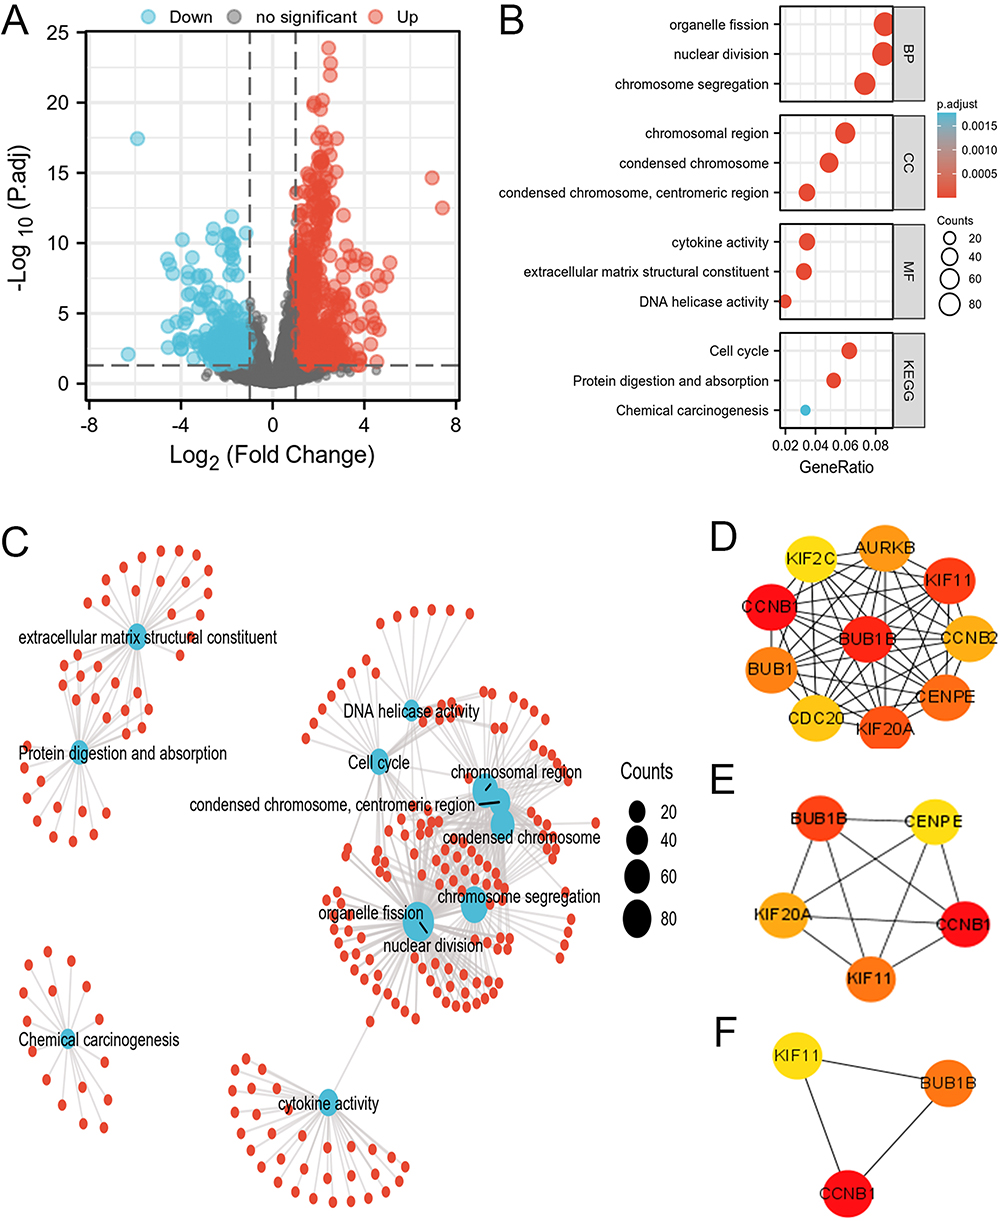 |
Figure 10 Protein–protein interaction (PPI) network building and GO and KEGG analyses of DEGs between CENPI high expression and low expression groups in ACC. (A) Volcano map of DEGs (red: upregulation; blue: downregulation); (B and C) GO and KEGG analyses of DEGs; (D–F) Hub genes of PPI network and MCODE2 components identified in the gene lists. |
Furthermore, PPI networks of DEGs and top 10 hub proteins were generated (Figure 10D). Among them, the top five hub proteins were BUB1B, CENPE, CCNB1, KIF11, and KIF20A (Figure 10E), and the top 3 hub proteins were BUB1B, CCNB1, and KIF11 (Figure 10F).
Association of CENPI Level with Immune Cell Infiltration Within ACC
Additionally, to investigate how CENPI affected TIIC levels within ACC, 23 subpopulations of tumor-infiltrated leukocytes (TILs) were evaluated (Figure 11A). While CENPI levels indicated a positive relationship to Th2 cells (r = 0.750) (Figure 11B), they showed a negative association with most TIICs, including cytotoxic cells (r =−0.507), mast cells (r =−0.413), CD8T cells (r =−0.389), B cells (r =−0.378), plasmacytoid dendritic cells (r =−0.324), T cells (−0.323), macrophages (r =−0.298), Th17 cells (r =−0.291), Th1 cells (r =−0.283), as well as T cell follicular helper (r =−0.280) (Figure 11C–L).
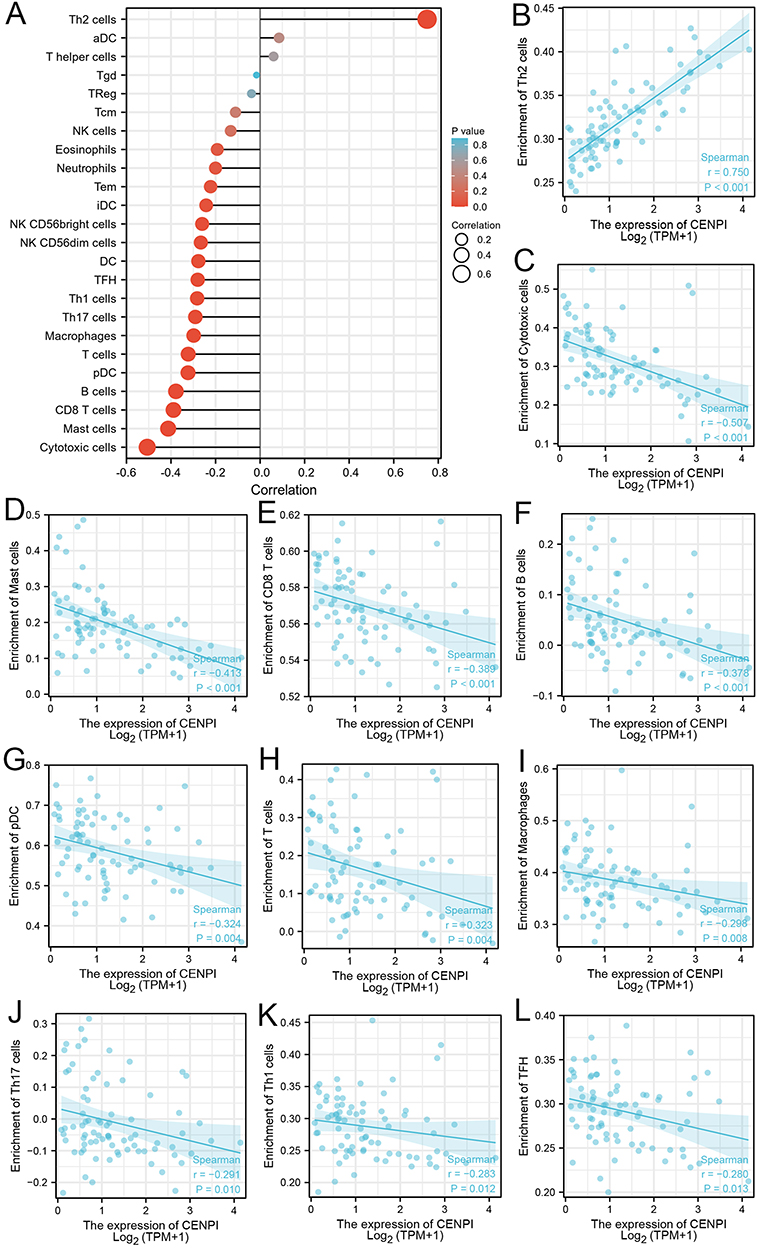 |
Figure 11 Association between CENPI expression and the immune cell infiltration in ACC. (A) Spearman correlation analysis of the CENPI expression and 24 tumor infiltration immune cells. Correlation analysis between CENPI expression and (B) Th2 cells, (C) cytotoxic cells, (D) mast cells, (E) CD8 T cells, (F) B cells, (G) plasmacytoid dendritic cells, (H) T cells, (I) macrophages, (J) Th17 cells, (K) Th1 cells, (L) and TFH cells. |
Drug Sensitivity Analysis of CENPI in Cancer Cell Lines
Several FDA-approved drugs that negatively correlated with CENPI levels within diverse cancer cells were screened by CellMiner Cross Database. The results showed that top 6 hits included Vorinostat (r =−0.47, p = 0.00015), Palbociclib (r =−0.35, p = 0.0061), Nilotinib (r =−0.34, p = 0.0076), Panobinostat (r =−0.32, p = 0.015), Imatinib (r =−0.3, p = 0.023) and Dromostanolone (r =−0.29, p = 0.026) (Figure 12A–F). Next, the most profound hit vorinostat was selected for further analysis. Molecular docking analysis show that vorinostat directly bind to CENPI at a low binding energy and formed hydrogen bonds (Figure 12G). Moreover, vorinostat also inhibited CENPI expression (Figure 12H) and cell proliferation of ACC cell lines (Figure 12I and J).
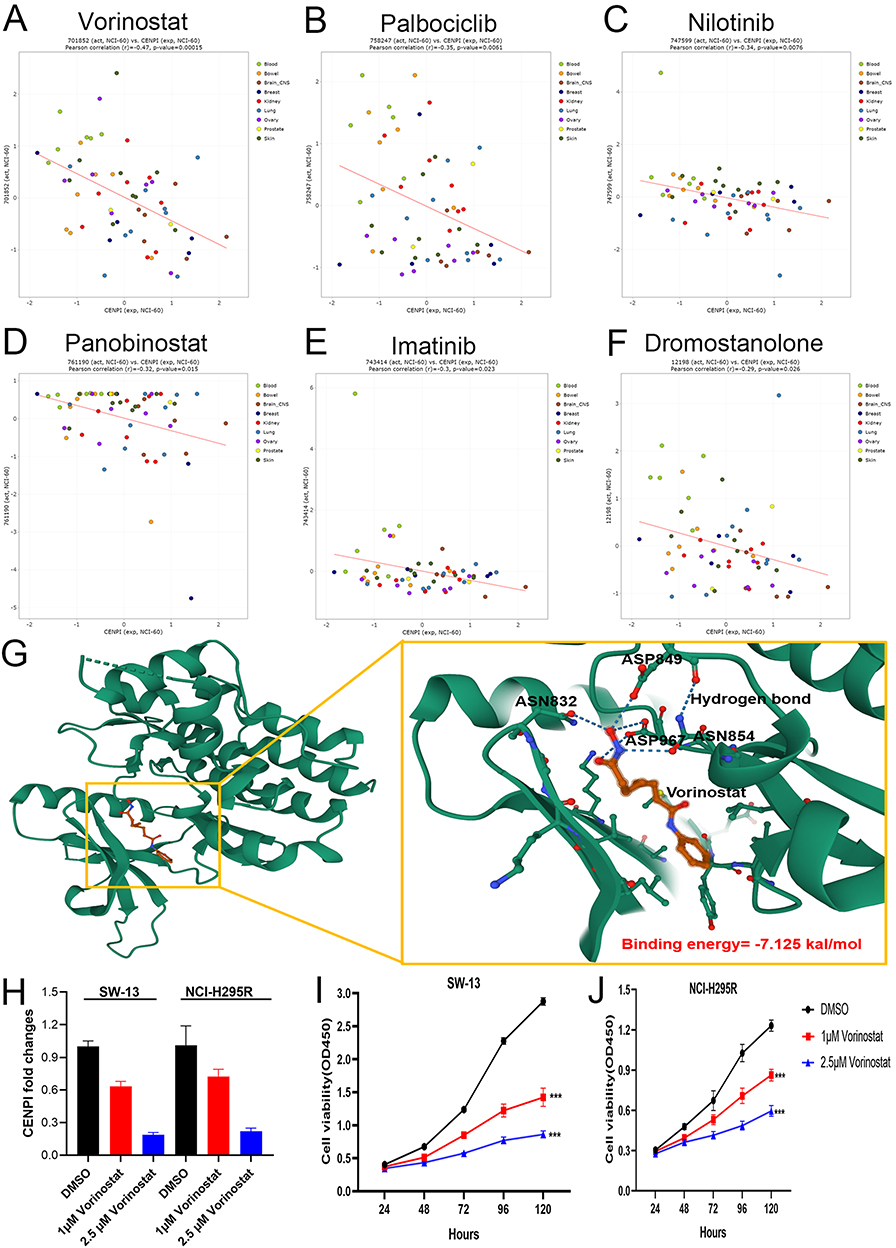 |
Figure 12 Vorinostat inhibits CENPI expression and cell growth of ACC cell lines. (A–F) Correlation between CENPI expression and FDA-approved drugs in various cancer cell lines; (G) Molecular docking analysis of CENPI and vorinostat; (H) Vorinostat inhibits CENPI expression of ACC cell lines; (I and J) Vorinostat inhibits cell growth of ACC cell lines. Data were shown as mean ±SD. (***p<0.001). |
CENPI Silencing Suppressed ACC Cell Malignant Behaviors
To explore CENPI’s biological role in ACC cell growth, CENPI was successfully silenced in SW-13 and NCI-H295R cells using two CENPI shRNA (Figure 13A). Thereafter, a CCK8 assay was carried out to evaluate the cell growth, and SW-13 and NCI-H295R showed a significant decline in cell growth after CENPI silencing (Figure 13B). Then, colony-formation assay was performed to verify CENPI’s adverse impact on ACC cell growth (Figure 13C). Also, the Transwell assay revealed that CENPI knockdown markedly reduced ACC cell migration (Figure 13D). AURKB was predicted as a interacting protein of CENPI, we hypothesized that AURKB inhibiton and CENPI depletion may have synergistic anti-cancer effect. To this end, the combination effectiveness of CENPI silencing and barasertib (a specific AURKB inhibitor) was calculated by using CompuSyn software. Results show that barasertib inhibited ACC cell growth (Figure 13E and F) and all combination indexes at indicated concentrations of siCENPI and barasertib were less than 1 in both SW-13 and NCI-H295R cells (Figure 13G and H), suggesting that CENPI silencing synergize with barasertib.
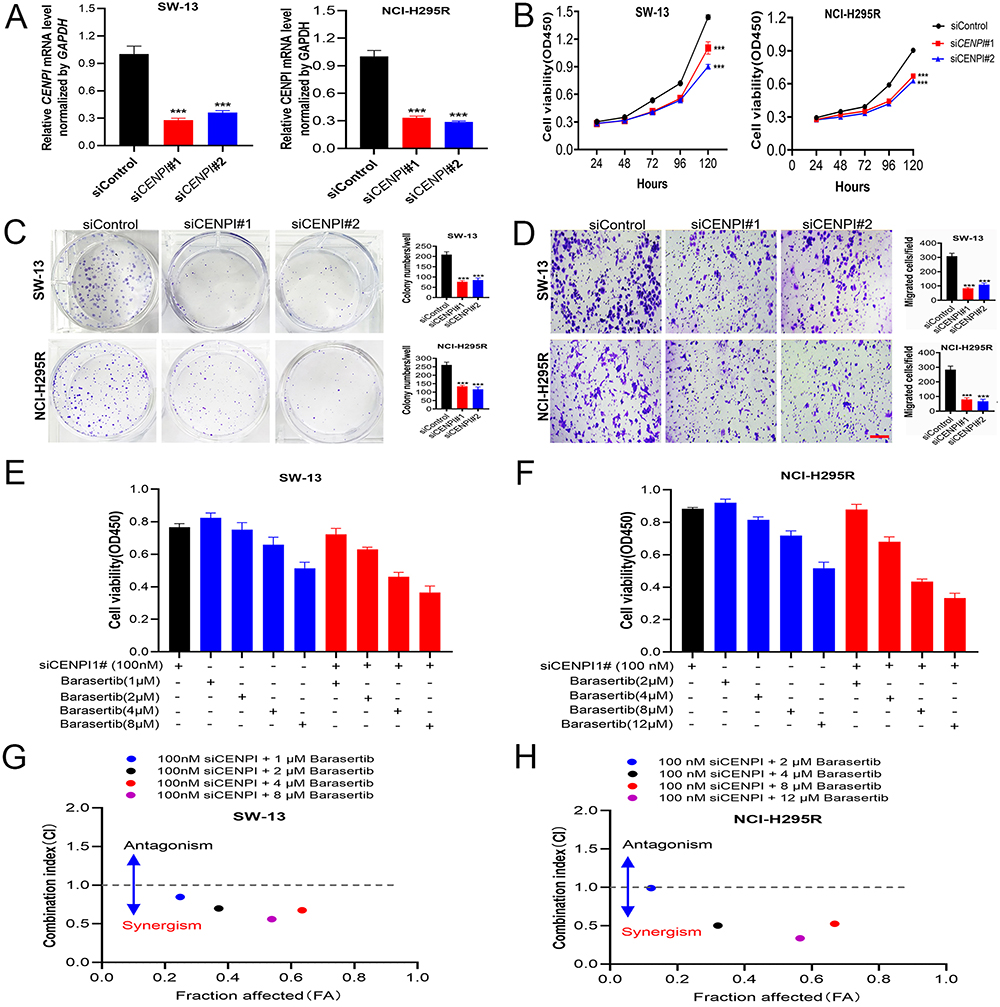 |
Figure 13 Knockdown of CENPI inhibited the proliferation and migration of ACC cells. (A) SW-13 and NCI-H295R cells were transfected with si-CENPI, and the level of CENPI was evaluated by qRT-PCR. (B and C) The proliferation of ACC cells was examined by (B) CCK-8 assay and (C) colony-formation assay. (D) The migration of ACC cells was examined by Transwell assay. (E and F) Cell viability in SW-13 and NCI-H295R cells treated with siRNA and/or barasertib at indicated concentrations. (G and H) The Chou-Talalay plot showing the combination effect of indicated treatments in SW-13 and NCI-H295R cells. CI values <1, =1, >1 indicate synergistic, additive, or antagonistic effects, respectively. Data were shown as mean ±SD. Images in D were taken at 10x objective, scale bar represent 50μm. (***p < 0.001). |
Discussion
CENPI belongs to the centromere protein family, which makes a vital effect on the formation of a tetrameric structure that contains CENPH, CENPI, CENPK, and CENPM proteins. Furthermore, it is important to generate microtubule attachments with high efficiency and correction.22 Some centromere protein family members have been shown to affect cancer occurrence and development. For example, CENPH is overexpressed in cancer cells and tissues related to malignancy grade and predicts the dismal prognostic outcome of different human cancers, containing hepatocellular carcinoma (HCC),23 renal cell carcinoma (RCC),24 GC,25 BC,26 lung cancer,27 esophageal carcinomas,28 nasopharyngeal carcinomas,29 oral squamous cell carcinoma,30 and CRC.31 CENPK is up-regulated in diverse cancer types, which predicts the dismal prognostic outcome of ovarian cancer,32 gastric cancer33 and cervical cancer.34 CENPM was also discovered to be significantly up-regulated and related to a poor prognosis in several cancers, containing hepatocellular carcinoma,35 pancreatic cancer,36 and lung adenocarcinoma.37
Recently, numerous studies have been conducted to determine CENPI’s function in cancer. As found by Kumar, CENPI mutations were detected in certain human cancers, like BC, lymphoid neoplasm, large intestine adenocarcinoma, SCC, and melanoma.9 Thangavelu et al reported that CENPI mRNA levels were markedly elevated, which predicted the dismal prognostic outcome of estrogen receptor-positive BC.10 According to Na Ding et al, CENPI expression significantly increased in CRC samples and was related to its different clinical stages. Moreover, CENPI inhibition demonstrated suppression of CRC cell invasion and migration together with EMT.12 Nonetheless, CENPI’s role in pan-cancer has not been analyzed yet.
This study assessed CENPI’s expression in pan-cancer, and data collected from the Depmap portal, GTEx, and TCGA databases disclosed that CENPI expression was remarkably increased in 28 cancer types, namely, ACC, BLCA, BRCA, CESC, CHOL, COAD, DLBC, ESCA, GBM, HNSC, KICH, KIRC, KIRP, LGG, LIHC, LUAD, LUSC, OV, PAAD, PRAD, READ, SKCM, STAD, TGCT, THCA, THYM, UCEC, and UCS. Hence, CENPI is possibly related to carcinogenesis in most cancer types as an oncogene.
Thereafter, to examine CENPI’s function in diagnosis and prognosis prediction, ROC and KM survival curves were plotted against pan-cancer. According to the results, the CENPI was partially accurate (AUC > 0.7) in the prediction of 16 cancers, in particular (AUC > 0.9) for BRCA, COAD, HNSC, LGG, LAML, LIHC, LUSC, LUAD, STAD, PAAD, UCEC, and UCS. Moreover, CENPI showed a significant relation to OS, DSS, as well as PFI of ACC, MESO, PAAD, SARC, and UCEC. Therefore, CENPI makes a vital impact on cancer diagnosis and prognosis prediction and could be a potential biomarker or antitumor therapeutic target in precision medicine. In order to further explore the bioactivity of CENPI, GO and KEGG analyses of the 50 major interacting proteins were performed. The BP terms mainly included nuclear division, organelle fission, mitotic sister chromatid segregation, mitotic nuclear division. The MF terms included tubulin binding, regulatory RNA binding, microtubule binding, histone kinase activity, and chemokine activity, while the cell cycle was the significantly enriched pathway.
In addition, the function of CENPI was preliminarily investigated in ACC. The result was that CENPI expression was significantly related to pathological stage, primary therapy outcome, N stage, M stage, residual tumor, new event, Weiss atypical mitotic figures, Weiss necrosis, and Weiss invasion of tumor capsule. In addition, upregulation of CENPI predicted poor OS, DSS, and PFI of clinical subsets of M stage (M0), N stage (N0), mitotane therapy (Yes), residual tumor (R0), tumor status (with tumor), and new event (Yes). Importantly, our results helped to complement and strengthen the function of CENPI in ACC. The relationships between CENPI level and various prognostic outcomes (OS, DSS, PFI) of different ACC subgroups were investigated. In this study, the CENPI co-expression genes were also recorded, of which the top 10 showing a positive relationship with CENPI were KIF14, CENPF, EXO1, CKAP2L, ANLN, DIAPH3, KIF23, KIF4A, MCM10, and BUB1B, whereas the 10 that showed a negative relationship with CENPI were MT-CO1, MT-ND3, MT-ATP6, MTCO3, MT-ND4, MT-CYB, MTRNR2L8, MT-CO2, MT-ATP8, and MT-ND5. In addition, DEGs were identified in groups with high and low CENPI expression in both GO and KEGG analysis. Our findings demonstrate that BP is enriched with terms such as chromosome segregation, nuclear division, and organelle fission. MF is enriched with terms such as cytokine activity, extracellular matrix component, and DNA helicase activity. We also selected hub genes from DEGs, such as BUB1B, KIF11, CCNB2, CENPE, KIF20A, CDC20, BUB1, CCNB1, KIF2C, and AURKB.
Immune cells have been shown to be involved in cancer development within the tumor microenvironment (TME).38 The tumor-infiltrated immune cells analyzed in ACC indicated that CENPI levels had a negative relation to cytotoxic cells, mast cells, CD8T cells, B cells, plasmacytoid dendritic cells, T cells, macrophages, Th17 cells, Th1 cells, and T follicular helper cells. This data indicated that CENPI is associated with the immune-suppressed tumor microenvironment in ACC.
To find potential drugs that can be repurposed in ACC treatment, CellMiner Cross Database was used to screen several FDA-approved drugs that were negatively associated with CENPI expression in various cancer cell lines. The most profound hit, vorinostat, a histone deacetylase (HDAC) inhibitor, inhibited CENPI expression and proliferation of the ACC cell lines. Moreover, as indicated by molecular docking analysis, vorinostat may also exert its activity on ACC cell by binding to CENPI. And hence, it deserves further investigation for ACC treatment.
On the basis of interacting protein and enrichment analysis, the biological activities of CENPI in ACC cells were investigated. In consistent with CENPI was predicted to be tightly related to the cell cycle and extracellular matrix structural constituent, CENPI silencing suppressed the growth, migration, and invasion in SW-13 and NCI-H295R ACC cells. Combinations of anti-cancer drugs is an effective strategy to overcome resistance and provide new treatments.39 We further select the predicted CENPI interacting protein AURKB for synergistic anti-cancer assay, as it is overexpressed in several types of cancers and inhibition of this kinase leads to mitotic catastrophe cell death.40 Consistent with previous studies, barasertib (a AURKB specific inhibitor) suppressed ACC cells growth. Our data also indicates the synergistic anti-cancer effect between CENPI depletion and AURKB inhibiton. Since AURKB showed synergistic interactions with CENPI in maintaining spindle checkpoint signal,41 their synergistic anti-proliferation effect may achieve by exaggerating the mitotic catastrophe of ACC cells.
Overall, identifying CENPI’s role in disease diagnosis and prognosis prediction in pan-cancer helps to comprehensively understand CENPI’s role in cancer progression. Moreover, the present study also evaluated CENPI’s biological activities and anti-cancer synergism in ACC cells, which provide potential therapeutic strategies for the application of CENPI inhibition/depletion in ACC treatment.
Data Sharing Statement
All the data in the current work can be acquired from corresponding authors upon request.
Ethical Statement
The present work gained approval from the Ethics Committee of Guangdong Second Provincial General Hospital.
Acknowledgments
The authors gratefully acknowledge the technical support from Meijiayouke Inc. in Wuhan.
Funding
The current study was funded by the Doctoral Workstation Foundation of Guangdong Second Provincial General Hospital (No. 2021BSGZ016, 2021BSGZ017, and 2020BSG-2048), Guangzhou Science and Technology Plan Project (No.202102020423, 202201020340 and 202201020485), Foundation of Guangdong Second Provincial General Hospital (No. 2021-KZ-008–01, 3D-B2020014 and TJGC-2021011), Natural Science Foundation of Guangdong Province (No. 2021A1515012329), Guangdong Basic and Applied Basic Research Foundation (No. 2021A1515110430), as well as Key Program for the National Natural Science Foundation of China (No. 82202034).
Disclosure
All author(s) claimed no competing interests.
References
1. Okada M, Cheeseman IM, Hori T, et al. The CENP-H-I complex is required for the efficient incorporation of newly synthesized CENP-A into centromeres. Nat Cell Biol. 2006;8(5):446–457. doi:10.1038/ncb1396
2. Cheeseman IM, Hori T, Fukagawa T, Desai A. KNL1 and the CENP-H/I/K complex coordinately direct kinetochore assembly in vertebrates. Mol Biol Cell. 2008;19(2):587–594. doi:10.1091/mbc.e07-10-1051
3. Matson DR, Demirel PB, Stukenberg PT, Burke DJ. A conserved role for COMA/CENP-H/I/N kinetochore proteins in the spindle checkpoint. Genes Dev. 2012;26(6):542–547. doi:10.1101/gad.184184.111
4. Kim S, Yu H. Multiple assembly mechanisms anchor the KMN spindle checkpoint platform at human mitotic kinetochores. J Cell Biol. 2015;208(2):181–196. doi:10.1083/jcb.201407074
5. Hamdouch K, Rodriguez C, Perez-Venegas J, et al. Anti-CENPI autoantibodies in scleroderma patients with features of autoimmune liver diseases. Clin Chim Acta. 2011;412(23–24):2267–2271. doi:10.1016/j.cca.2011.08.024
6. Chang D, Gao F, Slavney A, et al. Accounting for eXentricities: analysis of the X chromosome in GWAS reveals X-linked genes implicated in autoimmune diseases. PLoS One. 2014;9(12):e113684. doi:10.1371/journal.pone.0113684
7. Kumar A, Purohit R. Computational investigation of pathogenic nsSNPs in CEP63 protein. Gene. 2012;503(1):75–82. doi:10.1016/j.gene.2012.04.032
8. Barra V, Fachinetti D. The dark side of centromeres: types, causes and consequences of structural abnormalities implicating centromeric DNA. Nat Commun. 2018;9(1):4340. doi:10.1038/s41467-018-06545-y
9. Kumar A, Rajendran V, Sethumadhavan R, Purohit R. Identifying novel oncogenes: a machine learning approach. Interdiscip Sci. 2013;5(4):241–246. doi:10.1007/s12539-013-0151-3
10. Thangavelu PU, Lin CY, Vaidyanathan S, Nguyen THM, Dray E, Duijf PHG. Overexpression of the E2F target gene CENPI promotes chromosome instability and predicts poor prognosis in estrogen receptor-positive breast cancer. Oncotarget. 2017;8(37):62167–62182. doi:10.18632/oncotarget.19131
11. Wang LX, Chu HJ, Li N, Huang LY, Chen J, Chen J. Centromere protein I (CENP-I) is upregulated in gastric cancer, predicts poor prognosis, and promotes tumor cell proliferation and migration. Technol Cancer Res Treat. 2021;20:153303382110455. doi:10.1177/15330338211045510
12. Ding N, Li R, Shi W, He C. CENPI is overexpressed in colorectal cancer and regulates cell migration and invasion. Gene. 2018;674:80–86. doi:10.1016/j.gene.2018.06.067
13. Else T, Kim AC, Sabolch A, et al. Adrenocortical carcinoma. Endocr Rev. 2014;35(2):282–326. doi:10.1210/er.2013-1029
14. Giordano TJ, Kuick R, Else T, et al. Molecular classification and prognostication of adrenocortical tumors by transcriptome profiling. Clin Cancer Res. 2009;15(2):668–676. doi:10.1158/1078-0432.CCR-08-1067
15. de Reynies A, Assie G, Rickman DS, et al. Gene expression profiling reveals a new classification of adrenocortical tumors and identifies molecular predictors of malignancy and survival. J Clin Oncol. 2009;27(7):1108–1115. doi:10.1200/JCO.2008.18.5678
16. Lippert J, Appenzeller S, Liang R, et al. Targeted molecular analysis in adrenocortical carcinomas: a strategy toward improved personalized prognostication. J Clin Endocrinol Metab. 2018;103(12):4511–4523. doi:10.1210/jc.2018-01348
17. Li T, Fu J, Zeng Z, et al. TIMER2.0 for analysis of tumor-infiltrating immune cells. Nucleic Acids Res. 2020;48(W1):W509–W14. doi:10.1093/nar/gkaa407
18. Subramanian A, Tamayo P, Mootha VK, et al. Gene set enrichment analysis: a knowledge-based approach for interpreting genome-wide expression profiles. Proc Natl Acad Sci U S A. 2005;102(43):15545–15550. doi:10.1073/pnas.0506580102
19. Yu G, Wang LG, Han Y, He QY. clusterProfiler: an R package for comparing biological themes among gene clusters. OMICS. 2012;16(5):284–287. doi:10.1089/omi.2011.0118
20. Wang Y, Bryant SH, Cheng T, et al. PubChem BioAssay: 2017 update. Nucleic Acids Res. 2017;45(D1):D955–D63. doi:10.1093/nar/gkw1118
21. Morris GM, Huey R, Olson AJ. Using AutoDock for ligand-receptor docking. Curr Protoc Bioinformatics. 2008;24:8–14.
22. Basilico F, Maffini S, Weir JR, et al. The pseudo GTPase CENP-M drives human kinetochore assembly. Elife. 2014;3:e02978. doi:10.7554/eLife.02978
23. Lu G, Shan T, He S, et al. Overexpression of CENP-H as a novel prognostic biomarker for human hepatocellular carcinoma progression and patient survival. Oncol Rep. 2013;30(5):2238–2244. doi:10.3892/or.2013.2675
24. Wu X, Lin Y, Shi L, et al. Upregulation of centromere protein H is associated with progression of renal cell carcinoma. J Mol Histol. 2015;46(4–5):377–385. doi:10.1007/s10735-015-9635-2
25. He WL, Li YH, Yang DJ, et al. Combined evaluation of centromere protein H and Ki-67 as prognostic biomarker for patients with gastric carcinoma. Eur J Surg Oncol. 2013;39(2):141–149. doi:10.1016/j.ejso.2012.08.023
26. Liao WT, Feng Y, Li ML, et al. Overexpression of centromere protein H is significantly associated with breast cancer progression and overall patient survival. Chin J Cancer. 2011;30(9):627–637. doi:10.5732/cjc.010.10599
27. Liao WT, Wang X, Xu LH, et al. Centromere protein H is a novel prognostic marker for human nonsmall cell lung cancer progression and overall patient survival. Cancer. 2009;115(7):1507–1517. doi:10.1002/cncr.24128
28. Guo XZ, Zhang G, Wang JY, et al. Prognostic relevance of Centromere protein H expression in esophageal carcinoma. BMC Cancer. 2008;8:233. doi:10.1186/1471-2407-8-233
29. Liao WT, Song LB, Zhang HZ, et al. Centromere protein H is a novel prognostic marker for nasopharyngeal carcinoma progression and overall patient survival. Clin Cancer Res. 2007;13(2 Pt 1):508–514. doi:10.1158/1078-0432.CCR-06-1512
30. Shigeishi H, Higashikawa K, Ono S, et al. Increased expression of CENP-H gene in human oral squamous cell carcinomas harboring high-proliferative activity. Oncol Rep. 2006;16(5):1071–1075.
31. Tomonaga T, Matsushita K, Ishibashi M, et al. Centromere protein H is up-regulated in primary human colorectal cancer and its overexpression induces aneuploidy. Cancer Res. 2005;65(11):4683–4689. doi:10.1158/0008-5472.CAN-04-3613
32. Lee YC, Huang CC, Lin DY, Chang WC, Lee KH. Overexpression of centromere protein K (CENPK) in ovarian cancer is correlated with poor patient survival and associated with predictive and prognostic relevance. PeerJ. 2015;3:e1386. doi:10.7717/peerj.1386
33. Wu S, Cao L, Ke L, et al. Knockdown of CENPK inhibits cell growth and facilitates apoptosis via PTEN-PI3K-AKT signalling pathway in gastric cancer. J Cell Mol Med. 2021;25(18):8890–8903. doi:10.1111/jcmm.16850
34. Lin X, Wang F, Chen J, et al. N(6)-methyladenosine modification of CENPK mRNA by ZC3H13 promotes cervical cancer stemness and chemoresistance. Mil Med Res. 2022;9(1):19. doi:10.1186/s40779-022-00378-z
35. Xiao Y, Najeeb RM, Ma D, Yang K, Zhong Q, Liu Q. Upregulation of CENPM promotes hepatocarcinogenesis through multiple mechanisms. J Exp Clin Cancer Res. 2019;38(1):458. doi:10.1186/s13046-019-1444-0
36. Zheng C, Zhang T, Li D, et al. Upregulation of CENPM facilitates tumor metastasis via the mTOR/p70S6K signaling pathway in pancreatic cancer. Oncol Rep. 2020;44(3):1003–1012. doi:10.3892/or.2020.7673
37. Liu C, Wang Y, Dao Y, et al. Upregulation of CENPM facilitates lung adenocarcinoma progression via PI3K/AKT/mTOR signaling pathway. Acta Biochim Biophys Sin (Shanghai). 2022;54(1):99–112. doi:10.3724/abbs.2021013
38. Hinshaw DC, Shevde LA. The tumor microenvironment innately modulates cancer progression. Cancer Res. 2019;79(18):4557–4566. doi:10.1158/0008-5472.CAN-18-3962
39. Al-Lazikani B, Banerji U, Workman P. Combinatorial drug therapy for cancer in the post-genomic era. Nat Biotechnol. 2012;30(7):679–692. doi:10.1038/nbt.2284
40. Portella G, Passaro C, Chieffi P. Aurora B: a new prognostic marker and therapeutic target in cancer. Curr Med Chem. 2011;18(4):482–496. doi:10.2174/092986711794480203
41. Matson DR, Stukenberg PT. CENP-I and Aurora B act as a molecular switch that ties RZZ/Mad1 recruitment to kinetochore attachment status. J Cell Biol. 2014;205(4):541–554. doi:10.1083/jcb.201307137
 © 2023 The Author(s). This work is published and licensed by Dove Medical Press Limited. The full terms of this license are available at https://www.dovepress.com/terms.php and incorporate the Creative Commons Attribution - Non Commercial (unported, v3.0) License.
By accessing the work you hereby accept the Terms. Non-commercial uses of the work are permitted without any further permission from Dove Medical Press Limited, provided the work is properly attributed. For permission for commercial use of this work, please see paragraphs 4.2 and 5 of our Terms.
© 2023 The Author(s). This work is published and licensed by Dove Medical Press Limited. The full terms of this license are available at https://www.dovepress.com/terms.php and incorporate the Creative Commons Attribution - Non Commercial (unported, v3.0) License.
By accessing the work you hereby accept the Terms. Non-commercial uses of the work are permitted without any further permission from Dove Medical Press Limited, provided the work is properly attributed. For permission for commercial use of this work, please see paragraphs 4.2 and 5 of our Terms.